2011 Tennessee Traffic Safety Culture Survey
|
|
|
- Annis Holland
- 6 years ago
- Views:
Transcription


1 2011 Tennessee Traffic Safety Culture Survey UT Center for Transportation Research and The Center for Applied Research and Evaluation
2 Acknowledgements The authors would like to thank the Tennessee Governor s Highway Safety Office (GHSO), The Tennessee Department of Transportation (TDOT) and the National Highway Safety Administration (NHTSA) for funding and supporting this research. 2
3 Introduction Eleven thousand nine hundred and nine individuals (11,909) lost their lives because of traffic crashes on Tennessee roadways from 2000 through The encouraging news is that both the number of annual fatalities and the fatality rate have declined substantially in the state since However, the highway safety issues facing Tennessee are far from being resolved. In fact, in 2010 alone there were 46,578 injury crashes in Tennessee and there were 957 traffic fatalities during the same year. The Tennessee Governor s Highway Safety Office (GHSO), the Tennessee Department of Transportation, the Tennessee Department of Safety and their partners throughout the state have implemented a number of initiatives to understand and combat Tennessee s highway safety problems. The Tennessee Governor s Highway Safety Office has partnered with the UT Center for Transportation Research since 2004 to gather and evaluate Tennessean s attitudes and perceptions of various highway safety issues and their awareness of media campaigns. To date more than 40,000 Tennesseans have voluntarily completed these telephone surveys. Since 2006, data collection has been scheduled to coincide with major media buys throughout the year. The surveys are designed to provide the data needed to document exposure to the messaging utilized in large scale media campaigns. A number of different campaigns have been evaluated during this period however both the Booze It and Lose It and Click It or Ticket campaigns have been evaluated each year. A new survey was initiated through the UT GHSO partnership in the spring of 2011 designed to measure attitudes and opinions about traffic safety issues and driving habits in a more targeted manner than was possible with the previous surveys. The survey instrument was designed to assess the safety culture of Tennesseans. This survey was modeled after the third annual Traffic Safety Culture Index conducted by the AAA Foundation for Traffic Safety. The results of the survey are presented in this report. Though the Tennessee Safety Culture Survey is not an exact duplication of the Traffic Safety Culture Index, care was taken to ensure that when questions addressing the same topic were asked the wording was the same. The results and findings of this first Tennessee Traffic Safety Culture Survey are presented in this report. 3
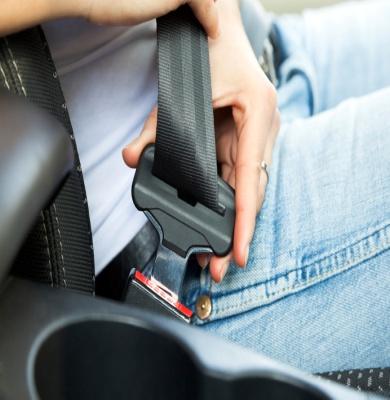
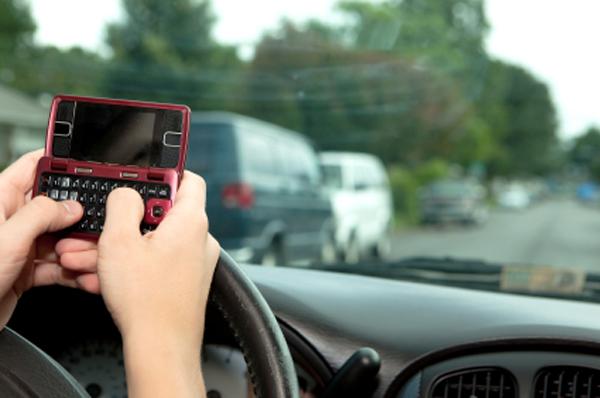
4 Summary of Findings A telephone survey of 928 Tennessee residents was conducted between February 1, 2011 and April 30, 2011 to measure attitudes and opinions regarding traffic safety issues and self- reported driving habits. Four out of ten drivers (42.1%) reported that driving feels less safe than five years ago. Distracted drivers i.e. those not paying attention and drivers using cell phones are cited as the leading causes for this perceived decline in safety. Two driving behaviors are considered to be equally as threatening to survey respondents personal safety. Texting/ ing while driving as well as drinking and driving were reported to be a severe threat to personal safety by 88.5% and 87.7% of the respondents, respectively. Tennessean s believe that others in their community are more accepting of risky driving behaviors than they are. For example 31% believe that their neighbors consider texting while driving either somewhat or completely acceptable however, when asked how they feel about this issue, only 5% of respondents personally considered it acceptable. Drinking and driving is almost universally recognized as unacceptable behavior and only 4 out 100 drivers indicate that they have driven after drinking too much alcohol in the past 30 days. There are inconsistencies between what respondents report as unacceptable behavior and their actual behavior, except for drinking and driving. For example, nine out 10 drivers find sending text messages or s while driving unacceptable and yet one out of five drivers report that they engaged in this behavior in the past 12 months. Traffic crashes are believed to be the leading cause of death by many Tennesseans. When presented with a list of five causes of death including heart disease, cancer, homicide, flu/pneumonia and traffic crashes, 43.1% of the respondents chose traffic crashes as the leading cause. There is widespread support for requiring drivers over the age of 75 to pass a screening for health problems that could affect their driving (82.7%) and for requiring these drivers to pass a behind the wheel driving test before renewing their driver s license (81.6%). There is overwhelming support for requiring teen drivers to complete a driver training program that teaches new drivers how to operate a vehicle on the road (93.7%) and to pass a classroom- based driver education course (90.8%) before receiving their driver s license. 4
5 Methods The Center for Transportation Research and the Center for Applied Research and Evaluation at the University of Tennessee conducted a telephone survey with 928 Tennessee residents to measure their attitudes and opinions about traffic safety issues as well as self- reported driving habits. A series of questions pertaining to teen drivers was added after data collection began therefore the sample size for this set of questions is 802. A stratified random sample was created so that results could be generalized to urban and rural areas of Tennessee. Independent random samples of telephone landlines were drawn for urban and rural areas. Telephone exchanges were selected based upon population distribution and the remaining digits were randomly generated based upon blocks of telephone numbers in use. Interviews were conducted between February 1, 2011 and April 30, Telephone interviewing was conducted during day and evening shifts and was conducted seven days a week in an effort to reduce non- response bias. Each telephone number was attempted up to five times until a final disposition could be assigned to the number. Efforts were made to include younger residents by implementing a script that inquired if anyone under the age of 25 and at least 16 years of age lived in the household. If a young adult lived in the household but was not available to complete the interview at that time, a callback was scheduled. Additional efforts were also made to include male participants by asking to speak to the youngest male in the household. If no male was available, the youngest female in the household was interviewed. A cell phone sample was not used for this project due to budget considerations. The survey instrument contained several batteries of questions for which the response categories were the same for each question within each battery. In an effort to reduce respondent burden and interview length, a subset of questions was randomly selected within each series thereby reducing the number of questions asked of each respondent. This protocol resulted in an inconsistent sample size for each question. Within the series that focused on the perceived threat of a number of driving habits, four of six questions were randomly selected to be asked. Two series of questions were developed to measure the acceptability of certain driving behaviors. Both series contained the same ten driving behaviors but one series focused on how acceptable respondents thought people who lived around them would find the behavior and the second series focused on how acceptable the respondent found the behavior to be. From the series of ten behaviors, six were randomly selected in the first series and these six questions were replicated in the second series to allow for a comparison to be drawn. A series of questions pertaining to teen drivers was added in the second week of data collection so the sample size is smaller for this set of questions. The response rate for the survey was 18.8% using the Response Rate 3 calculations provided by AAPOR and the cooperation rate was 34.2%. A weight was calculated for each record to adjust for selection bias and non- response bias. A post- stratification weight was assigned to match sample characteristics to population characteristics provided 5

6 by the U.S. Census Bureau s American Community Survey. Sample characteristics used for calculations of these weights were age, gender and race. All results reported and discussed in this report are based upon weighted data however the sample size reported for each question is the unweighted frequency. Results and Discussion Traffic Safety Tennessee residents recognize that traffic safety is an issue of concern for public and personal safety. This concern was expressed by survey respondents when they were provided with a list of five causes of death and asked to identify one they believed to be the leading cause of death each year in Tennessee. Overwhelmingly, traffic crashes were identified as the leading cause (43.1%) and flu or pneumonia were the least likely to be identified by respondents as the leading cause (.9%) as shown in Figure 1. These results are somewhat surprising since the Tennessee Department of Health reports heart disease is actually the leading cause of death in the state and at least six other causes are higher than traffic crashes when ranked. 100% Perceived Leading Cause of Death in Tennessee 80% 60% 43.1% 40% 27.0% 22.2% 20% 5.1% 0.9% 1.7% 0% Traffic Crashes Heart Disease Cancer Homicide Flu or Pneumonia Not Sure Figure 1 - Perceived Leading Cause of Death As a further indication of Tennesseans concern about traffic safety, survey respondents reported that driving feels less safe today than it did five years ago as shown in Figure 2. Approximately four out of 10 6
 and African Americans (58.3%) are more likely to report they feel less safe than males (36.1%) and Caucasians (40.0%).")
7 (42.1%) Tennesseans who have driven in the past 30 days reported that driving feels less safe. The decline is not, however, equally distributed between groups of individuals. For instance, women (48.1%) and African Americans (58.3%) are more likely to report they feel less safe than males (36.1%) and Caucasians (40.0%). Furthermore, those who live in urban areas with a population density over 500 people per square mile are more likely to report feeling less safe (46.7%) than their counterparts who live in less populated areas (40.1%). Perceived Driving Safety in Tennessee Compared to Five Years Ago 100% 80% 60% 45.3% 42.1% 40% 20% 9.7% 2.9% 0% Safer About the same Less safe Not sure Figure 2 - Perceived Changes in Driving Safety Distracted drivers and the activities that contribute to the distraction is a serious concern among Tennessee drivers. Respondents who reported that driving felt less safe than five years ago were given the opportunity to offer their reasons, without prompting, for this decline in driving safety. Drivers using cell phones was the reason most frequently mentioned first (21.0%) however distracted drivers or drivers not paying attention was overall the reason most frequently cited (32.7%). Traffic congestion or amount of traffic was the third reason given for the roads being less safe (23.5%). However, respondents who live in less populated areas (27.0%) were more likely to report that traffic congestion attributed to their decline in perceptions of safety than those who live in more heavily populated areas (17.5%). Another series of questions was included in the survey to determine how various driving habits influenced people s feelings of safety. Respondents who reported driving in the past 30 days were asked to indicate if these habits posed a threat to their personal safety and the severity of the threat. Figure 3 shows drivers who or text while driving (88.5%) and drivers who drank alcohol before driving (87.7%) were viewed as the most serious threats. Speeding well over the speed limit was perceived to be the least serious threat (52.2%) of the behaviors included in this series. 7

8 Serious Threats to Personal Safety 100% 88.5% 87.7% 80% 60% 62.3% 56.8% 55.0% 52.2% 40% 20% 0% Driving + texmng/ ing Drinking + driving Driving when sleepy Drivers talking on cell phones Driving aggresively Driving well over speed limit Figure 3 - Threats to Personal Safety Road and Traffic Safety Policy A wide range of solutions has been suggested by experts and government officials for improving road conditions and traffic safety. Respondents were presented with a number of policy options pertaining to driving restrictions and expenditure of public funds for road improvement and were asked to express their level of support for these policies. The highest levels of support were expressed for policy initiatives whose purpose is to curtail behaviors that respondents indicated were a serious threat to their personal safety. Of the policy options presented, the policy that received the highest level of support would require those drivers who have been convicted more than once for a DWI to use a device that would prevent their car from starting if they have been drinking. Virtually all respondents, 92.1%, either strongly or somewhat supported the use of a mechanism to prevent these drivers from getting behind the wheel. A policy that outlaws texting or ing while driving was supported by 85.2% of the respondents. This policy statement included specific language to prevent all drivers from texting and ing, regardless of age. Policies to increase the level of oversight on drivers over the age of 75 also received high levels of support. Requiring elderly drivers to pass a simple screening for health problems that could affect their driving and requiring drivers 75 and older to pass a behind the wheel driving test was supported by 82.7% and 81.6% of the respondents, respectively as seen in Figure 4. Other proposed initiatives to further restrict older drivers did not resonate as well with the survey participants. Several policies to limit elderly drivers to daytime driving, to limit the number of miles away from that could be driven and to limit routes and destinations was supported by less than one- third of the survey sample. 8

9 Support for Restric?ons on Drivers Over % 82.7% 81.6% 80% 69.9% 60% 40% 36.8% 32.7% 27.7% 23.5% 20% 0% Screen for health problems Pass a "behind the wheel" driving test State evaluate and assess each driver RestricMng all drivers to day Mme driving Placing driving restricmons on all drivers LimiMng the number of miles driven away from home LimiMng drivers to specific routes or desmnamons Figure 4 - Restriction on Older Drivers Attitudes and Behavior Cell phone use and text messaging Cell phone ownership has risen dramatically in the past ten years and currently 82% of adults in the United States report owning a cell phone (Pew Research Center s Internet & American Life Project, 2010). The rise in cell phone ownership and usage has triggered concern about how it affects driving habits and traffic safety. As indicated earlier in the report, Tennesseans indicate that sending text messages and s while driving is as much of a threat to their personal safety as someone who drives after drinking too much alcohol. While driving and using the cell phone to text and is seen as an unacceptable behavior, respondents report less concern for drivers using cell phones in general. Figure 5 shows there is almost universal agreement that sending text messages or ing on a cell phone while driving is unacceptable. More than nine out of 10 drivers (94.2%) report they find this type of behavior as unacceptable. However, when talking on a cell phone using a hands free device, only four out of 10 drivers (40.7%) report similar concern. 9

.")
10 Unacceptability of Cell Phone Use While Driving 94.2% 100% 80% 58.2% 60% 40.7% 40% 20% 0% Send text messages or s Talk on a hand- held cell phone Talk on a hands- free cell phone Figure 5 - Unacceptability of Cell Phone use The level of concern for the differing use and style of cell phone is consistent with driving habits. Far fewer drivers, 27.1%, report they have sent a text or while they were driving in the past 30 days compared to those who report talking on a cell phone while driving (72.9%). When asked to report the type of cell phone used to talk, almost two thirds of drivers (62.7%) as shown in Figure 6, used a hand- held cell phone even though they believe talking on a hand- free cell phone is more acceptable than using a hand- held phone. This inconsistency between attitude and behavior is also reflected in drivers support for legislation to ban the use of hand- held cell phones as mentioned previously. Type of Cell Phone Used While Driving 100% 80% 62.7% 60% 31.7% 40% 20% 0% Hand- held Hands- free Both 5.6% Figure 6 - Cell Phones Usage by Type 10
11 Drinking and Driving Drinking and driving is widely recognized as a serious threat to personal safety and is almost universally believed to be unacceptable. Drinking and driving, as discussed earlier in the report, is viewed as one of the two most serious threats to personal safety and there is widespread support for adopting measures to reduce this behavior. Virtually all drivers find drinking and driving unacceptable (96.9%) and almost eight out of 10 drivers (78.2%) believe their neighbors feel similarly. Furthermore, very few drivers (4.1%) indicate that they have driven when they may have too much to drink in the past 30 days. This level of consistency between attitude and behavior is the highest of any behavior addressed in this survey. Speeding Driving over the speed limit, in general, is widespread and is not perceived to pose as serious of a threat to personal safety as other driving behaviors. About half of the drivers (52.2%) report driving over the speed limit as a very serious threat. However, drivers perception of the hazards of speeding is dependent upon the location of the offense. Respondents are more likely to find speeding on freeways more acceptable than speeding in residential areas. More than nine out 10 drivers (93.7%) find it unacceptable to drive more than 15 miles per hour over the speed limit in a residential area whereas only seven out of 10 drivers (70.9%) believe it to be unacceptable to drive the same amount over the speed limit on a freeway. Drivers believe their neighbors also make this distinction with 75.4% reporting their neighbors would find speeding in residential areas unacceptable whereas 43.9% think their neighbors would find speeding on freeways as unacceptable. This distinction between speeding in residential areas and freeways is also consistent with reported driving habits. Four out of 10 drivers (40.6%) have driven more than 15 mph over the speed limit on freeways whereas less than one quarter of drivers (22.5%) indicate that they have driven more than 15 mph over the speed limit in a residential area in the past 30 days. Running red light Almost all drivers (95.3%) find it unacceptable for drivers to run a red light when they could have safely stopped. Seven out of 10 (70.4%) also believe that their neighbors would find this behavior unacceptable. Regardless of this almost universal feeling that the behavior is unacceptable, nearly one third of drivers (29.1%) report that they have run a red light themselves at least once in the past 30 days. Drowsy driving Driving while drowsy is viewed as more of a serious threat to personal safety than aggressive or speeding drivers. Other people driving when they are too sleepy is viewed as a very serious threat to their own personal safety by approximately six out of 10 drivers (62.3%) whereas a little more than half report aggressive drivers (55.0%) and driving well over the speed limit (52.2%) as a very serious threat. Virtually all Tennessee drivers find it unacceptable for drivers to get behind the wheel when they are extremely drowsy. More than nine out of 10 drivers (94.3%) view driving when they are drowsy as unacceptable and nearly 75% of drivers believe that those who live around them also find this behavior 11
12 unacceptable. Drivers find this behavior to be almost as unacceptable as driving after having too much to drink. Despite the recognition that driving while drowsy is unacceptable and is a serious threat to personal safety, nearly one quarter (24.7%) report that they have driven when they had a difficult time keeping their eyes open at least once in the past 30 days. Seatbelt use Driving without wearing a seatbelt is not a prevalent practice in Tennessee and is commonly believed to be unacceptable. Over seven out of 10 (75.7%) drivers in Tennessee report they never drive without wearing a seatbelt which can be interpreted to mean that they always wear a seatbelt when they are driving and only four in 100 drivers report that they always drive while not wearing one seatbelt. However, there are three categories of respondents who report that they are less likely than others to drive without wearing a seatbelt (i.e. they drive while not wearing a seatbelt more often than the average) male drivers (70.7%) drivers under the age of 40 (69.3%) and respondents who live in areas with a population of less than 500 people per square mile (73.2%) There is some inconsistency between reported behavior and beliefs about the acceptability of the behavior. Nearly nine out of 10 drivers (87.7%) say it is unacceptable for a driver to not wear a seatbelt while driving, but only three out of four report that they never engage in the behavior they find unacceptable. Respondents also believe themselves to be less tolerant of driving without a seatbelt than those who live around them since only six in 10 (63.2%) believe their neighbors are more accepting of those who drive while not wearing a seatbelt. Teen Drivers Teen drivers between the ages of 16 and 19 are more likely to be involved in a motor vehicle crash than any other age group. According to research conducted by the Insurance Institute for Highway Safety, teen drivers are four times more likely than older drivers to crash per mile driven. Teen crashes can be attributed to their inexperience and lack of skills to properly estimate dangerous or recognize hazardous situations (Teen Drivers: Fact Sheet). It is widely recognized in Tennessee that young drivers do not receive adequate preparation to safely operate a motor vehicle and that crash rates among this age group are higher than other groups. Approximately two- thirds of survey participants indicated they either strongly or somewhat disagree that most new teenage drivers are well prepared to operate an automobile independently (67.7%) and suffer a higher crash rate than those who have at least two years of driving experience (66.3%). Driver education classes have been offered as one solution for improving the driving skill set possessed by teen drivers. There is overwhelming support for requiring teen drivers to complete a classroom- based driver education course (90.8%) or a driver training course where they learn to drive a vehicle on the road (93.7%). There is a lack of consensus regarding who should be responsible for providing these 12
 for enacting a law that requires high schools to offer driver education courses for their students.")
13 courses when asked if parents or schools should be responsible for providing the training. However, there is almost universal support (91.6%) for enacting a law that requires high schools to offer driver education courses for their students. It is important to note however, that the question posed to survey respondents did not distinguish between classroom- based or driver- based courses, and was asked after the question to assign responsibility for offering these types of courses. Responsibility for Training Teen Drivers 100% 80% 60% 40% 20% 0% 44.8% 39.6% 24.6% 25.9% 14.6% 16.7% 14.0% 15.9% Parents School Gov't Parents & School Classroom On Road Figure 7 - Who should be Responsible for Teen Driver Training Conclusion Traffic safety is of great concern for Tennessee residents. Despite the fact that the number of fatalities and the fatality rates have dropped in the last five years, almost half of the survey respondents feel driving is less safe than it was five years ago. Although traffic crashes are the sixth or seventh leading cause of death in most years, they are believed to be the leading cause of death by many Tennesseans contributing to more deaths than either heart disease or cancer each year. Distracted drivers and drivers using cell phones while driving appear to be key contributors to this perceived decline in safety. Ironically about 60% of drivers report that they continue to use cell phones when they drive. This disconnect between recognition that certain driving behaviors are unsafe or unacceptable but continuing to engage in these behaviors extends beyond cell phone use to speeding and drowsy driving. The reasons for this lack of alignment between beliefs and behaviors are not fully understood. With regard to highway safety the Tennessee driving culture can be characterized as do as I say, and not as I do on many issues. However, there is hope for improvement. Currently there is a very strong belief that drinking and driving is unacceptable and very few people report that they drink and drive. This has not always been the case in Tennessee. The highway safety community has, over time with a great investment of resources, made substantial strides in changing perceptions and behavior with regard to drinking and driving. Thus it is probable that with a committed effort similar results could be attained for other highway safety culture issues. 13
14 References Phones- and- American- Adults/Part- 1- Adults- and- cell- phones- Ownership- and- use/cell- ownership- in- the- United- States- remains- steady- since aspx
15 Appendices 15
2011 Traffic Safety Culture Index
 Car crashes rank among the leading causes of death in the United States. 2011 Traffic Safety Culture Index January 2012 607 14th Street, NW, Suite 201 Washington, DC 20005 AAAFoundation.org 202-638-5944
2017 Traffic Safety Culture Index
 2017 Traffic Safety Culture Index March 2018 607 14th Street, NW, Suite 201 Washington, DC 20005 202-638-5944 Title 2017 Traffic Safety Culture Index Authors AAA Foundation for Traffic Safety 2018, AAA
2010 Traffic Safety Culture Index
 Car crashes rank among the leading causes of death in the United States. 2010 Traffic Safety Culture Index October, 2010 607 14th Street, NW, Suite 201 Washington, DC 20005 AAAFoundation.org 202-638-5944
2013 Traffic Safety Culture Index
 Car crashes rank among the leading causes of death in the United States. 2013 Traffic Safety Culture Index January 2014 607 14th Street, NW, Suite 201 Washington, DC 20005 AAAFoundation.org 202-638-5944
American Driving Survey,
 RESEARCH BRIEF American Driving Survey, 2015 2016 This Research Brief provides highlights from the AAA Foundation for Traffic Safety s 2016 American Driving Survey, which quantifies the daily driving patterns
Who has trouble reporting prior day events?
 Vol. 10, Issue 1, 2017 Who has trouble reporting prior day events? Tim Triplett 1, Rob Santos 2, Brian Tefft 3 Survey Practice 10.29115/SP-2017-0003 Jan 01, 2017 Tags: missing data, recall data, measurement
Research. Driving Safety Culture Survey 2017
 Research Driving Safety Culture Survey 2017 Contents Introduction... 3 Objectives... 4 Executive Summary... 5 Methodology... 6 Main findings...7 Q1. Please tell us how much of a problem each of the issues
Nebraska Teen Driving Experiences Survey Four-Year Trend Report
 Nebraska Teen Driving Experiences Survey Four-Year Trend Report 2014-2015, 2015-2016, and 2017-2018 School Years April 2018 Division of Public Health Injury Prevention Program Table of Contents Executive
#1Motor vehicle. crashes are the leading cause of death for American teens.
 #1Motor vehicle crashes are the leading cause of death for American teens. In 2015, 2,333 teens (that s 6 per day) were killed in car accidents and another 221,313 were treated in emergency departments
SEGMENT 2 DRIVER EDUCATION Risk Awareness
 Fact Sheet 1 Why Should Young Drivers Be Concerned? Risk is the chance of death, injury, damage, or loss. Approximately 1 out of 11 (9%) of 16-year-old drivers will have a serious crash before his/her
Produced by: Working in partnership with: Brake. the road safety charity
 1 Direct Line & Brake Reports on Safe Driving 2013-2014 REPORT ONE Are you ready to drive Produced by: Brake the road safety charity Working in partnership with: INTRODUCTION Julie Townsend, Brake s deputy
NHTSA / ANSTSE. Traffic Safety for Teen Drivers Presenter:
 NHTSA / ANSTSE Traffic Safety for Teen Drivers Presenter: Presentation Topics NHTSA s Support for Driver Education The Stakeholder Association - ANSTSE Young Motor Vehicle Crashes NHTSA Initiatives Vermont
Public attitudes to road safety
 Public attitudes to road safety Highlights of the survey Prepared by the Research & Statistics section of the Land Transport Safety Authority. 3 4 Fieldwork conducted for the LTSA by National Research
Traffic Safety Facts
 Part 1: Read Sources Source 1: Informational Article 2008 Data Traffic Safety Facts As you read Analyze the data presented in the articles. Look for evidence that supports your position on the dangers
Seat Belt Survey. Q1. When travelling in a car, do you wear your seat belt all of the time, most of the time, some of the time, or never?
 N F O C F g r o u p Seat Belt Survey Q1. When travelling in a car, do you wear your seat belt all of the time, most of the time, some of the time, or never? The majority of Canadians (85%) wear their seat
Statistics and Facts About Distracted Driving
 Untitled Document Statistics and Facts About Distracted Driving What does it mean to be a distracted driver? Are you one? Learn more here. What Is Distracted Driving? There are three main types of distraction:
ROAD SAFETY MONITOR 2014: KNOWLEDGE OF VEHICLE SAFETY FEATURES IN CANADA. The knowledge source for safe driving
 T R A F F I C I N J U R Y R E S E A R C H F O U N D A T I O N ROAD SAFETY MONITOR 2014: KNOWLEDGE OF VEHICLE SAFETY FEATURES IN CANADA The knowledge source for safe driving TRAFFIC INJURY RESEARCH FOUNDATION
Rates of Motor Vehicle Crashes, Injuries, and Deaths in Relation to Driver Age, United States,
 RESEARCH BRIEF This Research Brief provides updated statistics on rates of crashes, injuries and death per mile driven in relation to driver age based on the most recent data available, from 2014-2015.
Abstract. 1. Introduction. 1.1 object. Road safety data: collection and analysis for target setting and monitoring performances and progress
 Road Traffic Accident Involvement Rate by Accident and Violation Records: New Methodology for Driver Education Based on Integrated Road Traffic Accident Database Yasushi Nishida National Research Institute
DOT HS April 2013
 TRAFFIC SAFETY FACTS 2011 Data DOT HS 811 753 April 2013 Overview Motor vehicle travel is the primary means of transportation in the United States, providing an unprecedented degree of mobility. Yet for
Transportation Issues Poll New York City Speed Safety Cameras in School Zones
 2016-17 Transportation Issues Poll New York City Speed Safety Cameras in School Zones Summary Near universal support for more speed safety cameras. New Yorker City voters overwhelmingly support more speed
Understanding Traffic Data: How To Avoid Making the Wrong Turn
 Traffic Records Forum 2011 Understanding Traffic Data: How To Avoid Making the Wrong Turn Presenter: Marc Starnes (202) 366-2186 marc.starnes@dot.gov August 3rd, 2011 1 Summary of Topics Police Crash Reports
TRAFFIC SAFETY FACTS. Overview Data
 TRAFFIC SAFETY FACTS 2009 Data Overview Motor vehicle travel is the primary means of transportation in the United States, providing an unprecedented degree of mobility. Yet for all its advantages, injuries
INJURY PREVENTION POLICY ANALYSIS
 INJURY PREVENTION POLICY ANALYSIS Graduated Driver Licensing for Passenger Vehicles in Atlantic Canada Introduction Motor vehicle collisions (MVC) are a leading cause of death for young Atlantic Canadians.
Statement before the Maryland House Committee on Environmental Matters. Passenger Restrictions for Young Drivers. Stephen L. Oesch
 Statement before the Maryland House Committee on Environmental Matters Passenger Restrictions for Young Drivers Stephen L. Oesch The Insurance Institute for Highway Safety is a nonprofit research and communications
Shedding light on the nighttime driving risk
 Shedding on the nighttime driving risk An analysis of fatal crashes under dark conditions in the U.S., 1999-2008 Russell Henk, P.E., Senior Research Engineer Val Pezoldt, Research Scientist Bernie Fette,
Florida Strategic Highway Safety Planning Florida Strategic Highway Safety Plan (SHSP) Update and Performance Overview
 Update and Performance Overview") Session 1 Florida Strategic Highway Safety Planning Florida Strategic Highway Safety Plan (SHSP) Update and Performance Overview Joe Santos, PE, FDOT, State Safety Office October, 23, 2013 Florida Statistics
Session 1 Florida Strategic Highway Safety Planning Florida Strategic Highway Safety Plan (SHSP) Update and Performance Overview Joe Santos, PE, FDOT, State Safety Office October, 23, 2013 Florida Statistics
Where are the Increases in Motorcycle Rider Fatalities?
 Where are the Increases in Motorcycle Rider Fatalities? Umesh Shankar Mathematical Analysis Division (NPO-121) Office of Traffic Records and Analysis National Center for Statistics and Analysis National
Road Safety. Background Information. Motor Vehicle Collisions
 Background Information Motor Vehicle Collisions For many Canadians, the riskiest part of their job is their time spent on the road driving. Motor vehicle collisions are the leading cause of injury and
AAA ON THE ISSUES
 AAA ON THE ISSUES 2 0 1 7 TABLE OF CONTENTS Introduction Safety on Our Roadways Distracted Driving Child Passenger Safety Legalization of Marijuana Teen Driving Senior Mobility Transportation Funding Automotive
Denver Car Share Program 2017 Program Summary
 Denver Car Share Program 2017 Program Summary Prepared for: Prepared by: Project Manager: Malinda Reese, PE Apex Design Reference No. P170271, Task Order #3 January 2018 Table of Contents 1. Introduction...
Where are we heading? Paths to mobility of tomorrow The 2018 Continental Mobility Study
 Bitte decken Sie die schraffierte Fläche mit einem Bild ab. Please cover the shaded area with a picture. (24,4 x 7,6 cm) Where are we heading? Paths to mobility of tomorrow The 2018 Continental Mobility
American Driving Survey: Methodology and Year One Results, May 2013 May Saving lives through research and education.
 Saving lives through research and education American Driving Survey: Methodology and Year One Results, May 2013 May 2014 April 2015 607 14th Street, NW, Suite 201 Washington, DC 20005 AAAFoundation.org
AAA ON THE ISSUES
 AAA ON THE ISSUES 2 0 1 7 TABLE OF CONTENTS Introduction Safety on Our Roadways Seat Belt Use Distracted Driving Cell Phone Use Drunk Driving Ignition Interlock Teen Driving Online Driver Education Nighttime
2018 Automotive Fuel Economy Survey Report
 2018 Automotive Fuel Economy Survey Report The Consumer Reports Survey Team conducted a nationally representative survey in May 2018 to assess American adults attitudes and viewpoints on vehicle fuel economy.
GRADUATED LICENSING. KITCHEN TABLE DISCUSSION GUIDE Have your say on Your PLates reforms
 YOUR GRADUATED LICENSING KITCHEN TABLE DISCUSSION GUIDE Have your say on Your PLates reforms Justice and Community Safety Directorate April - May 2018 INTRODUCTION Thank you for your interest in how we
COMMUNITY ENGAGEMENT STRATEGIES
 COMMUNITY ENGAGEMENT STRATEGIES for Teen Driver Safety Parent Awareness Programs Chief Steve Mortenson Elko New Market Police Department Trooper Joe Dellwo Minnesota State Patrol Gordy Pehrson DPS Office
The U.S. Auto Industry, Washington and New Priorities:
 The U.S. Auto Industry, Washington and New Priorities: What Americans Think Produced for Civil Society Institute Prepared by November 20, 2006 Copyright 2006. Opinion Research Corporation. All rights reserved.
Key Findings General Public and Traffic Police Surveys
 General Public and Traffic Police Surveys Tanzania Population: 50 million Demographics: 64% of population under 24 Dar es Salaam population growth: 4.39% (3rd fastest in Africa, 9th fastest globally) Surveys
Europeans and responsible driving 2017
 1 Europeans and responsible driving Technical specifications SAMPLE 12,429 individuals aged 15 years and over, including at least 1000 individuals in each of the surveyed countries SURVEY DATE From 11
Impaired Driving and Ignition Interlocks
 Impaired Driving and Ignition Interlocks Division of Public Health Injury and Violence Prevention Branch March 7, 2018 Overview Alcohol-Impaired Driving Data Research and Recommendations North Carolina
An Evaluation of the Relationship between the Seat Belt Usage Rates of Front Seat Occupants and Their Drivers
 An Evaluation of the Relationship between the Seat Belt Usage Rates of Front Seat Occupants and Their Drivers Vinod Vasudevan Transportation Research Center University of Nevada, Las Vegas 4505 S. Maryland
Keeping your new driver safe.
 Keeping your new driver safe. You re going to have a new young driver in the family! Reaching driving age is a major milestone for young people and for their parents too. A new driver s licence opens up
Toward zero deaths: Who needs to do the heavy lifting?
 Toward zero deaths: Who needs to do the heavy lifting? (Motorcycle Crash Trend in Florida) Chanyoung Lee, Ph.D. Center for Urban Transportation Research University of South Florida Unprecedented Degree
RITS: Driver Attitudes and Behaviour Tracking. Summary November 2013 TNS
 RITS: Driver Attitudes and Behaviour Tracking Summary November 2013 Contents 1 Background and method 3 2 Driver behaviour 6 3 Penalties 10 4 Driver attitudes 17 1 Background and method Background and objectives
Course Syllabus. Time Requirements. Course Timeline. Grading Policy. Contact Information Online classroom Instructor: Kyle Boots
 Course Syllabus Course Overview This course is designed to meet the classroom requirement of your driver s education experience. It is approved by the State of Indiana. Time Requirements The State of Indiana
Produced by: Working in partnership with: Brake. the road safety charity
 1 Direct Line & Brake Reports on Safe Driving 2015-2017 REPORT ONE Produced by: Brake the road safety charity Working in partnership with: INTRODUCTION Julie Townsend, Brake s deputy chief executive, says:
Brain on Board: From safety features to driverless cars
 Brain on Board: From safety features to driverless cars Robyn Robertson, M.C.A. President & CEO Traffic Injury Research Foundation 18 th Annual Not By Accident Conference. London, ON, October 18 th, 2016
Alcohol interlocks in Finland. 22 April 2015, Lisbon
 ETSC Safe & Sober Alcohol interlocks and the fight against drink-driving Alcohol interlocks in Finland 22 April 2015, Lisbon Marita Löytty, Special Adviser Responsible traffic. A joint effort. Content
I-95 Corridor-wide safety data analysis and identification of existing successful safety programs. Traffic Injury Research Foundation April 22, 2010
 I-95 Corridor-wide safety data analysis and identification of existing successful safety programs Traffic Injury Research Foundation April 22, 2010 Overview Background Methodology Purpose Crash analysis
I.11Tc1ER.S Eagleton nstitute PoIitcs New Bruriswck Ne s Jersey : C[Lic 4ar-ICbgCr/EAGLETON POLL
 Other newspapers may also use this information in their Sunday and back-ground memo will appear in Sunday s Star-Ledger. A story based on the survey findings presented in this release RELEASE INFORMATION
Traffic Research & Data Center
 Traffic Research & Data Center Traffic Safety Commission, 1000 S. Cherry St., Olympia 98504 SAFETY BELT USE RATES I A PRIMARY LAW STATE COMPARED TO A EIGHBORIG SECODARY LAW STATE Philip M. Salzberg and
SAFE COMMUNITIES SURVEY RESULTS 2000
 SAFE COMMUNITIES SURVEY RESULTS 2000 SUBSAMPLE: FIRE DEPARTMENT EMPLOYEES Provided to the Corpus Christi Fire Department Kristen M. Machac, Research Assistant Philip W. Rhoades, Ph.D. August 15, 2001 ADMINISTRATION
Occupational Driving Consider the Risks. Sandra Wilson, OSACH
 Occupational Driving Consider the Risks Sandra Wilson, OSACH Session Outline Who is driving for work purposes? What are the risks factors? How can I minimize these risks? 2 What do you think? True or false:
Only video reveals the hidden dangers of speeding.
 Only video reveals the hidden dangers of speeding. SNAPSHOT FOR TRUCKING April 2018 SmartDrive Smart IQ Beat Snapshots provide in-depth analysis and metrics of top fleet performance trends based on the
Objectives. Understand defensive driving techniques. Increase awareness of safe driving behaviors
 Defensive Driving Objectives Understand defensive driving techniques Increase awareness of safe driving behaviors Provide insight into identifying and anticipating hazards encountered while driving Why
AAA ON THE ISSUES
 AAA ON THE ISSUES 2 0 1 7 TABLE OF CONTENTS Introduction Safety on Our Roadways Occupant Protection Child Passenger Safety Senior Mobility Teen Driving Motorcycle Helmets Recreational Marijuana Transportation
DEFENSIVE DRIVING COMMUNITY SERVICES FOR THE DEVELOPMENTALLY DISABLED
 DEFENSIVE DRIVING COMMUNITY SERVICES FOR THE DEVELOPMENTALLY DISABLED WHAT DOES IT MEAN TO DRIVE DEFENSIVELY? Defensive driving is a technique you can apply while operating your own or an agency vehicle,
Target Zero: Underutilized Strategies in Traffic Safety That Work
 Target Zero: Underutilized Strategies in Traffic Safety That Work James C. Fell National Opinion Research Center (NORC) at the University of Chicago, Bethesda, MD Office The Problem In 2015, 35,092 people
Enhancing School Bus Safety and Pupil Transportation Safety
 For Release on August 26, 2002 (9:00 am EDST) Enhancing School Bus Safety and Pupil Transportation Safety School bus safety and pupil transportation safety involve two similar, but different, concepts.
19 May 2015, Luxembourg
 Implementation and evaluation of the alcohol interlock programme in Finland 19 May 2015, Luxembourg Marita Löytty, Special Adviser Responsible traffic. A joint effort. Content 1. Finland: facts and number
A R T I C L E S E R I E S
 Comprehensive Safety Analysis Initiative A R T I C L E S E R I E S BASIC 1: UNSAFE DRIVING Staying on top of safety and compliance under the CSA 2010 initiative will mean getting back to the BASICs. This
Young Researchers Seminar 2009
 Young Researchers Seminar 2009 Torino, Italy, 3 to 5 June 2009 Car drivers perceptions of Electronic Stability Control (ESC) and Anti-lock Braking Systems (ABS) Background In Europe, about 40 000 people
Close Read. Number of Drivers. Unit 1: Argumentative Essay 23
 Graph Driver Fatalities and Drivers Involved in Fatal Crashes Among 15- to 20- Year Old Drivers, 1998 2008 Number of Drivers Driver Fatalities Drivers Involved 10000 8000 6000 4000 2000 0 1998 1999 2000
Safety and Preventitive Cautions for Teenage Drivers
 Safety and Preventitive Cautions for Teenage Drivers 1. Review the basic safety rules of driving 2. Learn and comprehend the safety issues involved in driving 3. Understand what factors affect safe driving
Seat belts for adults in the back seat: what do Iowans think?
 Seat belts for adults in the back seat: what do Iowans think? Michelle Reyes Dan McGehee Dawn Marshall Iowa Governor s Highway Traffic Safety Conference April 26, 2016 Corinne Peek-Asa John Lundell Erik
STATE OF MAINE. Motor Vehicle Permittee's Driving Log For persons under 21 years of age. A message from:
 STATE OF MAINE Motor Vehicle Permittee's Driving Log For persons under 21 years of age A message from: Charles E. Summers, Jr. Secretary of State Dear Applicant: As a future driver in Maine, you are important
Improving Rural Road Safety. National Conference of State Legislatures NCSL 2010 Legislative Summit Transportation Safety Committee July 26, 2010
 Improving Rural Road Safety National Conference of State Legislatures NCSL 2010 Legislative Summit Transportation Safety Committee July 26, 2010 Overview What is CERS? Why Focus on Rural? SafeRoadMaps
Motorcycle Safety Program Assessments
 2015 s Conference 2015 ASK 1 Andrew Krajewski Project Manager, SMSA What is a state motorcycle safety program assessment? An independent review of a state s motorcycle safety efforts NHTSA facilitates
RESPONSE TO THE DEPARTMENT FOR TRANSPORT AND DRIVER AND VEHICLE STANDARDS AGENCY S CONSULTATION PAPER
 RESPONSE TO THE DEPARTMENT FOR TRANSPORT AND DRIVER AND VEHICLE STANDARDS AGENCY S CONSULTATION PAPER MODERNISING COMPULSORY BASIC TRAINING COURSES FOR MOTORCYCLISTS 17 APRIL 2015 Introduction The Royal
Interim Evaluation Report - Year 3
 Performance Analysis Services Graduated Licensing Program Interim Evaluation Report - Year 3 Prepared by: Sandi Wiggins Performance Analysis Services Table of Contents Section 1. Executive Summary... 11
Background. Project Personnel. Project Agencies. Traffic Safety Issue
 Motorcycle Helmet Exchange to Reduce the Use of Non-DOT- Compliant Helmets and Survey Previous and Current Participants to Evaluate the Effectiveness of the Pilot Exchange Program Project Personnel Hong
Road Safety s Mid Life Crisis The Trends and Characteristics for Middle Aged Controllers Involved in Road Trauma
 Road Safety s Mid Life Crisis The Trends and Characteristics for Middle Aged Controllers Involved in Road Trauma Author: Andrew Graham, Roads and Traffic Authority, NSW Biography: Andrew Graham has been
Respecting the Rules Better Road Safety Enforcement in the European Union. ACEA s Response
 Respecting the Rules Better Road Safety Enforcement in the European Union Commission s Consultation Paper of 6 November 2006 1 ACEA s Response December 2006 1. Introduction ACEA (European Automobile Manufacturers
Missouri Seat Belt Usage Survey for 2017
 Missouri Seat Belt Usage Survey for 2017 Conducted for the Highway Safety & Traffic Division of the Missouri Department of Transportation by The Missouri Safety Center University of Central Missouri Final
COUNTERMEASURES THAT WORK:
 COUNTERMEASURES THAT WORK: A HIGHWAY SAFETY COUNTERMEASURE GUIDE FOR STATE HIGHWAY SAFETY OFFICES NINTH EDITION, 2017 AT A GLANCE SUMMARY DOCUMENT ACCESS THE FULL REPORT HERE: Richard, C. M., Magee, K.,
License To Survive. Jay Carnes & Theo Mink. Mark Mithuen. Presented by: South Metro Safety Foundation. Douglas County Sheriff s Office
 License To Survive Presented by: Jay Carnes & Mark Mithuen Douglas County Sheriff s Office Theo Mink South Metro Safety Foundation Douglas County Sheriff s Office Douglas County School District South Metro
TRAFFIC SAFETY CONFERENCE. John A. Barton, P.E. Deputy Executive Director
 TRAFFIC SAFETY CONFERENCE John A. Barton, P.E. Deputy Executive Director June 9, 2015 Introduction TxDOT Mission Work with others to provide safe and reliable transportation solutions for Texas 2 Fatalities
Public Opinion of Waterloo Region Rapid Transit Proposal May 2011
 Public Opinion of Region Rapid Transit Proposal May 2011 Methodology From May 23 to May 25, 2011, Angus Reid Public Opinion conducted an online survey among a residents of Region on behalf of Machteld
Fleet Safety Initiative Status Summary
 Fleet Safety Initiative Status Summary Deborah Majeski DTE Energy Company October 7, 2008 DTE Energy s Primary Subsidiaries are Gas and Electric Utilities 2 Non-Utility Energy Related Businesses 3 Impact
HOW REAL PEOPLE VIEW THE FUTURE OF MOBILITY
 HOW REAL PEOPLE VIEW THE FUTURE OF MOBILITY OVERVIEW 1 2 3 Key Points Methodology: Adults overwhelmingly regard January the automotive 20 21, 2018. The industry as innovative, dynamic and changing for
2018 AER Social Research Report
 2018 AER Social Research Report Executive Summary June 2018 2018 AER Social Research Report Executive Summary June 2018 Published by Alberta Energy Regulator Suite 1000, 250 5 Street SW Calgary, Alberta
What action is expected to take place in the foreseeable future in ADRs with regard to seat belts on school buses?
 Feasibility Study for a Trial of Seat Belts on Contract School Buses Operating in Non Public Transport Areas of Western Australia Debra Swadling and Shannon Newman ARRB Transport Research Ltd. ARRB Transport
Summer Safety Tips. Playgrounds
 Summer Safety Tips Beat the Heat Anybody can be at risk for a heat-related illness. Follow these summer safety tips, like taking extra breaks and drinking lots of water. Bug Safety Mosquitoes can cause
What were they thinking? DUI Offenders Tell All
 Azahar Lopez, PsyD Program Manager Chrislyn Nefas, MA Research Analyst IV August 26, 2017 What were they thinking? DUI Offenders Tell All August 26, 2017 Today s Objectives By the end of the workshop,
TTI TRAFFIC SAFETY CONFERENCE. John A. Barton, P.E.
 TTI TRAFFIC SAFETY CONFERENCE John A. Barton, P.E. Introduction TxDOT Mission Work with others to provide safe and reliable transportation solutions for Texas. 2 Mission Zero Is a Journey toward: Zero
CHAPTER TWO AUTO CRASH STATISTICS
 CHAPTER TWO AUTO CRASH STATISTICS Age and Its Impact: Teen Drivers Teen Driving Statistics Age and Its Impact: Elderly Drivers Elderly Driving Statistics Auto Crash Statistics AGE AND ITS IMPAC T: TEEN
Winter/Holiday Season Safety 2013 UNCLASSIFIED
 Winter/Holiday Season Safety 2013 UNCLASSIFIED FY13 Marine Fatality Summary 49 Marines died in mishaps in FY-2013: - Private Motor Vehicle: 25 (51%) - Ground Operational, Including PT/Excluding MV: 12
Global Status Report on Road Safety: Respondents' Questionnaire
 Global Status Report on Road Safety: Respondents' Questionnaire Country: Respondent's Information Name: Position: Institution: Email: Telephone: Fax: National Data Coordinator Name: Position: Institution:
Collect and analyze data on motorcycle crashes, injuries, and fatalities;
 November 2006 Highway Safety Program Guideline No. 3 Motorcycle Safety Each State, in cooperation with its political subdivisions and tribal governments and other parties as appropriate, should develop
The Road to Automated Vehicles. Audi of America Government Affairs
 The Road to Automated Vehicles Audi of America Government Affairs 10.2017 A new future? 100 years of vertical autonomy It took 40 years to change FATALITIES Elevator: 31 per year Vehicles: 100 per day
Demographics and Sales
 Demographics and Sales What is an E-Bike? Almost identical to a traditional bicycle in appearance Small electric motor and battery to provide motorized assistance (pedal or throttle), up to 750 w (the
Evaluating Stakeholder Engagement
 Evaluating Stakeholder Engagement Peace River October 17, 2014 Stakeholder Engagement: The Panel recognizes that although significant stakeholder engagement initiatives have occurred, these efforts were
3/21/16 BEYOND THE DRIVING TEST ROADWORTHY CARS & TEENS: OPTIMIZING A VEHICLE S SAFETY FOR TEEN DRIVERS WORKSHOP. Teens & Tire Safety
 ROADWORTHY CARS & TEENS: OPTIMIZING A VEHICLE S SAFETY FOR TEEN DRIVERS WORKSHOP MICHAEL FANNING MICHELIN NORTH AMERICA APRIL 3, 2016 MICHAEL.FANNING@US.MICHELIN.COM 0 BEYOND THE DRIVING TEST Teens & Tire
Defensive Driving. Monthly Training Topic NV Transport Inc. Safety & Loss Prevention
 Defensive Driving Monthly Training Topic NV Transport Inc. Safety & Loss Prevention According to the National Safety Council Introduction Every accident in which a driver is involved shall be considered
Driver perceptions of the benefits of reducing their driving speed on safety, emissions, and stress and road rage
 Driver perceptions of the benefits of reducing their driving speed on safety, emissions, and stress and road rage Dr A. Debnath, Prof N. Haworth, Prof A. Raktonirainy, A. Graves, Dr I. Jeffreys Australasian
Response to. Ministry of Justice Consultation Paper. Driving Offences and Penalties Relating to Causing Death or Serious Injury
 Response to Ministry of Justice Consultation Paper Driving Offences and Penalties Relating to Causing Death or Serious Injury January 2017 Introduction This is RoSPA s response to the Ministry of Justice
A Question of Size: Involvement of Large Trucks in Road Crashes
 A Question of Size: Involvement of Large Trucks in Road Crashes Steve Brown Research Associate Traffic Injury Research Foundation 3 rd Ontario Road Safety Forum Toronto, Ontario March 6, 2018 Involvement
Act 229 Evaluation Report
 R22-1 W21-19 W21-20 Act 229 Evaluation Report Prepared for Prepared by Table of Contents 1. Documentation Page 3 2. Executive Summary 4 2.1. Purpose 4 2.2. Evaluation Results 4 3. Background 4 4. Approach
TRAFFIC DEPARTMENT 404 EAST WASHINGTON BROWNSVILLE, TEXAS City of Brownsville Speed Hump Installation Policy
 A. GENERAL Speed humps are an effective and appropriate device for safely reducing vehicle speeds on certain types of streets when installed accordance with the provisions of this policy. In order for