Energy for safe, affordable, accessible and sustainable transport systems for all
|
|
|
- Agnes Brittany Preston
- 5 years ago
- Views:
Transcription
1 Energy for safe, affordable, accessible and sustainable transport systems for all Sheila Watson Executive Secretary, Global Fuel Economy Initiative (GFEI) Trondheim, Oct 16 th 2017


2 CATALYTIC PARTNERSHIPS: Evidence Capacity-building Advocacy

3 The Global Fuel Economy Initiative (GFEI) Launched in 2009, with target of doubling fuel economy ( 50by50 ) Six core partners: FIA Foundation, UNEP, IEA, IkTF, ICCT and UC Davis. Financial support from FIA Foundation, GEF and European Commission GFEI recognized as leading vehicle efficiency initiative Achim Steiner a model alliance that should inspire other sectors 3

4 The Global Fleet 4 is set to triple.. with 90% of this growth taking place in developing countries
5 Climate Change Transport sector s contribution increasing more rapidly than any other sector. CO2 emissions set to double Short lived climate pollutants black carbon now second most important climate pollutant BAU Stabilization CO2 emissions from the global light duty vehicle fleet GFEI 2009
 Comprehensive approach needed: Avoid transport, for")

6 Carbon Reduction Potential Transport Potential for transport to reduce 4 GT/yr in 2030 and 8 GT/yr in 2050 (IEA MOMO model 2015) Comprehensive approach needed: Avoid transport, for example through better city planning Shift to efficient transport modes, like public transport Improve through cleaner vehicles Biggest potential with improving vehicle efficiency the yellow wedge


7 What can improved fuel economy deliver? Financial Savings Reduced dependence on oil Lower carbon emissions Air quality benefits From associated improved vehicle emissions standards

8 Fuel Economy Policy Options VEHICLE FUEL EFFICIENCY STANDARDS FISCAL MEASURES MARKET-BASED APPROACHES Introduce and regularly strengthen mandatory standards Establish and harmonize testing procedures for fuel efficiency measurement. Fuel taxes and vehicle taxes to encourage the purchase of more fuel-efficient vehicles. Infrastructure support and incentive schemes for very fuel-efficient vehicles. Voluntary programs such as U.S. SmartWay and other green freight programs INFORMATION MEASURES Vehicle fuel economy labels Improving vehicle operational efficiency through eco-driving and other measures. Source: ICCT


9 What does GFEI do? RAISING GLOBAL AWARENESS IN-COUNTRY POLICY SUPPORT RESEARCH AND EVIDENCE


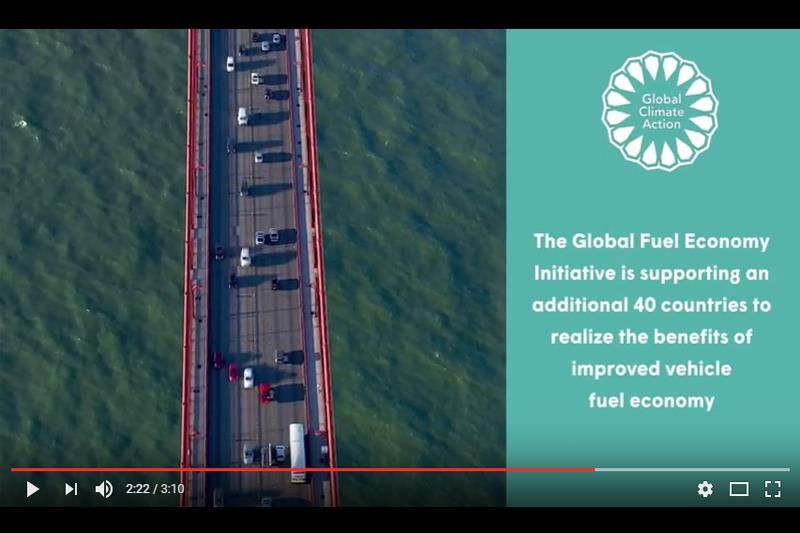
10 Country activity GFEI supporting work in over 65 countries, including 40 new countries using best practice toolkit eg EU, US reign, fiscal etc


11
12 Supporting low-middle income and transitional countries Phase 1 Pilot countries and tool development Phase 2 Regional Rollout Phase 3 Global Rollout Pending Resources Chile Mauritius Uganda Nigeria Honduras Angola Serbia Ethiopia Vietnam Ukraine Tanzania Namibia Bhutan Solomon Islands Indonesia Thailand Malaysia Rwanda El Salvador Burkina Faso Sierra Leone Kenya Georgia Egypt Argentina Botswana Cambodia Albania Ivory Coast Kazakhstan Jordan Mozambique Cameroon Brunei Costa Rica Mali Brazil Liberia Cape Verde Afghanistan Peru Togo Colombia Myanmar D.R. Congo Yemen Algeria Panama Bangladesh Eritrea Turkmenistan Montenegro Belize Burundi Guinea Samoa Russia Dominican Republic South Africa Pakistan Gambia Jamaica Djibouti Mongolia Kyrgyzstan Uzbekistan Macedonia Guatemala Fiji Laos Nicaragua Morocco Moldova Bolivia Lesotho Bahrain Iran Ecuador Marshall Islands Tunisia Barbados Senegal Oman Benin St. Lucia Lebanon Kuwait Uruguay Zambia Niger Nepal Ghana Tajikistan Philippines Malawi Armenia Sri Lanka Zimbabwe Azerbaijan


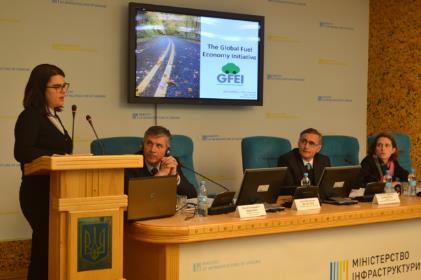
13 GFEI country workshops Jamaica Panama Ukraine ASEAN South Africa


14 Latest progress Myanmar GFEI workshop September Zambia GFEI workshop August Uganda GFEI workshop August Nepal - Sustainable Urban Mobility Forum


15 Latest progress (cont.) Colombia GFEI workshop January Togo GFEI workshop March Malawi GFEI workshop May ASEAN Fuel Economy Platform - March
16 Liters per 100 kilometers (L/100km) normalized to NEDC Test Cycle Fuel economy policies can work substantially Baseline Light-Duty Vehicle Fuel Economy and Trends for New LDVs Algeria Bahrain Chile China Costa Rica Cote d'ivoire Egypt Ethiopia EU Georgia Indonesia Japan Kenya Mauritius Montenegro Morocco Peru Philippines Sri Lanka Tunisia Uganda Uruguay US Source: UNEP, 2017 (unpublished).


17 Making an impact Kenya Kenya: New policy proposals announced for fuel economy based labelling and taxes Sri Lanka Fuel Economy included in Sri Lanka s Clean Air 2025 plan in May

18 In the absence of fuel economy policies there is a tendency for fuel efficiency to stagnate
19 Progress? OECD & EU average Non-OECD average Global average average fuel economy (Lge/100km) annual improvement rate (% per year) average fuel economy (Lge/100km) annual improvement rate (% per year) average fuel economy (Lge/100km) annual improvement rate (% per year) % -2.8% -1.6% -1.3% -0.5% -1.8% % -0.3% -1.4% -1.2% -1.6% -0.8% % -1.6% -1.3% -1.3% -1.1% -1.5% GFEI target required annual improvement rate (% per year) 2005 base year -2.8% 2015 base year -3.7% Slow down in OECD in recent years. Acceleration in non-oecd. Still far from meeting GFEI improvement targets just 1.5% average.


20 Momentum for change

21 COP22 Marrakech

22 GFEI is one of SLOCAT's 'quickwin' initiatives to address the climate impact of vehicles 2 2
23 Challenges and next steps for GFEI - Relevance, Reality, Resources In-country work needs to embrace a full sweep of vehicle and fleet issues more efficient approach & needs resourcing Policy is needed to address fuel efficiency in Heavy Duty Vehicles whose contribution to energy use is growing It is important to show that Electric Vehicles are not a simple alternative, but part of a continuum of vehicle efficiency measures Vehicle Emissions matter too particularly to cities


24 Next steps: Heavy Duty Vehicles HDV sector is behind LDV sector in implementation efficiency standards Japan, US, China and Canada currently have programs while India, Mexico, Korea and Europe are actively developing programs. There are significant differences in vehicle characteristics between markets Source: ICCT
25 WP14 report: HDVs and Fuel Economy Models future growth based on representative characteristics of 2015 EU, US, Brazil, India, and China fleets. Source: ICCT Compared to current policies, the incremental efficiency scenario could save around 5 million barrels of oil per day in 2035 and the accelerated scenario could save an additional 4 million barrels of oil per day in that year.

26 HDV target: '35 by 35' 35% improvement in average fuel economy of HDVs globally by Saves: 9m barrels of oil per day by billion tonnes CO2 per year by % each India and China


27 Electric Vehicles Top 8 markets have seen an increase in EV sales. 50%+ in recent years COP21 Target 100m by % average growth in numbers needed each year until then.


28 The Real Urban Emissions Initiative - TRUE Conclusion: an independent, global, real-world testing initiative is a necessary, important step towards providing improved consumer information regarding emissions pilots in 2017 in London & Paris
29 Thank-you
Promoting Electric Mobility in Low and Middle Income Countries
 Promoting Electric Mobility in Low and Middle Income Countries David Rubia Programme Officer, Transport Unit, UN Environment 17 th IUAPPA World Clean Air Congress & 9th CAA Better Air Quality Conference
GLOBAL ECONOMIC PROSPECTS January Statistical Annex
 1 TABLE A.1 GDP Growth (Constant 2010 U.S. Dollars) Annual estimates and forecasts a Quarterly growth b 2013 2014 00-10 c 2011 2012 2013 2014e 2015f 2016f 2017f Q1 Q2 Q3 Q4 Q1 Q2 Q3 World 2.8 3.1 2.4 2.5
Global Trends toward Cleaner Fuels and Fuel Efficient Vehicles
 Global Trends toward Cleaner Fuels and Fuel Efficient Vehicles Jane Akumu UN Environment Malawi, 11 December 2017 Impact of Transport Air Quality & Health Largest source of air pollution in cities, exceeding
C H AP TE R 1 G LO BAL EC O NO MIC P ROS P EC TS J U NE 2017
 4 C H AP TE R 1 G LO BAL EC O NO MIC P ROS P EC TS J U NE 2017 TABLE 1.1 Real GDP 1 (percent change from previous year) 2014 2015 2016 2017 2018 2019 2016 2017 2018 2019 Percentage point differences Estimates
LPI ranking and scores, 2014
 ing and scores, 2014 Germany 1 4.12 100.0 Netherlands 2 4.05 97.6 Belgium 3 4.04 97.5 United Kingdom 4 4.01 96.6 Singapore 5 4.00 96.2 Sweden 6 3.96 94.9 Norway 7 3.96 94.8 Luxembourg 8 3.95 94.4 United
Summary of Contributions to UN Peacekeeping by Country and Post.
 Summary of Contributions to UN Peacekeeping by Country and Post. Police,UN Military, s and Troops 31/07/2018 1 Country Name POST MALE FEMALE TOTAL Algeria 2 3 4 5 6 7 Argentina Armenia Australia Austria
Global Competitiveness Index Rankings
 APPENDIX B Global Competitiveness Index 2017 2018 Rankings The following pages report the GCI 2017 2018 rankings for the three subindexes (Table 1) and their corresponding pillars (Tables 2 4). Detailed
9.01 ICT use for business-to-business transactions
 9.01 ICT use for business-to-business transactions To what extent do businesses in your country use ICTs for communicating and carrying out transactions with other businesses? [1 = not at all; 7 = extensively]
Overview of the Global Fuel Economy Initiative. Jane Akumu UN Environment
 Overview of the Global Fuel Economy Initiative Jane Akumu UN Environment UN Environment Transport Programmes Share the Road (StR) Global Fuel Economy Initiative (GFEI) Electric Mobility Partnership for
Summary of debt securities outstanding
 Summary of debt securities outstanding All countries........................ 22,695 15,852 6,665 3,427 1,762 Developed countries........................ 16,504 13,087 5,869 2,716 701 Austria 510 173 44
Green: 348. Yellow/Orange: Yellow/Orange: Green: 348. Yellow/Orange: Green: 348. Yellow/Orange:137 Bronze: 145
 Afghanistan 348 Albania 186 Algeria 348 Andorra 286 348 137 Bronze: 145 Angola 137 Antigua and Barbuda 314 137 Argentina 279 137 Armenia 286 165 186 Australia 2768 Austria Azerbaijan Warm red 485 282 348
5.01 Secondary education enrollment rate
 5.01 Secondary education enrollment rate Gross secondary education enrollment rate 2011 or most recent year available RANK COUNTRY/ECONOMY Value 1 Australia 8...131.3 2 Spain...128.5 3 Seychelles...123.9
Fiche 1 Quelques données de la Banque Mondiale
 Fiche 1 Quelques données de la Banque Mondiale 274 WORLD DEVELOPMENT REPORT 2000 2001 Table 1. Size of the economy Surface Population area density Gross national product (GNP) GNP per capita GNP measured
Country Risk Scores Table Results
 s Table - 2014 Results Afghanistan 73 73 53 71 70 49 48 50 59 54 63 75 54 89 4.7 Albania 60 67 59 73 50 32 39 26 35 47 32 43 46 32 8.8 Algeria 79 82 88 67 63 30 39 24 79 81 74 49 51 38 10.0 Andorra 47
International Sugar Organization WORLD SUGAR BALANCES 2002/ /16
 International Sugar Organization WORLD SUGAR BALANCES 2002/2003-2015/16 FEBRUARY 2016 WORLD SUGAR BALANCES (October/September) in thousand tonnes, tel quel Production 166,833 171,180 171,386 172,029 164,629
Global and Regional Tables
 Global and Regional Tables Freedom of the Press 2006 1 Finland 9 F Iceland 9 F 3 Denmark 10 F Norway 10 F Sweden 10 F 6 Belgium 11 F Luxembourg 11 F Netherlands 11 F Switzerland 11 F 10 Liechtenstein 13
Figure Geographic distribution Change in country participation in international nongovernmental organizations (NGOs): 1992 and 2002
: 1992 and 2002") Figure 2.2.3. Geographic distribution Change in country participation in international nongovernmental s (NGOs): 1992 and 2002 This table gives the and (international NGOs of types A to F) for a given
Figure 2.2.3. Geographic distribution Change in country participation in international nongovernmental s (NGOs): 1992 and 2002 This table gives the and (international NGOs of types A to F) for a given
2.01 Availability of latest technologies
 2.01 Availability of latest technologies To what extent are the latest technologies available in your country? [1 = not available; 7 = widely available] 2010 2011 weighted average RANK COUNTRY/ECONOMY
Table 19 Production, trade and supply of other kerosene Thousand metric tons and kilograms per capita
 Table Notes Production includes output from refineries and plants. For China, data include kerosene-type jet fuel. Please refer to the Definitions Section on pages ix to xv for the appropriate product
Auto Fuel Economy Policy: An Opportunity to Choose Clean Mobility
 Auto Fuel Economy Policy: An Opportunity to Choose Clean Mobility Air Quality & Mobility Unit March 2018 Technology Choosers vs. Technology Takers Global Fuel Economy Initiative Auto fuel economy: rate
TABLE 1 WHO ASSESSED CONTRIBUTIONS: MEMBERS WITH NO CHANGE IN CONTRIBUTION
 :25/'+($/7+25*$1,=$7,21 (;(&87,9(%2$5' WK6HVVLRQ 3URYLVLRQDODJHQGDLWHP (%,1)'2& 'HFHPEUH $VVHVVPHQWVIRU 1. Document EB109/21 includes as an Annex a table indicating for each Member and Associate Member
Section III Macroeconomic environment
 Data Tables Section III Macroeconomic environment 2.2: Data Tables Section III: Macroeconomic environment 422 3.01 Government budget balance General government budget balance as a percentage of GDP 2010
STATES ELIGIBLE FOR ELECTION
 ANNEX STATES ELIGIBLE FOR ELECTION List No. 1 States Eligible for Election as Members of the Executive Committee of the Paris Union (that is, States members of the Assembly of the Paris Union) (175) 1
Table 19 Production, trade and supply of other kerosene Thousand metric tons and kilograms per capita
 Table 19 Production, trade and supply of other kerosene Table Notes Production includes output from refineries and plants. For China, data up to 2013 include kerosenetype jet fuel. Please refer to the
FCCC/SBI/2016/INF.15. United Nations. Revised indicative contributions for the biennium
 United Nations FCCC/SBI//INF.15 Distr.: General 20 September English only Subsidiary Body for Implementation Forty fifth session Marrakech, 7 14 November Item 17(a) of the provisional agenda Administrative,
2014/ /2015 Ghana / /2015 Syrian Arab Republic / /2015
 Exhibit C: international cotton trade data Source: International Cotton Advisory Committee, ICAC World Cotton Database, available at www.icac.org, last checked 1 April 2016. International Cotton Advisory
From Wikipedia, the free encyclopedia
 1 of 6 14/09/2011 22:38 From Wikipedia, the free encyclopedia This is a list of countries by natural gas exports mostly based on The World Factbook [1] (https://www.cia.gov/library/publications/the-world-factbook/rankorder/2183rank.html).
Part III STATISTICAL ANNEX
 Part III STATISTICAL ANNEX STATISTICAL ANNEX 125 TABLE A1 Production of livestock products, 1995 2007 Meat Milk Eggs (Thousand tonnes) (Annual % (Thousand tonnes) (Annual % (Thousand tonnes) (Annual %
The Great Transition: Shifting from Fossil Fuels to Solar and Wind Energy Supporting Data - Hydropower
 The Great Transition: Shifting from Fossil Fuels to Solar and Wind Energy Supporting Data - Hydropower World Installed Hydroelectric Generating Capacity, 1980-2013 GRAPH: World Installed Hydroelectric
Improving Fuel Economy in Southeast Asia
 Improving Fuel Economy in Southeast Asia Bert Fabian, Programme Officer, Transport Unit, UN Environment 29 March 2017, Bangkok, Thailand UN Environment Promoting Sustainable Low Emissions Transport Avoid
International Investment Position: World and Regional Tables
 BOPCOM/08/18 Twenty-First Meeting of the IMF Committee on Balance of Payments Statistics Washington, D.C., November 4 7, 2008 International Investment Position: World and Regional Tables Prepared by the
UNITED NATIONS EDUCATIONAL, SCIENTIFIC AND CULTURAL ORGANIZATION EXECUTIVE BOARD. Hundred and sixty-fourth Session
 164 EX/INF.7 PARIS, 14 May 2002 English & French only UNITED NATIONS EDUCATIONAL, SCIENTIFIC AND CULTURAL ORGANIZATION EXECUTIVE BOARD Hundred and sixty-fourth Session Item 3.1.1 of the provisional agenda
Lower bound. Upper bound. Lower bound. Afghanistan
 EMBARGOED UNTIL 00:01 GMT 18 September 2018 Under-five () with 90 per cent uncertainty interval () (per cent) under-five with 90 per cent uncertainty interval Afghanistan 175 160 192 68 52 85 3.5 2.6 4.5
Table 20 Production, trade and supply of jet fuels Thousand metric tons and kilograms per capita
 Table 20 Production, trade and supply of jet fuels Table Notes Data refer to aviation gasoline, gasoline-type jet fuel and kerosene-type jet fuel. Production includes output from refineries and plants.
Table 6A: External positions of reporting banks vis-à-vis all sectors
 Table 6A: External positions of reporting banks vis-à-vis all sectors Vis-à-vis individual countries in millions of US dollars All countries 29,841,389 29,212,683 28,267,608 28,518,559 75,538 1,110,929
Table 6A: External positions of reporting banks vis-à-vis all sectors
 Table 6A: External positions of reporting banks vis-à-vis all sectors Vis-à-vis individual countries in millions of US dollars All countries 29,227,490 29,015,072 28,531,726 28,040,625 1,147,749 1,456,989
Table 7B: External loans and deposits of reporting banks vis-à-vis the non-bank sector
 Table 7B: External loans and deposits of reporting banks vis-à-vis the non-bank sector Vis-à-vis individual countries in millions of US dollars All countries 6,618,147 6,859,916 6,854,545 6,829,602 92,045
Table 7B: External loans and deposits of reporting banks vis-à-vis the non-bank sector
 Table 7B: External loans and deposits of reporting banks vis-à-vis the non-bank sector Vis-à-vis individual countries in millions of US dollars All countries 6,871,257 7,040,175 6,972,597 6,946,298 71,425
Table 5 Production, trade and supply of hard coal Thousand metric tons and kilograms per capita
 Table Notes Production includes production from other sources as defined in the previous table. Data for China include brown coal. Please refer to the Definitions Section on pages ix to xv for the appropriate
Total fleet. Oil tankers
 184 as at 1 January 2011 (in thousands of dwt) DEVELOPING ECONOMIES OF AFRICA Algeria 809 30 204 66 0 509 Angola 58 10 0 14 0 34 Benin 0 0 0 0 0 0 Cameroon 10 0 0 4 0 6 Cape Verde 22 5 0 12 0 6 Comoros
A. Assessment of Member States under General Assembly resolution 71/268
 United Nations Secretariat Distr.: General 9 January 2017 Original: English Assessment of Member States contributions for the financing of the International Tribunal for the Prosecution of Persons Responsible
Hotel Price Indicatice max. as from 22 Nov International per diem TOWNS/ DESTINATION COUNTRY
 Appendix 1: VLIR-UOS hotel allowances and international amounts valid from 22 Nov, 2017, onwards COUNTRY Afghanistan all destinations 180 72 Albania all destinations 175 96 Algeria all destinations 219
REGIOGRAPH SOFTWARE AVAILABLE VERSIONS UPDATE AND UPGRADE PRICE ONGOING SAVINGS OF 50%! PRICE LIST
 PRICE LIST REGIOGRAPH SOFTWARE RegioGraph allows you to visualize and evaluate your company data directly on digital maps. This provides insight into data trends and relationships and lends objectivity
Table 5 Production, trade and supply of hard coal Thousand metric tons and kilograms per capita
 Table Notes Production includes production from other sources as defined in the previous table. Data for China include brown coal. Please refer to the Definitions Section on pages ix to xv for the appropriate
Governance Indicators World Map: Voice & Accountability
 Governance Indicators: Voice & Accountability (VA), Political Stability (PS), Government Effectiveness (GE), Regulatory Quality (RQ), Rule of Law (RL), Control of Corruption (CC) Percentile Ranks, 2004
Table 13 Production, trade and supply of conventional crude oil Thousand metric tons; kilograms per capita; reserves production ratio (R/P) in years
 in years") Table 13, trade and supply of conventional crude oil Thousand metric tons; kilograms per capita; reserves production ratio (R/P) in years Table Notes The Reserves / ratio refers to crude oil and natural
Table 13, trade and supply of conventional crude oil Thousand metric tons; kilograms per capita; reserves production ratio (R/P) in years Table Notes The Reserves / ratio refers to crude oil and natural
Country Rate Country Rate Country Rate
 Afghanistan $1.080 Alaska $0.099 Albania $0.259 Algeria $0.269 American Samoa $0.139 American Samoa (Mobile) $0.209 Andorra $0.089 Andorra (Mobile) $0.319 Angola $0.349 Angola (Mobile) $0.569 Anguilla
SOFTWARE REGIOGRAPH ANALYSIS PLANNING STRATEGY
 SOFTWARE REGIOGRAPH RegioGraph allows you to quickly and easily display your company data on digital maps. In combination with purchasing power data, this reveals trends and relationships that would not
Table 13 Production, trade and supply of conventional crude oil Thousand metric tons; kilograms per capita; reserves production ratio (R/P) in years
 in years") Million metric tons Million metric tons Table 13, trade and supply of conventional crude oil Thousand metric tons; kilograms per capita; reserves production ratio (R/P) in years Table Notes The Reserves
Million metric tons Million metric tons Table 13, trade and supply of conventional crude oil Thousand metric tons; kilograms per capita; reserves production ratio (R/P) in years Table Notes The Reserves
Table 9A: Consolidated claims of reporting banks - immediate borrower basis
 Table 9A: Consolidated claims of reporting banks - immediate borrower basis On individual countries by maturity and sector / Amounts outstanding In millions of US dollars Total Consolidated cross-border
Table 13 Production, trade and supply of conventional crude oil Thousand metric tons; kilograms per capita; reserves production ratio (R/P) in years
 in years") , trade and supply of conventional crude oil Thousand metric tons; kilograms per capita; reserves production ratio (R/P) in years Table Notes The Reserves / ratio refers to crude oil and natural gas liquids.
, trade and supply of conventional crude oil Thousand metric tons; kilograms per capita; reserves production ratio (R/P) in years Table Notes The Reserves / ratio refers to crude oil and natural gas liquids.
Microsoft Social Engagement Translation Guide Last Updated: October 2017
 Microsoft Social Engagement Translation Guide Last Updated: October 2017 Microsoft Social Engagement is translated and supported by Microsoft and made generally available in the countries/regions and languages
SOFTWARE REGIOGRAPH ANALYSIS PLANNING STRATEGY
 SOFTWARE REGIOGRAPH RegioGraph allows you to quickly and easily display your company data on digital maps. In combination with purchasing power data, this reveals trends and relationships that would not
Technical Cooperation Report for 2016
 Technical Cooperation Report for 2016 Report by the Director General Supplement International Atomic Energy Agency Vienna International Centre, PO Box 100 1400 Vienna, Austria Tel.: (+43-1) 2600-0 Fax:
Improving fuel economy and integrating electric vehicles
 Improving fuel economy and integrating electric vehicles Air Quality & Mobility Unit March 2018 Global Fuel Economy Initiative Doubling LDV Fuel Efficiency Worldwide by 2050 Slowing improvement in OECD
The Global Fuel Economy Initiative. Jane Akumu UN Environment
 The Global Fuel Economy Initiative Jane Akumu UN Environment Historical High Growth Has Made Vehicles An Important Contributor To Local, Regional and Global Pollution Vehicle fleet to triple (from ~1 billion
Net Migration Rate per 1,000 Population. Rate of Natural Increase (%)
") mid-2009 Births per POPULATION, HEALTH, AND ENVIRONMENT DATA AND ESTIMATES Deaths per Rate of Natural Increase Net Migration Rate per 2025 2050 Change 2009 2050 Infant Mortality Rate a Percent of Total
mid-2009 Births per POPULATION, HEALTH, AND ENVIRONMENT DATA AND ESTIMATES Deaths per Rate of Natural Increase Net Migration Rate per 2025 2050 Change 2009 2050 Infant Mortality Rate a Percent of Total
Global Fuel Economy Initiative Achievements and Impacts. Kamala Ernest Programme Officer United Nations Environment Programme
 Global Fuel Economy Initiative Achievements and Impacts Kamala Ernest Programme Officer United Nations Environment Programme Doubling the efficiency of the global fleet by 2050 2005 2008 2011 2013 2030
Technical Cooperation Report for 2012
 Technical Cooperation Report for 2012 Report by the Director General Supplement @ GC(57)/INF/4/SUPPLEMENT TECHNICAL COOPERATION REPORT FOR 2012 REPORT BY THE DIRECTOR GENERAL Printed by the International
Percentage and total number of foreign national prisoners worldwide
 Percentage and total number of foreign national prisoners worldwide Source: World Prison Brief (International Centre for Prison Studies www.prisonstudies.org) 1 Country % Total 2003 FNP 2003 % Total 2005
Demographic and Socioeconomic Statistics
 Demographic and Socioeconomic Statistics Country WHO region number Population a annual growth rate in urban areas Total fertility rate a Adolescent fertility proportion b (000) 1995 (per woman) Year 1
Table A1. Summary of World Output1
 Output: Summary Table A1. Summary of World Output 1 (Annual percent change) 1991 2000 2001 2002 2003 2004 2005 2006 2007 2008 2009 2010 2014 World 3.1 2.2 2.8 3.6 4.9 4.5 5.1 5.2 3.2 1.3 1.9 4.8 Advanced
Technical Cooperation Report for 2015
 Technical Cooperation Report for 2015 Report by the Director General Supplement GC(60)/INF/4/SUPPLEMENT TECHNICAL COOPERATION REPORT FOR 2015 REPORT BY THE DIRECTOR GENERAL Printed by the International
Delinquent Payments Voluntary Assessed Contributions to the Framework Convention on Tobacco Control
 Delinquent Payments Voluntary Assessed Contributions to the Framework Convention on Tobacco Control The operations of the Framework Convention on Tobacco Control (FCTC) are principally financed through
Table 2. Freshwater Withdrawal by Country and Sector. Description
 Table 2. Freshwater Withdrawal by Country and Sector Description The use of water varies greatly from country to country and from region to region. Data on water use by regions and by different economic
PwC Belgium Daily lump-sum allowances list for traveling abroad please visit for more information
 allowances list for traveling abroad Allowances given by an employer to his employee to cover foreign business travel expenses are costs proper to the employer. These allowances are tax exempt for the
SAVER PLAN Standard Rate Table Service Description Rate AUD$ (per minute) Flagfall Other Charges
 Flagfall Other Charges") SAVER PLAN Standard Rate Table Service Description Voicemail Retrieval (121, 1211, 1212, 1213, 1218, 1219) Call Forward Hello Mobile Customer Care via 126 999 Hello Mobile Customer Care via 1300 126 999
SAVER PLAN Standard Rate Table Service Description Voicemail Retrieval (121, 1211, 1212, 1213, 1218, 1219) Call Forward Hello Mobile Customer Care via 126 999 Hello Mobile Customer Care via 1300 126 999
List of Tables. Output. Infl ation. Financial Policies. Foreign Trade. Current Account Transactions. Balance of Payments and External Financing
 STATISTICAL APPENDIX List of Tables Output A1. Summary of World Output 241 A2. Advanced Economies: Real GDP and Total Domestic Demand 242 A3. Advanced Economies: Components of Real GDP 243 A4. Emerging
3rd Meter Gauge Group CEO s Conference. Brisbane. 10 May, rd Meter Gauge CEO's Conference in Brisbane - 10th May,
 3rd Meter Gauge Group CEO s Conference Brisbane 10 May, 2004 1 UIC Members UIC Member 163Members 2 UIC Meter Gauge Group UIC Meter Gauge Group was established as a special group for meter gauge railways
Effective October 1, 2006, Sprint Global Savings will no longer be available to new customers.
 Sprint Global Savings International Calling Plan Dial-1 ute International for Calls Made from 1 Effective October 1, 2006, Sprint Global Savings will no longer be available to new customers. Some calls
Table 16 Refinery distillation capacity, throughput and output Thousand metric tons
 Million metric tons Table 16 Refinery distillation capacity, throughput and output Table Notes Output is equal to the sum of production from refineries for aviation gasoline, bitumen, gas/diesel oil, ethane,
Foreign Country per diem and accommodation costs (valid as of January 1, 2016)
") Foreign Country per diem and accommodation costs (valid as of January 1, 2016) Country Town per diem in Accommodation costs up to... with proof*) Afghanistan 25 95 Albania 24 90 Algeria 32 190 Andorra
Foreign Country per diem and accommodation costs (valid as of January 1, 2016) Country Town per diem in Accommodation costs up to... with proof*) Afghanistan 25 95 Albania 24 90 Algeria 32 190 Andorra
up to and including 31 December 2002
 The ISO Survey of ISO 9000 and ISO 14001 Certificates Twelfth cycle : up to and including 31 December T a b l e o f c o n t e n t s The ISO Survey : twelfth cycle () highlights......................................................................
Table III Immigrant Visas Issued (by Foreign State of Chargeability or Place of Birth) Fiscal Year 2018
 Fiscal Year 2018") Africa Algeria 437 2 198 18 1,343 1,998 Angola 26 0 14 1 17 58 Benin 138 0 60 1 237 436 Botswana 10 0 4 0 0 14 Burkina Faso 121 2 35 3 107 268 Burundi 74 0 13 0 97 184 Cabo Verde 395 1 980 6 1 1,383 Cameroon
Africa Algeria 437 2 198 18 1,343 1,998 Angola 26 0 14 1 17 58 Benin 138 0 60 1 237 436 Botswana 10 0 4 0 0 14 Burkina Faso 121 2 35 3 107 268 Burundi 74 0 13 0 97 184 Cabo Verde 395 1 980 6 1 1,383 Cameroon
Calls made to a mobile phone may be charged a per minute International Mobile Termination Surcharge, see Sprint Wireline Fees and Surcharges Matrix.
 A discounted rate will apply to the country a customer calls the most (based on total dollars). If the customer has equal Dial-1 voice usage to two or more countries, the tie breakers will be the number
A5. Summary of Inflation 197 A6. Advanced Economies: Consumer Prices 198 A7. Emerging Market and Developing Economies: Consumer Prices 199
 Statistical Appendix List of Tables Output A1. Summary of World Output 190 A2. Advanced Economies: Real GDP and Total Domestic Demand 191 A3. Advanced Economies: Components of Real GDP 192 A4. Emerging
Table 33 Electricity supply and consumption Gigawatt-hours and kilowatt-hours per capita
 Table 33 Electricity supply and consumption Table Notes is calculated as production plus imports minus exports. EIOU and losses refers to energy industries own use of electricity, including for pumped
Doing business in a more transparent world
 2012 Doing business in a more transparent world COMPARING REGULATION FOR DOMESTIC FIRMS IN 183 ECONOMIES ii DOING BUSINESS 2012 THE DOING BUSINESS WEBSITE Current features News on the Doing Business project
Production of minor oil products from refineries - by type Thousand metric tons
 Production of minor oil from refineries - by type Table 23 Table Notes Data refer to production from refineries of refinery, ethane, naphtha, lubricants, bitumen, paraffin, petroleum, white spirit, and
Table 16 Refinery distillation capacity, throughput and output Thousand metric tons
 Table 16 Refinery distillation capacity, throughput and output Table Notes Output is equal to the sum of production from refineries for aviation gasoline, bitumen, gas/diesel oil, ethane, feedstocks, gasoline-type
Private external debt as a percentage of exports exports. Government external debt as a percentage of GDP
 Net liabilities (+ = net asset, - = net liability) Current account (+ = surplus, - = deficit) External government debt payments as a revenue exports exports exports external debt payments projected to
Table 21 Production, trade and supply of gas oil/diesel oil Thousand metric tons and kilograms per capita
 Table Notes Production includes output from refineries and plants, together with quantities from other sources which include any blended biodiesel. Please refer to the Definitions Section on pages ix to
 WORLD TARIFF PROFILES 2017 Applied MFN tariffs 0
 Table 23 Production of minor oil products from refineries - by type Thousand metric tons
 Table 23 Production of minor oil from refineries - by type Table Notes Data refer to production from refineries of refinery, ethane, naphtha, lubricants, bitumen, paraffin, petroleum, white spirit, and
APPENDIX B KEY ASPECTS OF LONG-TERM FINANCE
 GLOBAL FINANCIAL DEVELOPMENT REPORT 2015/2016 APPENDIX B 165 APPENDIX B KEY ASPECTS OF LONG-TERM FINANCE Economies and Their Maturity Structure of Finance, 2013 GDP at Afghanistan 8.9 8.2 0.7 0.00 Albania
Imports of seed for sowing by country Calendar year 2011 Source: ISF compilation based on official statistics and international seed trade reports
 USA 157,432 15,562 464 173,458 523 318 67 908 Germany 195,159 5,913 520 201,592 595 97 22 714 France 125,701 4,389 277 130,367 522 150 11 683 Netherlands 140,899 12,253 796 153,948 250 330 48 628 Italy
Enterprise Voice Trunking: Domestic, International and inbound Toll Free Rates
 Overage Domestic Long Distance toll $0.03 On net* Inbound Toll Free $0.029 International Long Distance toll See table below Customers subscribing to MOU packages of 100,000 minutes and larger will receive
Table 2 Components of total energy supply Petajoules and Gigajoules per capita
 Table 2 Components of total energy supply Table Notes Production Included in the production of primary energy for Solids are hard coal, lignite, peat, oil shale, primary solid biofuels and wastes; Liquids
Cotton This Month. Major Changes in Supply and Demand Estimates and Projections
 1629 K Street NW, Suite 702 Washington, DC 20006, USA Cotton This Month March 1, 2018 Major Changes in Supply and Demand Estimates and Projections Brazil China Turkey United States 2017/18: production
Cotton This Month. Major Changes in Supply and Demand Estimates and Projections
 1629 K Street NW, Suite 702 Washington, DC 20006, USA Cotton This Month February 1, 2018 Major Changes in Supply and Demand Estimates and Projections India Mexico Pakistan United States 2017/18 production
REGIOGRAPH SOFTWARE AVAILABLE VERSIONS UPDATE AND UPGRADE PRICE ONGOING SAVINGS OF 50%! PRICE LIST
 PRICE LIST REGIOGRAPH SOFTWARE RegioGraph allows you to visualize and evaluate your company data directly on digital maps. This provides insight into data trends and relationships and lends objectivity
Price (CZK) with V.A.T.
 with V.A.T.") Price category 100 100 101* 101* 102 102 103 103 Weight (kg) Price (CZK) 0,5 kg 229,74 278,00 229,74 278,00 599,97 726,00 699,96 847,00 1 kg 260,32 315,00 319,82 387,00 649,55 786,00 749,54 907,00 2 kg
Price category 100 100 101* 101* 102 102 103 103 Weight (kg) Price (CZK) 0,5 kg 229,74 278,00 229,74 278,00 599,97 726,00 699,96 847,00 1 kg 260,32 315,00 319,82 387,00 649,55 786,00 749,54 907,00 2 kg
Selected Energy Indicators for 2004
 E E G Y D C A T O S Selected Energy ndicators for 2004 egion/ Popu- GDP GDP Energy et TPES Elec. CO 2 Country lation (PPP) Prod. mports Cons. (a) Emissions (b) (million) (billion (billion (Mtoe) (Mtoe)
ISO. Statistical Bulletin. International Sugar Organization. September Introduction of Tel Quel Basis in ISO Sugar Statistics. Vol. 73 No.
 Statistical Bulletin September 2014 Vol. 73 No. 09 Updates Colombia Apr - Jun 2014 Introduction of Tel Quel Basis in ISO Sugar Statistics International Sugar Organization ISO ISSN 0020-885X Statistical
Table 1. Demographics and Standards of Living Across Countries Total Population Annual Annual # Under 5 GNP % under 5 s Net primary Total Maternal
 Table 1. Demographics and Standards of Living Across Countries Total Population Annual Annual # Under 5 GNP % under 5 s Net primary Total Maternal Population under 18 # of births < age 5 deaths mortality
International Passenger Traffic to and from Reporting Airports (in Thousands) by Country Table 11
 by Country Table 11") International Passenger Traffic to and from Reporting Airports (in Thousands) by Country 2005-2015 Table 11 2005 2006 2007 2008 2009 2010 2011 2012 2013 2014 2015 AUSTRIA 1 796 1 788 1 877 1 826 1 746
International Passenger Traffic to and from Reporting Airports (in Thousands) by Country 2005-2015 Table 11 2005 2006 2007 2008 2009 2010 2011 2012 2013 2014 2015 AUSTRIA 1 796 1 788 1 877 1 826 1 746
Table 3A Early childhood care and education (ECCE): care
: care") 7 238 / ANNEX 2 Early childhood care and education (ECCE): care Education for All Global Monitoring Report Arab States Algeria Bahrain Djibouti Egypt Iraq Jordan Kuwait Lebanon Libyan Arab Jamahiriya Mauritania
7 238 / ANNEX 2 Early childhood care and education (ECCE): care Education for All Global Monitoring Report Arab States Algeria Bahrain Djibouti Egypt Iraq Jordan Kuwait Lebanon Libyan Arab Jamahiriya Mauritania
Table 3. Access to Safe Drinking Water by Country, 1970 to 2002 (2006 Update) Description
 Description") Table 3. Access to Safe Drinking Water by Country, 1970 to 2002 (2006 Update) Description Safe drinking water is one of the most basic human requirements and one of the Millennium Development Goals (MDGs)
Table 3. Access to Safe Drinking Water by Country, 1970 to 2002 (2006 Update) Description Safe drinking water is one of the most basic human requirements and one of the Millennium Development Goals (MDGs)
World Tariff Profiles 0<1 2<3 3<4 4<6 6<8 8<10 10<15 15<20 20<
 World Tariff Profiles Applied MFN tariffs 0
An overview of International Policies on Vehicle Fuel Economy. Jane Akumu UN Environment
 An overview of International Policies on Vehicle Fuel Economy Jane Akumu UN Environment Fuel economy policies & instruments Target group: Consumer Monetary Fiscal instruments FE Consumer information Labelling