of Nebraska - Lincoln
|
|
|
- Gwendolyn Rich
- 6 years ago
- Views:
Transcription
 Data for Advanced Machinery Testing Rodney Rohrer University of Nebraska-Lincoln,")
1 University of Nebraska - Lincoln DigitalCommons@University of Nebraska - Lincoln Biological Systems Engineering--Dissertations, Theses, and Student Research Biological Systems Engineering Investigation of Petroleum Use in Off-road Agricultural Machinery and Analysis of J1939 Controller Area Network (CAN) Data for Advanced Machinery Testing Rodney Rohrer University of Nebraska-Lincoln, rrohrer2@unl.edu Follow this and additional works at: Part of the Bioresource and Agricultural Engineering Commons Rohrer, Rodney, "Investigation of Petroleum Use in Off-road Agricultural Machinery and Analysis of J1939 Controller Area Network (CAN) Data for Advanced Machinery Testing" (2017). Biological Systems Engineering--Dissertations, Theses, and Student Research This Article is brought to you for free and open access by the Biological Systems Engineering at DigitalCommons@University of Nebraska - Lincoln. It has been accepted for inclusion in Biological Systems Engineering--Dissertations, Theses, and Student Research by an authorized administrator of DigitalCommons@University of Nebraska - Lincoln.
2 INVESTIGATION OF PETROLEUM USE IN OFF-ROAD AGRICULTURAL MACHINERY AND ANALYSIS OF J1939 CONTROLLER AREA NETWORK (CAN) DATA FOR ADVANCED MACHINERY TESTING By Rodney Rohrer A THESIS Presented to the Faculty of The Graduate College at the University of Nebraska In Partial Fulfillment of Requirements For the Degree of Master of Science Major: Agricultural and Biological Systems Engineering Under the supervision of Professor Roger Hoy Lincoln, Nebraska April 2017
3 INVESTIGATION OF PETROLEUM USE IN OFF-ROAD AGRICULTURAL MACHINERY AND ANALYSIS OF J1939 CONTROLLER AREA NETWORK (CAN) DATA FOR ADVANCED MACHINERY TESTING Rodney Rohrer, M.S. University of Nebraska, 2017 Advisor: Roger Hoy Nearly all modern off-road agricultural machinery are powered by petroleum, primarily diesel fuel. Equipment manufacturers work to improve fuel efficiency of their equipment to provide better value to their customers. Benefits of reducing petroleum use include lower operating costs, improved operational efficiency, improved energy security, and environmental benefits. Agricultural tractor testing focuses primarily on characterizing maximum performance but there is a need for advanced test procedures to better measure fuel efficiency for load cases representative of in-field operations. This would help farmers make better equipment purchasing and utilization decisions and help manufacturers quantify efficiency improvements; ultimately driving continued progress toward better efficiency. This research explored historic diesel fuel use for off-road agricultural machinery, current trends in improving diesel efficiency, and potential to better assess fuel efficiency with advanced test procedures. Additional work evaluated the accuracy of machine-reported data that has the potential to be used for creating advanced test procedures. Results showed that machine-reported engine speed is a good predictor of actual engine speed but there was statistically significant difference between measured torque and torque calculated from machine reported parameters. Tools for
4 collection and analysis of in-field machine data were also explored and an application was developed as proof-of-concept for SAE J1939 data logging and real-time analysis. Each of the software and hardware tools explored demonstrated advantages for individual use cases and provided practical options for J1939 field data collection. Chapter one is composed of information from a report titled Agricultural Industry Advanced Vehicle Technology: Benchmark Study for Reduction in Petroleum Use that was prepared for the United States Department of Energy and published by Idaho National Laboratory. Chapters two and three are being prepared for publication in Transactions of ASABE (American Society of Agricultural and Biological Systems Engineers) and Computers and Electronics in Agriculture, respectively.
5 3 Acknowledgements Special thanks to my family and NTTL staff for their support and encouragement through this journey. I would like to thank my advisor Dr. Roger Hoy and graduate committee members Dr. Joe Luck and Dr. Santosh Pitla for their support and guidance. Thank you to Brianna Hitt at the UNL Statistical Cross-disciplinary Collaboration and Consulting Lab for helping with statistical analysis of the lab data.
6 4 Table of Contents CHAPTER 1: PETROLEUM USE IN OFF-ROAD AGRICULTURAL MACHINERY Farm Diesel Use in the United States Tractor Diesel Efficiency Tractor Mechanics Engine Waste Heat Recovery Powertrain Remote Power (Hydraulic, Mechanical, Electric) Tires and Tire Pressure Implement Operations Secondary Fuel Use Conclusions CHAPTER 2: EVALUATION OF THE ACCURACY OF MACHINE REPORTED CAN DATA FOR ENGINE TORQUE AND SPEED Introduction Engine torque measurement J1939 CAN messages for torque estimation Fan torque estimation Data collection and analysis Results Sources of error Conclusions Suggestions for future work... 85
7 5 CHAPTER 3: TOOLS FOR CAN DATA COLLECTION Introduction Application development for J1939 field data collection Conclusions and suggestions for future work REFERENCES APPENDIX A - LabVIEW FRONT PANEL AND BLOCK DIAGRAM APPENDIX B - ENGINE TORQUE DATA APPENDIX C - TEST STATISTICS FOR TORQUE ERROR BASED ON SPEED AND LOAD INTERACTION APPENDIX D - MATLAB VEHICLE NETWORK TOOLBOX BASIC FUNCTIONS AND EXAMPLES
8 6 List of Figures Figure 1 Historical U.S. diesel consumption Figure 2 Estimated diesel use by harvested crop in 2010 for reduced tillage Figure 3 Cropping cycle and diesel use for corn with mulch tillage practice Figure 4 Farm diesel use and harvested acres Figure 5 Cost per acre for crop inputs Figure 6 Annual average specific volumetric fuel consumption for PTO and drawbar power for diesel tractors Figure 7 Annual average specific volumetric fuel consumption for PTO power by PTO power level for diesel tractors Figure 8 Annual average specific volumetric fuel consumption for drawbar power by drawbar power level for diesel tractors Figure 9 Discrepancy between existing performance tests and probable in-field load distributions Figure 10 Prototype waste heat recovery system developed by Behr Figure 11 Belarus 3023 tractor with electro-mechanical powertrain Figure 12 Rigitrac EWD120 tractor with electric powertrain Figure 13 ZF TERRA+ starter generator in combination with the continuously variable S- Matic transaxle Figure 14 AGCO ElectRoGator Figure 15 John Deere all-electric concept tractor Figure 16 Energy losses in mobile load sensing (LS) hydraulic applicaiton Figure 17 Pressure-flow curve for single pump, dual function... 36
9 7 Figure 18 ZF TERRA+ electrification schematic Figure 19 Trailer with electrically powered traction axle Figure 20 Electric pump drive and UX espray components schematic Figure 21 John Deere patent for round baler with electrically driven rollers Figure 22 John Deere patent for electrically driven threshing cylinder Figure 23 Galileo wheel with accordion-shape sidewall design Figure 24 Diesel use by operation for combines and tractors with implements Figure 25 Engine and dynamometer configuration Figure 26 Cross plot of measured vs. applied dynamometer torque load after calibration. 59 Figure 27 National Instruments cdaq-9174 with modules Figure 28 Stationary engine torque map as described in PGN EC1 Engine Configuration 1 for the John Deere 4.5 L engine used in this study Figure 29 Power system schematic Figure 30 Plot of actual fan torque and fan torque estimated with regression model Figure 31 Graph showing synchronization of J1939 EngSpeed (SPN 190) and analog dynamometer speed Figure 32 Cross-plot and linear regression of dynamometer speed and J1939 EngSpeed. 72 Figure 33 Engine speed sweep at full throttle Figure 34 Torque vs. engine speed plot showing J1939 EC1 - Engine Configuration Indicated Torque, calculated net engine torque, and dynamometer torque Figure 35 Torque Modes reported during no-load speed sweep on John Deere engine Figure 36 Torque error versus engine speed Figure 37 Torque error versus dynamometer torque
10 8 Figure 38 Cross-plot showing correlation of calculated net torque and measured torque. 82 Figure 39 Kvaser Leaf Light v2 USB-to-CAN interface Figure 40 Matlab graphic user interface for J1939 data collection application Figure 41 Plot showing data processed with Matlab j1939import() function Figure 42 Matlab GUI for decoding, sorting, and visualizing CAN parameters
11 9 List of Tables Table 1 Summary of dynamometer torque calibration results Table 2 Engine Configuration 1 messages from John Deere 4.5L engine Table 3 Fan power at various speeds provided by engine distributor. Torque was calculated from the power and speed values Table 4 Fan torque regression statistics for Microsoft Excel LINEST() regression Table 5 Engine Torque Modes for no-load speed sweep on John Deere 4.5L engine Table 6 Descriptive statistics for torque error Table 7 Test statistics for torque error comparing decreasing and increasing load direction for all data Table 8 Test statistics for differences between directions evaluated by speed Table 9 Test statistics for differences between directions evaluated by torque Table 10 Test statistics for error between calculated and measured torque for all loads Table 11 Least Squares Means test statistics for error between calculated and measured torque evaluated by speed Table 12 Least Squares Means test statistics for error between calculated and measured torque evaluated by torque Table 13 Summary of CAN tools used during this study Table 14 Messages included in database file for J1939 data collection application Table 15 John Deere 4.5L engine torque data Table 16 Test statistics for differences between loadings when speed is held constant Table 17 Test statistics for differences between speeds when load is held constant
12 10 CHAPTER 1: PETROLEUM USE IN OFF-ROAD AGRICULTURAL MACHINERY 1 Farm Diesel Use in the United States On-farm diesel use in the U.S. has remained relatively constant since 1985, but decreased slightly in 2009, which may be attributed to price increases and economic recession (Figure 1). During this time, the U.S. harvested area has also remained relatively constant at roughly 300 million acres. In 2010, farm diesel use was 5.4% of total U.S. diesel use. Crops accounting for an estimated 58% of U.S. farm diesel use include corn, soybean, wheat, hay, and alfalfa, respectively, based on harvested crop area and a recent analysis of estimated fuel use by crop (Figure 2) 1. Diesel use in these cropping systems is primarily from tillage, harvest, and various other operations (e.g. planting, spraying) (Figure 3). Diesel efficiency is markedly variabile due to machinery types, conditions of operation (e.g. soil type, moisture), and operator variability. Farm diesel use per acre has slightly decreased in the last two decades (Figure 4) and diesel is now estimated to be <5% of farm costs per acre (Figure 5). This chapter will explore current trends in increasing diesel efficiency in the farm sector. The report combines a review of literature and data analysis to identify nascent technologies for increasing diesel efficiency.
13 million barrels per day (mb/d) million barrels per day (mb/d) US 1.0 On-Highway Farm 0.0 Off-Highway (non-farm) Year Farm Off-Highway (non-farm) Year Figure 1 Historical U.S. diesel consumption: Farm includes all on-farm diesel use, and Off-Highway includes forestry, construction, and industrial. Source: DOE/EIA Annual Energy Review 2011 Table A) harvested area B) diesel use corn 13% soybeans 19% 6% 27% wheat 42% 13% hay, (excl alfalfa) 15% 16% 25% hay, alfalfa 6% 7% 11% other crops Figure 2 Estimated diesel use by harvested crop in 2010 for reduced tillage: A) harvested area by crop, 3 (Note: other crops consists of 28 individual crops.) B) estimated diesel use by crop (Source: diesel use for each crop estimated by multiplying harvested area by FEAT efficiencies 1 and subtracted from total fuel use to estimate fuel use for other crops).
14 million barrels per day (mb/d) gallons per acre harvested acres (millions) 12 chisel 9.4 L/ha tandem disk 3.7 L/ha field cultivator 6.9 L/ha fertilizer application 1.5 L/ha planter 4.1 L/ha sprayer, post emerge 1.2 L/ha sprayer, insecticide post emerge 1.2 L/ha harvest 14.3 L/ha tillage 47% planting & chemical application 19% harvest 34% Figure 3 Cropping cycle and diesel use per operation for corn with mulch tillage practice farm fuel harvested acres Figure 4 Farm diesel use and harvested acres , 3
15 13 $700 $600 $500 $400 $300 $200 $100 $0 pesticide fertilizer field operations (non-fuel) custom seed crop Insurance scouting irrigation fuel $3.50/gal and lube $700 $600 $500 $400 $300 $200 $100 $0 corn, no-till, dryland 2.9% 5.3% 2.4% 3.1% corn, conventional tillage, dryland corn, no-till, pivot irrigated corn, tilled, pivot irrigated Figure 5 Cost per acre for crop inputs. 5
16 Tractor Diesel Efficiency Although most mechanized agricultural operations include a tractor as a primary power unit, the tractor itself is not particularly useful without an implement attached. The implement has a task-specific design, which engages the soil or crop to carry out tillage, cultivation, harvest, and other operations. Most modern tractors provide power for implements via a drawbar, power take-off (PTO) shaft, and/or fluid power hydraulics. Much effort and focus has been directed at tractors because that is where the fuel is consumed to generate mechanical power. Innovations and efficiency improvements in tractor engines, powertrains, and auxiliary power systems have been ongoing since tractors were invented a century ago, and significant gains have been realized. Specific fuel consumption (SFC) (horsepower-hours per gallon, Hp-h/gal; or kilowatthours per liter, kwh L -1 ) for tractors tested at Nebraska Tractor Test Laboratory (NTTL) from 1958 to 2012 improved by 19.7% for PTO power and 23.4% for drawbar power when comparing data averaged over the last five years of this period versus the first five years of this period (Figure 6). It should be noted that trends based on NTTL data do not necessarily include all tractor models produced by industry (although for tractors sold in the U.S. there would be few exceptions); and minimum tractor power requiring an official test has increased over the years to eliminate the necessity of testing small tractors not intended for use in commercial agriculture (e.g. garden tractors).
17 kwh L PTO drawbar Figure 6 Annual average specific volumetric fuel consumption for PTO and drawbar power for diesel tractors. Source: NTTL data. Increased SFC was observed in tractors with higher PTO power levels, which may be due to parasitic loads being a smaller fraction of gross power as power levels increase (Figures 7 & 8). Reasons for the overall trend in improved SFC for PTO and drawbar operations are not well documented, but contributions include improvements in engine & powertrain efficiency, fuel systems, turbocharging, manufacturing (tighter tolerances, advanced materials, etc.), fuel & lubricants, reduction in parasitic loads (variable fans, closed center hydraulics, etc.), tire design (bias vs. radial tires), and machine setup & operation (optimal ballasting, shift-up-throttle-back, etc.). It should be noted that some high power tractors are intended primarily for high draft drawbar applications, and the PTO may designed to transmit only a portion of available engine power; therefore, SFC for PTO power may be skewed as it does not reflect full engine power efficiency in every case.
18 16 kwh L kw < kw < kw < kw < kw > 373 kw Figure 7 Annual average specific volumetric fuel consumption for PTO power by PTO power level for diesel tractors. Source: NTTL data kwh L kw 75 < kw < kw < kw < kw Figure 8 Annual average specific volumetric fuel consumption for drawbar power by drawbar power level for diesel tractors. Source: NTTL data. Standard test procedures (such as OECD Code 2, Standard Code for the Official Testing of Agricultural and Forestry Tractor Performance) are used to characterize tractor performance but do not evaluate efficiency for in-field operations where loads can vary
19 torque (normalized) 17 significantly (due to implement design and operator style, as well as, differences in crop, field, and soil characteristics) and have a combination of simultaneous power demands (e.g. drawbar, PTO, and hydraulic). An example of an engine torque curve and associated load points, as measured with OECD Code 2 procedures, along with a theoretical load distribution is shown in Figure 9. The actual distribution of loads for typical agricultural tractor operations is not known. Idle time is thought to be up to 20% to 30% of tractor run time and many processes do not require sustained operation at full load. Remaining operations are a variety of partial loads that are not captured in existing test procedures. If actual load distributions were known, advanced test procedures could be developed to better evaluate loads and related efficiencies that are more representative of in-field operations part load operations PTO 0.10 idle engine speed (rpm) full power lug curve PTO speed part loads varying speed & load Theoretical load distribution for in-field operations heavy draft Figure 9 Discrepancy between existing performance tests (black) and probable in-field load distributions (red). transport
20 Tractor Mechanics Described below are innovations still under development that are intended to further improve machine efficiency. Engine Nearly all modern tractors used in commercial agriculture are powered with diesel fuel. Although fuel economy is important to engine and machinery manufacturers, much effort and resources in recent years have been dedicated to meeting exhaust emissions regulations. Engine calibrations have been optimized to reduce exhaust pollutants in accordance with EPA emissions tiers. This was accomplished through several means, including in-cylinder combustion optimization, exhaust gas recirculation (EGR), etc., but did not include exhaust after-treatment (e.g. EPA Tiers 1-3). With the addition of exhaust after-treatment systems for the Tier 4 Interim stage, some engines require diesel exhaust fluid (DEF) to catalyze pollutants in the after-treatment system (e.g. urea), while other after-treatment systems inject diesel fuel into the exhaust stream to regenerate a diesel particulate filter (DPF) that traps particulate matter. Some manufacturers claim as much as 5% greater fuel efficiency for their Tier 4 Interim engines than that of Tier 3 models. 6,7 Yet, when evaluating fuel efficiency, variations in exhaust after-treatment systems should be considered due to trade-offs between consumption of diesel and DEF.
21 19 With the development of hybrid machines and electric powertrains, some manufacturers are implementing electrically powered, variable speed water pumps to reduce coolant flow with the intent of saving energy and fuel when full coolant flow is not needed. An alternate design has been researched and demonstrated a 1.7% improvement in fuel economy for a clutched two speed water pump (standard drive speed and 65% of that speed) with a planet gear drive and 4% improvement in fuel economy for a clutched on/off water pump when compared to a conventional belt driven water pump. These designs were evaluated on a chassis dynamometer with a test vehicle using the New European Driving Cycle (NEDC). While the effect of these clutched water pump designs is expected to be similar to an electric water pump with regard to improved cooling system performance, Shin, et.al. argues that inefficiencies in the conversion of energy between mechanical and electrical systems would hinder the efficiency of an electric water pump. 8 Engines can spend a notable amount of time at idle. A report of on-highway heavy duty diesel engines cites a near doubling of fuel consumption for an increase from 600/750 rpm to 1000 rpm. 9 Advanced engine controls are being introduced to reduce fuel consumption by lowering engine idle speeds and even shutting the engine off during extended idle periods. Examples of these strategies are cited in this report and are found in existing patent applications that show intentions of further development in these strategies. 10 Some efficiency gains are the result of changes in machine set-up and operation. Proper maintenance (clean filters, correct lubricants), adjustments (proper tire pressure), and ballasting (appropriate weight distribution for the conditions) affect fuel efficiency. One
22 20 study suggests that maintaining clean fuel and air filters can provide an average fuel savings of slightly more than 100 gallons annually for a farm tractor. 11 Cooling fans can be a significant parasitic load. Therefore, many modern tractors use variable speed or variable pitch fans that continually adjust to provide only the cooling needed and avoid unnecessary parasitic loads. However, if the radiator is not clean, the fan is not effective, and coolant temperature remains high; therefore commanding a higher fan speed. One cooling fan manufacturer reports, A marginal increase in fan speed of 600 rpm due to a clogged radiator leads to a doubling of necessary fan drive power. If the fan drive power rises from 9.5 to 19 kw, the resulting fuel consumption increases to about 0.92 gph (3.5 liters per hour). 12 Simply maintaining a clean radiator can have a direct impact on fuel consumption. Waste Heat Recovery Air conditioning systems powered by waste heat from engine exhaust gas and EGR coolers have been studied and are claimed to be capable of reducing fuel use and engine idling. 13 ClimateWell s Verdacc heat-driven air conditioning system is advertised to be available for new vehicle designs and retrofit for existing vehicles. According to their claims, this technology makes it possible to reduce fuel cost used for cabin comfort by up to 90%. 14 A patent filing exists regarding a device for recovering energy from an engine s exhaust stream with an electric machine that may consist of a generator or motor/generator that

23 21 may be part of a turbo charger. The recovered energy may be stored for later use or used directly to power the engine or machine functions and therefore improve the overall fuel efficiency of the system. 15 Behr has demonstrated a prototype waste heat recovery system that showed up to 5.2% efficiency improvement on a test rig. Their system, shown schematically in Figure 10, is conceptually similar to a small steam engine that converts thermal energy from engine exhaust into mechanical power that can be used directly or stored for later use. Efficiency gains were highest for the steady state portion of their long-haul truck test cycle. 16 For agricultural operations, these energy recovery and efficiency gains for steady state operation may lend themselves to applications such as tillage with sustained heavy draft loads. Figure 10 Prototype waste heat recovery system developed by Behr 16
24 22 Powertrain Traditional discrete gear transmissions provide a number of manually selectable gears for low speed, high draft field operations and for high speed, low load transport operations. While these transmissions provide an adequate range of operation for typical farm activities, their manual operation, and sometimes large step ratios, can force the engine to be operated at suboptimal speeds with respect to efficiency. Shift-up-throttle-back operation is known as an effective way to improve fuel efficiency. Procedures used by NTTL (based on OECD Code 2) include a reduced engine speed sequence at various drawbar loads that demonstrates the benefits of shift-up-throttle-back operation. For a load case of 75% of pull at maximum drawbar power, shift-up-throttleback operation typically results in 5% to 15% reduction in fuel consumption while still producing the same drawbar power. For a load case of 50% of pull at maximum drawbar power, shift-up-throttle-back operation typically results in 15% to 30% reduction in fuel consumption while still producing the same drawbar power. 17 Even though the benefit of shift-up-throttle-back operation is clear, it can be difficult for an operator to manage the throttle setting and gear selection for constantly changing loads during field operations. As powertrain designs evolve, additional gears with smaller step ratios have been added to transmissions to narrow the required engine operating range. By properly matching the engine and powertrain, and with the aid of advanced controls, the engine can operate in a relatively narrow range where it is most efficient.
25 23 Many transmissions require pressurized oil for clutch actuation and lubrication. Although the minimum required oil pressure may be different for each set of clutches that are actuated, and for the torque being transmitted at a given time, transmission oil systems often maintain constant pressure required for worst-case loads. A portion of this oil may be directed through a pressure reducing valve to lower the pressure for lubrication. Energy required to pressurize the portion of flow used for the low pressure lubrication circuit may be converted to heat as the pressure is reduced. Additional energy may be lost if the cooling fan has to run faster to reject this additional heat from the cooling package. Some manufacturers have separated these circuits to avoid pressure drop and associated energy loss for the lubrication flow. 18 A patent exists for a strategy to regulate transmission charge pressure in order to reduce pressure when it is not needed; for example, to regulate to high pressure for transport and regulate to low pressure for stationary operations when transmission clutches are not engaged. 19 John Deere s 24 speed dual-clutch transmission offered on their 6R series of tractors is expected to provide a 4 percent cut in fuel or a savings of up to 10 grams of diesel per kwh compared to an IVT transmission. 20,21 Although a manual mode is available that will allow the operator to select the desired gear, it is the enhanced controls of the automatic mode that leads to efficiency optimization. In automatic mode, the machine optimizes efficiency by selecting the appropriate gear to keep the engine in an efficient operating range for the desired speed and load. 21 Deere is also implementing their e23 transmission on their 7R and 8R Series tractors with 23 forward and 11 reverse speeds. Much like the 24 speed transmission described above, the e23 also offers a control feature that manages
26 24 the transmission for best fuel economy by automatically shifting up and throttling back while maintaining an operator selected ground speed. 22 As more gear ratios are added to a transmission, and step ratios become smaller, the opportunity to maintain operation at peak engine efficiency can grow. This concept leads to the evolution of a step-less transmission with an infinite number of ratios. Infinitely (or continuously) variable transmissions (IVTs or CVTs) allow the engine to work in a narrow, yet highly efficient, operating range while still providing full range of speed and torque to the powertrain. A number of CVTs have been marketed, and manufacturers are claiming notable fuel savings. Although mechanical power transmission is more efficient, it is the continuous variable characteristic of hydraulic and electric powertrains, and advanced integrated engine controls, that lead to overall improved system efficiency. Several manufacturers have developed hydro-mechanical CVTs. A study by Howard has shown that for partial load conditions (loads below 76% - 81% of maximum drawbar power at respective speeds) a CVT was more fuel efficient than a discrete gear transmission operated at full throttle; however, it was less efficient for loads near max power. When a shift-up-throttle-back strategy was used, the gear transmission had significantly lower fuel consumption at power levels 37% - 52% of maximum drawbar power at respective speeds. Howard s study indicated that, in general, the CVT was more efficient than the full throttle operation of the gear transmission, but the gear transmission with shift-up-throttle-back operation was more efficient than the CVT in the load and speed range tested. The gear transmission is inherently more efficient at transmitting
27 25 power as it lacks certain parasitic losses that accompany the CVT, but at the system and machine level, the CVT and system level controls can achieve efficiency improvements for some load conditions. 23 CNH claims their Puma Series Tractor can achieve as much as 25% reduction in fuel use when equipped with a CVT transmission and Diesel Saver Auto Productivity Management (APM). This integrated control system maintains an operator selected working speed at the most efficient operating points by automatically adjusting the engine and transmission. 24 Machine controls react to external loads but cannot anticipate future loads. By the time an engine or powertrain system reacts to a load, the event may have passed and a new condition is present that requires the machine to operate in a different way for optimum efficiency and performance. In the future, GPS technology may play a role in advanced powertrain controls for improved efficiency and performance. A patent for control of vehicular systems based on geo-referenced maps gives consideration to the idea that using geo-referenced data to anticipate operating conditions can improve efficiency and performance for tractors, combine harvesters, sprayers, and other agricultural machinery by preemptively adjusting transmission ratio, differential locks, and other machine settings prior to changes in slopes, crop conditions, and soil conditions. This concept may also be applied to hybrid systems where, for example, energy storage could be managed in anticipation of an upcoming downhill slope; energy currently stored can be used up prior
 tractor s electro-mechanical drivetrain, with a 300 hp engine powering a 220 kw generator, is claimed to have a")
28 26 to reaching the start of the downhill slope to free up storage capacity for energy that can be recovered while traveling down the slope. 25 Modern examples of electric CVTs are described below: The Belarus 3023 (Figure 11) tractor s electro-mechanical drivetrain, with a 300 hp engine powering a 220 kw generator, is claimed to have a fuel consumption reduction of 15% to 20%. 26 Optional equipment includes an electric cooling fan for the radiator, an electromechanical front PTO shaft that can operate at speeds independent of engine speed, and an autonomous electric power station for kw of auxiliary power. 27 Figure 11 Belarus 3023 tractor with electro-mechanical powertrain. 28 The Rigitrac EWD120 tractor (Figure 12), a project of the Technical University of Dresden and supported by Rigitrac Traktorenbau AG and other companies, includes independent electric wheel motors powered by a diesel-engine-driven generator. This

29 27 generator can also provide electric power for external implements. Because of the continuously variable characteristic of the electric powertrain, the diesel engine always works in its best fuel consumption map, and prototype documentation states that the electric drive system has a higher efficiency than the conventional drivelines. 29 Electric brakes and braking resistors allow braking energy to be converted to useful heat, (however, no description is provided on how this recovered energy is utilized). 30 No advertised claims regarding improvements in fuel efficiency have been found, although one source stated the transmission runs at 85% efficiency, compared with the 65%-70% of the hydrostatic units used on Rigitrac s standard machines. 31 Figure 12 Rigitrac EWD120 tractor with electric powertrain. 29 An electric hybrid powertrain, called the ZF TERRA+, was developed by ZF Friedrichshafen AG for agricultural tractors and self-propelled harvesters (Figure 13). A starter generator module integrated into the transmission provides electric energy for auxiliary functions and implements. 32 With the addition of a battery, the ZF TERRA+ can

30 28 become a hybrid system able to recover braking energy, provide short-term engine load relief, and allow the engine to work in a more efficient operating range; this system includes an electric transmission-oil pump. This company claims that when used in a tractor the optimum operation of electrified auxiliaries can achieve consumption benefits of about 5% on the average. 33 According to ZF, the ZF TERRA+ can be used to power electric drives on implements with improved efficiency and has up to 10% more power available as compared to conventional hydraulic drives. 34 Figure 13 ZF TERRA+ starter generator in combination with the continuously variable S- Matic transaxle. 35 A patent application for a Tractor with Hybrid Power System outlines a concept for a diesel-over-electric powertrain that includes energy recovery with battery storage. The concept also includes provisions for electrically powered variable speed PTO and an electrically powered hydraulic pump. The patent application stated that simulations of this hybrid system show 5% to 20% fuel savings depending on the type of implement used with the tractor. 36
 has 36% higher torque, 6% more power, 20% better fuel efficiency, and better performance than their conventional 1386")
31 29 AGCO has developed a prototype electrically-powered high-clearance sprayer that is claimed to deliver 35% more power to the ground than its conventional counterpart with the same engine. AGCO says the experimental ElectrRoGator 1386 electric sprayer (Figure 14) has 36% higher torque, 6% more power, 20% better fuel efficiency, and better performance than their conventional 1386 sprayer. On the prototype, braking energy is dissipated as heat through resistor grids, but work is being done to recover and store this energy for use by other machine functions. AGCO indicates that combine harvesters are also good candidates for electric drive technology where they can benefit from the improved efficiency and independent control of multiple machine functions. 37 Figure 14 AGCO ElectRoGator In 2016 John Deere revealed an all-electric concept tractor (Figure 15) equipped with two 150 kw electric motors powered by 130 kwh capacity battery packs. 38 The independent motors are used for propulsion and to power PTO and hydraulic systems. Full battery charge can work about four hours in normal use. 39


32 30 Figure 15 John Deere all-electric concept tractor: under-hood battery pack (left), working in field (right). 38 Electric and hybrid powertrains have been developed for several models of off-road industrial and construction equipment introduced for sale. Equipment types include crawler dozers, wheeled loaders, and excavators. Caterpillar s D7E, a crawler dozer, introduced for sale in 2009, has a diesel-over-electric drivetrain for primary propulsion and electric accessories including the AC compressor and water pump. Fuel savings of 10%-30% are being advertised, with some customers reporting larger savings in certain applications. Advertised claims also include 25% more material moved per liter of fuel. Fuel use can be reduced further on machines configured with an engine idle shutdown timer that can shut the engine off after a predetermined period of time at idle. 40
33 31 Deere is marketing a 644K hybrid electric wheeled loader with claims of up to 25% average reduction in fuel consumption (based on Deere s internal tests, including stockpiling, truck loading, and transport). 41 Although this machine does not have energy storage capability, the diesel-over-electric powertrain is capable of recovering energy that can reduce engine load and fuel consumption. 42 Komatsu s H205-1 hybrid excavator is claimed to have fuel savings of 25%-41%. Kinetic energy is captured during braking and is stored in an ultra-capacitor to be used for power assistance during the next machine cycle. Komatsu s literature suggests that the success of their hybrid system is due in part to the ability of ultra-capacitors to charge and discharge quickly for the high energy demand of the excavator, whereas battery storage would be too slow to be effective for this application. 43 Hyundai reportedly has also been working with ultra-capacitors for hybrid excavator designs. 44 Ricardo has developed a hybrid excavator demonstrator to show the benefits of their flywheel energy storage system and is claiming 10% fuel savings overall, with 30% fuel savings in some duty cycles. The composite flywheel, rotating at 60,000 rpm in a vacuum, can store 0.25 kw-h and deliver up to 28 Nm of torque. Ricardo is developing other flywheel storage models up to 1.25 kw-h. With 65% lower cost than battery hybrid systems, and still delivering 80% of the fuel economy, the flywheel hybrid system may be a good fit for machines with low volume production. 44
34 32 Caterpillar claims its 336E H hydraulic hybrid excavator uses up to 25% less fuel than a standard 336E with up to 50% greater efficiency in terms of tons of material moved per gallon of fuel. 45 The hydraulic hybrid design captures braking energy in hydraulic accumulators that is used to accelerate the machine in subsequent machine cycles. In addition to the hydraulic hybrid design, contributions to fuel savings also come from advanced engine controls, including engine idle shutdown and on-demand engine power that reduces engine speed when less power is needed. 46 A characteristic shared by these machines, which makes them good candidates for hybrid drive and energy recovery systems, is that they are cycling machines, meaning segments of their typical work cycle involve dissipation of kinetic energy during direction changes, braking/deceleration, lowering of implements, etc., to stage the machine for the next work cycle. Many agricultural field operations (e.g. tillage, planting, and harvesting) are primarily steady state with infrequent cycles and therefore have limited opportunity to recover kinetic energy. However, there may be potential for energy recovery strategies during braking/deceleration events for self-propelled chemical applicators or tractors utilized for transporting material. Remote Power (Hydraulic, Mechanical, Electric) Early tractors were essentially mechanical replacements for horses with the primary purpose of providing drawbar power to pull implements through the field. As tractors and farm machinery evolved, tractors took on additional capabilities to provide other types of power and controls for implements. Early belt drives were eventually replaced with a
35 33 power-take-off (PTO) shaft. A PTO consists of a rotating shaft to transmit mechanical power from the tractor to the implement at a standard speed of 540 rpm or 1000 rpm. Generally, PTOs operate at a fixed ratio of engine speed, although some modern tractors include an economy PTO mode that allows PTO operation at a reduced, but still fixed ratio of, engine speed for improved fuel efficiency. For example, PTO tests for a John Deere 5115M show fuel efficiency improvement of 7% to 24%, depending on load, when the PTO is operated on economy mode (540 rpm PTO speed at 1645 rpm engine speed) versus normal mode (540 rpm PTO speed at 2100 rpm engine speed). 47 Patents exist for variable speed PTO drives that can provide constant speed PTO at reduced or varying engine speeds. The variable speed concept allows for shift-up-throttleback transmission operation while still maintaining constant PTO speed and also enables controlling PTO speed as a ratio of ground speed, which may improve the efficiency of certain PTO driven implement operations. If the tractor configuration is such that the hydraulic pump drives are downstream of the variable PTO drive, this can enable the tractor s hydraulic pump(s) to be driven at constant speed regardless of engine speed and therefore maintain hydraulic system performance at reduced engine speed. 48 Another patent application describes the potential to use a similar variable speed PTO system; in this case, the PTO speed may be defined by GPS mapping and/or feedback from implements via ISO-bus with the goal of improving tractor and implement performance and efficiency. 49 Although PTOs have high power density and efficient mechanical power transfer, the rigid nature of the mechanical PTO shafts can also be difficult to package in new implement designs.
36 34 Hydraulic systems were later added to tractors to control basic implement functions such as raising and lowering implements and later rotary power for functions such as fans, augers, etc. Early hydraulic systems were quite simple, with fixed displacement pumps that operated a single function. As mobile fluid power systems evolved, they increased in complexity, and also in capability and efficiency, with the ability to control multiple functions simultaneously at variable pressure and flow. Modern pressure and flow compensated hydraulics have high power density and variable control for multiple functions. A modern implement may have many hydraulic functions with simultaneous fluid power demands. A planter, for example, may have hydraulic functions for raising/lowering, folding for transport, folding markers, row unit down-pressure, vacuum fan motors, and fluid pumps. A study by the Oak Ridge National Laboratory and the National Fluid Power Association concluded that across all industry sectors, of which agriculture is the second largest segment comprising 21.2% of total fluid power component sales, fluid power system efficiencies range from less than 9% to as high as 60%, with an average efficiency of 22%. Considering cumulative losses (including the transfer of power from the engine to the hydraulic pump, pump efficiency, line losses, valve losses, etc.) typical mobile hydraulic systems have an overall efficiency of approximately 14% (Figure 16). 50

37 35 Figure 16 Energy losses in mobile load sensing (LS) hydraulic applicaiton. 50 Typical modern hydraulic systems for mobile equipment have one or more hydraulically controlled variable displacement pumps to meet the demand of combined flow for all actuators in the system and also the pressure demanded by the function requiring the highest pressure. While this satisfies requirements of the function with the highest pressure demand, pressure for other functions has to be reduced to a level required for each respective load. Reduction of pressure occurs when the fluid is throttled through control valves, which achieves the desired result of providing pressure and flow appropriate for each function. However, with the exception of the function operating at highest pressure, large energy losses occur due to the pressure drop for the remaining loads, as illustrated in Figure 17. Energy is lost as heat, which can drive additional energy consumption from a cooling fan if this heat is dissipated through the machine s cooling system. Additionally, this hydraulic system configuration does not lend itself to effective energy recovery schemes, such as recovering kinetic energy from braking or recovering potential energy as actuators are lowered. 51

38 36 load 2 (low pressure) wasted energy load 1 (high pressure) Figure 17 Pressure-flow curve for single pump, dual function. 54 Research at Purdue University s Maha Fluid Power Center includes work on high efficiency mobile hydraulics. Significant fuel savings have been demonstrated on a hydraulic test bed machine that was used to study throttle-less hydraulic actuation. Meterless flow architecture allows flow from several smaller pumps to be paired with each individual actuator, thus eliminating the main control valve, which, as shown in Figure 16, is the location of greatest energy loss. The only control element is the pump displacement, and the unit automatically moves over-center to allow energy recovery. With this technology, hydraulic control valves are eliminated and control is instead achieved with displacement control or pump-controlled actuation. This technology is expected to provide fuel savings for multi-actuator machines used widely in construction, agricultural, and forestry industries with significant fuel savings already demonstrated on the test bed. Additional work is planned for a hydraulic hybrid configuration with a goal of 50% fuel
39 37 savings with no degradation of performance. This hydraulic actuation technology has been demonstrated on a wheel loader where measurements showed 20% higher fuel efficiency. Independent side-by-side testing at a Caterpillar facility demonstrated 40% fuel savings over the standard machine. 51 The Digital Displacement pump is another fluid power technology that shows promise for improving hydraulic system efficiency especially for part load conditions. A developer of this technology has claimed that replacing proportional valves and load sensing pumps in traditional fluid power systems with this digital displacement technology can provide double digit energy savings for off-road vehicles. 52 Hydraulic transformers for use with common pressure rail hydraulic systems are also under development with the hopes of overcoming inefficiencies of the current state-of-theart load sensing systems and metering valves. This concept eliminates the throttling losses of metering valves and is expected to have higher efficiency at part load than that of a load sensing pump. Market readiness of this concept and its efficiency are not known. 53 PTO and hydraulic power systems are well established and effective for today s applications, however, the search for more versatile and efficient power transfer continues. One alternative is electric power, which first debuted in 1954 on the Farmall Electrall tractor. The IH Farmall 450 had an integrated electric power generator that provided up to 10 kw of electric power for implements. Limited in part by availability of adequate electrical controls, the technology was not adopted at that time. 54
40 38 A recent source suggests electric drives would be suitable and beneficial for 28 drives on modern agricultural machines, 45% of which currently use hydraulic power and 55% which are mechanically driven. 55 Electric power enables variable speeds control so functions can operate independently of engine speed and use only the power and energy needed for the given function. This tends to be more efficient than power transmission via a PTO shaft or hydraulics. Tractor accessories that can be electrically powered include engine cooling fan, air brake compressor, air conditioner compressor, engine water pump, and hydraulic pumps. The alternator and starter can be eliminated in some cases if onboard electric power is available from a starter generator. 56 ISOBUS, a communication protocol for controller networks on agricultural machinery, is a key enabler for advanced controls that take advantage of torque and speed control capabilities of these electric systems. ISOBUS can be for control of tractor mounted accessories or communication and control between tractors and implements. According to ZF, the ZF TERRA+ starter generator (described on pages 27-28) can be used to power electric drives on implements (shown schematically in Figure 18) with improved efficiency and up to 10% more power available as compared to conventional hydraulic drives. ZF also offers a 50 kw PTO driven generator as a retrofit to provide electric power for implements. This unit can provide various voltage output configurations for independent control of two 25 kw electric drives. 34

41 39 Figure 18 ZF TERRA+ electrification schematic 32 John Deere has also designed for mobile electric power with two 7030E Premium Series tractors introduced in 2007 and the 6210RE in 2011; all of which are intended for the European market at this time. This is a more efficient alternative to PTO or hydraulic power transfer and can offer electric power for implements. The tractor can include outlets to power electric tools and other devices. Adoption of these tractors has been limited in part by the lack of availability of electrically powered implements. Another barrier to further implementation of electrically powered farm implements has been standardization of generator/implement voltage and electric connections for the tractor-implement interface. This is being evaluated by the Agricultural Industry Electronics Foundation (AEF) who is working to establish engineering standards for electrical components on farm equipment. 57 Replacing hydraulics with electric systems could displace petroleumbased fluid used in fluid power systems; however, power density for typical hydraulic systems (W/kg and W/m^3) can be more than an order of magnitude greater than that of
42 40 electric systems, making it difficult to transition to larger and heavier electric components needed to deliver the same performance. 50 A comparison test with a John Deere 7530 Premium showed that the 7530 E-Premium produced fuel savings of up to 13.8 percent when pulling a power harrow and 9.3 percent when pulling a trailer. In a DLG-PowerMix test, the 7530 E-Premium saved up to 5 percent compared to conventional tractors, including John Deere 7530 Premium, Deutz-Fahr Agrotron M 640, Fendt 820 Vario TMS, Case IH Puma 180, and New Holland T Fendt developed a concept tractor built from their 700 Series model that includes a 130 kw generator to power auxiliary functions on the tractor and provides electric power for implements. 59 The Fendt concept uses DC voltage, while Deere is using AC power for implements. Standardization of electric power for implements will be important for getting this technology to market and having compatibility with third party implement designs. A number of implement manufacturers have investigated electrification of implements to improve efficiency and productivity. Like electrified tractors, electrified implements have been primarily developed in the European market. A survey of Austrian manufacturers showed the following characteristics for electric drives: 55 Advantages: Controllability Easy torque and speed measurement Possibility for fault finding Ease of distribution of power High efficiency Overload capability Low noise level Disadvantages: High mass Space requirements Cost efficient standard components currently not available Robustness Safety requirements Interface problems Storage technology

43 41 Fliegl Agrartechnik GmbH is touting electrically powered axles on trailers as a way to improve material handling/transport efficiency (as shown in Figure 19). Due to design complexities and lack of adequate controls to adjust trailer ground speed to match that of the tractor, mechanical PTO power transfer to drive trailer axles has not been practical. Although these obstacles can be overcome with hydraulic power, it is a low efficiency alternative. Electrically driven trailer axles are easier to implement and are becoming practical with the introduction of power generators on tractors. This manufacturer claims that an electric system would be 65%-75% efficient as compared to the 25%-55% efficiency of a hydraulic system. Powered axles on trailers can allow a smaller tractor to transport a greater amount of weight, enabling the reduction of tractor ballast, which means energy is not expended in carrying an unproductive mass of ballast. 60 Figure 19 Trailer with electrically powered traction axle. 60
44 42 Kinze s 4900 planter is available with electrically driven seed and insecticide metering for high accuracy variable rate application of crop inputs. Other conventional drive options include hydraulic or ground drive configurations. 61 The electric drive configuration is powered by a hydraulically driven generator mounted on the planter. 62 Although no claims were found regarding reduction in fuel use or improved efficiency, this is an example of electrification of implements in the North American market, which currently does not offer tractors with onboard electric power. Kverneland Group (Norway) has also developed a variable rate precision seed drill where each planting unit is controlled independently with electric motors. 63 Graham Equipment has developed an Electric Planter Drive kit to retrofit existing planters. 64 Amazone has developed electric drives for precision seeding and a fully electric chemical applicator (Figure 20). Each major function on the UX espray trailed sprayer is powered independently with electric motors. Independent, fully variable control allows each function to be operated at optimum speed and load for the given conditions without being tied to tractor engine speed. 65


45 43 Figure 20 Electric pump drive (top) and UX espray components schematic (bottom). 65 Kuhn/Rauch has developed an electrically powered twin-disk fertilizer spreader that enables variable control of disc speed for more uniform fertilizer application. 66 A study of the Rauch Axis spreader showed that an electric drive configuration was most efficient and had the best tractor/implement fuel economy when compared to two hydraulic drive configurations and one mechanical drive configuration on this same model spreader. 67 One source reports Claas is investigating the use of electric drives for self-propelled forage harvesters and combine harvesters. 68 Patent filings by other parties further indicate investigation of agricultural machinery electrification. A patent for electrically powered

46 44 hay baler claims energy savings by optimizing machine functions for crop conditions (Figure 21). 69 A patent exists for a combine harvester with integrated electric motors powering grain threshing and conveying functions, as well as drive wheels, but makes no claims on efficiency gains (Figure 22). 70 Figure 21 John Deere patent for round baler with electrically driven rollers 69 Figure 22 John Deere patent for electrically driven threshing cylinder 70
47 45 Electrification of implements has the potential for energy savings through more efficient power transfer and savings from the precision agriculture perspective through more efficient and effective application of seed and chemicals. Parallel development of electrified tractors and implements, along with standardization of electric power protocols and hardware, will be key to further development of electrification of mobile agricultural equipment. 67 Tires and Tire Pressure Since their first use on agricultural tractors in the 1930 s, pneumatic tires have demonstrated significant benefits over steel wheels. A 1934 evaluation of steel wheels vs. pneumatic tires on a WC Allis-Chalmers tractor showed a 45% fuel economy advantage for the rubber tires. Since that time pneumatic tires have become the dominant traction device for agricultural tractors and implements. Early bias ply tires have been replaced in many applications with more efficient radial tires, with one source indicating radial tires have a 6% to 14% advantage over bias ply tires in traction, fuel efficiency, and reduced wheel slippage. 71 Improvements in tire performance continue to be realized as tire technology evolves. Michelin is indicating up to 25% fuel saving for their new Ultraflex technology agricultural tires that operate at lower than standard pressures 72 (although the baseline for this comparison is not clear). Firestone is indicating as much as 4% fuel savings for tractor tires with their AD2 Advanced Deflection Design compared to standard equivalent-size radial tires. 73
48 46 While tractors are primarily designed to operate off-road, ground conditions vary significantly. A tractor set up for optimum performance for tillage in sandy soil may have reduced efficiency when pulling a chemical applicator in heavy clay soils. Two variables on the tractor that affect this performance are tire pressure and ballast. Both parameters have been studied and show there is no single setting for all conditions. For example, proper ballast is achieved when the tractor has approximately 10% wheel slip when working on soil. Optimum ballast configuration changes as soil conditions and implement loads change. Performance related to tire pressure is similar, optimum tire pressure for one set of conditions is inefficient for others. A field demonstration showed an 8% average fuel savings for a four-wheel-drive tractor when operating with recommended tire pressures versus over inflated tires. A mechanical front-wheel-drive tractor showed an 11% improvement in field capacity and 26% improvement in fuel efficiency using tire pressure recommendations as compared to over inflated tires. Although this field demonstration was not a scientific study, it clearly indicates potential fuel savings with proper tire pressure. An on-farm study with selfreported data from four four-wheel-drive tractors doing fall tillage showed 5.3% to 10.3% improvement in fuel efficiency for properly inflated tires versus over inflated tires. 74 Effects of tire inflation pressure were studied for a tractor towing a trailer on paved roads. The test was repeated at several load levels with three different tire inflation pressures, each of which was within the recommended inflation pressure range indicated in the tractor operator s manual. Results clearly showed benefits of having the correct tire
49 47 pressure for the operating conditions, with up to 11.4% improvement in fuel economy (miles per gallon in this case) for the highest inflation pressure as compared to the lowest inflation pressure. 75 This study included only transport operations on paved roads and therefore did not have data showing likely benefits of low inflation pressures for off-road farm operations. A central tire inflation system (CTIS) marketed by Spicer is claimed to improve fuel efficiency by up to 3.3% and increase tire life by up to 10%. 76 This system includes an onboard air compressor and pneumatic control unit to allow the operator to increase tire pressure for travel on hard surface roads and decrease tire pressure for work in softer soils. Fendt is offering a factory installed tire pressure regulating system on their 900 Vario series of tractors with claims of up to a 10% fuel savings. The system is also capable of adjusting tire pressure on the tractor as well as towed implements. Fendt indicates the system is capable of increasing tire pressure by one bar (14.5 psi) in ten minutes and reducing by one bar (14.5 psi) in two minutes via command from an electronic operator interface in the cab. 77 Patents for central tire inflation systems owned by major industry OEMs (original equipment manufacturers) indicate interest in these systems for series production. Existing patents include systems not only for tires on tractors and prime movers but also for implements where inflation pressure may be managed based on predetermined soil maps and GPS position in real time or closed loop control based on soil characteristics or
50 48 dynamic axle loads measured in real-time. 78 Patents include combine harvesters where gross machine mass, and therefore tire loads, change during operation as harvested material is accumulated in an on-board storage bin or with different headers. 79 This principle could also apply to chemical applicators where gross machine weight changes as the payload is dispersed. Literature reviewed regarding central tire inflation systems suggested that, in addition to reduced fuel use and longer tire life, other benefits include increased crop production as a result of reduced soil compaction, increased traction/reduced slippage, improved operator comfort, and improved stability when driving on hard surface roads. A patent filing exists for a concept involving dynamically changing a vehicle s footprint during operation (described as a virtual-foot, or v-foot). Similar to the central tire inflation systems, claimed benefits include improving fuel efficiency by reducing rolling resistance and reduced soil compaction by increasing ground contact area, but also improved stability. However, in this case, the premise is to change the shape of the ground contact patch by one of several means, including changing the shape, stiffness, volume, or other properties of wheels, tracks, or tires by using polymers, magneto-rheological or electrorheological materials, changing gas pressure, changing a circular wheel into a generally triangular track, or changing width of ground contacting elements. The virtual-foot concept can include closed loop control, based on geographic zones with desired vehicle characteristics based on topography or soil characteristics. 80 Although improved fuel efficiency is claimed, this claim is not quantified.
 claimed to allow change in foot print area while maintaining consistent ground pressure distribution and fuel savings")
51 49 Galileo Wheel Ltd. has developed a tire with an accordion-shaped folding sidewall (Figure 23) claimed to allow change in foot print area while maintaining consistent ground pressure distribution and fuel savings through reduced rolling resistance and reduced slippage. At low tire pressures the sidewall folds, as opposed to a standard tire where the sidewall deforms and causes increased rolling resistance and generation of heat. 81 Figure 23 Galileo wheel with accordion-shape sidewall design. 81 There are clear benefits to having proper tire inflation pressures, but it is not clear if there is a net reduction in energy use when energy to power an air compressor is included. Data comparing energy consumed by tire pressure management devices (e.g. air compressors and associated hardware) versus energy saved by having optimally inflated tires was not found.
52 Implement Operations Secondary Fuel Use Although tractors are seen as the primary energy users because that is where fuel is consumed, implements drive the energy required by the tractor. While it is certainly justified to expend effort and resources on improving tractor efficiency, a tractor s primary purpose is to provide power to implements where work is done on the soil or crop. By improving implement efficiency a direct reduction in energy use is achieved. Tillage and harvesting operations have been shown to typically require the most energy (Figures 3 and 24). Although some research has focused on implement efficiency, reports related to engine, powertrain, and overall tractor efficiency are far more common. Reports on tillage implements equipped with sweeps and rolling coulters indicated the configuration of ground engaging components could be arranged to reduce draft requirements by up to 45% during field tests; 82 note that this does not involve design changes to the ground engaging tools, but simply changing their location and relative position on the implement frame. While it is not clear if this dramatic reduction in draft is achievable on a commercial scale or in all soil types, it does demonstrate potential for energy reduction requirements through optimization.
53 L/ha Figure 24 Diesel use by operation for combines and tractors with implements. 1 Tractor and implement designs have evolved over time becoming more productive and reliable, but performance of the tractor-implement system has largely been determined by the skill and experience of the operator. With modern electronic controls being applied to this equipment, tractor-implement-automation is becoming feasible. Tractor-implementautomation via controller area network (CAN), using ISOBUS communication protocols, can allow an implement to dynamically request changes in tractor parameters. This has been demonstrated on the John Deere 6030 Premium series tractors with a John Deere 864 round baler and with a Pöttinger Jumbo Loader Wagon, where the implements are allowed to request control of tractor parameters including travel speed, acceleration rate, and hydraulic and PTO controls. In the case of tractor-implement-automation applied to the
54 52 round baler, as the rate of material entering the baler changed, as detected by real-time sensors monitoring the volume of hay in the incoming windrow or by approximated PTO torque determined by the tractor, the baler requested changes in travel speed and the acceleration rate of the tractor to provide uniform flow rate into the baler. When the baler sensed the chamber was full, a request was sent to the tractor to stop, and the bale was automatically tied. Once the tying operation was complete, hydraulic controls were requested to activate and eject the finished bale. Benefits included increased productivity, avoidance of plugging the baler, reduced idle time, and more consistent bales. At this time, only implements certified by the tractor manufacturer can request control of select tractor parameters because some proprietary messages are used that are not specified in ISOBUS Class 3. ISOBUS Class 3 is the highest level of ISOBUS capability that allows the tractor electronic control unit (ECU) to receive and execute commands that are sent from implement ECUs. In the case of the John Deere 6R series tractors, tractorimplement-automation appears to be available in the European market but is not yet available in North America. 83 With no ability for an implement to control tractor hydraulics directly, some implement designs include auxiliary hydraulic valves installed on the implement itself where they can be controlled locally. In this case, the tractor hydraulics may be active continuously so fluid power is immediately available to the auxiliary valves to provide local control of implement functions. Maintaining continuous activation of the tractor hydraulics and throttling oil through a second set of valves can result in significant energy losses and heating of the oil. Additional parasitic losses may result if the tractor s cooling fan is
55 53 required to run faster to cool the hydraulic oil. Better integration of tractor and implement controls may reduce these inefficiencies. Improvements in combine efficiency include optimizing material flow through the threshing unit, reducing overall machine weight, and including advanced controls that adjust machine parameters to maximize operating efficiency. 84,85 Patents granted to major OEMs show that consideration has been given to the electrification of combine harvesters, but this has not yet shown up in the marketplace Conclusions Gradual increases in fuel efficiency have been measured since 1958 (Figures 6-8). Equipment manufacturers have responded to customer needs by investing in improved efficiency, driven in part by high fuel prices, but an improved efficiency measurement practice is needed. Equipment manufacturers are pursuing efficiency improvements from single components to the farming-system level. Many design concepts show promise at their respective levels and in a specific context, but effects at the machine and farming system level may not be captured with current industry-standard test procedures designed for verifying manufacturer s claims (e.g. OECD Code 2). During a September 2013 meeting of the U.S. OECD coordinating committee, OEM representatives reinforced the need for evolution of test procedures, with an example of evaluating tractors with CVT/IVT powertrains. Current tests evaluate performance at full-load and steady-state operating points, thus capturing the operating envelope of the tractor; however, current
56 54 practice does not represent in-field operations where loads often vary significantly with little sustained operation at full load. Current test procedures may show good efficiency for a traditional powertrain at full load, but may show low efficiency for a CVT/IVT powertrain under that same condition (section 1.2 Tractor mechanics: Powertrain). The inverse is likely true for part load conditions, which are likely more representative of infield operations. Test procedures more representative of field operations, comprised of simultaneous and varying draft, hydraulic, and PTO loads, are needed to better measure tractor efficiency and offer customers and manufacturers data needed to choose the most efficient equipment. Tractor fuel use is primarily dependent on the operation of implements, such as tillage and planting equipment. A direct reduction in energy use is achieved by improving implement efficiency or substituting implement types. Tillage and harvesting operations typically require the most energy (Figures 3 and 24). Yet, reports related to engine, powertrain, and tractor level efficiency are far more common than those regarding efficiency of implements and harvesters. Potential to increase efficiency exists for 1) selection and optimization of ground engaging tools to reduce draft, 2) improved power transfer to implements, and 3) in-field equipment utilization (Section 1.3). Little information has been found on harvester innovations related to petroleum reduction. More research is needed on diesel use associated with practical changes in implements and harvest equipment.
57 55 CHAPTER 2: EVALUATION OF THE ACCURACY OF MACHINE REPORTED CAN DATA FOR ENGINE TORQUE AND SPEED 2 Introduction To create advanced test procedures that are more representative of field operations, data from actual field operations are needed to determine magnitude, duration, and combination of loads to apply with test equipment. The most direct way to measure infield loads is by installing analog instruments on tractors and implements. For example, a load cell and radar to measure drawbar pull and ground speed, torque and speed sensors to measure PTO power, and flow meters and pressure sensors to measure hydraulic power. Some disadvantages associated with using analog sensors for in-field measurements include: Analog sensors and data acquisition systems are expensive and time consuming to install, especially if they need to be replicated on many tractors and implements. Analog sensors need to withstand shock, vibration, dust, moisture, and sometimes harsh temperatures of the off-road equipment operating environment. Analog sensors can be a hindrance for the tractor operator. Equipment configurations may need to be altered to accommodate sensors. Travel to the equipment is required for sensor installation and maintenance of the data acquisition system. Analog data may have to be merged with data from other sources including tractor and implement Controller Area Networks (CAN) and Global Navigation Satellite Systems (GNSS).
58 56 Modern off-road equipment use onboard sensors and computers which broadcast sensor information via CAN bus based on SAE J1939 and ISO11783 protocols. This information can be captured and used in lieu of analog sensor measurements in some cases. Hardware and software tools that interface with the machine CAN bus to interpret and record machine information are commercially available. If information from the CAN bus can be used in lieu of analog measurements there may be a significant savings in cost, complexity, and effort required to collect tractor and implement data in the field. Although there are advantages to using CAN data instead of analog measurements a primary concern is accuracy of the CAN parameters. Many CAN parameters are based on on-machine sensors, for which traceable calibration is not available, or parameters of interest may be based on software tables or calculations and are not actually measured directly. Before pursuing large scale field data collection based on CAN data some effort is required to verify the accuracy of parameters of interest. The objective of research described in this chapter was to evaluate accuracy of net engine torque determined from J1939 CAN messages. 2.1 Engine torque measurement An experiment was performed to determine how closely net engine torque based on J1939 CAN parameters correlated with torque measured with a dynamometer. Hardware used for this experiment included a four cylinder John Deere industrial diesel engine fitted with a TwinDisc SP111HP3 clutch and connected to a Dynamatic 1519DG eddy current dynamometer as shown in Figure 25. The Tier 3 John Deere model 4045HG485 engine

59 57 had 4.5 L displacement with nominal power of 115 kw at 2400 rpm. The dynamometer was equipped with an Interface 1110-JW load cell and Sensoronix EP10234 speed sensor and was controlled with a DynoOne EC1001C Eddy Current Dynamometer Controller. The load cell had dual outputs to provide a load signal to the dynamometer controller and a load signal to the data acquisition system. John Deere 4.5L engine TwinDisc clutch Eddy current dynamometer Figure 25 Engine and dynamometer configuration Dynamometer torque was calibrated in increments of Nm with certified weights. As calibration weights were incrementally applied, load cell voltage was recorded as an average over a 20 second duration at constant load. This process was repeated as the weights were incrementally removed. Load cell voltage for corresponding loading and
60 58 unloading points were averaged together to account for hysteresis from loading direction. A calibration table was made from the applied load and corresponding load cell voltage. The calibration table was applied to the load cell signal in the data acquisition software and weights were applied again to verify the calibration. Results are shown in Table 1 along with percent error for each load point. The largest error was 0.19% and the average error was 0.11%. Table 1 Summary of dynamometer torque calibration results DAQ Measurements Applied Load (Nm) Loading (Nm) Unloading (Nm) Average measured load (Nm) % error % % % % Values from Table 1 are shown graphically in Figure 26. A trend line was fit to the average scaled values. The coefficient of determination, or R 2 value, of was an indication of strong correlation between applied load and measured load.
61 59 Figure 26 Cross plot of measured vs. applied dynamometer torque load after calibration. The data acquisition system, shown in Figure 27 consisted of a National Instruments cdaq-9174 equipped with the following modules: NI Port High-Speed/FD NI-XNET CAN C Series Module NI 9219 Universal Analog Input, 24-Bit, 100S/s/ch, 4 ch Module NI V/TTL, Bidirectional Digital I/O, 8 Ch Module

62 60 Figure 27 National Instruments cdaq-9174 with modules A custom LabVIEW program was created to view and record data during the experiment. The graphic user interface and block diagram for this program are shown in APPENDIX A. The data acquisition system had three inputs: J1939 CAN, dynamometer torque (voltage signal), and dynamometer speed (digital signal). The LabVIEW software was configured to use the same sample clock for all signals to ensure synchronization of the collected data. Data were collected in waveform format at a rate of 20 Hz and were streamed to a LabVIEW Technical Data Management Streaming (.tdms) log file with no additional signal conditioning.
63 61 It should be noted that J1939 parameter groups are broadcast at varying rates and some are updated based on engine crank angle, or when a state change occurs, rather than at a specific time interval. 86 To ensure time synchronization of CAN signals with analog signals, the same analog sample clock was used to start the CAN data task and to resample CAN data at the same rate as the analog signals. A CAN database file (.dbc file) was used with NI-XNET to decode the J1939 messages in real time before writing the parameters to the log file. 2.2 J1939 CAN messages for torque estimation As described in SAE J and SAE J1939DA (Digital Annex), 87 static messages available in PGN EC1 Engine Configuration 1 provide information about the general shape of the engine torque curve and engine reference torque. Engine configuration data retrieved from the CAN bus for the John Deere 4.5L engine used in this study are shown in Table 2. Torque messages on the CAN bus were reported as a percent of engine reference torque which is the 100% reference value for all defined engine torque parameters 87. For the engine used in this study, engine reference torque is 700 Nm.
64 62 Table 2 PGN EC1 - Engine Configuration 1 messages from John Deere 4.5L engine. parameter name SPN Units Reported value EngSpeedAtIdlePoint1 188 rpm 800 EngSpeedAtPoint2 528 rpm 2470 EngSpeedAtPoint3 529 rpm 500 EngSpeedAtPoint4 530 rpm EngSpeedAtPoint5 531 rpm EngSpeedAtHighIdlePoint6 532 rpm 2470 EngPercentTorqueAtIdlePoint1 539 % 77 EngPercentTorqueAtPoint2 540 % 77 EngPercentTorqueAtPoint3 541 % 77 EngPercentTorqueAtPoint4 542 % 90 EngPercentTorqueAtPoint5 543 % 89 EngReferenceTorque 544 Nm 700 Torque values reported as percent of engine reference-torque were converted to engineering units using Equation 1. The stationary engine torque map as described in PGN EC1 Engine Configuration 1 for the John Deere 4.5 L engine used in this study is shown in Figure 28. Equation 1 torque (Nm) = percent torque (%) 100 EngReferenceTorque (Nm)
65 63 Torque rpm % Nm Point Point Point Point Point High Idle Point Figure 28 Stationary engine torque map as described in PGN EC1 Engine Configuration 1 for the John Deere 4.5 L engine used in this study. Engine friction torque values that correspond to the stationary engine torque values given in PGN EC1 are defined in PGN EC3 Engine Configuration 3 but the EC3 friction torque values were not reported for this engine. SAE J1939DA defines a set of messages in PGN Advertised Engine Torque Curve that may have been helpful in understanding the torque characteristics of this engine but these messages were also not reported for this engine. SAE J1939 defines Net Engine Brake Torque (Power) as: The measured torque (or power output) of a "fully equipped" engine. A fully equipped engine is an engine equipped with accessories necessary to perform its intended service. This includes, but is not restricted to, the basic engine, including fuel, oil, and cooling pumps, plus intake air system, exhaust system, cooling system,
66 64 alternator, and starter, emissions, and noise control. Accessories which are not necessary for the operation of the engine, but may be engine mounted, are not considered part of a fully equipped engine. These items include, but are not restricted to, power steering pump systems, vacuum pumps, and compressor systems for air conditioning, brakes, and suspensions. 86 Net engine brake torque is equal to the torque developed in the cylinders minus torque required to overcome engine friction and torque required to drive engine accessories. These loads that are necessary for operation of the engine but at the same time do not contribute to useful work are often described as parasitic loads. Engine parasitic loads can include: Engine friction Air intake restrictions Exhaust system restrictions Fuel pump Oil pump Coolant pump Alternator Fan Other accessories such as: air compressor, air conditioning compressor, etc. SAE J1939 defines several messages that can be used to calculate net engine brake torque. These messages and their abbreviated definitions from SAE J1939DA are given below: Actual Engine Percent Torque (SPN 513) The calculated output torque of the engine. The data is transmitted in indicated torque as a percent of reference engine torque. The engine percent torque value will not be less than zero and it includes the torque developed in the cylinders required to overcome friction.
67 65 Actual Engine Percent Torque Fractional (SPN 4154) The parameter is used in combination with SPN 513 Actual Engine Torque. The resulting actual engine torque will be calculated by adding these two parameters. Nominal Engine Friction - Percent Torque (SPN 514) The calculated torque that indicates the amount of torque required by the basic engine itself added by the loss torque of accessories. It contains the frictional and thermodynamic loss of the engine itself, pumping torque loss, and the losses of fuel, oil and cooling pumps. The realization can be done by a map dependent on engine speed and engine temperature and an offset value for additional loss torques. See SPN 2978 for an indicator that describes the possible inclusion of engine parasitic losses such as cooling fan, etc. in this parameter value. Estimated Engine Parasitic Losses Percent Torque (SPN 2978) The calculated torque that indicates the estimated amount of torque loss due to engine parasitics, such as cooling fan, air compressor, air conditioning, etc. It is expressed as a percent of Engine Reference Torque. The engine used for this study reported Actual Engine Percent Torque (Fractional) (SPN 4154) as a constant value of 1.875% which is outside its defined range of %. This parameter has a resolution of 0.125%/bit and an offset of zero. When the reported value of
68 % is divided by 0.125%/bit, the result is 1510 or Per SAE J1939DA, values of indicate this message is not available and so it will not be considered in subsequent torque calculations in this study. Estimated Engine Parasitic Losses Percent Torque (SPN 2978) was reported as a constant value of 130% which is outside of the defined data range of -125 to 125% for this parameter. The parameter has a resolution of 1%/bit and an offset of -125%. When the -125% offset is applied to the 130% reported value the result is or FF16. SAE J1939 specifies that undefined bytes should be sent as FF16 thus indicating this message is not 86, 88 defined for this engine so it will not be used in subsequent torque calculations. When the reported value for Estimated Engine Parasitic Losses Percent Torque is equal to FB16 it indicates that all parasitic losses calculated by the engine are included in the engine s Nominal Friction Percent Torque (SPN 514). 87 As described in the previous paragraph, the reported value for Estimated Engine Parasitic Losses Percent Torque is not defined for this engine and does not show that the parasitic load for the fan is included in the Nominal Engine Percent Torque data values.
.")
69 67 Figure 29 Power system schematic A schematic of the engine and dynamometer used in this study is shown in Figure 29. As described above, gross torque generated in the cylinders is characterized by Actual Engine Percent Torque (SPN 513). Parasitic loads, with exception of the cooling fan, are included in the definition of Nominal Engine Friction Percent Torque (SPN 514). Engine net brake torque is calculated from CAN parameters by subtracting Nominal Friction Torque from Actual Engine Torque and multiplying by Engine Reference Torque as shown in Equation 2. Equation 2 Net Torque (Nm) (ActualEng%Tq NominalEngFriction%Tq) = EngRefTorque 100
70 Fan torque estimation Information presented on the CAN bus indicates fan load is not accounted for in Nominal Engine Friction Percent Torque or Estimated Engine Parasitic Losses parameters so fan load will be accounted for separately. The engine sales distributor (Industrial Irrigation, Hastings, NE) provided fan power at various speeds as shown in Table 3. This fan load data does not correspond with the engine speeds of interest in this study so this data was used to create a model of fan torque as a function of fan speed. Table 3 Fan power at various speeds provided by engine distributor. Torque was calculated from the power and speed values. speed (rpm) power (kw) torque (Nm) According to fan laws, fan power is proportional to the fan speed cubed. 89 Because fan power is the product of torque and speed, fan torque is proportional to fan speed squared. Regression analysis using the available fan data provided a best fit equation to be used for
71 69 estimating fan loads for engine speeds of interest. A quadratic function of the form shown in Equation 3 was used to model fan torque as a function of speed. Equation 3 y = m x 2 This model provided logical values for the physical system where zero torque occurs at zero speed and as speed increases, fan torque increases at an increasing rate. Equation 4 shows the resulting model where fan torque is in Nm and fan speed is in rpm. The coefficient of determination, or R 2 value, of is an indication that this model for fan torque is a good fit for the original data. Additional regression statistics are shown in Table 4. Equation 4 fan torque = E 06 fan speed 2 Table 4 Fan torque regression statistics for Microsoft Excel LINEST() regression. constant base coefficient m E-06 coefficient of determination r standard error values for the coefficients mn sen E-09 The F statistic, or the F-observed value F regression sum of squares ssreg 5626 standard error for the y estimate sey degrees of freedom df 14 residual sum of squares ssresid Figure 30 shows fan torque calculated from information provided by the engine sales distributor along with values predicted with Equation 4.
72 70 Figure 30 Plot of actual fan torque and fan torque estimated with regression model. The drive ratio between the engine crank shaft and the fan was calculated from measured fan and engine speeds as shown in Equation 5. Fan torque was multiplied by this ratio to reflect fan load back to the engine. Equation rpm fan speed 800 rpm engine speed = Data collection and analysis For this study it was important to synchronize J1939 CAN data with analog data to enable valid comparison between reported and measured parameters. An indication of the level of synchronization is shown by comparing J1939 reported engine speed and measured
73 71 dynamometer speed. If the signals were not well synchronized large differences would be expected during transitions in engine speed. Figure 31 shows an over-plot of J1939 EngSpeed (SPN 190) and dynamometer speed. Included in Figure 31 is a plot of absolute difference, or error, in these signals along with statistics related to the error. The plot shows consistent error of approximately ±5 rpm across all speeds and mean error of 0.05 rpm with no perceivable change in magnitude during speed transitions. EngSpdError statistics rpm min -5.6 max 4.9 mean 0.05 standard deviation 1.2 Figure 31 Graph showing synchronization of J1939 EngSpeed (SPN 190) and analog dynamometer speed A cross-plot and linear regression of dynamometer speed and J1939 EngSpeed is shown in Figure 32. A slope close to one with an intercept of zero, along with an R 2 value of 0.999, are strong evidence of correlation of these speed signals.
74 72 Figure 32 Cross-plot and linear regression of dynamometer speed and J1939 EngSpeed Early in this project a significant amount of noise was seen in the analog torque signal, especially at speeds above 1700 rpm. Inspection of mechanical components revealed some imbalance in the driveshaft between the clutch and dynamometer. A bearing and yoke assembly was replaced and the driveshaft was dynamically balanced. Repair and balancing of the driveshaft helped reduce vibration but did not eliminate noise in the torque signal. The noise is not believed to be electrical in nature because no changes in signal quality were seen after trying different shielded instrument cables, load cells, amplifiers, and data acquisition modules. For the duration of this study no solution was found to reduce the noise in the torque signal. It is believed to be caused by dynamic (mechanical) interaction between the engine, clutch, and dynamometer and interaction between engine and dynamometer control systems.
75 73 Figure 33 Engine speed sweep at full throttle Figure 33 shows data from an engine speed sweep where speed was reduced from 2470 rpm, high idle engine speed, down to 1200 rpm. The noise in the torque signal was very apparent at engine speeds greater than 1700 rpm. From 1700 rpm down to 1300 rpm the torque signal was stable but at 1200 rpm the signal became unstable. Due to these findings only data from 1300 rpm to 1700 rpm are used in this study. This is unfortunate because data of interest for field data collection will include a broader range of engine speeds. Data were collected at steady state points while decreasing and then increasing engine speed in 100 rpm increments with the engine at full throttle. The engine was allowed to settle and remain at steady state for two to three minutes at each operating point. During this process, the maximum torque capability of the engine was found at each respective
76 74 engine speed. At each of the same 100 rpm engine speed increments, partial load (i.e. torque) measurements were also made. For these measurements the throttle was reduced until engine speed was at the desired value and then the dynamometer controller was used to apply varying amounts of torque. Torque was increased in 136 Nm increments and then decreased at the same intervals while being held at steady state for two to three minutes at each load increment. All data were recorded with no additional filtering or signal conditioning. Raw data were analyzed using DIAdem software. A twenty point, symmetric moving average was used to smooth the dynamometer torque signal shown in Figure 33. Torque was calculated from J1939 CAN parameters as described in Equation 2. An average of each signal was taken for each load point described above. Before comparison was made between dynamometer torque and J1939 calculated net torque the load from the cooling fan had to be accounted for. Average engine speed at each respective load point, along with the fan drive ratio, was used with Equation 4 to estimate fan torque. This fan torque estimate was then reflected back to the engine and subtracted from J1939 calculated torque to get the final estimate of net engine torque. A summary of calculated net engine torque and dynamometer torque is provided in the table in APPENDIX B and is also shown graphically in Figure 34. The difference between J1939 indicated torque, reported in EC1 Engine Configuration, and calculated net engine torque may be due to lack of Nominal Engine Friction parameters defined in PGN EC3 Engine Configuration 3. Nominal Engine Friction parameters reported in EC3 Engine Configuration would have
77 75 been subtracted from the corresponding J1939 Indicated Torque parameters bringing the Indicated Torque curve closer to calculated net engine torque and dynamometer torque. Figure 34 Torque vs. engine speed plot showing J1939 EC1 - Engine Configuration Indicated Torque, calculated net engine torque, and dynamometer torque. The engine used in this study was not installed in a chassis and so there were no powertrain, implement, or other external devices that can interact with the engine controls. For data collection performed at the machine level there may be other torque modes initiated by cruise control, torque limiting, braking system, transmission control, and others modes depending on engine and machine configuration. Engine Torque Modes (SPN 899) can be monitored to better understand the torque control status of the engine. 87 A no-load speed sweep for the engine used in this study showed changes in Engine Torque Mode (SPN 899) as the controlling feature changed with engine status. Three engine
78 76 torque modes can be seen with this simple speed sweep as shown in Table 5 and Figure 35. Table 5 Engine Torque Modes for no-load speed sweep on John Deere 4.5L engine reported torque mode 0 Engine Torque Mode (SPN 899) Description 87 Low idle governor/no request (default mode) Engine speed (rpm) 800 (low idle) 1 Accelerator pedal/operator selection > 800 and < High speed governor 2470 (high idle) Figure 35 Engine Torque Modes reported during no-load speed sweep on John Deere 4.5L engine
79 Results Descriptive statistics for overall error between calculated net engine torque and dynamometer torque are shown in Table 6. The range of error was 44.7 Nm for all data and, on average, calculated net engine torque was 15.3 Nm higher than dynamometer torque with a standard deviation of 12.0 Nm. Table 6 Descriptive statistics for torque error. all data decreasing load increasing load min error max error mean error error standard deviation During data collection it was noted that the toque level did not seem to return to the same value when approaching a load point from a different loading direction. A statistical test of the mean torque error was completed to compare increasing and decreasing load directions. This analysis showed that the assumption of equal variance was valid and no statistical difference in the mean error based on loading direction was found. Table 7 shows test statistics for torque error comparing decreasing and increasing load direction for all data. Test statistics for torque error comparing loading direction evaluated by speed are shown in Table 8, and test statistics for torque error comparing loading direction evaluated by torque are shown in Table 9. In each case the p-value was greater than the alpha level of Therefore, one would fail to reject the null hypothesis that mean increasing torque error is equal to mean decreasing torque error and conclude there is no
80 78 difference in the data with regard to loading direction. Accordingly, all data will be used in subsequent analysis and loading direction will not be considered. Table 7 Test statistics for torque error comparing decreasing and increasing load direction for all data. direction Method Mean 95% CL Mean Std Dev 95% CL Std Dev decrease increase Diff (1-2) Pooled Diff (1-2) Satterthwaite Method Variances DF t Value Pr > t Pooled Equal Satterthwaite Unequal Equality of Variances Method Num DF Den DF F Value Pr > F Folded F Table 8 Test statistics for differences between directions evaluated by speed. Simple Effect Comparisons of direction by speed level Least Squares Means. Adjustment for Multiple Comparisons: Holm-Tukey. Simple Effect Level direction direction Estimate Standard Error DF t Value Pr > t Adj P speed_1300 decrease increase speed_1400 decrease increase speed_1500 decrease increase speed_1600 decrease increase speed_1700 decrease increase
81 79 Table 9 Test statistics for differences between directions evaluated by torque. Simple Effect Comparisons of direction by torque loading level Least Squares Means. Adjustment for Multiple Comparisons: Holm-Tukey. Simple Effect Level Loading 136 Nm Loading 271 Nm Loading 407 Nm Loading Full Throttle direction direction Estimate Standard Error DF t Value Pr > t Adj P decrease increase decrease increase decrease increase decrease increase Analysis of error between calculated net engine torque and dynamometer torque showed that the torque error was different from zero and calculated torque was statistically higher than measured torque when evaluated overall and by speed and load. In each case the p- values were less than the alpha level of 0.05 and therefore one would reject the null hypothesis that the error is equal to zero and conclude that the calculated torque is statistically different than the measured torque. Table 10 shows test statistics for overall error between calculated and measured torque. Test statistics for error between calculated and measured torque evaluated by speed is shown in Table 11, and test statistics for error between calculated and measured torque evaluated by torque is shown in Table 12.
82 80 Table 10 Test statistics for error between calculated and measured torque for all loads. N Mean Std Dev Std Err Minimum Maximum Mean 95% CL Mean Std Dev 95% CL Std Dev DF t Value Pr > t <.0001 Table 11 Least Squares Means test statistics for error between calculated and measured torque evaluated by speed. speed Estimate Standard Error DF t Value Pr > t < < < <.0001 Table 12 Least Squares Means test statistics for error between calculated and measured torque evaluated by torque. loading Estimate Standard Error DF t Value Pr > t 136 Nm < Nm < Nm Full Throttle <.0001
83 81 All speed and load combinations were evaluated to look for trends corresponding to changes in speed and load. Table 16 in APPENDIX C shows test statistics for differences between loadings when speed was held constant. Table 17 in APPENDIX C shows test statistics for differences between speeds when loading was held constant. P-values for some speed and load combinations were less than the 0.05 alpha level indicating a statistically significant difference but for other speed and load combinations the p-value was greater than the 0.05 alpha level indicating no statistically significant difference between the respective loads at a given speed or speeds at a given load. No consistent trends in torque error were found based on speed or load. Torque error plotted versus engine speed (Figure 36) and versus dynamometer torque (Figure 37) show no apparent patterns or trends. Figure 36 Torque error versus engine speed.
84 82 Figure 37 Torque error versus dynamometer torque. A linear regression of measured torque on calculated torque showed a strong relationship where an R 2 value of 0.99 confirmed that measured torque explained 99% of variation in calculated torque. The regression equation shown in Figure 38 was quite close to a slope of one but with an offset of 23 Nm, indicating calculated torque is consistently higher than measured torque. Figure 38 Cross-plot showing correlation of calculated net torque and measured torque.
85 Sources of error In this study there were several potential sources of error. One such source had to do with the resolution of J1939 torque parameters that are reported as a percent of engine reference torque. Engine reference torque for this engine was 700 Nm which results in a resolution of 7 Nm for the two parameters used in the net engine torque calculation, Actual Engine Percent Torque and Nominal Engine Friction Percent Torque. If the high resolution Actual Engine Percent Torque - Fractional parameter (SPN 4154) had been available, torque resolution would have been 0.125% of Engine Reference Torque, or Nm for this engine. This improvement in resolution would have allowed for a much better evaluation of torque error. Another potential source of error comes from the fact that the J1939 reported torque parameters are not directly measured but instead originate from calculations or tables developed by the engine manufacturer. Conditions under which these parameters were developed are not known to the user of the J1939 data and may be different than conditions present when the user is collecting data. Differences could include oil viscosity and intake and exhaust restrictions. Also, the engine used for development of these parameters may have had different friction losses due to break-in and/or engine tolerances or different cooling system. It is believed that the mathematical model for the fan load was accurate based on the information available but other characteristics of the cooling package and air flow in the
86 84 local environment could affect these results. A detailed study of the cooling package and fan could be done but was not practical for this study. Although the dynamometer was calibrated with certified weights, some hysteresis was found in the torque signal that may contribute to the overall torque error in this study. Average dynamometer toque signal error was 0.11% and maximum error was 0.19%. In this study all torque measurements were attempted under steady state load conditions to exclude any dynamic effects. Torque during load transitions was excluded from the data analysis but mechanical vibration or other sources of signal noise may have contributed to overall error. 2.7 Conclusions SAE J1939 defines parameters that can be used to estimate net engine torque. Not all parameters were reported for the engine that was used in this study so additional work was done to model the parasitic load from the cooling fan to ensure all loads were accounted for. On average, J1939 calculated net engine torque was 15.3 Nm higher than dynamometer torque with an overall range in torque error of 44.7 Nm. Evaluation of torque error hysteresis based on loading direction showed no statistical difference in direction at an alpha level of 0.05 when evaluated by speed, load, and overall, indicating loading direction can be reasonably ignored in analysis. A linear regression of measured torque on calculated torque showed a strong relationship indicated by a high R 2 value. The error between calculated torque and measured torque was statistically greater than zero at
87 85 an alpha level of 0.05 when evaluated by speed, load, and overall. There was significant interaction between speed and load with regard to torque error, however, no consistent trends were found. Potential sources of error included low resolution of J1939 torque signals, mathematical modeling of the fan, possible error in analog signals, signal noise, and the fact that this study used a different engine and different environmental conditions than those used to develop of the J1939 torque parameters. Comparison of J1939 EngSpeed (SPN 190) and dynamometer speed showed that J1939 EngSpeed is a good predictor of actual engine speed. J1939 EngSpeed was used to verify synchronization of J1939 parameters and analog signals. 2.8 Suggestions for future work The source of noise in the dynamometer torque signal should be identified before conducting further tests. Steps as simple as installing a torsional damper in the driveline and refining the dynamometer PI controller may improve measurement quality. Reducing torque signal noise may allow for a more comprehensive evaluation across the entire engine operating range. Conclusions of this study are based on results obtained from a single engine. Additional testing is recommended with different engine models from the same, and different manufacturers, to provide a more thorough evaluation. Testing an engine that reports
88 86 Actual Engine Percent Torque Fractional (SPN 4154) and Estimated Engine Parasitic Losses Percent Torque (SPN 2978) would help evaluate the significance of the of J1939 torque resolution and ensure engine parasitic loads are accounted for by the engine manufacturer. In addition to evaluating more engines, the power of the statistical analysis could be improved by increasing the number of observations at each point of interest. With further testing, if it can be proven that the error between calculated net engine torque and dynamometer torque is consistent then it may be practical to simply apply an offset to the calculated torque to get closer estimation of actual torque.
89 87 CHAPTER 3: TOOLS FOR CAN DATA COLLECTION 3 Introduction Many hardware and software tools are commercially available for monitoring and logging J1939 messages from a tractor s CAN bus and implement bus (ISOBUS 11783). Some tools that have been used during this study are listed in Table 13. Table 13 Summary of CAN tools used during this study. hardware software result Vector CANcaseXL log CANalyzer viewed decoded parameters and logged raw messages to a Vector ASCII file (.asc) National Instruments 9862 NI-XNET High- Speed CAN Module Kvaser Leaf Light v2 Kvaser Leaf Light v2 LabVIEW CanKing Matlab decoded messages and resampled parameters in real time before logging data to a National Instruments Technical Data Management Streaming file (.tdms) viewed raw CAN messages and logged them to a text file (.txt) viewed decoded CAN messages and logged decoded parameters to a Matlab data file (.mat) All of these tools were successful at interfacing with the CAN bus and each has advantages for specific use cases. Considerations included: portability (i.e. powered via USB vs. external power supply, physical size, etc.) number of CAN channels supported ease of use (i.e. plug & play vs. having to create your own software to communicate with the device) cost software licensing ability to: o withstand harsh environmental conditions o use database file (.dbc) to configure specific parameters of interest and decode messages in real time o customize software for specific analysis o simultaneously read signals from analog sensors and merge this with CAN data o create a log file format compatible with other post processing software

90 Application development for J1939 field data collection Matlab software and Kvaser Leaf Light v2 hardware (Figure 39) were used to investigate the feasibility of field data collection with real-time data analysis. This software and hardware were chosen because of availability, cost, ability to use database files to decode data in real time, and ability to create custom software and user interface. A project was undertaken to create a graphic user interface and executable file to collect CAN data, convert it to engineering units, and log it to a file while completing some basic analysis of select J1939 CAN parameters. CAN bus connectivity with Matlab was facilitated with use of Matlab s Vehicle Network Toolbox (VNT). 90 VNT includes several functions for configuring CAN bus communication using Vector and Kvaser hardware and using database files (.dbc) for decoding CAN messages. 91 An advantage of using Matlab for this project was the ability to use native Matlab functions for custom analysis and visualization. Figure 39 Kvaser Leaf Light v2 USB-to-CAN interface 92
91 89 Devices and software that decode raw J1939 messages do so with industry-standard database files (.dbc). Most software used to monitor CAN messages include a database editor that allows messages and parameters to be added or edited in database files. For this study a large database was available but to reduce complexity of the project the database file was configured to include only a few messages of interest which are listed in Table 14. Of the seventy three parameters included in the database not all were supported by the John Deere 6135 tractor which was used for this project. Table 14 Messages included in database file for J1939 data collection application. message name PGN acronym number of parameters Engine Configuration EC1 27 Electronic Engine Controller EEC1 8 Electronic Engine Controller EEC3 9 Electronic Engine Controller EEC4 5 Engine Torque History ETH 19 Fuel Economy (Liquid) LFE1 5 Matlab Graphic User Interface Development Environment (GUIDE) was used to create the graphic user interface (GUI) shown in Figure 40. This GUI allowed a user to select a J1939 database file and specify bus speed before starting the CAN channel. When the CAN channel was started, streaming data was decoded and several parameters were shown on a time history plot. Real time analysis was done to generate a cumulative bivariate histogram with EngSpeed and ActualEngPercentTorque parameters. The histogram was shown visually on a 2D contour plot and a 3D bar graph. When logging was complete the user was able to stop the CAN channel and save the decoded messages. Collected data was processed to convert the parameter group structure to a Matlab
.")
92 90 structure-array where each message included just a time stamp vector and its group of decoded parameters. The program sorted messages to exclude those with empty parameters before saving the decoded message structure as a Matlab formatted file (.mat). Matlab deploytool Application Compiler was used to create a standalone application that was installed from an executable file without a Matlab license. Figure 40 Matlab graphic user interface for J1939 data collection application. A time history plot with four J1939 signals is shown at the top. The contour plot and 3D bar graph at the bottom are visualizations of a bivariate histogram of EngSpeed and ActualEngPercentTorque.
93 91 It is worth noting that net engine torque was not calculated for the histogram analysis described above. The intent was to generate a speed-torque histogram which required only relative values and so using the reported percent torque provided a satisfactory result for this proof-of-concept. Additional project-specific analysis can be added as needed to this GUI application. It is also important to note that because messages are broadcast at different rates, resampling of parameters from different messages may be required for specific analysis. J1939 CAN data is reported in hexadecimal format and is not directly human readable. Some data analysis software includes functions for importing raw J1939 data and converting it to decimal format for post processing. Matlab and DIAdem are two such software packages that were explored during this project. Matlab VNT includes a native function, canmessageimport(), that is intended to import and decode CAN messages but it was discovered that this function did not work for J1939 CAN messages. Matlab Technical Support was helpful in providing a workaround to enable the canmessageimport() function to work with J1939 CAN messages and indicated this functionality would be included in future releases of VNT. Once converted to decimal format Matlab was very effective for J1939 data analysis and visualization. See APPENDIX D for additional details. DIAdem software is able to import and decode J1939 data generated by a variety of CAN hardware and software tools including Vector ASCII files (.asc) that were used in this study. DIAdem offered an option to import Kvaser files with.log format but not the.txt
94 92 format available from CanKing. National Instruments Technical Support for DIAdem provided a method to import Kvaser.txt files into DIAdem that they intend to include in future releases. 3.2 Conclusions and suggestions for future work This project concluded with successful creation of a working proof-of-concept for a custom J1939 CAN data collection and analysis tool. However, this proof-of-concept program is not sufficient for widespread deployment or long-duration data logging. Optimization of the software should be investigated to speed up loop time with perhaps use of sub functions and/or different architecture such as producer-consumer parallel processing loops. Other opportunities may include improving data management to avoid generating a very large data array before saving it to a log file during prolonged operation of the program. Other features and functionality could include: Add functionality to the GUI to allow the user to determine which messages in the selected database are available on the CAN bus. Messages with empty parameters could be detected and excluded from the process by filtering PGN identifiers. The expected benefit would be faster loop time and reduced log file sizes. Allow the user to select hardware type and CAN channel from the GUI. Include additional error handling; for example, handle errors if the application is started before connection to CAN bus. Allow the user to dynamically select parameters for visualization in the time history plot(s). Consider using the Matlab animatedline() function instead of plot() function for visualization. Additional Matlab Vehicle Network Toolbox functions and examples from this study are given in APPENDIX D.
95 93 REFERENCES 1 Camargo, G. G., Ryan, M. R., and Richard, T. L. (2012). Farm Energy Analysis Tool, Version 1.1. The Pennsylvania State University: Last accessed 22Jan Annual Energy Review US Energy Information Administration. DOE/EIA- 0384(2011). 27Sept Last accessed 22Jan U.S. Department of Agriculture National Agricultural Statistics Service, 4 Natural Resources Conservation Service Energy Consumption Awareness Tool: Tillage. Accessed 15Jan Klein, R. and Wilson, R Nebraska Crop Budgets. University of Nebraska Lincoln Extension Last accessed 22Jan Tier 4 Are You Ready?. Caterpillar Inc Mlr.pdf. Last accessed 22Jan Meeting EPA 2012 Tier 4 Interim and EU Stage IIIB Emissions Customer FAQ ( hp). Bulletin Cummins Inc Last accessed 22Jan Shin, Y.H., Kim, S.C., and Kim, M.S. Use of Electromagnetic Clutch Water Pumps in Vehicle Engine Cooling Systems to Reduce Fuel Consumption. Energy. Volume 57. 1
96 94 Aug p Last accessed 23Jan Ashrafur Rahman, S.M., Masjuki, H.H., Kalam, M.A., Adebin, M.J., Sanjid, A., and Sajjad, H. Impact of idling on fuel consumption and exhaust emissions and available idle-reduction technologies for diesel vehicles A review. Energy Conversion and Management 74 (2013) Baroni, M., Sereni, E., and Mancarella, F. Engine control device for a work vehicle. Patent Application WO A1. 06June Schumacher, L.G., Frisby, J.C., and Hires, W.G. Tractor PTO Horsepower, Filter Maintenance, and Tractor Engine Oil Analysis. American Society of Agricultural Engineers Eauclaire-Kopier, M. Strike that, reverse it. OEM Off-Highway Magazine. 3 Dec Last accessed 21Jan Zhong, Y., Wert, K. L., and Fang, T. "An Adsorption Air-Conditioning System to Reduce Engine Emissions and Fuel Consumption for Heavy-Duty Vehicles." International Refrigeration and Air Conditioning Conference. Paper Last accessed 22Jan ClimateWell. Heat-driven Air Conditioning for Trucks & Vehicles. Last accessed 22Jan Perkins Engines Company Limited. Control System for an Engine Assembly. European Patent Application. EP A1. 18Sept2013.
97 95 16 Waste Heat Recovery By Behr Improves Fuel Economy For Long-haul Trucks. SAE International. 10 July Last accessed 22Jan Grisso, R., Pitman, R., Perumpral, J.V., Vaughan, D., Roberson, G.T., and Hoy, R.M., Gear Up and Throttle Down to Save Fuel. Virginia Cooperative Extension. Virginia Polytechnic Institute and State University M/972M Wheel Loaders. AEHQ7171 ( ) Caterpillar Laws, N.H., Copeland, J.R., Foxen, J.J., and Brandon, A.W. Charge pressure reduction circuit for improved transmission efficiency. US Patent US B2. 10 Sept Field Work Demonstrates John Deere Dual Clutch Transmission Benefits. Driveline News 1 Nov Last accessed 22Jan New 6R Series Tractors Offer More Power, Comfort, and Security. John Deere News Releases and Information /sep/agri_6r.page. Last accessed 22Jan John Deere introduces new 7R and 8R Series tractors. John Deere News Releases and Information. /2013/august/john_deere_introduces_new_7r_and_8r_series_tractors.page. Last accessed 24March2014
98 96 23 Howard, C. Testing Fuel Efficiency of Tractors with both Continuously Variable and Standard Gear Transmissions. University of Nebraska Lincoln Digital Commons. December Puma Series Tractors. CNH America LLC Last accessed 22Jan Watt, J.D., McMillen, R.E., Salzman, G.E., Orsborn, J.H., Faivre, S.M., Morrow, J.G., and Vogel, P.J., Control of vehicular systems in response to anticipated conditions predicted using predetermined geo-referenced maps. US Patent US A. 30 Nov Agritechnica: The electric age dawns. Profi International. 8 Nov Last accessed 22Jan Belarus Last accessed 22Jan Eckelkamp, M. Machinery Journal Silver Awards at Agritechnica (Part 1). AgWeb. 10 Nov art_1)_13738/. Last accessed 22Jan Herlitzius, T. Rigitrac EWD120. Technische Universitat Dresden Department of Agricultural Systems Technology. Last accessed 22Jan2014.
99 97 30 Research Project with the TU Dresden. Last accessed 22Jan Cousins, D. Agritechnica 2011: Rigitrac Shows Novel Diesel-Electric Tractor. Farmers Weekly. 19 Nov Last accessed 22Jan ZF drivelines for agricultural machines. ures/agricultural_machinery_flyer/broschuerelandmaschinen.pdf. Last accessed 22Jan ZF Terra: Starter Generator System. ZF Friedrichshafen AG. 9Nov ica_2009_pressemappe_1/03_zf-terra Startergenerator_System.pdf. Last accessed 22Jan Combining Mechanical and Electric - ZF develops systems that move another step toward ag tractor electrification. Diesel Progress North American Edition. p March ZF Press Kit Agritechnica 2009 Press Images. chnica_2009_pressemappe.html. Last accessed 21Jan Husson, G., Shute, M., and Menier, G. Tractor with Hybrid Power System. United States Patent Application Publication number US2013/ A1. 06 Nov 2013.
100 98 37 Lyseng, R. Behind the wheel of ElectRoGator The Western Producer. Sept. 2, Last accessed 21Jan Lambert, F., John Deere unveils latest all-electric tractor prototype for zero emission agriculture, Last accessed 9Feb Potter, B. John Deere's Electric Concept Tractor Sparks Interest, Last accessed 9Feb Caterpillar Inc. D7E (U.S. Tier 4 Interim/EU Stage IIIB/Japan MLIT Step 4). Last accessed 21Jan Flint, J. 644K hybrid features easy learning curve. Nebraska Farmer. p. 90. September John Deere 644K Hybrid Wheel Loader k_hybrid.page. Last accessed 21Jan Komatsu Hybrid: Best Performance Hybrid. Last accessed 21Jan Morey, B. Ricardo sees a future in flywheel hybrid excavators. SAE International. 28 June Last accessed 21Jan2014.
101 99 45 Stewart, L. Caterpillar s New Hydraulic Hybrid Excavator is 50%-Efficiency Next Generation. 16 Oct Last accessed 21Jan Caterpillar. Large Excavators - 336H Hybrid. Last accessed 21Jan Nebraska OECD Tractor Test 2038 Summary 837 John Deere 5115M Diesel 16 Speed. Nebraska Tractor Test Laboratory. University of Nebraska-Lincoln. 13Feb Rodeghiero, R.A., Stettler, W., Thompson, G., Klabunde, B., Skotnikov, A.V., and Deere & Company. Transmission for power take-off. US Patent Feb Huber, C., Morselli, R., Posselius, J., and CNH America LLC. PTO transmission system in a work vehicle. US Patent Application Number 13/984, Feb Love, L.J., Lanke, E., and Alles, P. Estimating the Impact (Energy, Emissions, and Economics) of the U.S. Fluid Power Industry. Oak Ridge National Laboratory UT- Battelle. ORNL/TM-2011/14. Dec Center for Compact and Efficient Fluid Power. Mobile Heavy Equipment High Efficiency Excavator (Test Bed 1). Last accessed 21Jan OFF-ROAD. Last accessed 27March2014
102 van Malsen, R., Achten, P., and Vael, G. Design of Dynamic and Efficient Hydraulic Systems Around a Simple Hydraulic Grid. SAE Society of Automotive Engineers Stoss, K., Sobotzik, J., Shi, B., and Kreis, E. Tractor Power for Implement Operation - Mechanical, Hydraulic, and Electrical: an Overview Agricultural Equipment Technology Conference. American Society of Agricultural and Biological Engineers. Jan Karner, J., Heinrich, P., and Kogler, F. Electric Drives in Agricultural Machinery. International Conference of Agricultural Engineering CIGR-Ageng Last accessed 21Jan Buning, E. Electric drives in agricultural machinery - approach from the tractor side. Club of Bologna, 21 st Annual Meeting. Nov Last accessed 21Jan Garvey, Scott. Electric drive is on the horizon. 22 March Last accessed 21Jan Onnen, M., Coming Soon- Tractor Electrification. Resource Magazine, Vol. 18, No. 5, Page 16-17, Sept/Oct Partico, J. Hybrids Are Here Almost. p. PF-18, PF-20. The Progressive Farmer. Winter Issue 2013.
103 Drive Axle PowerDriveElect - Transport concepts with drive axles over the course of time. Fliegl Agrartechnik. Last accessed 21Jan Kinze 4900 Planter Literature. Feb Last accessed 21Jan Mckelkamp, M. Kinze s 4900 Series Electric Planter, 4000 Series Row Unit and Electric Meter. Ag Web. 28 Jan nd_electric_meter/. Last accessed 21Jan Optima e-drive. Kverneland. Equipment/Precision-Drills/Features/Optima-e-drive. Last accessed 21Jan Graham Electric Planter Drive. Last accessed 19June UX espray trailed sprayer. GO for Innovation Amazone. Last accessed 21Jan Agritica.com. Electrically-powered Kuhn/Rauch fertilizer spreaders offer ultraaccurate application Hahn, K. High Voltage Electric Tractor-Implement Interface. SAE International Journal of Commercial Vehicles. Volume 1 Issue 1 p Farmers Guardian Magazine. Agritechnica 2011: An electric revolution in the offing 24 November
104 102 sales/events/agritechnica-2011-an-electric-revolution-in-the-offing/43086.article. Last accessed 21Jan Deere & Company. Round baler with electrically driven roller. European Patent Specification. EP B Favache, S., and Deere & Company. Harvesting Machine with Electrically Driven Material Conveyor and/or Material Processing Device US Patent Application Publication No. US 2002/ A1. 16 May Brodbeck, K.N. Choosing the Right Tire ASAE Distinguished Lecture # 28, pp Agricultural Equipment Technology Conference, 8-10 February 2004, Louisville, Kentucky USA. ASAE Publication Number 913C Proof of Performance. Michelin Agricultural Tires. Last accessed 21Jan Advanced Deflection Design. Firestone Farm Tires. Last accessed 21Jan Wood, R.K., and Mangione, D.A. Tractive Benefits Of Properly Adjusted Inflation Pressures: Farmer Experiences. Applied Engineering in Agriculture Vol. 10(1): American Society of Agricultural Engineers Udompetaikul, V., Upadhyaya, S.K., and Vannucci, B. The Effect Of Tire Inflation Pressure On Fuel Consumption Of An Agricultural Tractor Operating On Paved Roads. Transactions of the ASABE Vol. 54(1): American Society Of Agricultural and Biological Engineers ISSN
105 DANA Spicer Central Tire Inflation System (CTIS) Enhanced Mobility For Agricultural Vehicles Last accessed 22Jan Fendt 900 Vario Last accessed 22Jan Wendte, K.W. CNH America LLC. Tire Inflation System For Use With An Agricultural Implement. US Patent B2 4Dec Adams, B., Schmitz., G.W., Case Corporation. Automatic Central Tire Inflation System. US Patent Nov Anderson, N.W. Vehicle Stability and Traction Through V-Foot Shape Change. US Patent Application Publication No. US 2013/ A1. 21 Feb Galileo Wheel Redesigning the Tire. Last accessed 23Jan Johnson, C.E., Burt, E.C., Morrison, J.E., Bailey, A.C., and Way, T.R. Energy Reduction in Sweep Tillage Systems. Paper Number: American Society of Agricultural Engineers von Hoyningen-Huene, M., and Baldinger M. Tractor-Implement-Automation and its application to a tractor-loader wagon combination. Last accessed 15May EauClaire-Kopier, M., Go with the energy flow. OEM Off-Highway Magazine. p Sept 2013.
106 ASABE AE50 Outstanding Innovation Award Cruise Pilot Claas of America American Society of Agricultural and Biological Engineers Last accessed 22Jan SAE J Surface Vehicle Recommended Practice, Vehicle Application Layer, Society of Automotive Engineers, October SAE J1939DA - Digital Annex of Serial Control and Communication Heavy Duty Vehicle Network Data, Society of Automotive Engineers, November Watler, R.P.,Walter, E.P. Data Acquisition from HD Vehicles Using J1939 CAN Bus. Werrendale, PA: SAE International, Goering, C.E., Stone, M.L., Smith, D.W., and Turnquist, P.K. Chapter 9 Cooling systems. Off-Road Vehicle Engineering Principles, p St. Joseph, Mich. American Society of Agricultural Engineers Matlab Vehicle Network Toolbox. (2016). Retrieved from MathWorks: 91 MathWorks. (2016). Vehicle Network Toolbox User's Guide. Natick, MA: The MathWorks, Inc. 92 Kvaser Leaf Light HS v2 J Last accessed 9Feb2017

107 APPENDIX A - LabVIEW FRONT PANEL AND BLOCK DIAGRAM 105
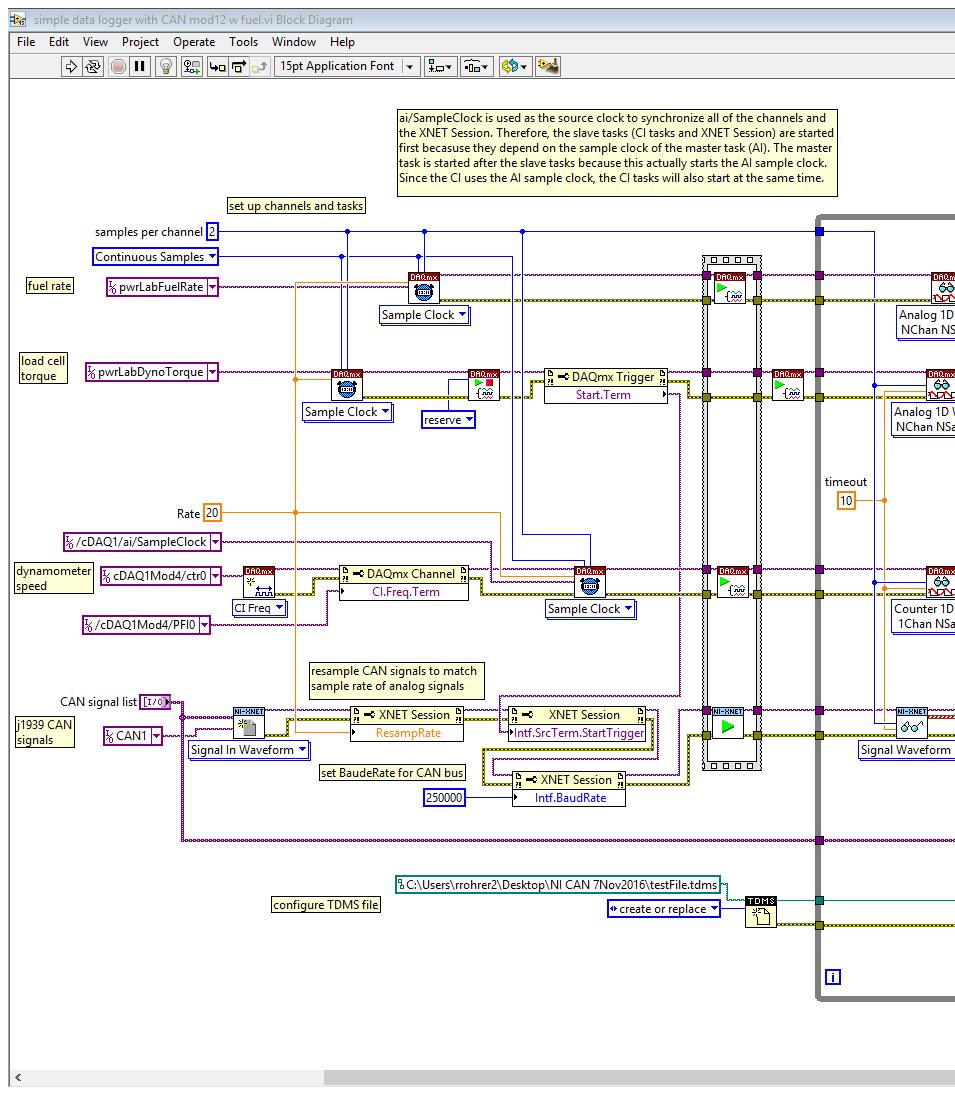
108 106
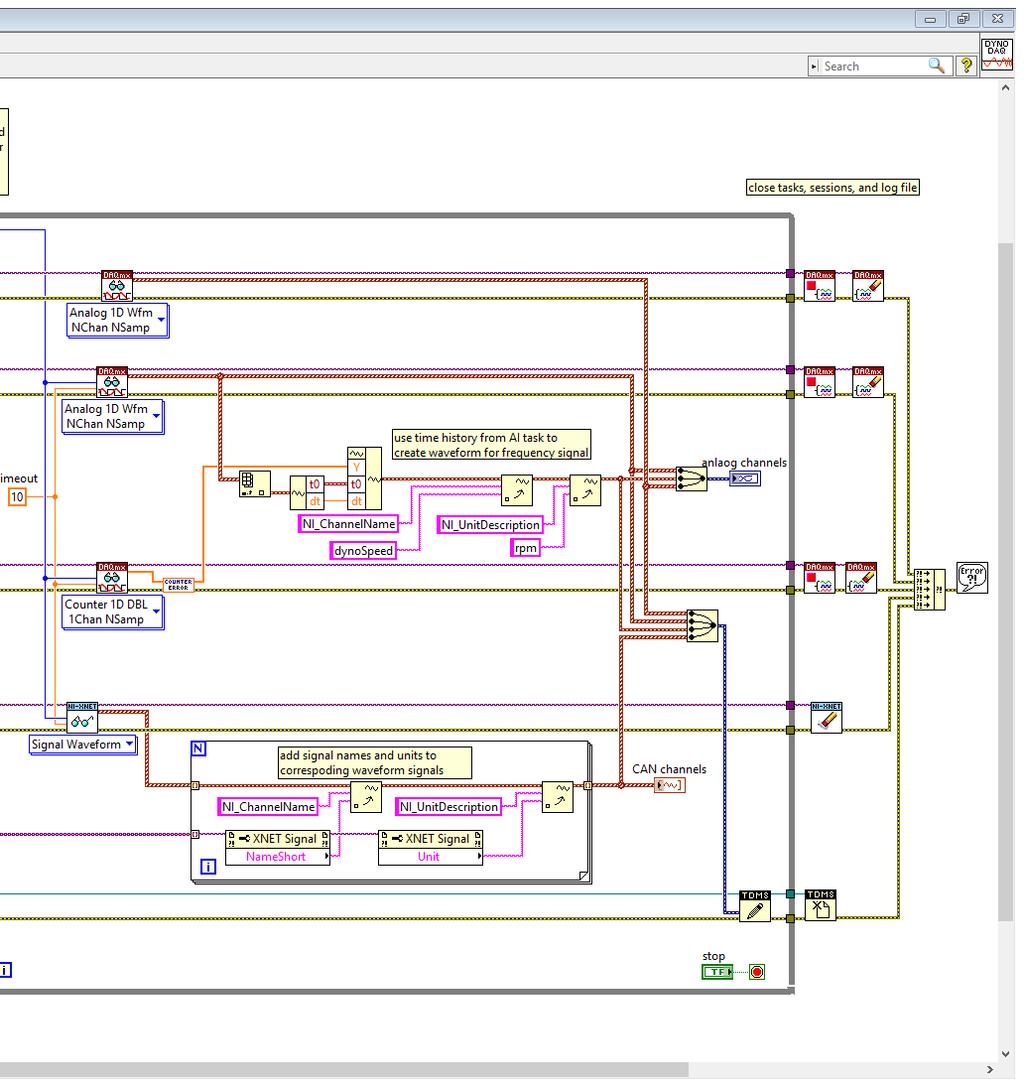
109 107
110 108 APPENDIX B - ENGINE TORQUE DATA Table 15 John Deere 4.5L engine torque data. 407 Nm part load 271 Nm part load 136 Nm part load full throttle engine speed J1939 calculated torque fan torque calculated net engine torque dynamometer torque torque error (rpm) (Nm) (Nm) (Nm) (Nm) (Nm) (%) loading direction % spd % spd % spd % spd % spd % spd % spd % spd % spd % spd % tq % tq % tq % tq % tq % tq % tq % tq % tq % tq % tq % tq % tq % tq % tq % tq % tq % tq % tq % tq % tq % tq % tq % tq % tq % tq % tq % tq % tq % tq
111 109 APPENDIX C - TEST STATISTICS FOR TORQUE ERROR BASED ON SPEED AND LOAD INTERACTION. Table 16 Test statistics for differences between loadings when speed is held constant. Simple Effect Comparisons of speed_lev*loading Least Squares Means By speed_level Adjustment for Multiple Comparisons: Holm-Tukey Simple Effect Level speed_level 1300 speed_level 1300 speed_level 1300 speed_level 1300 speed_level 1300 speed_level 1300 speed_level 1400 speed_level 1400 speed_level 1400 speed_level 1400 speed_level 1400 speed_level 1400 speed_level 1500 speed_level 1500 loading_perc loading_perc Estimate Standard Error DF t Value Pr> t Adj P <.0001 < Full Throttle < Full Throttle Full Throttle <.0001 < <.0001 < Full Throttle <.0001 < Full Throttle <.0001 <.0001
112 110 Simple Effect Comparisons of speed_lev*loading Least Squares Means By speed_level Adjustment for Multiple Comparisons: Holm-Tukey Simple Effect Level speed_level 1500 speed_level 1500 speed_level 1500 speed_level 1500 speed_level 1600 speed_level 1600 speed_level 1600 speed_level 1600 speed_level 1600 speed_level 1600 speed_level 1700 speed_level 1700 speed_level 1700 speed_level 1700 speed_level 1700 speed_level 1700 loading_perc loading_perc Estimate Standard Error DF t Value Pr> t Adj P <.0001 < Full Throttle Full Throttle < Full Throttle <.0001 < <.0001 < Full Throttle <.0001 < Full Throttle <.0001 < Full Throttle <.0001 < Full Throttle Full Throttle
113 111 Table 17 Test statistics for differences between speeds when load is held constant. Simple Effect Comparisons of speed_lev*loading Least Squares Means By loading_perc Adjustment for Multiple Comparisons: Holm-Tukey Simple Effect Level (Nm) speed_level speed_level Estimate Standard Error DF t Value Pr> t Adj P loading_ loading_ <.0001 <.0001 loading_ < loading_ < loading_ <.0001 <.0001 loading_ <.0001 <.0001 loading_ <.0001 <.0001 loading_ loading_ loading_ loading_ loading_ loading_ loading_ loading_ loading_ loading_ loading_ loading_ loading_ loading_ <.0001 <.0001 loading_ loading_ loading_ loading_ loading_ loading_
114 112 Simple Effect Comparisons of speed_lev*loading Least Squares Means By loading_perc Adjustment for Multiple Comparisons: Holm-Tukey Simple Effect Level (Nm) speed_level speed_level Estimate Standard Error DF t Value Pr> t Adj P loading_ loading_ loading_ loading_ Full Throttle loading_ Full Throttle loading_ Full Throttle loading_ Full Throttle loading_ Full Throttle loading_ Full Throttle loading_ Full Throttle loading_ Full Throttle loading_ Full Throttle loading_ Full Throttle <
115 113 APPENDIX D - MATLAB VEHICLE NETWORK TOOLBOX BASIC FUNCTIONS AND EXAMPLES Matlab Vehicle Network Toolbox (VNT) provides functions that can be used to create a custom scripts for CAN bus communication as well as a GUI for accessing and logging CAN data. This GUI, called Vehicle CAN Bus Monitor, can be accessed from the Matlab Command Window with the command cantool or from the Matlab APPS menu. The Matlab VNT web page includes a comprehensive list of VNT functions along with many examples. The sections below describe some basic functions used in this study. Matlab functions for basic J1939 communication The short script provided below includes basic functions required to connect to CAN hardware and receive messages from the J1939 CAN bus. When the script is executed J1939 parameter groups are stored in the pgrx variable in the Matlab Workspace. This data structure can be saved as a Matlab data file (.mat) for future analysis. Continuous logging can be accomplished by using a loop function. % Load a database file configured for messages and parameters of interest. db = candatabase('j1939databasefile.dbc'); % Create a CAN channel for the hardware and CAN channel that will be used. % Example channel setup for Vector: rxch = j1939channel(db,'vector','cancasexl 1',1) % Example channel setup for Kvaser: rxch = j1939channel(db,'kvaser','leaf Light v2 1',1)
116 114 % Configure CAN bus speed: generally 250k or 500k for offroad machinery with J1939. configbusspeed(rxch,500000); % Now that the CAN channel has been configured, start the CAN channel. start(rxch) % Receive messages from the CAN channel and store them in a variable. pgrx = receive(rxch,inf) pgrx(1) % When done receiving messages stop the CAN channel to release resources. stop(rxch) Import raw J1939 CAN data from Vector ASCII (.asc) files or Kvaser text (.txt) files Matlab Vehicle Network Toolbox includes native function canmessageimport() that is intended to import CAN data in hexadecimal format from Vector ASCII (.asc) files or Kvaser text (.txt) files. These data files would be logged using Vector or Kvaser software. The canmessageimport() function uses a database file (.dbc) to decode hexadecimal CAN messages with the output being scaled engineering units. During this study it was discovered that this function did not work for J1939 messages. Matlab Technical Support confirmed this and provided j1939import () function as a work-around. The basic commands are provided below to show an example of how this function can be used, however, this work-around requires an additional Matlab file to be placed in a program directory. Additional details are not provided here as Matlab Technical Support indicated they intend to include this in future releases of Vehicle Network Toolbox. Figure 41
117 115 shows a plot of engine speed from CAN data that was decoded with the j1939import() function. % Load a database file configured for messages and parameters of interest. db = candatabase('j1939databasefile.dbc'); % Import Vector ASCII (.asc) file or Kvaser text (.txt) file. % Example j1939 import for Vector file: pgs = j1939import('vectordatafile.asc', 'Vector', db); % Example j1939 import for Kvaser file: pgs = j1939import('kvaserdatafile.txt', 'Kvaser', db); % Extract all signals from parameter group. pgs(1) pgs(1).signals % Get group of signals for Electronic Engine Configuration 1 (EEC1) parameter group pgs_eec1 = pgs(strcmp('eec1', {pgs.name})); EEC1_Signals = [pgs_eec1.signals]; % Plot EngSpeed vs. EEC1 Timestamp plot([pgs_eec1.timestamp], [EEC1_Signals.EngSpeed]); hold on; % Get group of signals for Electronic Engine Configuration 3 (EEC3)parameter group pgs_eec3 = pgs(strcmp('eec3', {pgs.name})); EEC3_Signals = [pgs_eec3.signals]; % Plot EnginesDesiredOperatingSpeed vs. EEC3 Timestamp plot([pgs_eec3.timestamp], [EEC3_Signals.EnginesDesiredOperatingSpeed]); legend('engspeed','enginesdesiredoperatingspeed');
118 116 Figure 41 Plot showing data processed with Matlab j1939import() function. Sorting and visualizing CAN data with Vehicle Network Toolbox The j1939import() function allows access to the decoded parameters but the data is still in a Parameter Group data structure. The Matlab commands below can be used to create a Matlab structure array with just the messages and their associated timestamps in a more concise and easy to use data structure. % Initialize data array. msgstructure = [] % Get the number of messages in the database. dbmessages = db.messages; nummsgs = length(dbmessages);
119 117 % Use for-loop to iterate through each message to extract the signals. for i = 1:numMsgs % Get Parameter Group name. structname = char(dbmessages(i)); % Extract data for each respective message. msgdata = extractall(rxmsg,structname); % Test to see if the signals contain data. if isempty([msgdata.signals])==true else % If the signals are empty then exclude them from the data structure. end end % If the signals are not empty then place the message timestamp and message signals in the data array. msgstructure.(structname).timestamp = [msgdata.timestamp]; msgstructure.(structname).signals = [msgdata.signals]; Matlab functions described above were used to create a simple GUI to extract, sort, and visualize J1939 parameters stored in a log file. The GUI shown in Figure 42 allowed the user to select a database file configured with messages and parameters of interest which was used to extract and decode parameters from a user selected log file. The user selected from a list of available parameter groups and then selected specific signals to plot for visualization.

120 Figure 42 Matlab GUI for decoding, sorting, and visualizing CAN parameters. 118
Machinery Cost Estimates: Field Operations
 Machinery Cost Estimates: Field Operations Department of Agricultural and Consumer Economics College of Agricultural, Consumer and Environmental Sciences University of Illinois at Urbana-Champaign MACHINERY
Machinery Cost Estimates: Field Operations
 Machinery Cost Estimates: Field Operations Department of Agricultural and Consumer Economics College of Agricultural, Consumer and Environmental Sciences University of Illinois at Urbana-Champaign MACHINERY
1. INTRODUCTION 3 2. COST COMPONENTS 17
 CONTENTS - i TABLE OF CONTENTS PART I BACKGROUND 1. INTRODUCTION 3 1.1. JUSTIFICATION OF MACHINERY 4 1.2. MANAGERIAL APPROACH 5 1.3. MACHINERY MANAGEMENT 5 1.4. THE MECHANICAL SIDE 6 1.5. AN ECONOMICAL
Pioneering MTU C&I diesel engines for U.S. EPA Tier 4
 Technical Background Article Contact: Mirko Gutemann Phone: +49 7541 90-4741 E-mail: mirko.gutemann@tognum.com Pioneering MTU C&I diesel engines for U.S. EPA Tier 4 For more than 100 years, diesel engines
AN EVALUATION OF AGRICULTURAL TRACTORS HYDRAULIC LIFT PERFORMANCE
 University of Nebraska - Lincoln DigitalCommons@University of Nebraska - Lincoln Biological Systems Engineering--Dissertations, Theses, and Student Research Biological Systems Engineering Spring 5-2016
TKP3501 Farm Mechanization
 TKP3501 Farm Mechanization Topic 8: Tractors and Power Units Ahmad Suhaizi, Mat Su Email: asuhaizi@upm.edu.my ASMS Why we need machineries? Type of machine available Filters, oil, Traditional vs modern
Vehicle Performance. Pierre Duysinx. Research Center in Sustainable Automotive Technologies of University of Liege Academic Year
 Vehicle Performance Pierre Duysinx Research Center in Sustainable Automotive Technologies of University of Liege Academic Year 2015-2016 1 Lesson 4: Fuel consumption and emissions 2 Outline FUEL CONSUMPTION
Predicting Tractor Fuel Consumption
 University of Nebraska - Lincoln DigitalCommons@University of Nebraska - Lincoln Biological Systems Engineering: Papers and Publications Biological Systems Engineering 24 Predicting Tractor Fuel Consumption
Automotive Research and Consultancy WHITE PAPER
 Automotive Research and Consultancy WHITE PAPER e-mobility Revolution With ARC CVTh Automotive Research and Consultancy Page 2 of 16 TABLE OF CONTENTS Introduction 5 Hybrid Vehicle Market Overview 6 Brief
TraXon Hybrid Makes Long-Distance Traffic Even More Economical
 Page 1/5, 2015-03-26 TraXon Hybrid Makes Long-Distance Traffic Even More Economical New ZF transmission allows for use of hybrid technology in heavy trucks Potential for considerable fuel and emission
Approach for determining WLTPbased targets for the EU CO 2 Regulation for Light Duty Vehicles
 Approach for determining WLTPbased targets for the EU CO 2 Regulation for Light Duty Vehicles Brussels, 17 May 2013 richard.smokers@tno.nl norbert.ligterink@tno.nl alessandro.marotta@jrc.ec.europa.eu Summary
Redefining Efficiency B6.7 For Truck Applications.
 Redefining Efficiency. 2017 B6.7 For Truck Applications. Redefining Efficiency. When you say the word efficiency to anyone in the trucking industry, the conversation immediately turns to fuel economy for
Grid Services From Plug-In Hybrid Electric Vehicles: A Key To Economic Viability?
 Grid Services From Plug-In Hybrid Electric Vehicles: A Key To Economic Viability? Paul Denholm (National Renewable Energy Laboratory; Golden, Colorado, USA); paul_denholm@nrel.gov; Steven E. Letendre (Green
The Path To EPA Tier 4i - Preparing for. the 2011 transition
 The Path To EPA Tier 4i - Preparing for Presented by: Todd Howe Global Product Marketing Manager Doosan Infracore Portable Power Office: 704-883-3611 todd.howe@doosan.com the 2011 transition About the
GLOSSARY. Block. Cylinders
 Engine The power source for any farm tractor is the engine. The engine provides the muscle for the power train and the hydraulic system. The typical modern farm tractor has a diesel engine ranging from
CONTACT: Rasto Brezny Executive Director Manufacturers of Emission Controls Association 2200 Wilson Boulevard Suite 310 Arlington, VA Tel.
 WRITTEN COMMENTS OF THE MANUFACTURERS OF EMISSION CONTROLS ASSOCIATION ON CALIFORNIA AIR RESOURCES BOARD S PROPOSED AMENDMENTS TO CALIFORNIA EMISSION CONTROL SYSTEM WARRANTY REGULATIONS AND MAINTENANCE
EVALUATION OF THE ACCURACY OF MACHINE REPORTED CAN DATA FOR ENGINE TORQUE AND SPEED
 University of Nebraska - Lincoln DigitalCommons@University of Nebraska - Lincoln Biological Systems Engineering: Papers and Publications Biological Systems Engineering 2018 EVALUATION OF THE ACCURACY OF
Development of Engine Clutch Control for Parallel Hybrid
 EVS27 Barcelona, Spain, November 17-20, 2013 Development of Engine Clutch Control for Parallel Hybrid Vehicles Joonyoung Park 1 1 Hyundai Motor Company, 772-1, Jangduk, Hwaseong, Gyeonggi, 445-706, Korea,
FE151 Aluminum Association Inc. Impact of Vehicle Weight Reduction on a Class 8 Truck for Fuel Economy Benefits
 FE151 Aluminum Association Inc. Impact of Vehicle Weight Reduction on a Class 8 Truck for Fuel Economy Benefits 08 February, 2010 www.ricardo.com Agenda Scope and Approach Vehicle Modeling in MSC.EASY5
Real-world to Lab Robust measurement requirements for future vehicle powertrains
 Real-world to Lab Robust measurement requirements for future vehicle powertrains Andrew Lewis, Edward Chappell, Richard Burke, Sam Akehurst, Simon Pickering University of Bath Simon Regitz, David R Rogers
Redefining Efficiency. B6.7 For Truck Applications.
 Redefining Efficiency. B6.7 For Truck Applications. Redefining Efficiency. When you say the word efficiency to anyone in the trucking industry, the conversation immediately turns to fuel economy for good
The New 6 Series TTV Agrotron
 Power TVADVANCED The New 6 Series TTV 6150.4-6160.4-6160-6180-6190 Agrotron NEW 6 SERIES TTV IN ORDER to develop, agriculture needs continuous innovation. 3 Tremendous power under your control. The new
PREDICTION OF FUEL CONSUMPTION
 PREDICTION OF FUEL CONSUMPTION OF AGRICULTURAL TRACTORS S. C. Kim, K. U. Kim, D. C. Kim ABSTRACT. A mathematical model was developed to predict fuel consumption of agricultural tractors using their official
Powertrain Efficiency Technologies. Turbochargers
 Powertrain Efficiency Technologies Turbochargers Turbochargers increasingly are being used by automakers to make it possible to use downsized gasoline engines that consume less fuel but still deliver the
MACHINERY COST ESTIMATES
 MACHINERY COST ESTIMATES by William F. Lazarus June 2015 The tables in this publication contain estimates of farm machinery operation costs calculated via an economic engineering approach. The data are
NEBRASKA OECD TRACTOR TEST 2173 SUMMARY 1087 JOHN DEERE 9570RX DIESEL 18 SPEED
 NEBRASKA OECD TRACTOR TEST 2173 SUMMARY 1087 JOHN DEERE 9570RX DIESEL 18 SPEED POWER TAKE-OFF PERFORMANCE Power Crank Diesel D.E.F. HP shaft Consumption Consumption (kw) speed Gal/hr lb/hp.hr Hp.hr/gal
THE CVT TRUTH VS. MYTH. NOTE: PLEASE REFER TO BULLETIN F01-02 on OneAGCO FOR THE EX- PLANATION OF HOW THE CVT WORKS.
 PRODUCT MARKETING BULLETIN THE CVT ALL DEALERS BULLETIN APRIL 19, 2006 TRUTH VS. MYTH NOTE: PLEASE REFER TO BULLETIN F01-02 on OneAGCO FOR THE EX- PLANATION OF HOW THE CVT WORKS. INTRODUCTION:: Throughout
Rigid Dump Truck HD465/605-8 and HD325/405-8
 Introduction of Products Rigid Dump Truck HD465/605-8 and HD325/405-8 Satoshi Matsumoto Yuki Ishikawa Tomoyuki Moriyama Ryosuke Maeda While keeping in mind Environment, Safety, and ICT as the key concepts,
Exhaust After-Treatment System. This information covers design and function of the Exhaust After-Treatment System (EATS) on the Volvo D16F engine.
 on the Volvo D16F engine.") Volvo Trucks North America Greensboro, NC USA DService Bulletin Trucks Date Group No. Page 1.2007 258 44 1(6) Exhaust After-Treatment System Design and Function D16F Exhaust After-Treatment System W2005772
Volvo Trucks North America Greensboro, NC USA DService Bulletin Trucks Date Group No. Page 1.2007 258 44 1(6) Exhaust After-Treatment System Design and Function D16F Exhaust After-Treatment System W2005772
Introduction INTRODUCTION
 Date: Bulletin: Subject: Distribution: (Updated) April, 2013 MF13-10PMB Competitive Bulletin: Massey Ferguson 4600 Series vs John Deere 5E Series Massey Ferguson Tractor Dealers TABLE OF CONTENTS Introduction
NEBRASKA OECD TRACTOR TEST 2082 SUMMARY 931 JOHN DEERE 7210R COMMANDQUAD DIESEL 20 SPEED
 NEBRASKA OECD TRACTOR TEST 2082 SUMMARY 931 JOHN DEERE 7210R COMMANDQUAD DIESEL 20 SPEED POWER TAKE-OFF PERFORMANCE (kw) speed Gal/hr lb/hp.hr Hp.hr/gal Gal/hr Mean Atmospheric rpm (l/h) (kg/kw.h) (kw.h/l)
Electric Drives Potentials on Tractors and Implements. Dr. Joachim Sobotzik John Deere Global Tractor Electronic Engineering 8 July 2010
 Electric Drives Potentials on Tractors and Implements Dr. Joachim Sobotzik John Deere Global Tractor Electronic Engineering 8 July 2010 Agenda John Deere E-Premium Tractor / Implement Electrification Design
NEBRASKA OECD TRACTOR TEST 2135 SUMMARY 1005 JOHN DEERE 9620R DIESEL 18 SPEED
 NEBRASKA OECD TRACTOR TEST 2135 SUMMARY 1005 JOHN DEERE 9620R DIESEL 18 SPEED POWER TAKE-OFF PERFORMANCE Power Crank Diesel D.E.F. HP shaft Consumption Consumption (kw) speed Gal/hr lb/hp.hr Hp.hr/gal
Balancing operability and fuel efficiency in the truck and bus industry
 Balancing operability and fuel efficiency in the truck and bus industry Realize innovation. Agenda The truck and bus industry is evolving Model-based systems engineering for truck and bus The voice of
STUDY OF ENERGETIC BALANCE OF REGENERATIVE ELECTRIC VEHICLE IN A CITY DRIVING CYCLE
 ENGINEERING FOR RURAL DEVELOPMENT Jelgava, 24.-25.5.212. STUDY OF ENERGETIC BALANCE OF REGENERATIVE ELECTRIC VEHICLE IN A CITY DRIVING CYCLE Vitalijs Osadcuks, Aldis Pecka, Raimunds Selegovskis, Liene
Oregon DOT Slow-Speed Weigh-in-Motion (SWIM) Project: Analysis of Initial Weight Data
 Project: Analysis of Initial Weight Data") Portland State University PDXScholar Center for Urban Studies Publications and Reports Center for Urban Studies 7-1997 Oregon DOT Slow-Speed Weigh-in-Motion (SWIM) Project: Analysis of Initial Weight Data
Portland State University PDXScholar Center for Urban Studies Publications and Reports Center for Urban Studies 7-1997 Oregon DOT Slow-Speed Weigh-in-Motion (SWIM) Project: Analysis of Initial Weight Data
ENERGY RECOVERY SYSTEM FROM THE VEHICLE DAMPERS AND THE INFLUENCE OF THE TANK PRESSURE
 The 3rd International Conference on Computational Mechanics and Virtual Engineering COMEC 2009 29 30 OCTOBER 2009, Brasov, Romania ENERGY RECOVERY SYSTEM FROM THE VEHICLE DAMPERS AND THE INFLUENCE OF THE
Engine Transient Characteristics Simulation Technology using Zero-dimensional Combustion Model
 25 Engine Transient Characteristics Simulation Technology using Zero-dimensional Combustion Model TAKAYUKI YAMAMOTO *1 KENJI HIRAOKA *2 NAOYUKI MORI *2 YUJI ODA *3 AKIHIRO YUUKI *4 KENICHI ISONO *5 The
MACHINERY COST ESTIMATES
 June 2009 MACHINERY COST ESTIMATES The tables in this publication contain estimates of farm machinery operation costs calculated via an economic engineering approach. The data are intended to show a representative
Regenerative Braking System for Series Hybrid Electric City Bus
 Page 0363 Regenerative Braking System for Series Hybrid Electric City Bus Junzhi Zhang*, Xin Lu*, Junliang Xue*, and Bos Li* Regenerative Braking Systems (RBS) provide an efficient method to assist hybrid
Product Marketing Bulletin
 Product Marketing Bulletin MF4700 Series Date: Bulletin: Subject: Distribution: March 16, 2017 MF17-22PMB Massey Ferguson 4707 vs New Holland T4.75 Massey Ferguson Dealers Drawing on over a century s worth
NEBRASKA OECD TRACTOR TEST 2172 SUMMARY 1086 JOHN DEERE 8400R DIESEL e23 TRANSMISSION
 NEBRASKA OECD TRACTOR TEST 2172 SUMMARY 1086 JOHN DEERE 8400R DIESEL e23 TRANSMISSION POWER TAKE-OFF PERFORMANCE Power Crank Diesel D.E.F. HP shaft Consumption Consumption (kw) speed Gal/hr lb/hp.hr Hp.hr/gal
ADVANCED. The New 6 Series TTV Agrotron
 TTV Power ADVANCED The New 6 Series TTV 6150.4-6160.4-6160-6180-6190 Agrotron NEW 6 SERIES TTV IN ORDER to develop, agriculture needs continuous innovation. 3 Tremendous power under your control. The new
1/7. The series hybrid permits the internal combustion engine to operate at optimal speed for any given power requirement.
 1/7 Facing the Challenges of the Current Hybrid Electric Drivetrain Jonathan Edelson (Principal Scientist), Paul Siebert, Aaron Sichel, Yadin Klein Chorus Motors Summary Presented is a high phase order
NEBRASKA OECD TRACTOR TEST 2086 SUMMARY 935 CASE IH MAGNUM 370 DIESEL CVT TRANSMISSION
 NEBRASKA OECD TRACTOR TEST 2086 SUMMARY 935 CASE IH MAGNUM 370 DIESEL CVT TRANSMISSION POWER TAKE-OFF PERFORMANCE Power Crank Diesel D.E.F. HP shaft Consumption Consumption (kw) speed Gal/hr lb/hp.hr Hp.hr/gal
A FEASIBILITY STUDY ON WASTE HEAT RECOVERY IN AN IC ENGINE USING ELECTRO TURBO GENERATION
 A FEASIBILITY STUDY ON WASTE HEAT RECOVERY IN AN IC ENGINE USING ELECTRO TURBO GENERATION S.N.Srinivasa Dhaya Prasad 1 N.Parameshwari 2 1 Assistant Professor, Department of Automobile Engg., SACS MAVMM
NEBRASKA OECD TRACTOR TEST 2150A SUMMARY 1013A NEW HOLLAND T8.435 SMARTTRAX DIESEL CVT TRANSMISSION
 NEBRASKA OECD TRACTOR TEST 2150A SUMMARY 1013A NEW HOLLAND T8.435 SMARTTRAX DIESEL CVT TRANSMISSION POWER TAKE-OFF PERFORMANCE Power Crank Diesel D.E.F. HP shaft Consumption Consumption (kw) speed Gal/hr
JX STRADDLE SERIES HP RATED POWER
 JX STRADDLE SERIES 59-98 HP RATED POWER Water-cooled 3 and 4 cylinder diesel Turbo Engines are available on 70, 90 Dedicated left-hand shuttle and 12x12 engines tuned for high power output and & 95 models.
Application of the SuperGen Electro-Mechanical Supercharger to Miller-Cycle Gasoline Turbocharged Engines
 Application of the SuperGen Electro-Mechanical Supercharger to Miller-Cycle Gasoline Turbocharged Engines A. H. Guzel, J. Martin North American GT Conference 2017 11/14/2017 1 Overview Program Goal & Technology
INVENTION DISCLOSURE MECHANICAL SUBJECT MATTER EFFICIENCY ENHANCEMENT OF A NEW TWO-MOTOR HYBRID SYSTEM
 INVENTION DISCLOSURE MECHANICAL SUBJECT MATTER EFFICIENCY ENHANCEMENT OF A NEW TWO-MOTOR HYBRID SYSTEM ABSTRACT: A new two-motor hybrid system is developed to maximize powertrain efficiency. Efficiency
A Research Oriented Study On Waste Heat Recovery System In An Ic Engine
 International Journal of Engineering Inventions e-issn: 2278-7461, p-issn: 2319-6491 Volume 3, Issue 12 [December. 2014] PP: 72-76 A Research Oriented Study On Waste Heat Recovery System In An Ic Engine
THE STUDY of mechanical power
 The Internal Combustion Engine and Its Importance to Agriculture THE STUDY of mechanical power covers a broad area of learning. A basic understanding of engines is important if you are to keep pace with
A Cost Effective Method to Create Accurate Engine Performance Maps & Updating the Nebraska Pumping Plant Performance Criteria
 University of Nebraska - Lincoln DigitalCommons@University of Nebraska - Lincoln Biological Systems Engineering--Dissertations, Theses, and Student Research Biological Systems Engineering Spring 1-14-2014
Applications for energy storage flywheels in vehicles of Deutsche Bahn AG
 Applications for energy storage flywheels in vehicles of Deutsche Bahn AG Introduction It is necessary to introduce effective energy saving measures in the operation of rail vehicles for economic and environmental
Future Technology Trends in Heavy Duty Commercial Vehicle Diesel Engines February 26 th, 2013
 Future Technology Trends in Heavy Duty Commercial Vehicle Diesel Engines February 26 th, 2013 David Shrader APAC Commercial Vehicle Sector Head Norgren Inc. Future Technology Trends in Heavy Duty Commercial
PARALLEL HYBRID ELECTRIC VEHICLES: DESIGN AND CONTROL. Pierre Duysinx. LTAS Automotive Engineering University of Liege Academic Year
 PARALLEL HYBRID ELECTRIC VEHICLES: DESIGN AND CONTROL Pierre Duysinx LTAS Automotive Engineering University of Liege Academic Year 2015-2016 1 References R. Bosch. «Automotive Handbook». 5th edition. 2002.
Olson-EcoLogic Engine Testing Laboratories, LLC
 Olson-EcoLogic Engine Testing Laboratories, LLC ISO 9001:2008 Registered A White Paper Important Planning Considerations for Engine and/or Vehicle Emission Testing Objectives Including Fuel Economy and
Transitioning SuperTruckTechnologies to Commercial and Military Applications June 17 th, 2014 Ted Bloch-Rubin, Jean-Baptiste Gallo, CALSTART
 Transitioning SuperTruckTechnologies to Commercial and Military Applications June 17 th, 2014 Ted Bloch-Rubin, Jean-Baptiste Gallo, CALSTART Agenda Background Overview of SuperTruck Review of Technologies
Turbocharging: Key technology for high-performance engines
 Engine technology Turbocharging: Key technology for high-performance engines Authors: Dr. Johannes Kech Head of Development Turbocharging Ronald Hegner Team Leader, Design of Turbocharging Systems Tobias
Electronic Load Sensing for Tractors
 Electronic Load Sensing for Tractors Dipl.-Ing. U. Lenzgeiger, Dipl.-Ing. (FH) U. Maier, Dipl.-Ing. (FH) P. Schmuttermaier Bosch Rexroth AG Systems Engineering Glockeraustraße 2 89275 Elchingen E-Mail:
INTRODUCING NEW T7.290 & T7.315
 INTRODUCING NEW T7.290 & T7.315 NEW T7.290 & T7.315 MOVING UP IN POWER POWER, EFFICIENCY & CONTROL EcoBlue HI-eSCR engine technology that optimizes power, combustion, torque and fuel economy Precise speed
Electronic Load-Sensing for Tractors
 Electronic Load-Sensing for Tractors Ulrich Lenzgeiger, Uwe Maier and Peter Schmuttermair Bosch Rexroth AG, Systems Engineering, Glockeraustr. 2, 89275 Elchingen, Germany E-Mail: ulrich.lenzgeiger@boschrexroth.de,
Integrated Engine and Aftertreatment System Technology for EPA 2010 Heavy-duty Emissions Regulations
 Integrated Engine and Aftertreatment System Technology for EPA 2010 Heavy-duty Emissions Regulations Presented by: Rakesh Aneja Engine Systems and Technology Detroit Diesel Corporation Series 60 MBE 900
ROUTE. EVERY ISL FOR URBAN TRANSIT BUS APPLICATIONS
 ISL EVERY ROUTE. FOR URBAN TRANSIT BUS APPLICATIONS URBAN TRANSIT BUS APPLICATIONS. Every Time. The ISL is the most popular engine in the transit market, due to its high reliability, low maintenance and
PRODUCT INFORMATION BULLETIN. January 15, 2019 DF19-01 PIB New Deutz-Fahr 6 Series Ag Tractors
 Date: Document #: Subject: January 15, 2019 DF19-01 PIB New Deutz-Fahr 6 Series Ag Tractors PFG America is pleased to announce the introduction of the new Deutz-Fahr 6 Series utility tractors to the USA
The Hybrid and Electric Vehicles Manufacturing
 Photo courtesy Toyota Motor Sales USA Inc. According to Toyota, as of March 2013, the company had sold more than 5 million hybrid vehicles worldwide. Two million of these units were sold in the US. What
ELECTRICAL 48 V MAIN COOLANT PUMP TO REDUCE CO 2 EMISSIONS
 ELECTRICAL 48 V MAIN COOLANT PUMP TO REDUCE CO 2 EMISSIONS Mahle has developed an electrical main coolant pump for the 48 V on-board net. It replaces the mechanical pump and offers further reductions in
Improving the Fuel Economy of Heavy Duty Fleets II San Diego, CA February 20th, 2008
 Improving the Fuel Economy of Heavy Duty Fleets II San Diego, CA February 20th, 2008 Heavy Duty Truck Fuel Economy Options Southwest Research Institute David Branyon 1 Outline Background/history Current
All machines one language
 All machines one language Soil tillage Electronics Sowing Intelligent crop production F ertilisin g El e c t r o n ic s Pla nt prote ctio n AMATRON + is the universal operator platform for all my AMAZONE
An Approach for Power Generation with Reduced Fuel Consumption using PTO Driven Generator
 Current World Environment Vol. 11(2), 544-553 (2016) An Approach for Power Generation with Reduced Fuel Consumption using PTO Driven Generator MANISH PATEL* and H. RAHEMAN Agricultural and Food Engineering
Flywheel energy storage retrofit system
 Flywheel energy storage retrofit system for hybrid and electric vehicles Jan Plomer, Jiří First Faculty of Transportation Sciences Czech Technical University in Prague, Czech Republic 1 Content 1. INTRODUCTION
NEBRASKA OECD TRACTOR TEST 2040 SUMMARY 831 JOHN DEERE 9460R DIESEL 18 SPEED
 NEBRASKA OECD TRACTOR TEST 2040 SUMMARY 831 JOHN DEERE 9460R DIESEL 18 SPEED POWER TAKE-OFF PERFORMANCE Power Crank HP shaft (kw) speed Gal/hr lb/hp.hr Hp.hr/gal Mean Atmospheric rpm (l/h) (kg/kw.h) (kw.h/l)
Inline 6 series turbocharger with exhaust gas recirculation (EGR) and selective catalytic reduction (SCR) Valves per Cylinder 4
 and selective catalytic reduction (SCR) Valves per Cylinder 4") SPECIFICATIONS Engine Manufacturer and Model John Deere PowerTech PSS 6090 Non-Road Emission Standards EPA Final Tier 4/EU Stage IV Configuration Inline 6 series turbocharger with exhaust gas recirculation
SPECIFICATIONS Engine Manufacturer and Model John Deere PowerTech PSS 6090 Non-Road Emission Standards EPA Final Tier 4/EU Stage IV Configuration Inline 6 series turbocharger with exhaust gas recirculation
Transportation Electrification: Reducing Emissions, Driving Innovation. August 2017
 Transportation Electrification: Reducing Emissions, Driving Innovation August 2017 CA raising the bar in environmental policy and action Senate Bill 350 (DeLeon, 2015) established broad and ambitious clean
Project Summary Fuzzy Logic Control of Electric Motors and Motor Drives: Feasibility Study
 EPA United States Air and Energy Engineering Environmental Protection Research Laboratory Agency Research Triangle Park, NC 277 Research and Development EPA/600/SR-95/75 April 996 Project Summary Fuzzy
SERIES TRACTORS FARMALL UTILITY C SERIES TRACTORS
 SERIES TRACTORS FARMALL UTILITY C SERIES TRACTORS FARMALL UTILITY C 2 FARMALL UTILITY C SERIES TRACTORS 6 Models 64 117 HP * 50 100 PTO HP * READY TO WORK AS HARD AS YOU. Since 1923, the Farmall tractor
LESSON Transmission of Power Introduction
 LESSON 3 3.0 Transmission of Power 3.0.1 Introduction Earlier in our previous course units in Agricultural and Biosystems Engineering, we introduced ourselves to the concept of support and process systems
Electro Hydrostatic Actuation Highly efficient implement solution with energy recovery
 Electro Hydrostatic Actuation Highly efficient implement solution with energy recovery Dale Vanderlaan Outline Off Highway Technology Trends EHA Technology Journey Application Test Results Key Conclusions
DD13 FIRE AND EMERGENCY
 ENGINE DD13 FIRE AND EMERGENCY DETROIT DIESEL ENGINES: DEMAND IT ALL. Detroit Diesel has been the industry standard in the custom chassis fire truck business for more than three decades. Through the years,
MECA0500: PARALLEL HYBRID ELECTRIC VEHICLES. DESIGN AND CONTROL. Pierre Duysinx
 MECA0500: PARALLEL HYBRID ELECTRIC VEHICLES. DESIGN AND CONTROL Pierre Duysinx Research Center in Sustainable Automotive Technologies of University of Liege Academic Year 2017-2018 1 References R. Bosch.
Test Bed 1 Energy Efficient Displacement-Controlled Hydraulic Hybrid Excavator
 Test Bed 1 Energy Efficient Displacement-Controlled Hydraulic Hybrid Excavator Enrique Busquets Monika Ivantysynova October 7, 2015 Maha Fluid Power Research Center Purdue University, West Lafayette, IN,
IC Engine Control - the Challenge of Downsizing
 IC Engine Control - the Challenge of Downsizing Dariusz Cieslar* 2nd Workshop on Control of Uncertain Systems: Modelling, Approximation, and Design Department of Engineering, University of Cambridge 23-24/9/2013
Design and Modeling of Fluid Power Systems ME 597/ABE 591
 Systems ME 597/ABE 591 Dr. Monika Ivantysynova MAHA Professor Flud Power Systems MAHA Fluid Power Research Center Purdue University Systems Dr. Monika Ivantysynova, Maha Professor Fluid Power Systems Mivantys@purdue.edu
THERMAL MANAGEMENT SYNERGY THROUGH INTEGRATION PETE BRAZAS
 THERMAL MANAGEMENT SYNERGY THROUGH INTEGRATION PETE BRAZAS 1 Propulsion System Trends Evolution of the TMM A Closer Look at Electrification System Integration Approach Outlook Powertrain Technology Roadmap
Active launch systems. For passenger cars up to 1,000 Nm
 Active launch systems For passenger cars up to 1,000 Nm 2 3 Powertrain components and systems for passenger cars and LCV Performance comfort environmental protection. Powertrain components and systems
Engine Overspeed Protection for Tier 4 Machines with Hydrostatic Transmissions
 IFPE Paper 8.1 Engine Overspeed Protection for Tier 4 Machines with Hydrostatic Transmissions Simon L. Nielsen Danfoss Power Solutions Frank J. Rozycki Danfoss Power Solutions This study evaluates ISL
Fuel Consumption, Exhaust Emission and Vehicle Performance Simulations of a Series-Hybrid Electric Non-Automotive Vehicle
 2017 Published in 5th International Symposium on Innovative Technologies in Engineering and Science 29-30 September 2017 (ISITES2017 Baku - Azerbaijan) Fuel Consumption, Exhaust Emission and Vehicle Performance
System Analysis of the Diesel Parallel Hybrid Vehicle Powertrain
 System Analysis of the Diesel Parallel Hybrid Vehicle Powertrain Kitae Yeom and Choongsik Bae Korea Advanced Institute of Science and Technology ABSTRACT The automotive industries are recently developing
NEBRASKA OECD TRACTOR TEST 2189 SUMMARY 1091 KUBOTA M7-151 DIESEL 24 SPEED
 NEBRASKA OECD TRACTOR TEST 2189 SUMMARY 1091 KUBOTA M7-151 DIESEL 24 SPEED POWER TAKE-OFF PERFORMANCE (kw) speed Gal/hr lb/hp.hr Hp.hr/gal Gal/hr Mean Atmospheric rpm (l/h) (kg/kw.h) (kw.h/l) (l/h) Conditions
EC Equipment Wheel Spacing for Ridge- Till and No-Till Row Crops
 University of Nebraska - Lincoln DigitalCommons@University of Nebraska - Lincoln Historical Materials from University of Nebraska- Lincoln Extension Extension 1996 EC96-780 Equipment Wheel Spacing for
NEBRASKA OECD TRACTOR TEST 2183 SUMMARY 1107 CLAAS AXION 880 DIESEL CONTINUOUSLY VARIABLE TRANSMISSION
 NEBRASKA OECD TRACTOR TEST 2183 SUMMARY 1107 CLAAS AXION 880 DIESEL CONTINUOUSLY VARIABLE TRANSMISSION POWER TAKE-OFF PERFORMANCE Power Crank Diesel D.E.F. HP shaft Consumption Consumption (kw) speed Gal/hr
John Deere Agricultural Equipment Technician A Guide to Course Content
 John Deere Agricultural Equipment Technician A Guide to Course Content Note: Regular Agricultural Equipment Technician apprentices see AET guide to course content pamphlet. Agricultural Equipment Technicians
Hybrid Wheel Loaders Incorporating Power Electronics
 Hitachi Review Vol. 64 (2015), No. 7 398 Featured Articles Hybrid Wheel Loaders Incorporating Power Electronics Kazuo Ishida Masaki Higurashi OVERVIEW: Hybrid vehicles that combine an engine and electric
Design & Development of Regenerative Braking System at Rear Axle
 International Journal of Advanced Mechanical Engineering. ISSN 2250-3234 Volume 8, Number 2 (2018), pp. 165-172 Research India Publications http://www.ripublication.com Design & Development of Regenerative
Hybrid Architectures for Automated Transmission Systems
 1 / 5 Hybrid Architectures for Automated Transmission Systems - add-on and integrated solutions - Dierk REITZ, Uwe WAGNER, Reinhard BERGER LuK GmbH & Co. ohg Bussmatten 2, 77815 Bühl, Germany (E-Mail:
PRESS RELEASE. Significant fuel savings and rapid payback shown for rail flywheel hybrid technology. 16 June 2015
 PRESS RELEASE 16 June 2015 Significant fuel savings and rapid payback shown for rail flywheel hybrid technology Research and development conducted by Ricardo, Artemis Intelligent Power and Bombardier Transportation
Turbo Tech 101 ( Basic )
") Turbo Tech 101 ( Basic ) How a Turbo System Works Engine power is proportional to the amount of air and fuel that can get into the cylinders. All things being equal, larger engines flow more air and as
Turbo Tech 101 ( Basic ) How a Turbo System Works Engine power is proportional to the amount of air and fuel that can get into the cylinders. All things being equal, larger engines flow more air and as
Investigation into the Potential Fuel Savings from the use of Hydraulic Regenerative Systems in Heavy Vehicles.
 Investigation into the Potential Fuel Savings from the use of Hydraulic Regenerative Systems in Heavy Vehicles. Paul L. Matheson Dr. Jacek Stecki Postgraduate Student Supervisor (Associate Professor) Department
EVALUATION OF CURRENT AND FUTURE ATKINSON ENGINE TECHNOLOGIES
 EVALUATION OF CURRENT AND FUTURE ATKINSON ENGINE TECHNOLOGIES 2 nd CRC Advanced Fuel and Engine Efficiency Workshop 11/2/2016 Charles Schenk, U.S. EPA Developmental data: internal EPA use only 1 Background
3. TECHNOLOGIES FOR MEETING ZEV PROGRAM REQUIREMENTS AND PRODUCTION VOLUME ESTIMATES
 -21-3. TECHNOLOGIES FOR MEETING ZEV PROGRAM REQUIREMENTS AND PRODUCTION VOLUME ESTIMATES This section provides an overview of the vehicle technologies that auto manufacturers may use to meet the ZEV program