Florida s Turnpike Enterprise March 2014
|
|
|
- Vanessa Nelson
- 6 years ago
- Views:
Transcription


1 Florida s Turnpike Enterprise March 2014 Service Plaza Customer Survey FY 2014
2
3 Table of Contents Executive Summary...1 Table ES-1: Overall Service Plaza Scorecard...3 Table ES-2: Annual Average Daily Traffic Entering the Service Plazas...3 Section One: Restaurant Building Customer Surveys...5 Table 1-1: Food and Drink Purchases...6 Table 1-2: Food and Drink Purchases at Multiple Plazas...7 Table 1-3: Ratings of Food and Drink Prices...8 Table 1-4: Ratings of Restaurant Building Services and Appearance...9 Table 1-5: Other Services Used...10 Section Two: Fuel Station Customer Surveys...11 Table 2-1: Fuel Station Traffic Volumes...11 Table 2-2: Fuel Purchases at Multiple Plazas...12 Table 2-3: Fuel Price Ratings...13 Table 2-4: Ratings of Fuel Station Services and Appearance...14 Section Three: Individual Service Plaza Scorecards Table 3-1: Okahumpka Average Day by the Numbers...16 Table 3-2: Okahumpka Scorecard...16 Table 3-3: Turkey Lake Average Day by the Numbers...17 Table 3-4: Turkey Lake Scorecard...17 Table 3-5: Canoe Creek Average Day by the Numbers...18 Table 3-6: Canoe Creek Scorecard...18 Table 3-7: Fort Drum Average Day by the Numbers...19 Table 3-8: Fort Drum Scorecard...19 Table 3-9: Port St. Lucie/Fort Pierce Average Day by the Numbers...20 Table 3-10: Port St. Lucie/Fort Pierce Scorecard...20 Table 3-11: West Palm Beach Average Day by the Numbers...21 Table 3-12: West Palm Beach Scorecard...21 Table 3-13: Pompano Beach Average Day by the Numbers...22 Table 3-14: Pompano Beach Scorecard...22 Table 3-15: Snapper Creek Average Day by the Numbers...23 Table 3-16: Snapper Creek Scorecard...23 Section Four: Service Plaza Customer and Travel Information...25 Table 4-1: Vehicle Type Distribution...25 Table 4-2: Trip Purpose...26 Table 4-3: Average Vehicle Occupancy...26 Table 4-4: Top 10 Origins and Destinations...27 Table 4-5: Residential Status...27 Map: Florida s Turnpike Service Plazas...28 Restaurant Building Survey Questions...29 Fuel Station Survey Questions...30
4 This Page Intentionally Left Blank

 2014 Service Plaza Customer Survey, conducted October 31 to November 3 and November 14 to 17, 2013.")
5 FY 2014 Service Plaza Customer Survey Executive Summary Florida s Turnpike Enterprise is committed to meeting the traveling needs of its customers. Each year, the Turnpike conducts customer satisfaction surveys to capture and evaluate the opinions and perceptions of services provided at the eight service plazas located along Florida s Turnpike. The survey is intended to measure how closely the services provided meet the needs of Turnpike customers. This report summarizes the findings of the Fiscal Year (FY) 2014 Service Plaza Customer Survey, conducted October 31 to November 3 and November 14 to 17, The surveys were conducted between 8:00 a.m. and 6:00 p.m., both inside of the service plaza restaurant buildings and at the fuel stations, once on a Thursday or Friday and again on a Saturday or Sunday. The survey design and schedule allow sampling of the weekday and weekend patronage and corresponding traffic characteristics. This report contains a summary of the responses to more than 3,200 surveys and provides the overall average scores from the two prior annual surveys (FY 2013 and FY 2012) for comparative purposes. The Turnpike is currently undergoing a major reconstruction/renovation project which will result in new improvements at each of the eight service plazas. Surveys were conducted at several restaurant buildings this year that were not examined in FY 2013 due to the ongoing construction. During the FY 2014 survey period, construction activities did not preclude survey activities at any of the eight service plazas. Fuel station/convenience store surveys and restaurant surveys were conducted at all plazas. The only exception is the Snapper Creek plaza which does not have restaurant facilities. The survey technique, as in previous years, was customerintercept which utilized survey crews using hand-held computers to enter survey responses into a database on-the-spot. The FY 2014 survey was recorded utilizing Lenovo Ideapad S10-3t computers, which are adaptable for operation in either laptop or touch screen mode. For the surveys, the touch screen mode was used, allowing the survey crews full mobility to interview customers at multiple locations within the restaurant buildings and at the fuel stations. The survey questions programmed into the Lenovo devices are detailed at the end of this report. Customer survey responses are summarized in three categories for both the service plaza restaurant buildings and the fuel station facilities: quality of service, general 1

 and those from last year (FY 2013), where ratings may have changed significantly.")
6 Florida s Turnpike Enterprise appearance, and restroom cleanliness. The survey also yielded a variety of information about Turnpike customers and their travel characteristics. The combined customer service ratings, along with the customer information and travel characteristics, allow Turnpike Management to directly evaluate service plaza customer satisfaction and understand plaza patron profiles. Narrative comparisons are highlighted between the scores from this year s survey (FY 2014) and those from last year (FY 2013), where ratings may have changed significantly. In these comparisons, references are sometimes made to details from last year s survey which may not be repeated in this report, due to limited space. If the reader wishes to directly compare these details, the scores are presented in the same format in the FY 2013 survey report. Table ES-1 shows the rating categories and combined scores for all of the service plazas and the overall average rating for FY The FY 2014 overall (restaurant and fuel station) average rating of Good for service, appearance, and restroom cleanliness was 92 percent, an improvement of four percentage points from last year. This is the second straight year the rating has increased and can likely be attributed to higher overall scores in all performance measures particularly at the fuel stations; restaurant scores overall saw increases as well. The combined /Good score at the restaurant buildings was 91 percent, up three points from last year. The /Good score at the fuel stations was 93 percent, eight points above last year s score. As construction and renovation projects are completed at service plazas, the percentage of Good ratings has continued to increase each year at the fuel stations and restaurant buildings. Anecdotal reports from customer survey crews in previous years indicated that respondents who gave lower ratings for appearance often cited construction conditions as the primary reason. The category at the restaurant buildings remained at 91 percent Good and up two points to 93 percent Good at the fuel stations. A small decrease was recorded in the restaurant buildings /Good 2
7 FY 2014 Service Plaza Customer Survey score, down one point from last year to 88 percent. The fuel station /Good score of 94 percent remained unchanged from the previous year. Table ES-2 shows the Annual Average Daily Traffic (AADT) entering the service plazas. The AADT for each plaza was calculated using seven-day traffic volumes collected from automated vehicle counts conducted at each plaza during the week the survey was conducted. The combined eight service plazas attracted an average of 30,759 vehicles per day. This represents a 6.5 percent increase from last year. Traffic entering the plazas increased at six of the eight plaza locations. The largest increase was recorded at the West Palm Beach Service Plaza. Restaurant Building Fuel Station Table ES-1 Overall Service Plaza Scorecard FY 2014 Overall Average FY 2013 Overall Average FY 2012 Overall Average Good Fair Poor 88% 9% 3% % 6% 0% % 7% 1% 88% 10% 2% 82% 15% 3% Section One of this report presents the customer ratings, by plaza, for service, appearance, and cleanliness of restrooms for the restaurant buildings. This year, restaurant building surveys were conducted at all plazas (except for Snapper Creek) for the first time since FY 2011, as construction was completed at Turkey Lake, Canoe Creek, Fort Drum, and West Palm Beach plazas during FY Section Two presents the same customer ratings by plaza for the fuel stations at all eight service plazas. The section also contains tables with additional information regarding customer purchasing characteristics, ratings for customer impressions of cost, use of other plaza services, and traffic volumes at the fuel stations. Section Three presents individual scorecards for each service plaza, accompanied by a table that reports the number of vehicles entering the plaza and the capture rate, based on the total Turnpike traffic passing each plaza. The traffic tables are based on the vehicle classification counts conducted during the survey. This data aids in the development and monitoring of plaza-specific customer service programs. Section Four summarizes demographic and travel characteristics of service plaza customers. Evaluation measures in this section include vehicle characteristics, Service Plaza Table ES-2 Annual Average Daily Traffic Entering the Service Plazas Okahumpka Turkey Lake Canoe Creek Fort Drum Port St. Lucie/Fort Pierce West Palm Beach Pompano Beach Snapper Creek FY 2014 Overall Total FY 2012 Overall Total FY 2011 Overall Total Daily Average Vehicles 3,002 2,878 4,280 5,556 4,788 4,425 3,973 1,857 30,759 28,870 29,100 vehicle occupancy, trip purpose, trip origin and destination information, and residency characteristics of survey respondents. As previously mentioned, the Turnpike and the service plaza concessionaire are conducting renovations of all 3
 and was")


8 Florida s Turnpike Enterprise service plaza facilities on the system. The program is being conducted in two phases. Phase One involves the renovation of six of the eight plazas (Turkey Lake, Canoe Creek, Fort Drum, West Palm Beach, Pompano Beach, and Snapper Creek) and was completed in Renovations at the remaining two plazas (Okahumpka and Port St. Lucie/Fort Pierce) are anticipated to be completed by FY The improvements include new or renovated restaurant buildings, new fueling facilities, and new convenience store amenities at the six northernmost service plazas. At Turkey Lake, Canoe Creek and West Palm Beach, the restaurant buildings and fuel stations have been replaced with renovated restaurants, larger convenience stores and new fuel stations. The Fort Drum Service Plaza underwent a dramatic change with a newly constructed plaza building, complete with new restrooms, restaurants, shops, information centers, dog walk facilities and recreational areas for children. 4

9 FY 2014 Service Plaza Customer Survey Section One Restaurant Building Customer Surveys This section summarizes customer perceptions of services provided at the restaurant buildings. Restaurant building surveys were conducted at the seven service plazas which feature restaurant facilities this year. The tables in this section summarizing restaurant building survey responses contain survey results at each plaza. Because there is no restaurant building at the Snapper Creek Service Plaza, only the fuel station survey was conducted there. In these surveys, customers were asked if they purchased food or drink and, if so, to rate the price of the food they purchased. They were also asked about the quality of service received, the general appearance of the restaurant building, and cleanliness of the restrooms. In addition to responses to those survey questions, this section reports the percentage of respondents who used other services provided at the restaurant building. A copy of the survey questions for the restaurant building is included at the end of this report. Survey responses are reported by percentages for each plaza and by the overall average response. Percentages for each plaza are calculated from customer responses to surveys administered at that plaza. The overall average values in this report are calculated from the total customer responses in all surveys administered and not simply as an average of percentages for the individual plazas. 5
. This significant increase resulted despite a three percent drop at Port St.")

10 Florida s Turnpike Enterprise Food and Drink Purchases and Price Ratings This year, 84 percent of all customers surveyed at restaurant buildings indicated they were purchasing food and/or drink. This percentage increased eight points from the FY 2013 survey data (Table 1-1). This significant increase resulted despite a three percent drop at Port St. Lucie/Fort Pierce, while Okahumpka and Pompano Beach Plazas both saw small increases. Service plaza customers were also asked if they had previously stopped at other plazas to purchase food and/or drink and whether or not they were planning to stop at additional plazas to purchase food and/or drink. This question is asked to examine the number of Turnpike travelers who make purchases at multiple plazas. Seven percent of travelers said they stopped at a previous plaza and ten percent indicated they would stop at another plaza to purchase food and/or drink. As shown in Table 1-2, the percentage of respondents who stopped at other plazas increased, while the number of those who planned to stop decreased. Data are included for all locations, as this question Table 1-1 Food and Drink Purchases Will Purchase Food or Drink Service Plaza Yes/Will No Okahumpka 71% 29% Turkey Lake Canoe Creek 91 9 Fort Drum Port St. Lucie/Fort Pierce West Palm Beach Pompano Beach Snapper Creek xxnot Surveyedxx FY 2014 Overall Average 84% 16% FY 2013 Overall Average 76% 24% FY 2012 Overall Average 71% 29% 6

11 FY 2014 Service Plaza Customer Survey Table 1-2 Food and Drink Purchases at Multiple Plazas Did Stop at Another Plaza Will Stop at Another Plaza Service Plaza Yes No Yes No Okahumpka Turkey Lake Canoe Creek Fort Drum Port St. Lucie/Fort Pierce West Palm Beach Pompano Beach Snapper Creek 6% % % % FY 2014 Overall Average 7% 93% 10% 90% FY 2013 Overall Average 5% 95% 11% 89% FY 2012 Overall Average 6% 94% 12% 88% was also included in the fuel station survey which was conducted at all plazas. When asked about the price of the food and/or drink at the restaurant buildings, 67 percent of all surveyed customers said prices were about what they expected to pay (Table 1-3). This represents a five point decrease from last year and three points lower than the FY 2012 survey. Two percent of customers felt that prices were lower than expected, while 31 percent stated prices were higher than they expected. The percentage of customers who stated that prices were higher than they expected increased by four percent. Restaurant Building Ratings Customers surveyed at the plaza restaurant buildings were asked to rank three basic categories: quality of service they received, general appearance of the building, and cleanliness of the restrooms. Results are summarized in Table

12 Florida s Turnpike Enterprise Service Plaza Table 1-3 Ratings of Food and Drink Prices Lower than Expected About what Expected Higher than Expected Okahumpka 2% 59% 39% Turkey Lake Canoe Creek Fort Drum Port St. Lucie/Fort Pierce West Palm Beach Pompano Beach Snapper Creek x xx xx Not Surveyed FY 2014 Overall Average 2% 67% 31% FY 2013 Overall Average 1% 72% 27% FY 2012 Overall Average 1% 70% 29% The overall average rating of Good for the quality of service at the restaurant buildings in FY 2014 was 88 percent one percent lower than last year. The Turkey Lake, Canoe Creek, Fort Drum and West Palm Beach Plazas were not surveyed in the previous year. The Plazas combined to average 90 percent Good quality of service ratings from customers. The Okahumpka and Pompano Beach Plazas saw decreases of 13 and seven percent from last year respectively. The overall average Good rating for the general appearance of the restaurant buildings improved to 91 percent, three points higher than last year. This increase may be attributed to the average Good rating of 95 percent at the new facilities at Turkey Lake, Canoe Creek, Fort Drum and West Palm Beach Plazas. The percentage of respondents who reported the general appearance as Good at the new West Palm Beach facility was a perfect 100 percent. 8

13 FY 2014 Service Plaza Customer Survey The overall average rating for restaurant building restroom cleanliness as Good was 91 percent this year, an improvement of three points from the overall average last year. The West Palm Beach plaza had the highest score in this category with 99% of customers rating the restroom cleanliness as Good. The Port St. Lucie/Fort Pierce Good rating of 73 percent in this category was the lowest, most likely due to the older facilities operating at this plaza. Customers were also surveyed about other services they used while at the plazas. Once again, the highest percentage of other services used was the restroom (Table 1-5). Other top responses were to take a break, visit the gift shop, receive information, and purchase a Florida lottery ticket. The relative ranking of other services used has remained mostly unchanged over the past several surveys. Table 1-4 Ratings of Restaurant Building Services and Appearance Okahumpka Turkey Lake Canoe Creek Fort Drum Port St. Lucie/Fort Pierce West Palm Beach Pompano Beach Good Fair Poor 80% 13% 7% % 8% 1% % 13% 7% % 5% 1% % 9% 4% % 4% 1% % 10% 1% Snapper Creek Not Surveyed Overall Average for FY % 9% 3% Overall Average for FY % 9% 2% Overall Average for FY % 13% 1%


14 Florida s Turnpike Enterprise Table 1-5 Other Services Used Services Responses Percent Restroom 2,307 59% Break Gift Shop Lottery 70 2 Information 77 2 ATM Walk a Pet 66 2 Internet Access Telephone 12 0 All Other

15 FY 2014 Service Plaza Customer Survey Section Two Fuel Station Customer Surveys Customer surveys were conducted at all of the eight service plaza fuel stations, including the convenience stores which are part of the fuel stations at each plaza. Fuel station traffic volumes were recorded during the survey period from 8:00 a.m. to 6:00 p.m. and are presented in Table 2-1. The volumes are reported in terms of the number of transactions of each fuel type, gasoline, diesel, and ethanol (E85), by plaza. The overall total fuel station transactions are also reported as a percentage of total plaza traffic. An average of 29 percent of the vehicles entering the service plazas purchased fuel, a seven percent reduction from the previous year. Survey participants were asked if they had stopped, or if they would stop again, at another service plaza to purchase fuel on their trip. On average, six percent of respondents indicated they had previously stopped to purchase fuel and eleven percent indicated they would stop to purchase fuel. These results represent modest increases from the FY 2013 results. The survey results of this category are shown in Table 2-2. Table 2-1 Fuel Station Traffic Volumes Service Plaza Fuel Station Traffic Volumes Average Plaza Traffic (8 AM - 6 PM) Gas Diesel E85 Total Percent of Plaza Total Traffic Okahumpka Turkey Lake Canoe Creek Fort Drum Port St. Lucie/Fort Pierce West Palm Beach Pompano Beach Snapper Creek FY 2014 Overall Total/Average 1,917 1,876 2,799 3,591 3,097 2,878 2,348 1,224 19, , , , , % % FY 2013 Overall Total/Average 19,250 6, , % FY 2012 Overall Total/Average 19,368 4, , % NOTE: Fuel was not sold at Canoe Creek during the FY 2012 survey timeframe due to construction activities. 11

16 Florida s Turnpike Enterprise Did Stop at Another Plaza Will Stop at Another Plaza Service Plaza Yes No Yes No FY 2014 Overall Average Table 2-2 Fuel Purchases at Multiple Plazas Okahumpka 6% 94% 6% 94% Turkey Lake Canoe Creek Fort Drum Port St. Lucie/Fort Pierce West Palm Beach Pompano Beach Snapper Creek % 94% 11% 89% FY 2013 Overall Average 4% 96% 10% 90% FY 2012 Overall Average 6% 94% 12% 88% Fuel Price Ratings Fuel station customers were asked to rate their perception of the price of fuel. They were asked whether the price per gallon was higher than they expected to pay, lower than they expected to pay, or what they expected to pay. As shown in Table 2-3, 11 percent of the customers reported the price was lower than what they expected, 58 percent of the customers paid about what they expected, and 30 percent paid more than expected. While the number of customers that reported the price was about what they expected increased by four percent from FY 2013, the number of customers reporting they prices were lower than they expected decreased by 10 percent. Also, the 12


17 FY 2014 Service Plaza Customer Survey Table 2-3 Fuel Price Ratings Service Plaza Lower than Expected About what Expected Higher than Expected Okahumpka Turkey Lake Canoe Creek Fort Drum Port St. Lucie/Fort Pierce West Palm Beach Pompano Beach Snapper Creek FY 2014 Overall Average FY 2013 Overall Average FY 2012 Overall Average 6% 49% 45% % 58% 31% 21% 54% 25% 9% 54% 37% number of customers responding that they paid higher than expected prices increased by five percent. The pricing of the fuel at each Turnpike service plaza is based on an average from local market prices. Customer responses seem to reflect whether the relative price of fuel is increasing or decreasing nationally at the time of the survey. The variation from year to year may also be related to the distance the customer has traveled on the Turnpike and the fuel prices in the respondent s place of residence. Furthermore, a commuter s perception of the relative price of fuel may be different from that of a longdistance traveler. Fuel Station Ratings Fuel station customers were also asked to rate the quality of service received at the fuel station convenience store, general appearance of the fuel station, and restroom cleanliness. Table 2-4 presents the results by plaza and an overall average for this year, as well as comparisons with overall survey results from the previous two years. In the quality of service category, the responses this year are based only on service received in the convenience store. In past surveys, the question regarding quality of service was asked in the context of the service at the fuel pumps as well. This was a holdover from past surveys, before the fuel pumps had become essentially selfservice. Beginning in FY 2012, the survey question was not asked regarding service at the pumps, but only for the service at the convenience store. As shown in Table 2-4, this year the overall average Good rating for fuel station convenience store quality of service was 94 percent for the third consecutive year. 13

18 Florida s Turnpike Enterprise Okahumpka Turkey Lake Canoe Creek Fort Drum Table 2-4 Ratings of Fuel Station Services and Appearance Port St. Lucie/Fort Pierce West Palm Beach Pompano Beach Snapper Creek Good Fair Poor 96% 2% 2% % 2% 0% % 21% 0% % 3% 0% % 6% 2% % 1% 0% % 4% 0% % 2% 0% Overall Average for FY % 6% 0% In the category of general appearance, the overall average fuel station score improved from last year. Ratings of Good for general appearance rose to 93 percent, an eight point increase from the previous year. As renovation activities have been completed at the plazas, the percentage of survey respondents with positive opinions of the appearance of the fuel station facilities have improved. In FY 2014, the only two plazas to have the percentage of customers rating the general appearance as Good below 90 percent were Okahumpka and Port St. Lucie/Fort Pierce plazas, where renovations are not scheduled to be completed until Winter In the final category summarized in Table 2-4, restroom cleanliness, the overall average Good rating was higher than last year by eight points, at 93 percent. Fuel station restroom cleanliness ratings were higher at almost all plazas. The fuel station at Fort Drum saw the largest increase in Good ratings for this category with a 43 percent increase to 99 percent, due to the newly constructed facilities. The Fort Drum, West Palm Beach, and Pompano Beach plazas scored the highest percentages of Good ratings this year for restroom cleanliness at 99 percent. While Port St. Lucie/Fort Pierce had the lowest at 68 percent. Overall Average for FY % 5% 1% Overall Average for FY % 5% 1%


19 FY 2014 Service Plaza Customer Survey Section Three Individual Service Plaza Scorecards This section presents the scorecards for the individual Turnpike service plazas. The scorecards are based on three primary measures of customer satisfaction: quality of service, general appearance, and restroom cleanliness. These three measures apply to both the restaurant building and the fuel station; thus there are six measures for most plazas. The data for these measures have been assembled and presented in a format that allows management to identify specific areas related to customer satisfaction at each plaza. A separate table reports the vehicular statistics and capture rates for each service plaza. This data is intended to support Turnpike marketing and business development efforts. The survey questions for the restaurant building and for the fuel stations are included at the end of this report. In FY 2014, the West Palm Beach Service Plaza had the best overall average Good score of 99 percent, an improvement of eight points over last year. This is likely due to the completion of construction at the plaza between the FY 2013 and FY 2014 surveys, as last year the restaurant building was not surveyed. The fuel station and restaurant building at the plaza scored above 95 percent Good in all three categories of measurement. 15


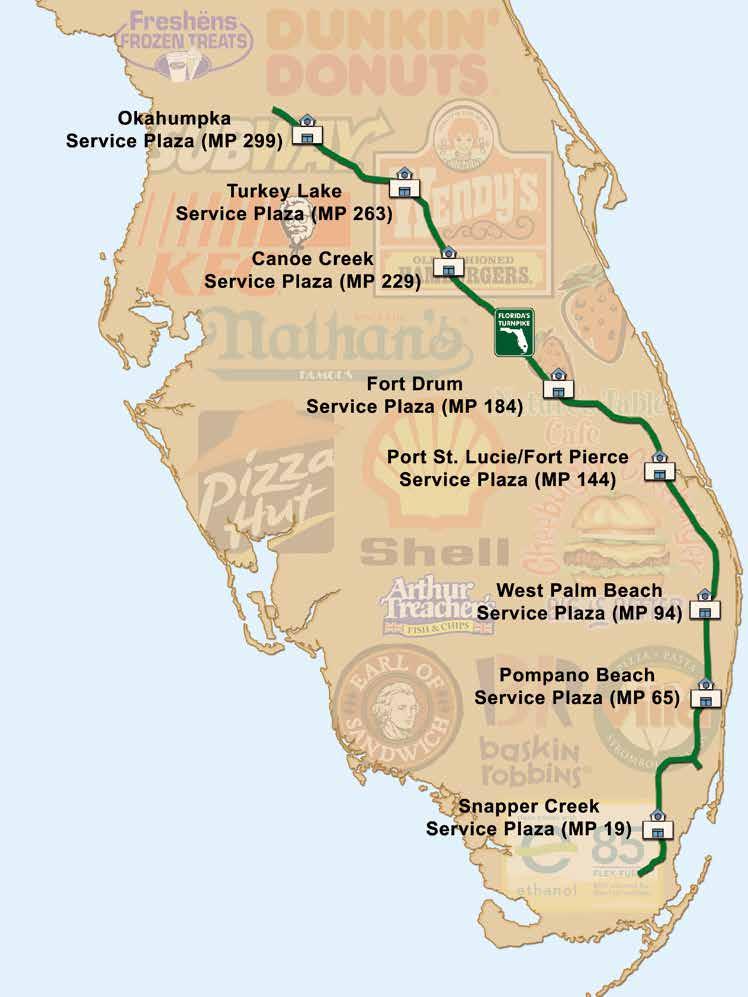
20 Florida s Turnpike Enterprise Okahumpka Service Plaza The Okahumpka Service Plaza is the northernmost service plaza on the Turnpike mainline, located at Milepost 299, just 10 miles south of the Turnpike s northern terminus at Interstate 75. For southbound travelers on Florida s Turnpike, this is the first opportunity to visit a service plaza. The estimated average daily traffic volume entering the plaza is 3,002. The plaza captures nine percent of the total cars and nine percent of the total trucks that pass by on the Turnpike. Table 3-1 Okahumpka Average Day by the Numbers The Okahumpka Service Plaza received an overall average rating of Good by 84 percent of customers. This is a two point decrease from the previous year. Ratings for the Okahumpka Service Plaza decreased in all areas with the exception of restroom cleanliness at the restaurant building which saw a small two point increase. Okahumpka is one of two plazas where renovations have not begun. Number of Vehicles Entering the Plaza 3,002 Service Plaza Capture Rate for Cars 9% Service Plaza Capture Rate for Commercial Trucks 9% Table 3-2 Okahumpka Scorecard Restaurant Building Good Fair Poor Fuel Station FY 2014 Overall Average 80% 13% 7% % 2% 2% % 13% 3% FY 2013 Overall Average 86% 14% 0% FY 2012 Overall Average 82% 15% 3% 16
 and four miles north of Interstate 4.")

21 FY 2014 Service Plaza Customer Survey Turkey Lake Service Plaza The Turkey Lake Service Plaza is located at Milepost 263 on Florida s Turnpike within the Orlando Urban Area. It is located approximately two miles south of the Spessard L. Holland East-West Expressway (S.R. 408) and four miles north of Interstate 4. In FY 2014, the estimated average daily capture at Turkey Lake was 2,878 vehicles. Based on the data collected, the plaza captures five percent of cars and six percent of trucks that pass by on the Turnpike. Unlike FY 2013, both the restaurant and fuel station were surveyed in FY The fuel station received an overall average customer score of 98 percent Good. This is an eight point increase in the overall score from last year. The completion of the new restaurant building is the most likely reason for the improvement in the plaza score. Fuel station general appearance and restroom cleanliness categories also saw an improvement from the previous year. Table 3-3 Turkey Lake Average Day by the Numbers Number of Vehicles Entering the Plaza Service Plaza Capture Rate for Cars Service Plaza Capture Rate for Commercial Trucks 2,878 5% 6% Table 3-4 Turkey Lake Scorecard Restaurant Building Good Fair Poor 91% % 1 3 1% 0 1 Fuel Station FY 2014 Overall Average 98% 2% 0% % 2% 0% FY 2013 Overall Average 92% 7% 1% FY 2012 Overall Average 82% 13% 5% 17


22 Florida s Turnpike Enterprise Canoe Creek Service Plaza The Canoe Creek Service Plaza is located at Milepost 229 and is 11 miles south of the Kissimmee Park Road Interchange in Osceola County. The major Orlando attractions of Walt Disney World, Universal Studios, and Sea World are located about 20 miles northwest of the plaza. With approximately 4,280 vehicles entering the Canoe Creek Plaza daily, the capture of traffic from the Turnpike averages 18 percent for cars and 13 percent for trucks. The plaza featured the second largest increase in average daily traffic compared to last year. Canoe Creek along with Fort Drum and Port St. Lucie/Fort Pierce Service Plazas have the highest capture rates among the eight plazas. Table 3-5 Canoe Creek Average Day by the Numbers Number of Vehicles Entering the Plaza 4,280 Service Plaza Capture Rate for Cars 18% Construction at the restaurant was nearly completed during the survey, though minor work was still ongoing during collection. Both the restaurant and fuel station were surveyed. The overall average Good score for Canoe Creek was 89 percent, down four points from FY The lower score is, in part, due to the 14 point decrease in quality of service at the fuel station from the preceding year. Service Plaza Capture Rate for Commercial Trucks 13% Table 3-6 Canoe Creek Scorecard Restaurant Building Good Fair Poor Fuel Station 80% 13% 7% % 21% 0% FY 2014 Overall Average FY 2013 Overall Average FY 2012 Overall Average 89% 11% 0% 93% 7% 0% Not Surveyed 18


23 FY 2014 Service Plaza Customer Survey Fort Drum Service Plaza The Fort Drum Service Plaza is located at Milepost 184, nine miles south of the Yeehaw Junction Interchange. It is located between the southern edge of the Orlando Urban Area and the northern edge of Florida s southeastern urban corridor. This plaza has an average of 5,556 vehicles entering on a daily basis. Fort Drum has the highest capture rate for cars at 22 percent and for commercial trucks at 13 percent. This was the first year the survey was conducted at the restaurant and fuel station since construction was completed and the dramatic change in scores reflects this. The plaza scored an overall average of 97 percent Good in the FY 2014 survey. This was a 30 point increase from the overall average score from last year. All restaurant customer service measures received Good ratings from at least 94 percent of respondents. Fort Drum received a Good rating from 97 percent of surveyed customers at the fuel station convenience store in the quality of service category. The restroom cleanliness received a Good rating from 99 percent of customers, a 43 point increase from the previous year, in which restrooms were housed in temporary facilities. Table 3-7 Fort Drum Average Day by the Numbers Number of Vehicles Entering the Plaza 5,556 Service Plaza Capture Rate for Cars 22% Service Plaza Capture Rate for Commercial Trucks 13% Table 3-8 Fort Drum Scorecard Restaurant Building Good Fair Poor Fuel Station 94% 5% 1% % 3% 0% FY 2014 Overall Average FY 2013 Overall Average FY 2012 Overall Average 97% 3% 0% 67% 24% 9% 84% 13% 3% 19


24 Florida s Turnpike Enterprise Port St. Lucie/Fort Pierce Service Plaza The Port St. Lucie/Fort Pierce Service Plaza is located at Milepost 144, approximately eight miles south of the Fort Pierce interchange at S.R. 70. One mile east of the Turnpike, S.R. 70 has an interchange with Interstate 95. North of the Fort Pierce interchange, Interstate 95 is aligned along the east coast of Florida, while the Turnpike takes a more northwestward orientation to Orlando and Central Florida. Because of this, many travelers transfer from one highway to the other at this location. The average daily number of vehicles entering the Port St. Lucie/Fort Pierce Service Plaza is 4,788, the second highest recorded in the survey this year. The capture rate is 16 percent of the cars and 13 percent of the trucks traveling on the Turnpike at this plaza location. Table 3-9 Port St. Lucie/Fort Pierce Average Day by the Numbers Number of Vehicles Entering the Plaza Service Plaza Capture Rate for Cars Service Plaza Capture Rate for Commercial Trucks Table 3-10 Port St. Lucie/Fort Pierce Scorecard 4,788 16% 13% The overall average Good rating for the Port St. Lucie/ Fort Pierce Service Plaza was 79 percent. This was a three point decline from the previous year. In the individual scoring categories compared to last year, the restaurant building scored higher in all categories except restroom cleanliness, which saw a nine point decrease. At the fuel station, the Port St. Lucie/Fort Pierce Service Plaza received lower scores in all three measures. There was no on-going construction during the survey period and renovations are not yet underway at this plaza. Restaurant Building Good Fair Poor 87% % % 2 7 Fuel Station FY 2014 Overall Average FY 2013 Overall Average FY 2012 Overall Average 92% 6% 2% % 17% 4% 82% 14% 4% 88% 11% 1% 20


25 FY 2014 Service Plaza Customer Survey West Palm Beach Service Plaza The West Palm Beach Service Plaza is located at Milepost 94, five miles south of the Turnpike West Palm Beach Interchange at Okeechobee Boulevard and just north of the Lake Worth Road Interchange. The average daily number of vehicles entering the West Palm Beach Service Plaza is 4,425, based on the counts made during the survey period this year. The service plaza captured eight percent of passenger vehicles and nine percent of commercial trucks passing the plaza. The FY 2014 scores for the West Palm Beach Plaza increased in all categories from the previous year. The overall average Good score of 99 percent for this year is a seven point improvement since last year and had the highest overall percentage of Good ratings from customers. The newly renovated restaurant building also captured the highest percentage of Good ratings as well. The fuel station general appearance received Good ratings from 100 percent of customers during the survey period, up 15 points from last year and is also likely attributable to the completion of construction around the plaza. The fuel station restroom cleanliness Good rating increased to 98 percent, up five points from last year. Table 3-11 West Palm Beach Average Day by the Numbers Number of Vehicles Entering the Plaza 4,425 Service Plaza Capture Rate for Cars Service Plaza Capture Rate for Commercial Trucks 8% 9% Table 3-12 West Palm Beach Scorecard Restaurant Building Good Fair Poor 95% 4% 1% Fuel Station FY 2014 Overall Average % 1% 0% % 1% 0% FY 2013 Overall Average 92% 7% 1% FY 2012 Overall Average 84% 14% 2% 21


26 Florida s Turnpike Enterprise Pompano Beach Service Plaza The Pompano Beach Service Plaza is located at Milepost 65, on the western limits of the City of Pompano Beach. It is approximately two miles north of the Commercial Boulevard Interchange, and immediately south of Atlantic Boulevard. It is 11 miles south of the north end of Sawgrass Expressway to the west. On average, 3,973 vehicles per day enter the plaza. Overall, this represents a capture rate of about five percent of all vehicles passing by on the Turnpike. Vehicle classification counts were not available at Pompano; therefore, it is not possible to report a breakdown of capture rate between cars and trucks. Table 3-13 Pompano Beach Average Day by the Numbers Number of Vehicles Entering the Plaza Service Plaza Capture Rate for Cars Service Plaza Capture Rate for Commercial Trucks Overall Service Plaza Capture Rate Table 3-14 Pompano Beach Scorecard 3,973 N/A N/A 5% Restaurant Building Good Fair Poor 89% % 3 6 1% 1 0 Both the restaurant and fuel station surveys were conducted this year at the Pompano Beach Plaza. Renovations at Pompano were completed in FY 2013, and the improved conditions were reflected in the survey scores. The surveys at the fuel station produced the second highest Good ratings of any plaza for general appearance (99 percent) and the highest for restroom cleanliness (99 percent). The overall average Good rating of 96 percent was one point lower than FY The quality of service rating for the fuel station/ convenience store was 96 percent Good, also one point lower than the previous year. It must be noted that, unlike the layout of many other plazas which feature separate convenience store and restaurant buildings, the convenience store and restaurant area are located within the same building which may have an effect on the survey scores in the fuel station/convenience store portion. Fuel Station FY 2014 Overall Average 96% 4% 0% % 4% 0% FY 2013 Overall Average 96% 4% 0% FY 2012 Overall Average 60% 25% 15% 22


27 FY 2014 Service Plaza Customer Survey Snapper Creek Service Plaza The Snapper Creek Service Plaza, at Milepost 19, is the southernmost service plaza on the system and the only service plaza on the Turnpike Extension in Miami- Dade County. It is located south of the Kendall Drive interchange within the incorporated City of Kendall. On an average day, 1,857 vehicles enter the service plaza each day. This represents a combined capture rate for cars and commercial trucks of about two percent, the lowest among the plazas surveyed. Vehicle classification counts were not available at Snapper Creek. The layout of the Snapper Creek Service Plaza differs from all other service plazas. Only a fuel station, a small convenience store and a separate restroom building are located on site. Construction of the new restroom building, renovations at the fuel station, and plaza convenience store was completed during Because there is no restaurant building, only the fuel station survey is conducted at this plaza. The completion of the renovations at the fuel station was likely a factor in the improvement of the plaza scores when compared to the FY 2013 results. The plaza received an overall rating of Good from 98 percent of customers surveyed, a four point improvement over last year. This resulted from a score of 98 percent Good on the quality of service rating (up one point from last year), a 12 point gain to 97 percent Good on general appearance, and a 1 point decline, to 98 percent Good in the restroom cleanliness category. Table 3-15 Snapper Creek Average Day by the Numbers Number of Vehicles Entering the Plaza Service Plaza Capture Rate for Cars Service Plaza Capture Rate for Commercial Trucks Overall Service Plaza Capture Rate Restaurant Building Good Fair Poor Table 3-16 Snapper Creek Scorecard Not Surveyed 1,857 2% N/A 2% Fuel Station FY 2014 Overall Average 98% 2% 0% % 2% 0% FY 2013 Overall Average 94% 4% 2% FY 2012 Overall Average 74% 20% 6% 23


28 Florida s Turnpike Enterprise 24

29 FY 2014 Service Plaza Customer Survey Section Four Service Plaza Customer and Travel Information This section of the report summarizes customer responses to survey questions regarding travel characteristics. The information includes vehicle type, vehicle occupancy, trip purpose, trip origin and destination, and residency of service plaza customers. Vehicle Characteristics Vehicle information collected during the survey includes vehicle type and average occupancy. As shown in Table 4-1, 93 percent of those surveyed at the service plazas said they were traveling in automobiles, sport utility vehicles (SUVs), vans, motorcycles, or passenger trucks. Of those respondents, 18 percent reported their vehicles as rentals, a four point increase from last year, while those reporting privately-owned vehicles decreased by five points to 75 percent. The percentage of commercial trucks and motor homes/rvs remained at five percent, while buses made up the remaining two percent. Table 4-1 Vehicle Type Distribution Autos, SUVs, Motorcyles, Pickups, Vans Service Plaza Private Rental Total Commercial Truck and Motorhome/RV Bus Okahumpka Turkey Lake Canoe Creek Fort Drum Port St. Lucie/Fort Pierce West Palm Beach Pompano Beach Snapper Creek FY 2014 Overall Average 85% 10% 95% 5% 0% % 18% 93% 5% 2% FY 2013 Overall Average 80% 14% 94% 5% 1% FY 2012 Overall Average 76% 17% 93% 6% 1% 25

30 Florida s Turnpike Enterprise Trip Purpose Trip purpose data is a combination of survey responses collected on week days and weekends, weighted to account for the higher number of weekdays. As shown in Table 4-2, 29 percent of trips were reported as work/business related, which was four points lower than FY The tourism/vacation trips increased five points from last year to 34 percent. Social/family/ recreation travelers remained the same at 35 percent. Service Plaza Okahumpka Turkey Lake Canoe Creek Fort Drum Port St. Lucie/Fort Pierce West Palm Beach Pompano Beach Snapper Creek Table 4-2 Trip Purpose Work/ Business Tourism/ Vacation Social/ Family/ Recreation Other 19% 30% 48% 3% FY 2014 Overall Average 29% 34% 35% 2% FY 2013 Overall Average 33% 29% 35% 3% FY 2012 Overall Average 31% 32% 34% 3% Vehicle Occupancy Port St. Lucie/Fort Pierce and Canoe Creek Service Plazas recorded the highest average vehicle occupancy as shown below in Table 4-3. This is consistent with the higher percentage of tourism/vacation trip types reported at these locations. The FY 2014 overall average vehicle occupancy was 2.15, up slightly from FY Table 4-3 Average Vehicle Occupancy Service Plaza Okahumpka Turkey Lake Canoe Creek Fort Drum Port St. Lucie/Fort Pierce West Palm Beach Pompano Beach Snapper Creek FY 2014 Overall Average Average Occupancy FY 2013 Overall Average 2.11 FY 2012 Overall Average

31 FY 2014 Service Plaza Customer Survey Origin and Destination Information Table 4-4 lists the top origins and destinations for survey respondents. Orlando, Miami, and Fort Lauderdale ranked as the top origins and destinations in the FY 2014 survey. West Palm Beach, Boca Raton, Gainesville, Ocala, Homestead, and Key West were among other cities that ranked in the top 10 origins or destinations in the survey this year. Georgia remained the most common out of state origin and destination. The list of top origin and destination cities has remained relatively unchanged for the past decade. Table 4-4 Top 10 Origins and Destinations Origin Destination City Percent City Percent Orlando Miami Fort Lauderdale West Palm Beach Georgia Gainesville Homestead Ocala Tallahassee Boca Raton 17% Orlando 20% 14 Miami 14 6 Fort Lauderdale 6 3 Tallahassee 4 3 Georgia 4 3 West Palm Beach 3 3 Key West 3 3 Gainesville 2 2 Ocala 2 2 Homestead 2 Residency Characteristics of Service Plaza Customers Residency characteristics consider what percentage of service plaza customers are Florida residents versus residents of other states or visitors from foreign countries. This year, 71 percent of surveyed customers were Florida residents, a five year low, down five percentage points from FY 2013 as shown in Table 4-5. This year, the percentage of those surveyed with residency in another state remained at 18 percent. Respondents from foreign countries made up 11 percent of the customers, the highest percentage in five years. Table 4-5 Residential Status Service Plaza Florida Another U.S. State Another Country Okahumpka Turkey Lake Canoe Creek Fort Drum Port St. Lucie/Fort Pierce West Palm Beach Pompano Beach Snapper Creek 69% 29% 2% FY 2014 Overall Average 71% 18% 11% FY 2013 Overall Average 76% 18% 6% FY 2012 Overall Average 73% 19% 8% 27
32 28
33 Restaurant Building Survey Questions FY 2014 Service Plaza Customer Survey 1. Are you a Florida resident? 10. Was the Price You Paid: m Yes - Zip Code m No IF NO: US Resident? m Yes - State m No - Country m About What You Expected m Higher Than Expected m Lower Than Expected 11. Please Rate the You Received: m Male m Female Good Fair Poor N/O m m m m 2. Where did this trip orignate? 12. Will you eat your food inside the plaza or carry out? m Eat In m Carry Out 3. Where will this trip end today? (City/State) 13. Did You Stop at Another Service Plaza on This Trip? Yes m No m ----->SKIP TO What is the primary purpose of this trip? 13b. Did you purchase? Food/Drink: Yes m No m m To or From Work m Medical/Dental m Business/Delivery m Shopping Fuel: Yes m No m m Tourism/Vacation m To or From School m Social/Family m Recreation Other Than Vacation 14. Will You Stop at Another Service Plaza on This Trip? Yes m No m ----->SKIP TO 15 14b. Will you purchase? Food/Drink: Yes m No m 5. How Often Do You Make This Trip for This Purpose? Fuel: Yes m No m Trips/Day Trips/Week 15. Which Other Services Did/Will You Use While You Are Here? Trips/Month Trips/Year m Restrooms m Walk a Pet m Lottery m Information m ATM m Gift Shop First Time Ever Other m Rest/Break m Telephone m Internet Access m Other 6. What Type of Vehicle are You Riding in? 16. What other products/services would you use if offered here? Auto (Includes Pick-up Truck, SUV, Van): m Private m Rented m Movie/Game Rental m Travel Services m Jewelry m SunPass Replenishment Bus: m m Electronics m Carpool Parking m Other Commercial Truck: m 17. Do you have any additional comments or suggestions as to Motor Home/RV: m how the Turnpike can improve the Service Plazas or any other Turnpike service? Other (describe): m If Auto, what is the engine type: m Electric (EV) or Hybrid m Non-Electric If Rental, Was the Vehicle Rented in Florida? m Yes m No - City/State 7. If Not a Bus: Number of People Riding in Vehicle. Number of Adults: Number of Children: 8. How Do You Rate the Service Plaza With Regard to: Good Fair Poor N/O : m m m m Cleanliness of Restrooms: m m m m 9. Did You Purchase Food/Drink at THIS Plaza? m Yes m No -----> SKIP TO 13 m Will Before Leaving -----> SKIP TO 13 29
34 Fuel Station Survey Questions FY 2014 Service Plaza Customer Survey 1. Are you a Florida resident? 10. Was the price you paid: m Yes - Zip Code m About What You Expected m No m Higher Than Expected m Lower Than Expected IF NO: US Resident? m Yes - State 11. Did you visit the convenience store at THIS fuel station? m No - Country m Yes m Male m Female m No -----> SKIP TO 12 m Will Before Leaving -----> SKIP TO Where did this trip originate today? (City/State) 11b. Please rate the service you received Good Fair Poor N/O m m m m 3. Where will this trip end today? (City/State) 12. Did you stop at another service plaza on this trip? Yes m No m -----> SKIP TO What is the primary purpose of this trip? 12b. Did you purchase? Food/Drink: Yes m No m m To or From Work m Medical/Dental m Business/Delivery m Shopping Fuel: Yes m No m m Tourism/Vacation m To or From School m Social/Family m Recreation Other Than Vacation 13. Will you stop at another service plaza on this trip? Yes m No m ----->SKIP TO 14 13b. Will you purchase? Food/Drink: Yes m No m 5. How often do you make this trip for this purpose? Fuel: Yes m No m Trips/Day Trips/Week 14. Which other services did/will you use while you are here? Trips/Month Trips/Year m Restrooms m Walk a Pet m Lottery m Information m ATM m Gift Shop (other than lottery) First Time Ever Other m Rest/Break m Telephone m Internet Access m Other 6. What type of vehicle are you riding in? 15. Do you have any additional comments or suggestions as to Auto (Includes Pick-up Truck, SUV, Van): how the Turnpike can improve the Service Plazas or any m Private m Rented other Turnpike service? Bus: Commercial Truck: m m Motor Home/RV: m Other (describe): m If Auto, what is the engine type: m Electric (EV) or Hybrid m Non-Electric If Rental, Was the Vehicle Rented in Florida? m Yes m No - City/State 7. If not a bus: Number of people riding in vehicle. Number of Adults: Number of Children: 8. How do you rate the fuel service area with regard to: Good Fair Poor N/O : m m m m Cleanliness of Restrooms: m m m m 9. Did you purchase fuel or automotive products at THIS plaza? 30 m Yes m No -----> SKIP TO 11 m Will Before Leaving -----> SKIP TO 11
35


36 Florida s Turnpike Enterprise Turnpike Headquarters, Milepost 263 Building 5315 Turkey Lake Service Plaza Ocoee, FL
Expansion Projects Description
 Expansion Projects Description The Turnpike expansion program was authorized by the Florida Legislature in 1990 to meet the State s backlog of needed highway facilities. The Legislature set environmental
BACKGROUND. Dear Mr. Dietrich:
 Mr. Bren Dietrich, C.P.A. December 28, 2018 Chief Financial Officer, Florida s Turnpike Enterprise Florida Department of Transportation Florida s Turnpike, Milepost 263 Building 5315, Turkey Lake Service
Executive Summary. Florida Department of Transportation ENTERPRISE TOLL OPERATIONS
 This Traffic Engineer s Annual Report provides a comprehensive look at the conditions of the five toll facilities throughout the state that are owned by the Florida Department of Transportation (the Department)
National Household Travel Survey Add-On Use in the Des Moines, Iowa, Metropolitan Area
 National Household Travel Survey Add-On Use in the Des Moines, Iowa, Metropolitan Area Presentation to the Transportation Research Board s National Household Travel Survey Conference: Data for Understanding
TRAFFICENGINEER S. Florida sturnpikesystem FiscalYearEndedJune30,2015. FloridaDepartmentofTransportation
 TRAFFICENGINEER S ANNUALLETTERREPORT Florida sturnpikesystem FiscalYearEndede30,2015 FloridaDepartmentofTransportation This page intentionally left blank. Mrs. Nicola A. Liquori, C.P.A. November 30, 2015
TRAFFIC ENGINEER S ANNUAL LETTER REPORT
 TRAFFIC ENGINEER S ANNUAL LETTER REPORT Fiscal Year Ended e 30, 2013 Florida Department of Transportation Mrs. Nicola A. Liquori, C.P.A. December 23, 2013 Chief Financial Officer, Florida s Turnpike Enterprise
Denver Car Share Program 2017 Program Summary
 Denver Car Share Program 2017 Program Summary Prepared for: Prepared by: Project Manager: Malinda Reese, PE Apex Design Reference No. P170271, Task Order #3 January 2018 Table of Contents 1. Introduction...
IMPACT OF GASOLINE PRICES ON LAS VEGAS VISITATION FROM SOUTHERN CALIFORNIA AND LAS VEGAS LOCALS
 Monday, June 30, 2008 IMPACT OF GASOLINE PRICES ON LAS VEGAS VISITATION FROM SOUTHERN CALIFORNIA AND LAS VEGAS LOCALS Executive Summary There is a direct correlation between rising gas prices and reduced
Where are the Increases in Motorcycle Rider Fatalities?
 Where are the Increases in Motorcycle Rider Fatalities? Umesh Shankar Mathematical Analysis Division (NPO-121) Office of Traffic Records and Analysis National Center for Statistics and Analysis National
2009/10 NWT Aurora Visitor Survey Report. Industry, Tourism and Investment Government of the Northwest Territories
 2009/10 NWT Aurora Visitor Survey Report Industry, Tourism and Investment Government of the Northwest Territories INTRODUCTION... 3 SURVEY METHODOLOGY... 4 EXECUTIVE SUMMARY... 5 VISITOR PROFILE... 7 AGE...
Who has trouble reporting prior day events?
 Vol. 10, Issue 1, 2017 Who has trouble reporting prior day events? Tim Triplett 1, Rob Santos 2, Brian Tefft 3 Survey Practice 10.29115/SP-2017-0003 Jan 01, 2017 Tags: missing data, recall data, measurement
Trip and Parking Generation Data Collection at Grocery Store with Gas Station and Auto Repair
 Trip and Parking Generation Data Collection at Grocery Store with Gas Station and Auto Repair Final Report 2011 ITE District 6 - Data Collection Project Institute of Transportation Engineers Student Chapter
North Florida Transportation Survey
 North Florida Transportation Survey 2008 A Survey of Residents of Clay, Duval, Nassau, and St. Johns Counties Prepared by: Jim Flagg, Vice President 1329 Kingsley Avenue, Suite A Orange Park, Florida 32073
Florida s Turnpike Enterprise. Incident Management Program for All Levels & Specialty Towing & Roadside Repair (STARR)
") Florida s Turnpike Enterprise Incident Management Program for All Levels & Specialty Towing & Roadside Repair (STARR) Florida s Turnpike System Largest Toll System in Florida 460 Centerline Miles 2 Million
Florida s Turnpike Enterprise Incident Management Program for All Levels & Specialty Towing & Roadside Repair (STARR) Florida s Turnpike System Largest Toll System in Florida 460 Centerline Miles 2 Million
Kauai Resident Travel Survey: Summary of Results
 Kauai Resident Travel Survey: Summary of Results Kauai Multimodal Land Transportation Plan Charlier Associates, Inc. November 23, 2011 1 Table of Contents Executive Summary... 2 Survey Goals and Methodology...
American Driving Survey,
 RESEARCH BRIEF American Driving Survey, 2015 2016 This Research Brief provides highlights from the AAA Foundation for Traffic Safety s 2016 American Driving Survey, which quantifies the daily driving patterns
Trip Generation and Parking Study New Californian Apartments, Berkeley
 Trip Generation and Parking Study New Californian Apartments, Berkeley Institute of Transportation Engineers University of California, Berkeley Student Chapter Spring 2012 Background The ITE Student Chapter
Puerto Rico: Impact of the Car Seat Campaign
 Puerto Rico: Impact of the Car Seat Campaign Final Report Submitted to: Traffic Safety Commission of Puerto Rico February 9, 2018 Puerto Rico: Impact of the Car Seat Campaign TABLE OF CONTENT INTRODUCTION...
More persons in the cars? Status and potential for change in car occupancy rates in Norway
 Author(s): Liva Vågane Oslo 2009, 57 pages Norwegian language Summary: More persons in the cars? Status and potential for change in car occupancy rates in Norway Results from national travel surveys in
LOADING AND UNLOADING SURVEY NATIONAL SCHOOL BUS. Kansas leads the world in the success of each student.
 NATIONAL SCHOOL BUS LOADING AND UNLOADING SURVEY Kansas leads the world in the success of each student. January 2018 The Kansas State Department of Education School Bus Safety Unit wishes to thank the
Florida Department of Transportation. Road Ranger Performance Measures 2nd Quarter Report. October 1 to December 31, 2014 Fiscal Year (FY) 2014/2015
 2014/2015") Florida Department of Transportation Road Ranger Performance Measures 2nd Quarter Report October 1 to December 31, 2014 Fiscal Year (FY) 2014/2015 Prepared by: Florida Department of Transportation Commercial
Florida Department of Transportation Road Ranger Performance Measures 2nd Quarter Report October 1 to December 31, 2014 Fiscal Year (FY) 2014/2015 Prepared by: Florida Department of Transportation Commercial
appendix 4: Parking Management Study, Phase II
 appendix 4: Parking Management Study, Phase II A4-1 A4-2 Eastlake Parking Management Study Final Phase 2 Report Future Parking Demand & Supply January 6, 2017 Submitted by Denver Corp Center III 7900 E.
Act 229 Evaluation Report
 R22-1 W21-19 W21-20 Act 229 Evaluation Report Prepared for Prepared by Table of Contents 1. Documentation Page 3 2. Executive Summary 4 2.1. Purpose 4 2.2. Evaluation Results 4 3. Background 4 4. Approach
Monterey County Freeway Service Patrol Annual Report
 Monterey County Freeway Service Patrol Annual Report Fiscal Year 2012 2013 Tow Trucks to the Rescue What is the Freeway Service Patrol Program? The purpose of the Freeway Service Patrol is to provide for
Missouri Seat Belt Usage Survey for 2017
 Missouri Seat Belt Usage Survey for 2017 Conducted for the Highway Safety & Traffic Division of the Missouri Department of Transportation by The Missouri Safety Center University of Central Missouri Final
Attachment D Environmental Justice and Outreach
 Attachment D Environmental Justice and Outreach ATTACHMENT D Environmental Justice and Outreach Indicate whether the project will have disproportionately high and adverse impacts on minority or low income
Trip Generation and Parking Utilization Data Collection at Mini-Mart with Gas Station
 Trip Generation and Parking Utilization Data Collection at Mini-Mart with Gas Station Final Report 2013 ITE District 6 - Data Collection Project Institute of Transportation Engineers Student Chapter at
SPARTA Ridership Satisfaction Study
 SPARTA Ridership Satisfaction Study Presented by the Students of CRP 814 Gowtham Cherukumalli, Sam Keith, Kelsey Lantz, Nabarjun Vashisth, & Nelson Yaksic Vera With Guidance from Dr. Eric A. Morris INTRODUCTION
Introduction and Background Study Purpose
 Introduction and Background The Brent Spence Bridge on I-71/75 across the Ohio River is arguably the single most important piece of transportation infrastructure the Ohio-Kentucky-Indiana (OKI) region.
2018 Automotive Fuel Economy Survey Report
 2018 Automotive Fuel Economy Survey Report The Consumer Reports Survey Team conducted a nationally representative survey in May 2018 to assess American adults attitudes and viewpoints on vehicle fuel economy.
Florida Department of Transportation. Road Ranger Performance Measures Annual Report. July 1, 2015 to June 30, 2016 Fiscal Year (FY) 2015/2016
 2015/2016") Florida Department of Transportation Road Ranger Performance Measures Annual Report July 1, 2015 to June 30, 2016 Fiscal Year (FY) 2015/2016 Prepared by: Florida Department of Transportation Commercial
Florida Department of Transportation Road Ranger Performance Measures Annual Report July 1, 2015 to June 30, 2016 Fiscal Year (FY) 2015/2016 Prepared by: Florida Department of Transportation Commercial
CO 2 Emissions: A Campus Comparison
 Journal of Service Learning in Conservation Biology 3:4-8 Rachel Peacher CO 2 Emissions: A Campus Comparison Abstract Global warming, little cash inflow, and over-crowded parking lots are three problems
TRANSPORTATION REVIEW
 TRANSPORTATION REVIEW - PROPOSED MIX OF LAND USES IS CONSISTENT WITH THE CITY S UNDER THE GRANVILLE BRIDGE POLICIES THAT AIM TO MEET NEIGHBOURING RESIDENTS SHOPPING NEEDS AND REDUCE RELIANCE ON AUTOMOBILE
Click to edit Master title style
 Nelson/Nygaard Consulting Associates SERVICE IMPROVEMENT STRATEGIES September 22, 2015 1 PROJECT OVERVIEW & WORK TO DATE 1. Extensive stakeholder involvement Throughout 2. System and market assessment
Michigan. Traffic. Profile
 June 2014 Revised 5/11/15 Michigan 2013 Traffic Crash Profile Reporting Criteria Please pay particular attention to the wording when interpreting the three levels of data gathered for this report. Crash
DRAFT Subject to modifications
 TREASURE COAST REGIONAL PLANNING COUNCIL M E M O R A N D U M DRAFT To: Council Members AGENDA ITEM 7A From: Date: Subject: Staff September 17, 2010 Council Meeting High Speed Rail Update Introduction The
MEMORANDUM FPN: State Road: 91 County: Osceola (92)
") Traffic and Revenue Consultant Florida s Turnpike Enterprise Florida Department of Transportation MEMORANDUM Date: October 14, 2013 To: From: Copies: Subject: Tom Neyer, Production Project Manager Emam
Traffic and Revenue Consultant Florida s Turnpike Enterprise Florida Department of Transportation MEMORANDUM Date: October 14, 2013 To: From: Copies: Subject: Tom Neyer, Production Project Manager Emam
Downtown Lee s Summit Parking Study
 Downtown Lee s Summit Parking Study As part of the Downtown Lee s Summit Master Plan, a downtown parking and traffic study was completed by TranSystems Corporation in November 2003. The parking analysis
Madison BRT Transit Corridor Study Proposed BRT Operations Plans
 Madison BRT Transit Corridor Study Proposed BRT Operations Plans This paper presents a description of the proposed BRT operations plan for use in the Madison BRT Transit Corridor Study. The objective is
Trip Generation Study: Provo Assisted Living Facility Land Use Code: 254
 Trip Generation Study: Provo Assisted Living Facility Land Use Code: 254 Introduction The Brigham Young University Institute of Transportation Engineers (BYU ITE) student chapter completed a trip generation
2 EXISTING ROUTE STRUCTURE AND SERVICE LEVELS
 2 EXISTING ROUTE STRUCTURE AND SERVICE LEVELS In the Study Area, as in most of the Metro Transit network, there are two distinct route structures. The base service structure operates all day and the peak
TRAFFIC PARKING ANALYSIS
 TRAFFIC PARKING ANALYSIS NAPA FLEA MARKET COUNTY OF NAPA Prepared for: Tom Harding Napa-Vallejo Flea Market 33 Kelly Road American Canyon, CA 9453 Prepared by: 166 Olympic Boulevard, Suite 21 Walnut Creek,
2016 Community Report De Baca County
 6 De Baca County Produced for the New Mexico Department of Transportation, Traffic Safety Division, Traffic Records Bureau, Under Contract 58 by the University of New Mexico, Geospatial and Population
I.11Tc1ER.S Eagleton nstitute PoIitcs New Bruriswck Ne s Jersey : C[Lic 4ar-ICbgCr/EAGLETON POLL
 Other newspapers may also use this information in their Sunday and back-ground memo will appear in Sunday s Star-Ledger. A story based on the survey findings presented in this release RELEASE INFORMATION
Tennessee Soybean Producers Views on Biodiesel Marketing
 Tennessee Soybean Producers Views on Biodiesel Marketing By Kim Jensen, Burton English, and Jamey Menard* April 2003 *Professors and Research Associate, respectively, Department of Agricultural Economics,
PARKING OCCUPANCY IN WINDSOR CENTER
 PARKING OCCUPANCY IN WINDSOR CENTER TOWN OF WINDSOR, CONNECTICUT REPORT JUNE 2017 CONTENTS Background... 3 Other Relevant Data... 3 Parking Survey Design... 6 Parking Supply Inventory... 6 Parking Demand
Community Outreach Meetings
 Community Outreach Meetings BCT At A Glance 410 square miles service area More than 41.5 million annual trips 327 fixed-route buses 44 bus routes 78 Community Buses in 19 Municipalities BCT At A Glance
Trip Generation & Parking Occupancy Data Collection: Grocery Stores Student Chapter of Institute of Transportation Engineers at UCLA Spring 2014
 Trip Generation & Parking Occupancy Data Collection: Grocery Stores Student Chapter of Institute of Transportation Engineers at UCLA Spring 2014 Page 1 Introduction The UCLA Institute of Transportation
Nebraska Teen Driving Experiences Survey Four-Year Trend Report
 Nebraska Teen Driving Experiences Survey Four-Year Trend Report 2014-2015, 2015-2016, and 2017-2018 School Years April 2018 Division of Public Health Injury Prevention Program Table of Contents Executive
TABLE OF CONTENTS EXECUTIVE SUMMARY...1 INTRODUCTION...3 PROJECTED FUTURE GROWTH...3 ROADWAY IMPROVEMENT PROJECTS...4 POTENTIAL FUNDING SOURCES...
 Transportation Impact Fee Study September 2014 TABLE OF CONTENTS EXECUTIVE SUMMARY...1 INTRODUCTION...3 PROJECTED FUTURE GROWTH...3 ROADWAY IMPROVEMENT PROJECTS......4 POTENTIAL FUNDING SOURCES...7 PROPOSED
9. Downtown Transit Plan
 CORRADINO 9. Downtown Transit Plan KAT Transit Development Plan As part of the planning process for the TDP, an examination of downtown transit operations was conducted. The Downtown Transit Plan 1 is
US 81 Bypass of Chickasha Environmental Assessment Public Meeting
 US 81 Bypass of Chickasha Environmental Assessment Public Meeting March 14, 2013 Introductions ODOT FHWA SAIC Meeting Purpose Present need for bypass Provide responses to 10/04/11 public meeting comments
Alpine Highway to North County Boulevard Connector Study
 Alpine Highway to North County Boulevard Connector Study prepared by Avenue Consultants March 16, 2017 North County Boulevard Connector Study March 16, 2017 Table of Contents 1 Summary of Findings... 1
Fire Station Location Study
 Fire Rescue Department Fire Station Location Study March 24, 2015 PRESENTATION OUTLINE BACKGROUND SCOPE OF THE STUDY STUDY METHODOLOGY STUDY COMPONENTS SUMMARY QUESTIONS CURRENT SERVICE LEVEL NUMBER OF
DOWNTOWN PARKING STUDY AND STRATEGIC PLAN
 INTRODUCTION This report includes a summary of several key components of the Rapid City Downtown Parking Study and Strategic Plan, including: Current Conditions Analysis (Inventory and Occupancy and Length
Private Sector Involvement in Sponsoring Sunday Bus Service
 TRANSPORTATION RESEARCH RECORD 1221 Private Sector Involvement in Sponsoring Sunday Bus Service ARUN CHATTERJEE AND FREDERICK J. WEGMANN An increasing amount of deficit and lack of public funds to make
Michigan. Traffic. Profile
 June 2014 Revised 5/11/15 Michigan 2013 Traffic Crash Profile Reporting Criteria Please pay particular attention to the wording when interpreting the three levels of data gathered for this report. Crash
Vacaville Transit Service Evaluation Study Working Paper Two Route and Network Evaluation
 Vacaville Transit Service Evaluation Study Working Paper Two Route and Network Evaluation Prepared for the City of Vacaville Administrative Services Department Prepared by This page left intentionally
CALGARY TRANSIT 2013 CUSTOMER SATISFACTION SURVEY DECEMBER HarGroup. M anagement Consultants
 CALGARY TRANSIT 2013 CUSTOMER SATISFACTION SURVEY DECEMBER 2013 HarGroup M anagement Consultants Table of Contents Executive Summary... i 1.0 INTRODUCTION... 1 1.1 Survey Methodology... 1 1.2 Factors
Table of Contents INTRODUCTION... 3 PROJECT STUDY AREA Figure 1 Vicinity Map Study Area... 4 EXISTING CONDITIONS... 5 TRAFFIC OPERATIONS...
 Crosshaven Drive Corridor Study City of Vestavia Hills, Alabama Table of Contents INTRODUCTION... 3 PROJECT STUDY AREA... 3 Figure 1 Vicinity Map Study Area... 4 EXISTING CONDITIONS... 5 TRAFFIC OPERATIONS...
LONG RANGE PERFORMANCE REPORT. Study Objectives: 1. To determine annually an index of statewide turkey populations and production success in Georgia.
 State: Georgia Grant Number: 08-953 Study Number: 6 LONG RANGE PERFORMANCE REPORT Grant Title: State Funded Wildlife Survey Period Covered: July 1, 2010 - June 30, 2011 Study Title: Wild Turkey Production
2.0 Development Driveways. Movin Out June 2017
 Movin Out June 2017 1.0 Introduction The proposed Movin Out development is a mixed use development in the northeast quadrant of the intersection of West Broadway and Fayette Avenue in the City of Madison.
Seat Belt Survey. Q1. When travelling in a car, do you wear your seat belt all of the time, most of the time, some of the time, or never?
 N F O C F g r o u p Seat Belt Survey Q1. When travelling in a car, do you wear your seat belt all of the time, most of the time, some of the time, or never? The majority of Canadians (85%) wear their seat
Bella Vista Bypass TABEL OF CONTENTS
 TABEL OF CONTENTS DRAFT TRAFFIC AND REVENUE REPORT Introduction 1 Identification of Key Factors from HNTB/WSA Traffic and Revenue Report 3 Summary of 2007 Field Work Data Collection 8 Traffic and Revenue
National Center for Statistics and Analysis Research and Development
 U.S. Department of Transportation National Highway Traffic Safety Administration DOT HS 809 271 June 2001 Technical Report Published By: National Center for Statistics and Analysis Research and Development
2014 Community Report Portales
 4 Portales Produced for the New Mexico Department of Transportation, Traffic Safety Division, Traffic Records Bureau, Under Contract 58 by the University of New Mexico, Geospatial and Population Studies,
CTR Employer Survey Report
 CTR Employer Survey Report Employer Id : E11056 City of Lacey Employer : Worksite : City of Lacey Street : 420 College St Se Jurisdiction : City of Lacey Thank you for completing your Commute Trip Reduction
2002 Virginia Department of Transportation Daily Traffic Volume Estimates Including Vehicle Classification Estimates. Special Locality Report 129
 Daily Traffic Volume Estimates Including Vehicle Classification Estimates where available Special Locality Report 129 Prepared By In Cooperation With U.S. Department of Transportation Federal Highway Administration
Troost Corridor Transit Study
 Troost Corridor Transit Study May 23, 2007 Kansas City Area Transportation Authority Agenda Welcome Troost Corridor Planning Study Public participation What is MAX? Survey of Troost Riders Proposed Transit
2015 Community Report White Rock
 5 White Rock Produced for the New Mexico Department of Transportation, Traffic Safety Division, Traffic Records Bureau, Under Contract 58 by the University of New Mexico, Geospatial and Population Studies,
Public attitudes to road safety
 Public attitudes to road safety Highlights of the survey Prepared by the Research & Statistics section of the Land Transport Safety Authority. 3 4 Fieldwork conducted for the LTSA by National Research
2014 Community Report Luna County
 4 Luna County Produced for the New Mexico Department of Transportation, Traffic Safety Division, Traffic Records Bureau, Under Contract 58 by the University of New Mexico, Geospatial and Population Studies,
2016 Community Report Los Alamos County
 6 Los Alamos County Produced for the New Mexico Department of Transportation, Traffic Safety Division, Traffic Records Bureau, Under Contract 58 by the University of New Mexico, Geospatial and Population
2016 Community Report Portales
 6 Portales Produced for the New Mexico Department of Transportation, Traffic Safety Division, Traffic Records Bureau, Under Contract 58 by the University of New Mexico, Geospatial and Population Studies,
GODURHAM PROGRESS REPORT
 GODURHAM PROGRESS REPORT OVERVIEW OPERATIONS & PERFORMANCE With the service enhancements, total revenue hours increased In 2016, GoDurham connected 5.9 million passengers to jobs, education and health
Passenger seat belt use in Durham Region
 Facts on Passenger seat belt use in Durham Region June 2017 Highlights In 2013/2014, 85 per cent of Durham Region residents 12 and older always wore their seat belt when riding as a passenger in a car,
2015 Community Report Grants
 5 Grants Produced for the New Mexico Department of Transportation, Traffic Safety Division, Traffic Records Bureau, Under Contract 58 by the University of New Mexico, Geospatial and Population Studies,
2016 Community Report Torrance County
 6 Torrance County Produced for the New Mexico Department of Transportation, Traffic Safety Division, Traffic Records Bureau, Under Contract 58 by the University of New Mexico, Geospatial and Population
2015 Community Report Torrance County
 5 Torrance County Produced for the New Mexico Department of Transportation, Traffic Safety Division, Traffic Records Bureau, Under Contract 58 by the University of New Mexico, Geospatial and Population
EXPERIENCE IN A COMPANY-WIDE LONG DISTANCE CARPOOL PROGRAM IN SOUTH KOREA
 EXPERIENCE IN A COMPANY-WIDE LONG DISTANCE CARPOOL PROGRAM IN SOUTH KOREA JB s Social Club Presented at TRB 94th Annual Meeting on Jan 12, 2015 Louis Berger Kyeongsu Kim Land & Housing Institute (LHI)
Spatial and Temporal Analysis of Real-World Empirical Fuel Use and Emissions
 Spatial and Temporal Analysis of Real-World Empirical Fuel Use and Emissions Extended Abstract 27-A-285-AWMA H. Christopher Frey, Kaishan Zhang Department of Civil, Construction and Environmental Engineering,
2014 Community Report Las Vegas
 4 Las Vegas Produced for the New Mexico Department of Transportation, Traffic Safety Division, Traffic Records Bureau, Under Contract 58 by the University of New Mexico, Geospatial and Population Studies,
2014 Community Report Truth or Consequences
 4 Truth or Consequences Produced for the New Mexico Department of Transportation, Traffic Safety Division, Traffic Records Bureau, Under Contract 58 by the University of New Mexico, Geospatial and Population
8. TRIP DISTRIBUTION. 8.1 Trip Distribution by Trip Purpose. Figures 8.1 show desire lines by trip purpose. < To Work >
 8. TRIP DISTRIBUTION 8.1 Trip Distribution by Trip Purpose Figures 8.1 show desire lines by trip purpose. < To Work > Quezon (II) and Makati form large centers for to Work trips. Manila also attracts a
2014 Community Report Tularosa
 4 Tularosa Produced for the New Mexico Department of Transportation, Traffic Safety Division, Traffic Records Bureau, Under Contract 8 by the University of New Mexico, Geospatial and Population Studies,
2015 Community Report Las Vegas
 5 Las Vegas Produced for the New Mexico Department of Transportation, Traffic Safety Division, Traffic Records Bureau, Under Contract 58 by the University of New Mexico, Geospatial and Population Studies,
Traffic Engineers' Report for Fiscal Year 2017
 Mid-Bay Bridge Authority Traffic Engineers' Report for Fiscal Year 2017 Mid-Bay Bridge Authority Contents Executive Summary... 1 1. Introduction... 2 2. Mid-Bay Bridge Authority System... 3 3. Mid-Bay
Welcome! Think carpool, then think bigger! Questions? Contact our Vanpool team!
 Welcome! Smart commuters like you are seizing the opportunity to turn costly and often frustrating daily commutes into a better experience. Vanpool helps you save money on gas and maintenance, reduces
Percentage of Children and Youth Ages 0 to 24 years old Using Seat Belts or Restraints, Selected Years,
 2 Percent Figure 1 100 80 Percentage of Children and Youth Ages 0 to 24 years old Using Seat Belts or Restraints, Selected Years, 1994-2013 82 88 82 78 89 91 81 80 89 83 60 40 20 53 50 69 16 to 24 years
2015 Community Report Tularosa
 5 Tularosa Produced for the New Mexico Department of Transportation, Traffic Safety Division, Traffic Records Bureau, Under Contract 58 by the University of New Mexico, Geospatial and Population Studies,
2016 Community Report Santa Fe County
 26 Santa Fe County Produced for the New Mexico Department of Transportation, Traffic Safety Division, Traffic Records Bureau, Under Contract 58 by the University of New Mexico, Geospatial and Population
2014 Community Report Aztec
 Aztec Produced for the New Mexico Department of Transportation, Traffic Safety Division, Traffic Records Bureau, Under Contract 58 by the University of New Mexico, Geospatial and Population Studies, Traffic
2015 Community Report Chaparral
 5 Chaparral Produced for the New Mexico Department of Transportation, Traffic Safety Division, Traffic Records Bureau, Under Contract 58 by the University of New Mexico, Geospatial and Population Studies,
2016 Community Report Aztec
 Aztec Produced for the New Mexico Department of Transportation, Traffic Safety Division, Traffic Records Bureau, Under Contract 58 by the University of New Mexico, Geospatial and Population Studies, Traffic
2015 Community Report Aztec
 25 Aztec Produced for the New Mexico Department of Transportation, Traffic Safety Division, Traffic Records Bureau, Under Contract 58 by the University of New Mexico, Geospatial and Population Studies,
CTR Employer Survey Report
 CTR Employer Survey Report Employer Id : E12740 WA State Dept. of Agriculture Employer : Worksite : Cleveland Lab Street : 3939 Cleveland Ave Se Jurisdiction : City of Olympia Thank you for completing
2016 Community Report San Juan County
 26 San Juan County Produced for the New Mexico Department of Transportation, Traffic Safety Division, Traffic Records Bureau, Under Contract 58 by the University of New Mexico, Geospatial and Population
2015 Community Report San Juan County
 25 San Juan County Produced for the New Mexico Department of Transportation, Traffic Safety Division, Traffic Records Bureau, Under Contract 58 by the University of New Mexico, Geospatial and Population
2018 AER Social Research Report
 2018 AER Social Research Report Executive Summary June 2018 2018 AER Social Research Report Executive Summary June 2018 Published by Alberta Energy Regulator Suite 1000, 250 5 Street SW Calgary, Alberta
2015 Community Report Doña Ana County
 25 Doña Ana County Produced for the New Mexico Department of Transportation, Traffic Safety Division, Traffic Records Bureau, Under Contract 58 by the University of New Mexico, Geospatial and Population