A Conceptual Look At Tolling Highways in Connecticut
|
|
|
- Russell Wilson
- 6 years ago
- Views:
Transcription


1 White Paper A Conceptual Look At Tolling Highways in Connecticut April 2015 Report Submitted to: Connecticut Department of Transportation
2 Table of Contents EXECUTIVE SUMMARY... 1 Federal Restrictions...2 All-Electronic Tolling...2 Hypothetical Tolling Options Considered...2 Summary...5 INTRODUCTION AND BACKGROUND... 6 Tolling as a Sustainable Sources of Transportation Revenue...7 Pros Positive Considerations...7 Cons The Challenges of Tolling...8 Federal Limitations and Outlook...8 Potential Connecticut Tolling Scenarios...9 Hypothetical Statewide Tolling Scenarios...9 Project-Specific Tolling Scenarios Statewide Tolling Options All Electronic Tolling (AET) Introduction of Tolling: Process and Timelines Potential Timelines Conceptual Estimate of Revenue Potential Toll Rate Considerations Scenario A Revenue Potential Scenario B Revenue Potential Scenario C Revenue Potential Year Annual Net Revenue Potential Statewide Tolling Scenarios In-State versus Out-of-State Revenue Revenue and Cost Summaries In-State versus Out-of-State Revenues Comparative Summary Statewide Tolling Options Project-Specific Tolling Scenarios Scenario D Managed Lanes Scenario E Spot Pricing Scenario F Corridor Pricing Longer Term: Moving Off the Gas Tax Summary i
3 Table of Contents A Conceptual Look at Tolling Highways in Connecticut Tables Table 1 Approximate Deployment Costs of Statewide AET Systems Table 2 Estimated 2013 Level Annual Transactions and Revenue Scenario A Table 3 Estimated 2013 Level Annual Transactions and Revenue Scenario B Table 4 Estimated 2013 Annual Transactions and Revenue Scenario C Border Tolling.. 21 Table 5 Estimated Net Annual Revenue Table 6 Estimated Annual Net Revenue Scenario C Border Tolling Table 7 Comparative Summary of Statewide Tolling Options Table 8 Estimated Net Annual Revenue Scenario D-2 I-95 Express Lanes (New York- New Haven) Table 9 Estimated Annual Net Revenue Scenario E Spot Tolling on I Table 10 Estimated Annual Net Revenue Hypothetical Project Tolling Scenario F Toll All Lanes I-95 New Haven to New York Figures Follows Page Figure 1 Potential Statewide Network Tolling Options Figure 2 Typical All Electronic Tolling Gantries Figure 3 Potential Tolling Deployment Timelines Figure 4 Connecticut Turnpike Toll Rates Perspective Figure 5 Revenue and Cost Summary-Scenario A: Tolling of Interstate Routes Figure 6 Revenue and Cost Summary-Scenario B: Tolling of Interstate Routes Plus Other State Limited Access Routes Figure 7 Revenue and Cost Summary-Scenario C: Border Tolls on Limited Access Routes at State Lines Figure 8 Revenue and Cost Summary-Scenario E: Spot Tolling (I-84 Example) Figure 9 Revenue and Cost Summary-Scenario F: I-95 Corridor Tolls ii
4 White Paper A Conceptual Look at Tolling Highways in Connecticut EXECUTIVE SUMMARY Like most states, Connecticut faces a considerable need for funding to support the major transportation investments required over the coming decades. There are a lot of challenges, but perhaps the biggest question is the sustainability of the gas tax as the primary source of transportation funding. In the last six years, average fuel efficiency has increased more than 25 percent; new national Corporate Average Fuel Economy (CAFE) standards call for 35 MPG by 2018 and 54 MPG by This is great for reducing carbon emissions and reducing dependency on foreign oil; but it s terrible for transportation finance if we continue to rely so heavily on the gas tax. User fees, such as electronic tolling of highways, offer a possible sustainable long term solution. This white paper has been prepared to take a very conceptual look at how tolling 21 st century style might be re-introduced in Connecticut. It covers a wide range of options and is intended to provide background information for policymakers as they consider tolling among options for transportation funding. This has been developed using sketch level analysis; as such all values herein are subject to considerable refinement if more detailed studies are determined to be warranted. Tolling in 2015 is much different and improved since the 1980 s when Connecticut removed tolls. The differences are significant, and advantages and disadvantages of re-introducing tolls as electronic tolling are highlighted in the table below. All-Electronic Tolling (AET) as a New Revenue Source PROS Significant thru traffic by non-ct passenger vehicles that don t pay gas tax. Freeway tolling distributes future highway costs to all users, including out of state. All-electronic toll collection reduces cost and eliminates safety and congestion issues associated with traditional tolling. A majority of highway investment needs in CT are located on the Interstate System and other limited access expressways in the state. Direct user fees such as tolls establish a direct linkage between road use and the charges paid; potential demand management benefits. Tolls ensure a new sustainable long term source of revenue in the face of increasing fuel efficiency. CONS Potential traffic diversions to alternative routes, could affect some local streets and other signalized routes. Connecticut s prior history with tolling included problems with congestion & safety at toll booths. Electronic tolling eliminates these problems, but state must overcome the memories. Relative to gas tax, cost of collection of tolls is higher. Connecticut does not currently have legislation authorizing the use of tolling. Significant capital cost associated with deploying all-electronic tolling; especially on a statewide basis. 1
5 Federal Restrictions A majority of freeways in Connecticut are Interstate highways. In general, adding tolls to these routes is currently prohibited by federal law, except under limited conditions. Exceptions include: Under current law (Section 129 of Title 23 U.S.C., the general toll program) new highways, bridges, and tunnels (including such facilities on the Interstate System) can be constructed as tolled facilities without application or approval for inclusion in one of the pilot programs. Similarly, new tolled lanes can be added to existing highways (as long as the number of existing toll-free lanes (excluding auxiliary lanes) is not reduced), non-interstate Highways can be reconstructed, bridges and tunnels on the Interstate System and non-interstate Highways can be reconstructed or replaced, all as tolled facilities. Interstate System Reconstruction and Rehabilitation Pilot Program (ISRRPP) with federal authorization, up to three states can add tolls to Interstate routes being reconstructed. All three slots are currently provisionally filled for this pilot program; Value Pricing Pilot Program (VPPP) - 15 states participate in the FHWA VPPP at any one time, including Connecticut. These pilot states may implement Interstate tolling with federal approval, if congestion pricing is part of tolling. Conversion of high-occupancy vehicles (HOV) lanes to high-occupancy toll (HOT) lanes under Section 166 of Title 23 U.S.C., whereby non-carpools or single-occupant vehicles would be able to use HOT lanes for a variable toll rate. In the case of VPPP and ISRRPP, a Federal Tolling agreement would have to be executed before tolls could be added. While it is true that FHWA has recently funded congestion pricing studies on Connecticut Interstates under the VPPP, which might provide a mechanism to permit tolling in the future, no such tolling agreement has been executed; this would definitely be required before adding tolls to Interstate routes. Toll projects falling into Section 129 or Section 166 do not require tolling agreements with FHWA. All-Electronic Tolling (AET) With All-Electronic Tolling (AET) no toll plazas would be constructed and motorists would not have to stop (or even slow down) to pay tolls. Overhead gantries would be constructed across the roadway mainlines (or ramps); and equipped with electronic toll readers, high speed cameras and other equipment to collect tolls from vehicles at full highway speeds; this reduces collection costs. More importantly, it eliminates the congestion and safety problems associated with traditional tolling, such as that used in Connecticut 30 years ago. The vast majority of tolls would be collected via electronic toll transponders like E-Z Pass. Vehicles without transponders would be handled by video imaging of license plates through a billing system (or a pre-registered plate option). While AET does bring additional video collection and enforcement costs, its advantages over traditional tolling are significant and many toll agencies, including the Massachusetts Turnpike, are eliminating cash collection and replacing old toll booths with overhead non-stop toll gantries (see images of toll gantries on cover page). Hypothetical Tolling Options Considered The white paper took a conceptual look at six hypothetical tolling options which might be considered. Three of these involved statewide tolling options, in which tolls might be established on all Interstate highways and possibly other limited-access expressways. The other three options 2
6 were hypothetical examples of project-specific tolling. Each of the options was assessed as to their cost of deployment, revenue potential, operating cost and net revenue potential. Statewide Tolling Options. These involve tolling the state s entire Interstate System, and other limited-access expressways like Route 2 and Route 8. Toll revenues from a statewide system could provide a new long-term sustainable source of revenue, and would be dedicated to transportation improvements. The three statewide options included: A. All Interstates. Toll all Interstate routes in the state (347 miles); B. All Interstates & Other Expressways. Toll all Interstates plus other state-designated expressways and parkways (556 miles total); and C. Border Tolls. Toll all limited-access routes at state borders (entering direction only). It should be noted that FHWA has stated they do not support this specific tolling application and it is unlikely it would be approved. The table below presents a comparative summary of cost and revenue potential for the three statewide tolling options. Results are shown for both low and high hypothetical toll rates. Comparative Summary of Statewide Tolling Options Low End Toll Rates ($0.10 / Mile; $2.00 Border Tolls) High End Toll Rates ($0.20 / Mile; $4.00 Border Tolls) Scenario A Scenario B Scenario C Scenario A Scenario B Scenario C Toll All Toll All Border Tolls Toll All Toll All Border Tolls Item Interstates Expressways (Entry Only) Interstates Expressways (Entry Only) 25-Year Net Revenue Potential (Mil.) $27,709.1 $37,303.4 $4,898.1 $45,503.6 $62,013.6 $8,950.6 Avg. Annual Total Net Revenue (Mil) $1,108.4 $1,492.1 $195.9 $1,820.1 $2,480.5 $358.0 Avg. Annual Net Revenue - In State (Mil.) $786.9 $1,119.1 $90.1 $1,365.1 $1,860.4 $164.7 Avg. Annual Net Revenue - Out State (Mil.) $321.4 $373.0 $105.8 $455.0 $620.1 $193.3 Average Pass. Car Toll per Trip (1) $1.25 $1.26 $2.00 $2.49 $2.53 $4.00 Average Pass. Car Round Trip Toll (1) $2.50 $2.52 $2.00 $4.98 $5.06 $4.00 Typical % Diversion to Alternate Routes 10%-15% 10%-15% 15% 20%-30% 20%-30% 25% One-Time System Deployment Cost (Mil.) $449 $635 $44 $449 $635 $44 (1) Average toll for those trips actually tolled. Project-Specific Options. The other three options are hypothetical, but realistic, examples of project-specific tolling. Project-specific options involve adding tolls as part of specific construction projects to help pay for the project or series of projects along a highway. Projectspecific examples include: D. Managed Lanes. Managed-lane systems involve charging tolls only on 1-2 lanes, and adjoining lanes remain toll free. The primary goal of managed lanes is reducing congestion rather than raising revenues. Since only 1-2 lanes are tolled, they raise less revenue than tolling all lanes. Managed lanes include converting HOV lanes to HOT lanes (High-Occupancy Toll), and / or building new express toll lanes. Express toll lanes were studied for highly congested sections of I-95 between New Haven and the New York State line. New express lanes on I-95 would generate significant revenue, but could cost more than $10 billion to build due to the need to add lanes and separate those lanes from general traffic. The lanes are very effective at managing congestion, but toll revenues generated would support just a small portion of the cost. 3
7 HOT lane conversions were studied for the existing HOV lanes on I-91 and I-84 in the Hartford area. Conversion of HOV lanes in the Hartford area would be relatively easy and inexpensive. They would generate enough revenue to pay for tolling and operation, but little excess revenue. The main goal of these conversion projects would be to reduce congestion on I-91 north of Hartford and I-84 east of Hartford. E. Spot Tolling. Spot tolling involves adding tolls to a bridge or section of highway that is being reconstructed. Spot tolling is one of the tolling options being studied as part of the major project to replace the Hartford Viaduct section of I-84 in Hartford. An electronic toll at that location would have a low toll charge (no more than $1.00) to minimize traffic diversions to local streets. It would generate significant revenue, but given the high cost of the viaduct replacement ($3-5B), the toll revenue may only support 10% -20% of the total project cost. To be effective, the tolls would have to be extended beyond the short limits of the Viaduct segment (about one mile). F. Corridor Tolling. Corridor tolling involves tolling a much longer section of highway to help pay for a large reconstruction or expansion program in the corridor. Corridor tolling and congestion pricing is being studied for the I-95 corridor between New York and New Haven. Electronic tolls along this 48-mile corridor would cost about $92 million to design and deploy, but tolls would generate average annual net revenue between $300 million and $450 million per year after operating cost. This might pay 75% or more of the cost to widen the severely congested segment between Bridgeport and Stamford. Combined with congestion pricing, the widening could significantly reduce congestion. An overall comparative summary of illustrative sketch level statewide and project specific estimates are shown below. Comparative Summary of Statewide and Project Specific Tolling Concepts Average Annual Revenue (Millions in 2014 dollars) Tolling Project Toll Rate/Policy Gross Revenue Operating Cost (A) Part I: Statewide options that require changes to federal and state laws Net Revenue % Out of State Revenue Years to Implement Tolling System Capital Cost Highway Project Capital Cost Net Revenue 25-years All Expressways $0.10/mile $1,649 $157 $1,492 25% $37,300 $0.20/mile $2,619 $139 $2,480 25% $62,000 Interstates Only $0.10/mile $1,223 $115 $1,108 29% $27,700 Border Tolls (entering CT) (Federal approval unlikely) $0.20/mile $1,922 $102 $1,820 29% $45,500 $2 toll $211 $15 $196 54% $4,898 $4 toll $372 $14 $358 54% $8,950 Part 2: Project-level options that can be done under existing federal law or pilot program; changes to state law still required I-95 Tolling $0.10/mile $313 $31 $282 40% $4,000 $7,050 add 4th lane and toll all lanes (B) $0.20/mile $475 $26 $449 40% $4,000 $11,225 I-95 Congestion Pricing add express toll lanes (C) I-84 Tolling spot pricing on viaduct replacement I-91 & I-84 HOV to HOT lane toll rates set to manage demand $38 $14 $24 35% $10,000 $598 $1.00 $49 $5 $44 18% $4,000 $1,105 toll rates set to manage demand (A) Operating cost includes collection cost plus annualized capital cost of system deployment (B) 4th lane between Bridgeport and Stamford (C) Express Lanes between New Haven and Greenwich $2 $2 $0 10% $40 $10 4
8 Summary In summary, tolling can be a viable option for establishing a new, sustainable and equitable source of revenue for transportation investment in Connecticut. On a statewide basis, the cost to deploy an all-electronic system would range from about $450-$600 million, a cost that could be recovered in less than one year of net revenue collected from all electronic tolling. Other key findings: Annual net revenue from statewide tolling could be as much as $2.5 billion per year, after operating costs, in 2014 dollars; About percent of revenue from statewide tolling of all Interstates and expressways would come from out-of-state motorists; About percent of revenue from border tolling could come from out-of-state motorists, but federal approval is not likely for border tolls. About percent of revenue would come from trucks under statewide or border tolling; Implementation of tolling on existing Interstate routes will require federal approval. While tolling existing Interstate route capacity is currently prohibited, the current VPPP studies underway in Connecticut could provide a mechanism for the execution of a tolling agreement with FHWA to establish tolling on approved roadways. It should be noted that there is no current blanket program for statewide tolling. Each specific project or corridor would need to studied and approved before tolls could be established; Even if a tolling agreement was executed with FHWA, Connecticut does not currently have legislation authorizing the use of tolling; All-electronic tolls could be implemented, without requiring motorists to stop or impede traffic or safety in any way; The one-time capital cost to fully deploy all-electronic tolling statewide would be between $450 and $635 million depending on how many routes were included; border tolls would cost less than $100 million. While a significant cost, it could be recovered from net toll revenue collection in less than a year of operation in most cases, depending on Scenario and toll rates charged; Tolling will take at least 4 years to implement, so new revenues cannot be generated in the short-term. Statewide tolling could be fully operational between 4.5 and 6.0 years from the point at which a decision to move forward is made. Project-specific tolling has a similar timeframe; and Project-specific tolling applications could also be implemented, but revenue potential and cost would be unique to the specific individual projects and toll rates being considered. 5
9 White Paper A Conceptual Look at Tolling Highways in Connecticut INTRODUCTION AND BACKGROUND Tolls are not new in Connecticut. Tolling was used as the primary method of finance of both the Merritt / Wilbur Cross Parkways and the Connecticut Turnpike (I-95). In addition, there were once several toll bridges in the greater Hartford area. While long a significant source of revenue to the state, tolling in Connecticut also was known as a major source of delay and congestion at toll plazas and a continuing safety concern. In fact, a major fatal crash at the Stratford toll plaza on I-95 on January 19, 1983 led to the removal of all tolls in Connecticut a short time later. Many of Connecticut s Interstate highways were built without tolls in the years following the passage of the Federal-Aid Highway Act of 1956, under which up to 90 percent of construction cost was funded by the Federal gas tax. But that was more than 50 years ago; and much of the Interstate System and other expressways in Connecticut are now in need of reconstruction and expansion. The Federal government largely conceived of, and paid for, the Interstate System, but it owns none of it. It is now the responsibility of the states, who collectively now spend more on system upkeep and reconstruction every five years than the entire federal contribution to funding the original construction of the 47,000 mile system. The CTDOT Statewide Strategic Transportation Plan (TransformCT) has identified a need for over $100 billion in transportation investment, over $66 billion of which will be needed on the state s highways and bridges. A majority of that will be needed on the Interstate System and the state s other limited access expressways. At the same time, there is growing recognition that motor fuel taxes, at the state and federal levels, are unsustainable in the face of increasing fuel efficiency and dramatically increased future Corporate Average Fuel Economy (CAFE) standards. In view of this, new consideration is being given to the possibility of once again using tolls, either on a project specific basis to help pay for specific capital investments, or potentially on a statewide basis as a significant new, sustainable source of revenue for transportation. Questions have been raised about the cost of adding tolls, the time required for implementation, and the magnitude of toll revenue that could be generated. CDM Smith has prepared this White Paper to answer some of these questions, and to enable policymakers to make more informed decisions on this important and controversial issue. Information included herein is based on experience with recent tolling initiatives in jurisdictions across the nation, discussions with toll operators and system integrators, discussions with state and federal staff about opportunities and issues. It also reflects a sketch level assessment of revenue potential of tolling the state of Connecticut s highways. It should be recognized that all information included in this White Paper is subject to considerable refinement through more detailed studies should the state choose to reinstitute tolling. 6
10 Tolling as a Sustainable Source of Transportation Revenue Like most states, Connecticut faces a considerable need in funding to support the major transportation investments required over the coming decades. There are a number of factors for this, but perhaps the biggest concern is a question about the long-term sustainability of the motor fuel taxes as the primary source of revenue. In the last six years alone, average fuel efficiency of the US passenger car fleet has increased by more than 25 percent. Recently updated national fuel efficiency standards call for 35 MPG by 2018 and 54 MPG by Improving fuel efficiency is great for reducing our dependence on foreign oil supplies and reducing carbon emissions that contribute to climate change and negatively affect the health of citizens. However, it is not good for transportation funding-- so long as the primary basis for revenue generation remains the taxation of fuel actually consumed. Simply stated, as fuel efficiency increases, revenue from the gas tax decreases, even as vehicle miles of travel and demands for roadway investment continue to grow. User fees such as tolling have the advantage of being more sustainable over the long term, regardless of improvements in fuel efficiency or even the type of energy used (e.g., electric vehicles, hybrids, etc.). There are a number of reasons why having tolling return to Connecticut makes sense as a new source of revenue; but the concept is not without potential negative impacts, both real and perceived. A quick summary of pros and cons might include: Pros Positive Considerations 1. Being a small state, located between major urban areas of New York and Boston, there is a high percentage of through travelers using Connecticut s highways; particularly Interstate highways, with as much as 29 percent out-of-state travel. Many of these passenger vehicle motorists do not need to purchase fuel while passing through the state; hence they are not contributing to the state s motor fuel tax revenue. Tolling would ensure all motorists using the Interstate facilities would pay their fair share of the funding needed for ongoing investments in these major roadways. Our conceptual analysis of statewide tolling shows that 25-54% of toll revenue would come from out-of-state drivers, depending on tolling scenario. 2. The advent of non-stop, cashless all electronic tolling (AET) has dramatically reduced the cost of toll collection and the safety and congestion impacts associated with traditional methods of collection -- such as that used in Connecticut for nearly 30 years through the mid- 1980s. With AET, there is no toll plaza to interrupt the flow of traffic, and tolls are collected electronically as drivers pass beneath overhead collection points at full expressway speeds. 3. A majority of highway investment needs in the CTDOT Statewide Strategic Transportation Plan will be on the Interstate highways and other state highways. In his recent budget address to the Connecticut legislature, Governor Malloy cited ten examples of major highway improvements needed in the state; all ten are located on the state s Interstate highways or other limited access expressways. This improves the equity of revenue collection; namely those benefitting from the improvements will be paying a larger share of the cost. 4. The use of any type of direct user fees improves the linkage between transportation funding and the use of transportation capacity especially during periods of high demand. Tolling has 7
11 the potential to more effectively manage demand (such as variable or dynamic pricing that increases toll costs during hours of peak traffic) and as traffic rises, revenue will also increase. 5. Direct road user charges, such as electronic tolling, ensures a sustainable long term source of revenue. As traffic demand grows, revenue will grow. This is increasingly not the case with the gas tax, as increasing fuel efficiency and the emergence of electric and alternative fuel vehicles will cause fuel consumption to decrease as vehicle miles of travel increases. Cons The Challenges of Tolling 1. In planning any potential tolling, perhaps the biggest concern is the potential for traffic diversions off the tolled route to alternative routes. The sketch level assessment in developing this White Paper suggests traffic diversions in the range of percent might be expected, depending on particular route, tolling application and, of course, toll rate level. Traffic diversions to alternative routes can have negative impacts on those routes, especially in the case of diversions of larger commercial vehicles. 2. Connecticut has a long history of tolling, with considerable negative perceptions relating to congestion at toll plazas and significant perceived safety issues. Virtually all of these issues are no longer relevant if the state embraces all electronic toll collection. Overcoming the perceptions of the past will still be a challenge. 3. Connecticut does not currently have legislation authorizing the use of tolling. 4. Relative to the gas tax, which is collected at a limited number of fuel distribution centers, the cost of collecting tolls will likely be significantly higher. 5. There would be significant capital and ongoing operating costs for deployment and use of an all-electronic toll collection system, particularly on a statewide basis. The capital cost could likely be recovered in less than one year but nonetheless it will be a significant factor. Federal Limitations and Outlook Under current law, there remain federal restrictions on the use of tolls of currently toll-free interstate highways. Over the last two decades, these restrictions have been significantly reduced; a trend that is likely to continue in the future given building pressure from many states that are in search of new and sustainable revenue sources. At the moment, there are a limited number of conditions under which tolls could legally be added to currently free Interstate highways: 1. Bridge or Tunnel Reconstruction and New Capacity Under current law (Section 129, the general toll program) new highways, bridges, and tunnels (including such facilities on the Interstate System) can be constructed as tolled facilities without application or approval for inclusion in one of the pilot programs. Similarly, new tolled lanes can be added to existing highways (as long as the number of existing toll-free lanes (excluding auxiliary lanes) is not reduced), non-interstate Highways can be reconstructed, bridges and tunnels on the Interstate System and non-interstate Highways can be reconstructed or replaced, all as tolled facilities. Additionally, capital improvements can be made to existing tolled facilities with federal funds. Each of these actions can occur as a matter of right, without inclusion in a pilot program. 8
12 2. Interstate System Reconstruction and Rehabilitation Pilot Program (ISRRPP) For many years, this pilot program has been available under which up to three states may add tolls to all lanes of an existing Interstate highway that is being reconstructed or expanded. The revenue collected from this tolling must be devoted to the particular Interstate route being upgraded. While all three slots are provisionally filled for this pilot program, no state has yet to implement tolling on the Interstate System under this Pilot Program. It should be noted that funds provided by FHWA s Interstate Maintenance (IM) program for resurfacing, restoring, rehabilitating and reconstructing (4R) most routes on the Interstate System are lost on a facility once tolls are applied under this Pilot Program. This issue is limited only to the ISRRPP, and would not apply to other potential exemptions. There are currently no slots available under this program. 3. Value Pricing Pilot Program (VPPP) Up to 15 states participate in funding, research, and implementation of pricing projects at any one time under the FHWA Value Pricing Pilot Program (formerly known as the Congestion Pricing Program). Connecticut is one of these, with major value pricing studies now underway on I-95 and I-84. FHWA has advised that once a state has been designated under the VPPP, it may be eligible for FHWA tolling agreements on the facilities being studied, or potentially any other facilities in that particular state. It should be noted that this programs main goal is aimed at congestion management, requiring that variable tolls be used in order to manage demand on the facility. This could become a mechanism under which Connecticut could apply for a tolling agreement, perhaps as extensive as statewide. However, it should be cautioned that while it is not inconceivable that a state could develop a value pricing project covering multiple facilities statewide, note that all of the VPPP tolling agreements to date have covered individual facilities (or closely-related pairs of facilities in the same general corridor). 4. Conversion of HOV lanes to HOT Lanes - It is also currently permissible to convert highoccupancy vehicles (HOV) lanes to high-occupancy toll (HOT) lanes under Section166, whereby non-carpools or single-occupant vehicles would be able to use HOT lanes for a variable toll rate. There are more than 25 of these types of unique facilities operating in the US now; the conversion of HOV lanes on both I-91 and I-84 in the Hartford area could be candidates for this type of deployment. Under either the VPPP (which current Connecticut studies are being performed under) or the ISRRPP the state would need to execute a formal tolling agreement with FHWA. No such agreement yet exists. Projects falling under Section 129 or Section 166 do not require an executed formal tolling agreement with FHWA. Potential Connecticut Tolling Scenarios There are a number of different potential scenarios under which tolling could be reinstituted in the state of Connecticut. This White Paper addresses a range of six hypothetical applications, arrayed in two major categories; hypothetical statewide tolling options and hypothetical project-specific tolling applications. Hypothetical Statewide Tolling Scenarios Under this category, tolling would be implemented on all or some of Connecticut s limited-access highway facilities as a means of developing a new, sustainable long-term source for additional transportation funding. Under these options, the implementation of tolling would not be associated 9
13 with a particular construction project or new highway facility. Rather, the tolling would be intended to supplement other current sources of transportation finance, in an effort to pay for up to $100 billion in transportation needs over the next quarter century. It should be noted that none of the current tolling programs presently support a blanket allowance to toll statewide. Under statewide tolling, each proposed tolling project would need to be studied and approved, and in reality would probably be implemented in a phased approach. Conceptual revenue potential and other general information is provided in this White Paper for three alternative hypothetical statewide tolling options, including: Statewide Scenario A Electronic tolling on all interstate highways in Connecticut; Statewide Scenario B Electronic tolling added to all Interstate highways plus major limitedaccess state routes; and Statewide Scenario C Entry tolls on major limited-access facilities at state line borders. (It should be noted that FHWA has stated they do not support this specific tolling application and it is unlikely it would be approved by FHWA) Project-Specific Tolling Scenarios Hypothetical project-specific tolling scenarios would be related directly to individual particular projects, especially those about to undergo reconstruction activities. Tolling would be implemented, in most cases, as a means of generating revenue, possibly in support of additional bonding capacity, to at least partially cover the cost of specific major capital investments. This White Paper addresses three hypothetical, but realistic, project-specific tolling scenarios, including: Scenario D Managed lanes, in which only one or two lanes on a highway facility would be subjected to variable tolling. Two significant sub-options could be considered under this category: - Scenario D-1: HOV-to-HOT Conversions In which existing high-occupancy vehicle lanes are fitted with electronic tolling, and non-hov traffic is allowed to use the lanes as managed through variable tolling; - Scenario D-2: New Express Toll Lanes - Involving new capacity on existing freeways, in which only vehicles using the new capacity are assessed a toll. Scenario E Spot tolling applications, in which electronic tolls could be added to a replacement bridge or other major local construction project, such as the proposed costly replacement of a major viaduct on I-84 in Hartford; and Scenario F Project-Specific Corridor Tolling In which all lanes on a portion of a limitedaccess highway would be tolled with revenue generated intended to be used to at least partially offset major capital investments for improvements. All six of these scenarios are addressed, in very general and conceptual terms, in this document. It is emphasized that estimates of revenue potential and cost should be considered general approximations made without the benefit of detailed analysis. This information should be considered subject to considerable refinement in more detailed studies. 10
14 Statewide Tolling Options Tolling could be introduced on a statewide basis. Figure 1 shows the 556 miles of major limitedaccess facilities located in the Connecticut. Almost 350 miles of these routes have Interstate highway designations, as highlighted in green. There are also 206 miles of other limited access highways in the state; highlighted in orange. Figure 1 also shows the seven points of entry into the state on limitedaccess highway facilities for border tolling consideration. Under any of these scenarios all electronic toll collection would be used. As described below, this is a method under which motorists do not have to stop and pay tolls, and all revenue is collected electronically, mostly through pre-paid electronic transponder toll accounts. Most of these pre-paid accounts are linked to credit cards or bank debit facilities and the vast majority of the collection process is fully automated. When considering the three alternative methods of implementing statewide tolling, it is important to recognize significant tradeoffs between the breadth of application versus the potential economic and traffic impacts associated with tolling. Tolling which is implemented over an entire system, with tolls applied nominally on a per-mile basis require relatively low toll charges applied to a larger number of trips. For example, at $0.10 per mile, a trip on I-95 from Greenwich to Bridgeport would cost about $3.00 for passenger cars with electronic toll collection transponders. This would be applied, however, at numerous individual tolling points, such that the toll charge at any given point would be relatively low (say $0.50). This would create relatively little incentive for motorists to divert off the Interstate and onto local roads or competing freeways (such as the Merritt Parkway). By contrast, implementing equivalent tolls at isolated locations, such as borders, would require a fixed rate at a single location generally in the amount of $2.00-$5.00 in one direction only. This single tolling point with a higher concentrated toll will encourage increased diversions of traffic to local routes, since the amount to be saved at a single tolling point is as much as 10 times higher than that assessed at a large number of lower value tolling points along the full route. In general, the fewer number of tolling points, the higher the toll rates needed at these points to achieve comparable revenue, and hence the higher the proportion of traffic diversions which can be expected. Similarly, potential economic impacts may be quite significant with isolated tolling applications, at least in the immediate vicinity of the isolated tolling point. An isolated toll of, say, $4.00 (or perhaps $8.00 for a round trip) may significantly impact businesses on either side of the concentrated tolling point. By comparison, more broadly applied tolling along entire route systems would be expected to have less significant economic impacts, because the average toll per trip over the length of the corridor would be much less. All Electronic Tolling (AET) With all electronic tolling, gantries would be constructed across the expressway mainline lanes (or in some cases on expressway ramps). The gantries would be equipped with electronic toll readers, video enforcement cameras and other equipment necessary to electronically collect tolls from all vehicle types at full highway speeds. Examples of currently operating AET gantry facilities are shown in Figure 2. In most cases, each electronic tolling point would include two sets of gantries, essentially equivalent to sign bridges, upon which equipment needed for vehicle classification, license plate imaging and electronic toll 11
15 CTDOT Statewide Strategic Transportation Plan W:\Northern Region\Projects\CT Strategic Transp Plan - CTDOT\GRAPHICS\ArcMap\Possible Connecticut Tolls.mxd 3/04/15 Torrington Plainfield Meriden Hartford Waterbury 15 New London 91 New Haven Danbury N Bridgeport LEGEND Stamford Interstate Routes Primary State Freeways Border Toll Locations POTENTIAL STATEWIDE NETWORK TOLLING OPTIONS FIGURE 1

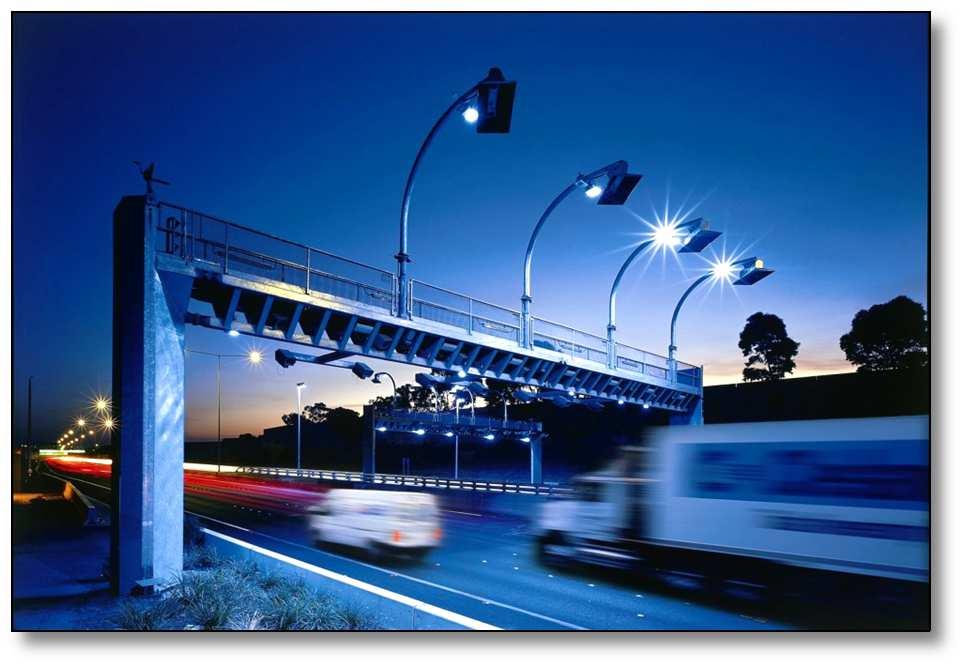


16 W:\Northern Region\Projects\CT 97692\Graphics\Powerpoint\Portrait.pptx\ CTDOT Statewide Strategic Transportation Plan Triangle Expressway - Raleigh, NC Melbourne City Link - Australia Sam Rayburn Tollway - Dallas, TX Highway Toronto (World s First AET Facility) TYPICAL ALL ELECTRONIC TOLLING GANTRIES FIGURE 2
17 reading is strategically mounted. This collection process has no impact on drivers whatsoever, as they simply pass under each gantry point at normal highway speeds for the collection of tolls. Under an all-electronic toll system, the vast majority of tolls would be collected from vehicles equipped with pre-paid transponder accounts, such as E-ZPass. Motorists would open pre-paid accounts and start with an initial balance. Each time the vehicle used the road, the appropriate toll amount would be reduced from the account. Most accounts would be established with automatic replenishment provisions through linkages with bank accounts or credit cards. In essence, once the account was established, there would virtually be no action required on the part of drivers (other than pay the bill). Perhaps percent of vehicles would eventually have an E-ZPass. However, there would always be a limited number of vehicles not equipped with transponders. They would still be eligible to use the roads, and tolls would be collected using video imaging techniques. Modern AET systems include both front and rear license plate reading equipment, to capture both cars and trucks. There are multiple operational concepts possible, but most current AET systems identify the vehicle owner through DMV records and simply bill the customer for usage of the road. Because of the higher cost associated with video collection, including paper billing, and the increased level of collection risk, motorists without E-ZPass transponders would typically be charged a higher toll rate, but no punitive charges would be levied. Toll gantries would typically be located every 4 to 5 miles along the priced highways, depending on interchange spacing and frequency. Because of the large number of interchanges on Connecticut s Interstate highways, particularly along I-95, it would not be practical to put a gantry between each individual access point. However, gantries would be frequent enough to capture the majority of highway users--such that the toll charge associated with each individual collection point would remain relatively low to minimize traffic diversions. Each of the gantries would be connected to a central system covering the whole state. It is likely that the system would be designed with a trip reconstruction feature; that is a toll would be charged for each particular trip on the Interstate System, but not for each individual passage beneath a particular gantry. For example, if a trip on I-95 from Stamford to Bridgeport passed through, five tolling points, computer logic would be used to reconstruct this into a single trip and the account would be charged only once for the trip from Stamford to Bridgeport. Table 1 presents a concise summary of the approximate ballpark deployment cost of a statewide AET system under both Scenarios A and B. The top line shows the cost for implementation on all Interstate highways, Scenario A. Approximately 78 gantries would be required; the approximate construction costs would be $416 million in 2014 dollars. Adding an additional 8 percent for required studies, system design, environmental review and program management, the total cost of deployment on 347 miles of Interstate highway is estimated at just under $450 million. Extending the tolling system to the primary state highways (Scenario B) would cost an additional $186 million, bringing the total cost under Scenario B to $635 million. This assumes a total of 121 gantries and 10 customer service centers statewide. The implementation of border tolls under Scenario C would require a considerably smaller number of electronic tolling points. As shown in Table 1, only seven tolling gantries would be required, with a total system cost (including engineering and environmental studies) of approximately $44 million. While this study considered border tolls in one-direction only, two-way border tolls could still be 12
18 implemented for less than $100 million. In general, the larger the number of gantries required, the lower the system cost per gantry. This is because there are certain common elements, such as a complex central system in customer service centers for electronic toll transaction processing, which are common to any of the scenarios considered. Table 1 Approximate Deployment Costs of Statewide AET Systems (Costs in 2014 dollars in millions). System Eng / Env Total Scenario Description Miles Gantries Cost (M) Cost (M) Cost (M) A Interstate Routes $416 $33 $449 B All Limited Access Routes $588 $47 $635 C Border Tolls (1) N/A 7 $40 $4 $44 (1) One-way tolls entering Connecticut. Introduction of Tolling: Process and Timelines The potential re-introduction of tolling in Connecticut would require considerable planning, policy and engineering efforts, particularly if implemented statewide. We have identified at least seven major steps in the process. 1. Legislative Approval The decision to add tolling to Connecticut s highways, whether on Interstate highways or state designated highways, will require approval of the Connecticut legislature. This process will take some amount of time and likely require public hearings, detailed studies regarding the cost, revenue and various impacts associated with tolling before passage of a tolling bill. The process could also include the establishment of a statewide lock box, in which net revenue from toll collections could be dedicated and used for transportation improvements. 2. Feasibility and Planning Studies More detailed study will be required before final tolling implementation. This would include development of a concept of operations for the entire system, a refined traffic and revenue impact analysis, possible project phasing and development of more refined system capital and operating cost estimates. 3. Environmental Assessments In discussions with representatives of other states implementing tolls on existing free facilities and representatives of FHWA, as a minimum, Connecticut should assume a state and federal Environmental Assessment (EA) would be required for the deployment of tolls. This would include quantification of traffic impacts, in particular, and the net effect of these traffic impacts on alternative routes. FHWA has also advised that a decision to add tolling would require the establishment of a tolling agreement if tolls were instituted under either the VPPP or ISRRPP; this tolling agreement would only be executed after the appropriate environmental clearances are obtained. In the state of Washington, which recently implemented tolls on two previously toll-free bridges (Tacoma Narrows & SR 520), the state legislature expanded this requirement to a full Environmental 13
19 Impact Statement (EIS), but this is not considered typical. Further, FHWA has advised that if the application of tolling is associated directly with an improvement program, such as facility widening, the environmental clearances for the full construction project needs to be achieved before tolls could actually be implemented. Tolls could be implemented prior to completion of construction, but not before environmental clearance of the project. 4. Federal Tolling Agreement FHWA advises that applications of tolling under the VPPP or ISRRPP would require execution of a federal tolling agreement. Placing tolls on new capacity, such as new express toll lanes or new Interstate corridors would not require a tolling agreement, nor would the conversion of HOV to HOT operation. The process will take some time, and will have certain precedent requirements, such as environmental and state legislative approval. 5. Institutional Organization The implementation of tolling would require the development of a new institutional organization to implement and monitor tolling operations and ensure appropriate flow of funds once tolling begins. There are a number of potential institutional configurations. Many existing toll facilities are operated by semi-autonomous authorities. 6. Toll System Design/Procurement Once the final decision is made to implement tolling, and environmental clearances and tolling agreements are in hand, a detailed design effort of the statewide tolling system would be undertaken. This would be followed by a competitive procurement process and an extended period of development and implementation oversight. Since the toll system involves the acquisition of electronics, technologies, and communications subsystems (to name just a few), federal-aid projects involving this step would also require a systems engineering analysis and conformance with Connecticut's statewide ITS architecture per 23 CFR 940 prior to the final design for the procurement of the tolling system. 7. Toll System Development/Installation - This would likely be undertaken by a competitively selected contractor/system integrator. It would also likely include, in a single contract, the extensive construction work associated with toll gantries and communication systems as well as procurement and erection of the high technology electronic toll collection equipment itself. This contract typically would include the ongoing maintenance of the toll system. Potential Timelines One of the key objectives of this White Paper is to identify realistic (albeit still preliminary) estimates of the timeline to cover these various steps of the process. Figure 3 shows four such timelines, including: A simple HOV to HOT conversion (essentially Scenario D-1); A project specific tolling application, essentially representing Scenarios D-2, E and F (actual timeline would vary based on the design/construction timeframe of the project itself); and Two schedules for hypothetical implementation of statewide tolling Scenarios A, B or C (fast track vs. conservative schedule. The top portion of Figure 3 addresses a simple HOV to HOT conversion. This is much less complex, and requires less federal and environmental approval, and could be implemented in less than two years. In practice this might even be able to be accomplished in as little as 18 months, given the favorable physical characteristics of the HOV lanes in Connecticut. 14
20 W:\Northern Region\Projects\CT 97692\Graphics\Powerpoint\Schedule.pptx\ CTDOT Statewide Strategic Transportation Plan Major Activity Legislative Process / Approval (if needed) Project Planning / Design / Concept of Ops. Environmental Review (if any) FHWA / FTA Approval Toll System Design / Procurement Construction, Striping, Installation Begin Operations Legislative Process / Approval Conceptual Design Environmental Process (EIS) * Project Design / Construction Federal Tolling Agreement Est. Institutional Organization Project Finance (Includes T&R) Toll System Design / Procurement Toll System Dev. Installation & Testing Pre-Construction Start Post-Construction Start Months From Start of Process HOV to HOT Lane Conversion (Scenario D-1) Project Specific Tolling / Finance Model (Scenarios D-2, E, F) Federal Tolling Agreement Statewide Tolling Fast Track Approach (Scenarios A, B, C) Design and construction timeline varies with size of project. This example assumes 56 months total. Start tolling prior to highway reconstruction project Start tolling after highway reconstruction project Legislative Process / Approval Detailed Tolling Feasibility Studies Environmental Process (EA) Federal Tolling Agreement Est. Institutional Organization Toll System Design / Procurement Toll System Dev. Installation & Testing Earliest Start Operation (1) Legislative Process / Approval Detailed Tolling Feasibility Studies Environmental Process (EIS) Federal Tolling Agreement Est. Institutional Organization Toll System Design / Procurement Toll System Dev. Installation & Testing Earliest Start Operation (1) Federal Tolling Agreement Statewide Tolling Conservative Schedule (Scenarios A, B, C) Federal Tolling Agreement * Includes Environmental studies for both project and tolling implementation. (1) Statewide tolling could begin in phases; date indicates earliest start of first phase. POTENTIAL TOLLING DEPLOYMENT TIMELINES FIGURE 3

21 The next portion of the schedule shows the likely timeline for project specific tolling and finance. This would be used in an example of a project such as widening portions of I-95 between New York and New Haven or major improvement projects along I-84. In this scenario, the ultimate completion timeline is dependent on the physical improvement project itself. This also recognizes that the entire construction project requires a full EIS and full environmental clearance before the tolling agreement can be finalized. We have also added to this timeline the time required for investment-grade traffic and revenue studies and the actual project financing process, presuming that some form of revenue bonds would be required. Tolls could be added either before the highway reconstruction project or after it was completed, as shown by the two different stars in the lower portion of Figure 3. In any case, it would still only be added after the tolling agreement was executed which would only be executed after environmental clearance for the new project in question was received from state and federal agencies. The next two sections cover hypothetical statewide tolling programs. The third timeline is referred to as the fast-track option, which assumes a relatively aggressive schedule, legislative approval within about 18 months and only an Environmental Assessment. In this case, statewide tolling on all Interstates and/or other state designated highways could be implemented and placed in operation within about 4.5 years from the time the decision is made to move forward with further study. This includes a year for detailed tolling feasibility studies and refined cost estimates, an 18-month process for environmental review, one year for FHWA application process through the establishment of a final federal tolling agreement (the actual timeline would depend on how well-developed the ISRRPP or VPPP tolling proposal was when submitted to FHWA for tolling authority approval), one year for establishment of institutional organization and about 15 months for final system design and procurement. Under the fast track approach, the toll system development and installation is assumed to take place in slightly less than two years. This is an aggressive timeline, particularly for system development and deployment, but it is consistent with some other AET initiatives such as the Massachusetts Turnpike AET conversion of I-90 which is now underway. A more conservative schedule is shown in the bottom graph, which extends the legislative review process, the environmental review process and the system development and deployment time. Even under this conservative schedule, statewide tolling could be in operation within about 5.5 years of the decision to proceed. 15
.")
22 Conceptual Estimate of Revenue Potential This is a very broad-brush, rough approximation of revenue potential associated with tolling all or part of Connecticut s expressway system. These estimates are subject to considerable refinement and further studies, and are based primarily on existing traffic information (2013 levels). A national Interstate tolling impact model, now under development for FHWA, was used to estimate traffic diversions along major corridors, but these were then applied directly to actual observed volumes along the Interstate and major state designated highway facilities in Connecticut. Transaction and revenue potential was initially computed at 2013 levels and then expanded to a hypothetical 20-year projection period assumed to begin around 2020, using a conservative average annual growth rate of 0.75 percent per year. Toll Rate Considerations In determining the range of toll rates which could rationally be considered, a historical perspective was developed of rates originally charged on the Connecticut Turnpike (I-95), as a starting point. Figure 4 shows the equivalent rate per mile on the Turnpike when it opened in 1957 (red line) and at the time tolls were removed in the mid-1980s (blue line). When the Connecticut Turnpike was opened, it had eight toll plazas spread over a 129-mile length of the project, each of which charged a nominal cash toll of $0.25 per passenger vehicle. A total of $2.00 in toll charges was collected from each passenger vehicle that traveled the entire facility. This was equivalent to $ per mile for passenger cars, with higher rates for trucks. The red line applies the Consumer Price Index (CPI) inflation rates for nearly 60 years to show what the opening year toll rates would be in equivalent 2014 dollars. The $ per mile in 1957 would be equivalent to nearly $0.130 per mile in 2014 dollars and closer to $0.15 per mile by the time tolls could be re-implemented under most scenarios in Connecticut. Obviously, tolls were not increased to keep up with inflation on the original turnpike. When tolls were removed around 1985, the through trip toll had increased to only $2.80, or equivalent to around $0.021 per mile. As shown in Figure 4, that is equivalent in today s dollars to about $0.048 per mile. Based on this analysis, a broad range of rates in today s conditions would be somewhere between $0.05 and $0.20 per mile. For simplicity, most scenarios in this White Paper considered illustrative rates of $0.10 and $0.20 per mile, to give a fairly wide range of outcomes. These per mile rates would apply to passenger cars equipped with E-ZPass transponders. It was assumed that a 50 percent surcharge would be added for motorists requiring video imaging and using the pay by mail approach. This covers the additional processing cost and collection risk. Note that revenue estimates included in this White Paper as well as operating cost assumptions do not include the benefit of this incremental surcharge, since it was nominally assumed that the surcharge level itself would be designed specifically to offset the incremental operating cost and leakage risk. Essentially, revenue estimates included below implicitly assume all vehicles are equipped with E-Z Pass transponders. 16


23 Rate Per Mile White Paper A Conceptual Look at Tolling Highways in Connecticut Figure 4 Connecticut Turnpike Toll Rates Perspective $0.16 $0.14 Equivalent Rates in 2014 Dollars $0.12 $0.10 $0.08 $0.06 $0.04 $0.02 Rate Per Mile When CT Turnpike Opened Rate Per Mile When CT Turnpike Tolls Removed $0.00 Years Toll rates for trucks would also be higher. For purposes of this study it was assumed that the average truck tolls would be three times that of passenger cars. Scenario A Revenue Potential Table 2 shows a preliminary range of revenue potential for Scenario A, which assumes tolling all Interstate routes. All values shown in the table reflect 2013 traffic conditions and, effectively, 2014 toll rates. A total of 347 miles of Interstate would be tolled, which at 2013 traffic levels served more than 25 million vehicle miles of travel per day. Figures for each of the seven Interstate routes in Connecticut are provided. At a nominal $0.10 per mile passenger car toll (with progressively higher rates for trucks and vehicles without transponders) annual toll transactions (essentially trips) is estimated at almost 668 million. This would generate revenue of over $1 billion per year, resulting in an overall average toll per vehicle of just under $1.59 per trip (not per gantry passage). Annual operating costs are estimated at about $0.085 per transaction, which would result in just over $99 million in 2014 dollars. Operating costs also include an annualized equivalent of the capital cost of deploying electronic tolling on the expressway system, annualized over a nominal assumed 10-year period. This would result in estimated annual net toll revenue, after collection costs, of about $960 million per year. As shown on the right side of Table 2, assuming a nominal toll rate of $0.20 per mile, annual toll revenue would increase to more than $1.7 billion per year, with an average toll of about $3.17 per passenger vehicle trip. Note that this average toll includes the effect of higher tolls for commercial vehicles but does not include the surcharge which would be applied to vehicles without transponders. 17
24 Table 2 Estimated 2013 Level Annual Transactions and Revenue Scenario A Toll All Interstate Routes ( 2014 Dollars) At Nominal $0.10 / Mile Toll (1) At Nominal $0.20 / Mile Toll (1) Tolled Annual Annual Average Operating Annual Net Annual Annual Average Operating Annual Net Route Length 2013 VMT / Day Trans. Revenue Toll Cost (2) Revenue Trans. Revenue Toll Cost (2) Revenue (Miles) (000) (Millions) (Millions) (Millions) (Millions) I , $297.9 $1.977 $25.3 $ $459.9 $3.951 $22.4 $437.5 I , $243.2 $1.644 $21.5 $ $388.0 $3.291 $18.9 $369.1 I , $400.2 $1.406 $39.4 $ $630.8 $2.807 $34.3 $596.5 I $12.1 $0.752 $1.8 $ $18.8 $1.492 $1.5 $17.3 I $13.5 $0.871 $2.2 $ $21.5 $1.734 $2.0 $19.5 I , $71.1 $2.504 $5.9 $ $111.4 $5.018 $5.4 $106.0 I $21.2 $0.869 $3.1 $ $33.1 $1.742 $2.6 $30.5 Total , $1,059.2 $1.586 $99.2 $ $1,663.5 $3.167 $87.0 $1,576.5 (1) -- Rates per mile for passenger cars with transponders; higher rates would be charged for vehicles without transponders and for larger trucks. (2) -- Operating cost includes annual elctronic toll collection cost plus annualized tolling capital cost nominally assumed to be annualized over 10 years. White Paper A Conceptual Look at Tolling Highways in Connecticut 18
25 For purposes of this conceptual review, it has been assumed that the surcharge level would be set specifically to offset higher operating costs and revenue leakage associated with video tolling; hence no revenue credit from the surcharge is assumed in these estimates. Operating costs would be slightly lower, since the number of transactions would be reduced, resulting in a net revenue yield of nearly $1.6 billion per year, assuming 2013 traffic levels and in 2014 dollars. Scenario B Revenue Potential Table 3 presents similar information for Scenario B, under which all the Interstate highways would be tolled as well several primary state designated expressway facilities. In this case, traffic diversions off the Interstate routes, particularly I-95 would be slightly less, since tolls would also be applied on competing highways, such as the Merritt and Wilbur Cross Parkways. Hence, net revenue on the Interstate System would be increased slightly, in addition to the introduction of more revenue from the additional toll routes. In total, just over 556 miles of expressway facilities would be tolled under Scenario B. In 2013, these facilities accommodated almost 33 million vehicle miles of travel per day. At the $0.10 toll level, annual net revenue from the additional state routes is estimated at $289 million, bringing the total net revenue proceeds, after recognizing collection costs, to almost $1.3 billion in 2014 dollars. This increases to $2.1 billion per year, after collection costs, at the $0.20 per mile rate. Scenario C Revenue Potential Table 4 presents a summary of traffic and revenue estimates under Statewide Tolling Scenario C; establishment of border tolls on limited access routes entering Connecticut. Routes assumed to be tolled include: I-95, entering from New York; I-95, entering from Rhode Island; I-84, entering from New York; I-84, entering from Massachusetts; I-91, entering from Massachusetts; I-395, entering from Massachusetts; and Route 15 (Merritt Parkway), entering from New York. All-electronic tolls were assumed to be added in only the entering direction. It would also be possible to assess tolls in the exiting direction, but that was not assumed for purposes of the conceptual assessment. Entry tolls were conceptually tested at passenger rates between $1.00 and $5.00, again assuming oneway tolls. As shown in Table 4, with the concentrated higher tolls at individual single locations, significant bypass traffic diversions can be expected, especially at higher toll rates. Traffic diversions (and overall trip reductions, at the $1.00 rate level would be in the range of 10%. This would increase to around 20% at a $3.00 toll and as much as 30 percent at a $5.00 toll. It should be recognized that these tolls are rates for passenger cars, using EZ Pass. Higher rates would be charged for trucks, and all vehicles travelling without a transponder. 19
26 Table 3 Estimated 2013 Level Annual Transactions and Revenue Scenario B Toll All Interstate Routes Plus State Limited Access Routes (2014 Dollars) At Nominal $0.10 / Mile Toll (1) At Nominal $0.20 / Mile Toll (1) Tolled Annual Annual Average Operating Annual Net Annual Annual Average Operating Annual Net Route Length 2013 VMT / Day Trans. Revenue Toll Cost (2) Revenue Trans. Revenue Toll Cost (2) Revenue (Miles) (000) (Millions) (Millions) (Millions) (Millions) Interstate Routes I , $320.4 $2.072 $25.6 $ $320.4 $4.147 $22.8 $478.1 I , $239.4 $1.626 $21.4 $ $239.4 $3.253 $19.0 $368.7 I , $425.6 $1.428 $40.5 $ $425.6 $2.856 $35.5 $647.9 I $10.9 $0.669 $1.8 $ $10.9 $1.328 $1.5 $15.5 I $12.1 $0.752 $2.3 $ $12.1 $1.504 $2.0 $17.7 I , $75.6 $2.520 $6.1 $ $75.6 $5.038 $5.5 $114.9 I $20.6 $0.841 $3.1 $ $20.6 $1.679 $2.6 $29.3 Interstate Total , $1,104.6 $1.608 $100.8 $1, $1,761.0 $3.213 $89.0 $1,672.0 Other State Limited Access Routes Route , $51.3 $1.688 $5.4 $ $51.3 $3.379 $4.9 $77.2 Route , $90.3 $2.745 $7.8 $ $90.3 $5.506 $7.1 $125.6 Route , $57.9 $1.821 $6.0 $ $57.9 $3.631 $5.5 $86.0 Route $2.2 $0.769 $1.1 $ $2.2 $1.524 $1.1 $2.1 Route , $121.5 $1.201 $14.2 $ $121.5 $2.399 $12.7 $185.7 State Route Total , $323.2 $1.623 $34.6 $ $507.9 $3.206 $31.4 $476.5 Scenario B Total , $1,427.8 $1.612 $135.4 $1, $2,268.9 $3.211 $120.4 $2,148.5 (1) -- Rates per mile for passenger cars with transponders; higher rates would be charged for vehicles without transponders and for larger trucks. (2) -- Operating costs include toll collection cost plus annualized toll system capital investment cost; assumed to be annualized of 10 years. 20
27 Table 4 Estimated 2013 Annual Transactions and Revenue Scenario C - Border Tolling $1.00 Cars / $3.00 Trucks (1) $2.00 Cars / $6.00 Trucks (1) Border Tolling 2013 AADT Toll Free Annual Annual Average Operating Annual Net Annual Annual Average Operating Annual Net Location Entering CT Annual Traffic Trans. Revenue Toll Cost (2) Revenue Trans. Revenue Toll Cost (2) Revenue (Millions) (Millions) (Millions) (Millions) (000) (Millions) I-95 West of RI (Entering CT) 19, $8.3 $1.27 $1.3 $ $15.5 $2.52 $1.2 $14.3 I-395 South of MA (Entering CT) 11, $4.5 $1.27 $0.8 $ $8.1 $2.55 $0.8 $7.3 I-84 South of MA (Entering CT) 25, $12.9 $1.54 $1.4 $ $24.5 $3.08 $1.4 $23.1 I-91 South of MA (Entering CT) 40, $16.2 $1.24 $1.9 $ $29.5 $2.49 $1.8 $27.7 I-84 East of NY (Entering CT) 40, $17.2 $1.30 $1.9 $ $33.0 $2.60 $1.9 $31.1 I-95 East of NY (Entering CT) 68, $27.9 $1.24 $2.9 $ $53.4 $2.48 $2.8 $50.5 CT-15 East of NY (Entering CT) 21, $7.0 $1.00 $1.2 $ $13.0 $2.00 $1.1 $11.9 Total 226, $94.0 $1.27 $11.4 $ $177.0 $2.54 $11.0 $166.0 Percent Retained 100.0% 90.0% 84.6% $3.00 Cars / $9.00 Trucks (1) $4.00 Cars / $12.00 Trucks (1) Border Tolling 2013 AADT Toll Free Annual Annual Average Operating Annual Net Annual Annual Average Operating Annual Net Location Entering CT Annual Traffic Trans. Revenue Toll Cost (2) Revenue Trans. Revenue Toll Cost (2) Revenue (Millions) (Millions) (Millions) (Millions) (000) (Millions) I-95 West of RI (Entering CT) 19, $21.8 $3.80 $1.2 $ $27.3 $5.09 $1.1 $26.2 I-395 South of MA (Entering CT) 11, $11.1 $3.84 $0.8 $ $13.3 $5.13 $0.7 $12.6 I-84 South of MA (Entering CT) 25, $34.9 $4.62 $1.3 $ $44.1 $6.16 $1.3 $42.8 I-91 South of MA (Entering CT) 40, $41.1 $3.76 $1.7 $ $50.5 $5.05 $1.6 $48.9 I-84 East of NY (Entering CT) 40, $46.6 $3.90 $1.8 $ $59.3 $5.21 $1.7 $57.5 I-95 East of NY (Entering CT) 68, $76.3 $3.73 $2.7 $ $96.4 $4.96 $2.6 $93.8 CT-15 East of NY (Entering CT) 21, $18.3 $3.00 $1.1 $ $22.6 $4.00 $1.0 $21.6 Total 226, $250.1 $3.81 $10.6 $ $313.5 $5.09 $10.1 $303.3 Percent Retained 100.0% 79.5% 74.6% $5.00 Cars / $15.00 Trucks (1) Border Tolling 2013 AADT Toll Free Annual Annual Average Operating Annual Net Location Entering CT Annual Traffic Trans. Revenue Toll Cost (2) Revenue (Millions) (Millions) (Millions) I-95 West of RI (Entering CT) 19, $31.6 $6.31 $1.1 $30.5 I-395 South of MA (Entering CT) 11, $15.9 $6.49 $0.7 $15.2 I-84 South of MA (Entering CT) 25, $52.0 $7.70 $1.3 $50.7 I-91 South of MA (Entering CT) 40, $58.4 $6.35 $1.5 $56.9 I-84 East of NY (Entering CT) 40, $71.0 $6.51 $1.7 $69.3 I-95 East of NY (Entering CT) 68, $114.6 $6.21 $2.5 $112.1 CT-15 East of NY (Entering CT) 21, $26.3 $5.00 $1.0 $25.3 Total 226, $369.7 $6.37 $9.8 $360.0 Percent Retained 100.0% 70.3% (1) -- Rates per mile for passenger cars with transponders; higher rates would be charged for vehicles without transponders. (2) -- Operating cost includes annual elctronic toll collection cost plus annualized tolling capital cost nominally assumed to be annualized over 10 years. 21
28 Annual toll revenue would range from about $94 million at the $1.00 car toll to almost $370 million at the $5.00 car toll. After deducting toll collection operating cost (including the annualized capital cost of adding the all-electronic collection gantries), net revenue would range from $81.6 million to $359.0 million, depending on toll rate. Net revenue increases rapidly with higher toll rates, since operating costs remaining nearly constant but revenues increase significantly. 25 Year Annual Net Revenue Potential Statewide Tolling Scenarios Table 5 presents a summary of preliminary annual net toll revenue estimates for both Scenario A and Scenario B, at two hypothetical toll rates of $0.10 and $0.20 per mile. Note that all revenue values shown in this table are in 2014 dollars; that is toll rates are assumed to remain unadjusted for inflation. In practice, some increases in rates would be expected in the future; perhaps linked to CPI or other economic parameter, which would produce revenues somewhat higher than those shown in Table 5. However, traffic was assumed to grow by a nominal rate of 0.75 percent per year. It is also noted that the table shows net revenue, after deducting operating costs associated with the collection of tolls and the annual capital cost of installing tolling systems, (but not including roadway maintenance or operating costs not associated with tolling). In-State versus Out-of-State Revenue - Over the first 25 years of tolling under Scenario A, over $27.7 billion in additional state net revenue would be generated, with low end tolls of $0.10 per mile; over $8.0 billion of which would come from out-of-state drivers; after covering the cost of collection and the capital cost of equipment. If higher tolls of $0.20 per mile were used, over $45.5 billion in new transportation funds would be generated, over $11 billion coming from drivers from outside Connecticut. Under Scenario B, with essentially all limited access routes tolled, net toll revenue over the first 25 years would reach $37-$62 billion, depending on toll rates used. Table 6 provides annual net revenue estimates for Statewide Tolling Scenario C, border tolls, under each of five different toll rates. In each case, the net revenue is broken out by the approximate distribution of revenue from in-state vs. out-of state vehicles. About 54 percent of revenue from border tolls would come from out-of state motorists, vs. 46 percent from Connecticut vehicles. Over the first 25 years of border tolling, at the $1.00 passenger rate a total of almost $2.5 billion in net revenue would be collected, after operating cost and amortization of capital cost of tolling systems. This is equivalent to an average of just over $90 million per year. This increases almost $283 million per year at a toll of $3.00 for cars and almost $425 million per year at a $5.00 rate. It should be kept in mind that these values reflect a one way toll, entering Connecticut only, at each location. It is also noted that as toll rates increase, traffic diversions (and possible negative economic impacts in the vicinity of borders) increase. If tolls at these levels were charged in both directions, diversions and economic impacts would be compounded. 22
29 Table 5 Estimated Net Annual Revenue Statewide Tolling Scenarios A and B (2014 Dollars) Statewide Scenario A (Toll Interstate Routes Only) Statewide Scenario B (Toll Interstates Plus State Freeways) $0.10 / Mile $0.20 / Mile $0.10 / Mile $0.20 / Mile Year CT Vehicles Out-State Total CT Vehicles Out-State Total CT Vehicles Out-State Total CT Vehicles Out-State Total (Millions) (Millions) (Millions) (Millions) 2013 Level $681.6 $278.4 $960.0 $1,182.4 $394.1 $1,576.5 $969.3 $323.1 $1,292.4 $1,611.4 $537.1 $2, $718.4 $293.4 $1,011.8 $1,246.2 $415.4 $1,661.6 $1,021.6 $340.5 $1,362.2 $1,698.4 $566.1 $2, $723.8 $295.6 $1,019.4 $1,255.6 $418.5 $1,674.1 $1,029.3 $343.1 $1,372.4 $1,711.1 $570.4 $2, $729.2 $297.9 $1,027.1 $1,265.0 $421.7 $1,686.6 $1,037.0 $345.7 $1,382.7 $1,724.0 $574.7 $2, $734.7 $300.1 $1,034.8 $1,274.5 $424.8 $1,699.3 $1,044.8 $348.3 $1,393.1 $1,736.9 $579.0 $2, $740.2 $302.3 $1,042.5 $1,284.0 $428.0 $1,712.0 $1,052.6 $350.9 $1,403.5 $1,749.9 $583.3 $2, $745.8 $304.6 $1,050.4 $1,293.7 $431.2 $1,724.9 $1,060.5 $353.5 $1,414.0 $1,763.0 $587.7 $2, $751.3 $306.9 $1,058.2 $1,303.4 $434.5 $1,737.8 $1,068.5 $356.2 $1,424.6 $1,776.3 $592.1 $2, $757.0 $309.2 $1,066.2 $1,313.1 $437.7 $1,750.9 $1,076.5 $358.8 $1,435.3 $1,789.6 $596.5 $2, $762.7 $311.5 $1,074.2 $1,323.0 $441.0 $1,764.0 $1,084.6 $361.5 $1,446.1 $1,803.0 $601.0 $2, $768.4 $313.8 $1,082.2 $1,332.9 $444.3 $1,777.2 $1,092.7 $364.2 $1,456.9 $1,816.5 $605.5 $2, $774.1 $316.2 $1,090.3 $1,342.9 $447.6 $1,790.5 $1,100.9 $367.0 $1,467.9 $1,830.2 $610.1 $2, $779.9 $318.6 $1,098.5 $1,353.0 $451.0 $1,804.0 $1,109.2 $369.7 $1,478.9 $1,843.9 $614.6 $2, $785.8 $321.0 $1,106.8 $1,363.1 $454.4 $1,817.5 $1,117.5 $372.5 $1,490.0 $1,857.7 $619.2 $2, $791.7 $323.4 $1,115.1 $1,373.4 $457.8 $1,831.1 $1,125.9 $375.3 $1,501.1 $1,871.6 $623.9 $2, $797.6 $325.8 $1,123.4 $1,383.7 $461.2 $1,844.9 $1,134.3 $378.1 $1,512.4 $1,885.7 $628.6 $2, $803.6 $328.2 $1,131.8 $1,394.0 $464.7 $1,858.7 $1,142.8 $380.9 $1,523.7 $1,899.8 $633.3 $2, $809.6 $330.7 $1,140.3 $1,404.5 $468.2 $1,872.6 $1,151.4 $383.8 $1,535.2 $1,914.1 $638.0 $2, $815.7 $333.2 $1,148.9 $1,415.0 $471.7 $1,886.7 $1,160.0 $386.7 $1,546.7 $1,928.4 $642.8 $2, $821.8 $335.7 $1,157.5 $1,425.6 $475.2 $1,900.8 $1,168.7 $389.6 $1,558.3 $1,942.9 $647.6 $2, $828.0 $338.2 $1,166.2 $1,436.3 $478.8 $1,915.1 $1,177.5 $392.5 $1,570.0 $1,957.5 $652.5 $2, $834.2 $340.7 $1,174.9 $1,447.1 $482.4 $1,929.5 $1,186.3 $395.4 $1,581.8 $1,972.1 $657.4 $2, $840.5 $343.3 $1,183.7 $1,457.9 $486.0 $1,943.9 $1,195.2 $398.4 $1,593.6 $1,986.9 $662.3 $2, $846.8 $345.9 $1,192.6 $1,468.9 $489.6 $1,958.5 $1,204.2 $401.4 $1,605.6 $2,001.8 $667.3 $2, $853.1 $348.5 $1,201.6 $1,479.9 $493.3 $1,973.2 $1,213.2 $404.4 $1,617.6 $2,016.8 $672.3 $2, $859.5 $351.1 $1,210.6 $1,491.0 $497.0 $1,988.0 $1,222.3 $407.4 $1,629.7 $2,032.0 $677.3 $2, Year Total $19,673.5 $8,035.6 $27,709.1 $34,127.7 $11,375.9 $45,503.6 $27,977.6 $9,325.9 $37,303.4 $46,510.2 $15,503.4 $62,013.6 Avg. Annual $786.9 $321.4 $1,108.4 $1,365.1 $455.0 $1,820.1 $1,119.1 $373.0 $1,492.1 $1,860.4 $620.1 $2,
30 Table 6 Estimated Annual Net Revenue Scenario C - Border Tolling (All revenue in millions and 2014 dollars) $1.00 Cars/$3.00 Trucks $2.00 Cars/$6.00 Trucks $3.00 Cars/$9.00 Trucks $4.00 Cars/$12.00 Trucks $5.00 Cars/$15.00 Trucks Year CT Vehicles Out of State Total CT Vehicles Out of State Total CT Vehicles Out of State Total CT Vehicles Out of State Total CT Vehicles Out of State Total 2013 Level $38.0 $44.6 $82.6 $76.4 $89.6 $166.0 $110.2 $129.4 $239.5 $139.5 $163.8 $303.3 $165.6 $194.4 $ $40.9 $48.1 $89.0 $82.3 $96.6 $178.9 $118.7 $139.4 $258.1 $150.3 $176.5 $326.8 $178.4 $209.5 $ $41.3 $48.4 $89.7 $82.9 $97.3 $180.2 $119.6 $140.4 $260.1 $151.5 $177.8 $329.3 $179.8 $211.0 $ $41.6 $48.8 $90.4 $83.5 $98.0 $181.6 $120.5 $141.5 $262.0 $152.6 $179.2 $331.8 $181.1 $212.6 $ $41.9 $49.2 $91.0 $84.1 $98.8 $182.9 $121.4 $142.5 $264.0 $153.8 $180.5 $334.3 $182.5 $214.2 $ $42.2 $49.5 $91.7 $84.8 $99.5 $184.3 $122.3 $143.6 $266.0 $154.9 $181.9 $336.8 $183.8 $215.8 $ $42.5 $49.9 $92.4 $85.4 $100.3 $185.7 $123.3 $144.7 $268.0 $156.1 $183.2 $339.3 $185.2 $217.4 $ $42.8 $50.3 $93.1 $86.0 $101.0 $187.1 $124.2 $145.8 $270.0 $157.2 $184.6 $341.8 $186.6 $219.1 $ $43.1 $50.6 $93.8 $86.7 $101.8 $188.5 $125.1 $146.9 $272.0 $158.4 $186.0 $344.4 $188.0 $220.7 $ $43.5 $51.0 $94.5 $87.3 $102.5 $189.9 $126.1 $148.0 $274.0 $159.6 $187.4 $347.0 $189.4 $222.4 $ $43.8 $51.4 $95.2 $88.0 $103.3 $191.3 $127.0 $149.1 $276.1 $160.8 $188.8 $349.6 $190.8 $224.0 $ $44.1 $51.8 $95.9 $88.7 $104.1 $192.7 $128.0 $150.2 $278.2 $162.0 $190.2 $352.2 $192.3 $225.7 $ $44.5 $52.2 $96.6 $89.3 $104.9 $194.2 $128.9 $151.3 $280.2 $163.2 $191.6 $354.8 $193.7 $227.4 $ $44.8 $52.6 $97.4 $90.0 $105.6 $195.6 $129.9 $152.5 $282.3 $164.5 $193.1 $357.5 $195.2 $229.1 $ $45.1 $53.0 $98.1 $90.7 $106.4 $197.1 $130.9 $153.6 $284.5 $165.7 $194.5 $360.2 $196.6 $230.8 $ $45.5 $53.4 $98.8 $91.3 $107.2 $198.6 $131.8 $154.8 $286.6 $166.9 $196.0 $362.9 $198.1 $232.6 $ $45.8 $53.8 $99.6 $92.0 $108.0 $200.1 $132.8 $155.9 $288.7 $168.2 $197.4 $365.6 $199.6 $234.3 $ $46.1 $54.2 $100.3 $92.7 $108.9 $201.6 $133.8 $157.1 $290.9 $169.4 $198.9 $368.4 $201.1 $236.1 $ $46.5 $54.6 $101.1 $93.4 $109.7 $203.1 $134.8 $158.3 $293.1 $170.7 $200.4 $371.1 $202.6 $237.8 $ $46.8 $55.0 $101.8 $94.1 $110.5 $204.6 $135.8 $159.5 $295.3 $172.0 $201.9 $373.9 $204.1 $239.6 $ $47.2 $55.4 $102.6 $94.8 $111.3 $206.1 $136.9 $160.7 $297.5 $173.3 $203.4 $376.7 $205.6 $241.4 $ $47.5 $55.8 $103.4 $95.5 $112.2 $207.7 $137.9 $161.9 $299.7 $174.6 $204.9 $379.5 $207.2 $243.2 $ $47.9 $56.2 $104.1 $96.3 $113.0 $209.2 $138.9 $163.1 $302.0 $175.9 $206.5 $382.4 $208.7 $245.0 $ $48.3 $56.7 $104.9 $97.0 $113.8 $210.8 $140.0 $164.3 $304.2 $177.2 $208.0 $385.2 $210.3 $246.9 $ $48.6 $57.1 $105.7 $97.7 $114.7 $212.4 $141.0 $165.5 $306.5 $178.5 $209.6 $388.1 $211.9 $248.7 $ $49.0 $57.5 $106.5 $98.4 $115.6 $214.0 $142.1 $166.8 $308.8 $179.9 $211.2 $391.0 $213.5 $250.6 $ Year Total $1,121.3 $1,316.3 $2,437.6 $2,253.1 $2,645.0 $4,898.1 $3,251.7 $3,817.2 $7,068.9 $4,117.3 $4,833.4 $8,950.6 $4,886.1 $5,735.9 $10,622.0 Avg. Annual $44.9 $52.7 $97.5 $90.1 $105.8 $195.9 $130.1 $152.7 $282.8 $164.7 $193.3 $358.0 $195.4 $229.4 $424.9 White Paper A Conceptual Look at Tolling Highways in Connecticut 24

31 Revenue and Cost Summaries Figures 5 and 6 provide convenient summaries of potential revenue and costs for Scenarios A and B, respectively. As shown in the upper portion of Figure 5, average annual net revenue over the first 25 years of operation would be between $1.2 billion and $1.9 billion per year, depending on toll rate. At the nominal $0.10 per mile passenger car toll rate, the average toll per passenger car trip would be less than $1.25, while the overall average toll, including trucks, would be less than $1.59. At the other end of the spectrum, at $0.20 per mile, the average passenger car trip would be just under $2.50 and the average overall trip, including trucks, would be almost $3.17. Scenario A would have a capital deployment cost of almost $450 million. However, even at the lowest toll rate tested, this would be recovered from net revenue collections in the first 3-6 months of operation. In-State versus Out-of-State Revenues The lower portion of Figure 5 also shows the distribution of revenue by in-state vs. out-of-state cars and trucks. Given the relatively high proportion of out-of-state traffic on Interstate highways, 29 percent of toll revenue collections from Scenario A Interstate tolling would come from out-of-state motorists. Thirty-one percent of revenue would come from trucks. Figure 6 shows comparable information for Scenario B, which would include the additional tolling of state designated expressway routes. The proportion of revenue from out-of-state motorists decreases to about 25 percent, since there tends to be a higher share of in-state traffic on state designated routes such as Routes 2, 8 and 9. Likewise, the share of revenue from trucks decreases to about 26 percent, still quite significant. Even with the expanded cost to extend gantries to 200 additional miles of expressways, the capital investment cost would be recovered by estimated net revenue in less than one year under all hypothetical toll rates tested, and in as little as five months if a nominal rate of $0.10 per mile were charged on all expressways in the state. At the higher rate of $0.20 per mile, the capital investment cost could be recovered in a little more than three months. 25
 (2020-2045) $2,000 $1,800 $1,600 $1,400 $1,200 $1,000 $800 $600 $400 $200 Operating Cost (1) Net Toll")
 78 $449 78 $449 (1) Operating cost includes collection cost plus annualized capital cost of system deployment.")
32 W:\Northern Region\Projects\CT 97692\Graphics\Powerpoint\Portrait.pptx\ CTDOT Statewide Strategic Transportation Plan Average Annual Revenue (Millions) ( ) $2,000 $1,800 $1,600 $1,400 $1,200 $1,000 $800 $600 $400 $200 Operating Cost (1) Net Toll Revenue $0 Passenger Car Per Mile Toll $0.10 $0.12 $0.14 $0.16 $0.18 $0.20 Average Car Toll / Trip $1.247 $1.466 $1.724 $1.980 $2.220 $2.490 Average Overall Toll / Trip $1.586 $1.865 $2.193 $2.518 $2.823 $3.167 Number of Toll Gantries Capital Cost to Deploy (Millions) 78 $ $449 (1) Operating cost includes collection cost plus annualized capital cost of system deployment. 78 $ $ $ $449 In State vs. Out of State Proportion of Revenue Passenger Cars vs. Trucks In State 71% Out of State 29% Passenger Cars 69% Trucks 31% REVENUE AND COST SUMMARY SCENARIO A: TOLLING OF INTERSTATE ROUTES FIGURE 5
33 W:\Northern Region\Projects\CT 97692\Graphics\Powerpoint\Portrait.pptx\ CTDOT Statewide Strategic Transportation Plan $2,800 $2,400 Operating Cost (1) Net Toll Revenue Average Annual Revenue (Millions) ( ) $2,000 $1,600 $1,200 $800 $400 $0 Passenger Car Per Mile Toll $0.10 $0.12 $0.14 $0.16 $0.18 $0.20 Average Car Toll Per Trip Average Overall Toll / Trip Number of Toll Gantries Capital Cost to Deploy (Millions) 121 $ $635 (1) Operating cost includes collection cost plus annualized capital cost of system deployment. $1.265 $1.488 $1.749 $2.012 $2.256 $2.527 $1.608 $1.891 $2.224 $2.552 $2.861 $ $ $ $ $635 In State vs. Out of State Proportion of Revenue Passenger Cars vs. Trucks In State 75% Out of State 25% Passenger Cars 74% Trucks 26% REVENUE AND COST SUMMARY SCENARIO B: TOLLING OF INTERSTATE ROUTES PLUS OTHER STATE LIMITED ACCESS ROUTES FIGURE 6
34 Figure 7 provides a similar summary for Statewide tolling Scenario C, border tolls. The bars depict average annual revenue, operating cost and net revenue over the 25 year period ( ). Operating costs are a relatively small proportion of toll revenue, given the relative high toll rates per transaction being charged. The capital cost for deployment at all limited access entry points into the state, including customer service centers and a central system, plus engineering and environmental studies is approximated at $50 million. This in annualized at an equivalent $5 million per year, and is included in the operating costs. All revenue and cost estimates are in 2014 dollars. The average toll for cars is equal to the nominal toll rate, since all drivers pay the same entry toll regardless of trip length. The overall average toll rates are higher, reflecting the fact that trucks would pay a higher toll. Figure 7 also shows that 54 percent of net revenue would come from out of state vehicles, while 46 percent would come from Connecticut vehicles. About 68 percent of revenue would come from cars, and 32 percent from trucks. Comparative Summary Statewide Tolling Options Table 7 presents a comparative summary of the three basic statewide tolling options: Scenario A Tolling All Interstate Routes; Scenario B Tolling All Interstate and State Route Expressways; and Scenario C Border Tolls. Comparative information is provided for low end toll rates (represented by $0.10 per mile for Scenarios A and B and $2.00 for the border toll option), and high end rates, (represented by $0.20 per mile and $4.00 for border tolls). While not precisely equivalent, the border toll versus per-mile rates are generally comparable. For each rate level, Table 7 compares average annual net revenue, both from in-state vehicles and outof-state vehicles. Total average annual net revenue at the low end toll rates is estimated at $1.1 billion per year under Scenario A, $1.4 billion per year under Scenario B and $195.9 million per year with entry only border tolls. It is interesting to note that while the proportion of revenue from out-of-state vehicles is higher with entry only border tolls, the actual amount of revenue contributed by out-ofstate vehicles is considerably higher for both Scenario A and Scenario B. The average passenger car toll under Scenarios A and B would be $ $1.26 per trip, or $ $2.52 for total round trip, for the low end toll rates. Even at the highest per-mile toll rate tested, the average toll per passenger car trip would be $2.49. This compares to an average one-way toll with border tolls of $4.00. Obviously, the number of trips subjected to tolling would be considerably less with border tolls. Table 7 also provides a general range of anticipated traffic diversions to alternative routes. Under Scenarios A and B, at the lower end tolls, diversions would generally be in the range of percent, depending on which route. Diversions at state lines under border tolls would be about 15 percent at the lower tolls and 25 percent or more at the higher toll ($4.00 in this example). 26
 (2020-2045) Passenger Car Tolls $500 $450 $400 $350 $300 $250 $200 $150 $100 $50 $0 Operating Cost (1) Net")
 7 $50 (1) Operating cost includes collection cost plus annualized capital cost of")
35 W:\Northern Region\Projects\CT 97692\Graphics\Powerpoint\Portrait.pptx\ CTDOT Statewide Strategic Transportation Plan Average Annual Revenue (Millions) ( ) Passenger Car Tolls $500 $450 $400 $350 $300 $250 $200 $150 $100 $50 $0 Operating Cost (1) Net Toll Revenue $1.00 $2.00 $3.00 $4.00 $5.00 Average Car Toll Per Trip Average Overall Toll / Trip Number of Toll Gantries Capital Cost to Deploy (Millions) 7 $50 (1) Operating cost includes collection cost plus annualized capital cost of system deployment. $1.00 $2.00 $3.00 $4.00 $5.00 $1.27 $2.54 $3.81 $5.09 $ $50 7 $50 7 $50 7 $50 In State vs. Out of State Proportion of Revenue Passenger Cars vs. Trucks In State 46% Out of State 54% Passenger Cars 68% Trucks 32% REVENUE AND COST SUMMARY SCENARIO C: BORDER TOLLS ON LIMITED ACCESS ROUTES AT STATE LINES FIGURE 7
36 Table 7 Comparative Summary of Statewide Tolling Options (2014 Dollars) Scenario A Scenario B Scenario C Toll All Toll All Border Tolls Item Interstates Expressways (Entry Only) Low End Toll Rates ($0.10 / mile ; $2.00 Border) Avg. Annual Net Revenue - In State Veh. (M) $786.9 $1,119.1 $90.1 Avg. Annual Net Revenue - Out of State (M) $321.4 $373.0 $105.8 Avg. Annual Total Net Revenue (M) $1,108.4 $1,492.1 $195.9 Avg. Annual Trips Tolled (M) Average Pass. Car Toll per Trip (1) $1.25 $1.26 $2.00 Average Pass. Car Round Trip Toll (1) $2.50 $2.52 $2.00 Typical % Diversion to Alternate Routes 10%-15% 10%-15% 15% One-Time System Deployment Cost (M) $449 $635 $44 High End Toll Rates ($0.20 / Mile; $4.00 Border) Avg. Annual Net Revenue - In State Veh. (M) $1,365.1 $1,860.4 $164.7 Avg. Annual Net Revenue - Out of State (M) $455.0 $620.1 $193.3 Avg. Annual Total Net Revenue (M) $1,820.1 $2,480.5 $358.0 Avg. Annual Trips Tolled (M) Average Pass. Car Toll per Trip (1) $2.49 $2.53 $4.00 Average Pass. Car Round Trip Toll (1) $4.98 $5.06 $4.00 Typical % Diversion to Alternate Routes 20%-30% 20%-30% 25% One-Time System Deployment Cost (M) $449 $635 $44 (1) Average toll for those trips actually tolled. Project-Specific Tolling Scenarios In addition to the statewide tolling options discussed previously, it would also be possible to implement tolling on specific projects, either major highway reconstruction or expansion projects, or possibly new limited-access capacity. The intent of this White Paper is to provide conceptual level information for policy makers as they consider strategic tolling alternatives. It is not intended to provide detailed financial feasibility assessments for any individual projects in the state. As such, the paper addressed hypothetical typical examples of project-specific tolling, without the benefit of detailed analysis. The examples represent only hypothetical concepts, and should not suggest any decisions have been reached about project financing of any particular projects. Further, sketch level estimates of revenue and cost for these example projects have been developed in the same conceptual manner as the statewide tolling scenarios; hence, the findings should be considered subject to considerable refinement. While a more detailed ongoing study is underway of congestion pricing in some of these corridors, information included in this document may not be consistent with the results 27
37 of that more detailed analysis which will be completed in months to come. In short, the projectspecific tolling scenarios are included with a goal of providing a consistent level of conceptual information along a full range of tolling scenarios which could emerge. As noted previously, three hypothetical project-specific scenarios are addressed: Scenario D Managed lane pricing, in which tolls would be applied to only a portion of travel lanes on a limited-access facility; Scenario E Spot tolling, in which electronic tolls would be at or near the immediate location of major construction investment in this hypothetical case a potentially costly replacement of a major viaduct along I-84 in Hartford is used as an illustrative example; and Scenario F Tolls added to all lanes along an extended freeway corridor, as part of major reconstruction or expansion. In this case, the portion of I-95 between New York and New Haven is used for illustrative purposes. Scenario D Managed Lanes Managed lanes involve tolling of only one or two travel lanes in each direction on an existing freeway facility; typically one in which the general purpose lanes are congested. This can take the form of either a simple conversion from HOV lanes to HOT operation (Scenario D-1) or construction of new express toll lanes, in which tolls would be used only on the new capacity and the adjacent general purpose lanes would remain toll free (Scenario D-2). Connecticut has only two operating HOV lanes: (1) I-91 north of Hartford and (2) I-84 east of Hartford. Use of these lanes is currently limited to vehicles with two or more occupants. Across the U.S., several such HOV lanes have been converted to high occupancy toll (HOT) operation, whereby the lanes are still available toll-free to vehicles with two or more occupants, but opening them to single-occupant vehicles willing to pay an electronic toll. The toll is typically varied by time of day or dynamically to manage SOV demand, so as to preserve free-flow conditions on the HOT lanes. Physically, the I-91 and I-84 HOV lanes in Connecticut would be ideal for conversion, given the limited access points, direct connections to cross roads and the unusually wide buffer between the general purpose and HOV lanes. Conversion would be straightforward and could be implemented at low cost, probably in less than two years. However, HOT lanes are not typically big revenue producers; they generally are viewed as a means of reducing congestion in a highway corridor by increasing the overall efficiency of all lanes on the route. They tend to generate enough revenue to pay the incremental operating cost of HOT lanes, but produce minimal additional revenue to support other capital investments. Based on a conceptual review of traffic conditions and available capacity, this would likely be true in the case of the I-91 and I-84 facilities as well. This should be viewed as an operational improvement, and not as a strategy which could generate revenue to support new construction. New capacity express lanes could be considered on existing congested Interstate routes or other limited-access roads in the state. A good example of this might be along I-95, between New York and New Haven. This facility has high levels of congestion, over numerous hours of the day. In practice, it would also be extremely difficult to construct an additional four express lanes in this dense urban environment with a large number of interchanges and structures. 28
38 For purposes of this White Paper, a general assessment of net revenue potential was developed for a hypothetical 45-mile express lane facility between New York and New Haven. As shown in Table 8, over a period of 25 years, the facility would generate close to $1 billion in revenue, but an average of less than $38 million per year. Such a facility would also require a complex all-electronic tolling system, which might include up to 15 toll gantries along with dozens of dynamic message signs at access points to show the variable toll rate in effect at any point in time. Including amortization of the capital investment, plus toll collection operating costs, this will consume about $13.5 million per year of revenue. The net result would generate an average annual net revenue of less than $25 million per year, in 2014 dollars. It is likely that actual revenue would be somewhat higher, since it would be essential to continue to increase rates in proportion to (or beyond) inflation as a means of properly managing demand on the express toll lanes. Even with inflation adjustments, the conceptual level of estimated net revenue would likely support around $500 million in long-term financing capacity; just a small portion of the capital cost of developing a complex express lane system estimated at considerably more than $10 billion. Scenario E Spot Tolling This hypothetical example of project-specific tolling was conceptually evaluated at a location on I-84 near downtown Hartford. A costly reconstruction project is currently under review; namely the replacement of the aging Hartford Viaduct. While various alternatives are being reviewed, estimates suggest the total cost could be as much as $3-5 billion to complete the project. Under this hypothetical example, an all-electronic tolling point could be established on I-84 at or near the site of the reconstruction. The objective would be to assess at least a portion of the capital cost directly to those users of this critical highway; namely those who benefit from the major highway improvement. Tolling could be added in either one or two gantries at this location, estimated to cost about $12 million to implement, including a statewide central system, design, engineering and other supporting activities. If a single gantry is used, the capital cost could be slightly less. The analysis considered a range of toll rates for passenger cars, with higher rates assumed for trucks and motorists without E-ZPass electronic toll transponders. Passenger car toll rates ranging from $0.25 to $1.50 were considered. As shown in Table 9, this would result in fairly significant levels of revenue potential, ranging from about $10 million per year at the very low $0.25 passenger car rate, to as much as $54 million per year with a $1.50 toll. It is important to recognize, however, that with spot tolling at a single location there is a relatively high potential for traffic diversions to local roads, particularly by commuters traveling in and out of downtown Hartford who may choose to leave I-84 west of the tolling point. Traffic diversions would increase significantly at toll levels above $1.00. Figure 8 provides a summary of revenue potential at six different hypothetical passenger car toll levels at the spot tolling location on I-84. Average annual revenue at a toll of, say, $1.00 would be about $50 million, or just under $45 million after deducting operating costs and annualization of capital investments for tolling equipment. This might provide financing capacity for as much as $500- $700 million, which depending on project alternative could cover up to percent of the capital investment cost, depending on project cost. 29
39 Table 8 Estimated Net Annual Revenue Scenario D-2 I-95 Express Lanes (New York - New Haven) (All figures in millions and 2014 Dollars) Annual Annual Toll Operating Annual Net Year Transactions Revenue Cost Toll Revenue $32.4 $12.8 $ $32.7 $12.9 $ $33.1 $12.9 $ $33.5 $13.0 $ $33.9 $13.0 $ $34.2 $13.1 $ $34.6 $13.1 $ $35.0 $13.2 $ $35.4 $13.3 $ $35.8 $13.3 $ $36.2 $13.4 $ $36.6 $13.4 $ $37.0 $13.5 $ $37.4 $13.6 $ $37.9 $13.6 $ $38.3 $13.7 $ $38.7 $13.8 $ $39.1 $13.8 $ $39.6 $13.9 $ $40.0 $14.0 $ $40.5 $14.1 $ $41.8 $14.1 $ $43.1 $14.2 $ $44.4 $14.3 $ $45.8 $14.4 $ Year Total $937.1 $338.4 $598.7 Avg. Annual 38.5 $37.5 $13.5 $23.9 Avg. Toll $
40 Table 9 Estimated Annual Net Revenue Scenario E - Spot Tolling on I-84 (All revenue in millions and 2014 dollars) $0.25 Cars $0.50 Cars $0.75 Cars $1.00 Cars $1.50 Cars Year CT Vehicles Out of State Total CT Vehicles Out of State Total CT Vehicles Out of State Total CT Vehicles Out of State Total CT Vehicles Out of State Total 2020 Level $7.7 $1.7 $9.4 $18.8 $4.1 $22.8 $27.8 $6.0 $33.9 $34.4 $7.5 $41.9 $41.9 $9.1 $ Level $8.4 $1.8 $10.2 $20.7 $4.5 $25.2 $30.3 $6.6 $36.9 $37.6 $8.1 $45.7 $46.3 $10.0 $ $7.7 $1.7 $9.4 $18.8 $4.1 $22.8 $27.8 $6.0 $33.9 $34.4 $7.5 $41.9 $41.9 $9.1 $ $7.8 $1.7 $9.4 $18.9 $4.1 $22.9 $28.0 $6.1 $34.0 $34.6 $7.5 $42.1 $42.1 $9.1 $ $7.8 $1.7 $9.5 $18.9 $4.1 $23.0 $28.1 $6.1 $34.2 $34.7 $7.5 $42.2 $42.3 $9.2 $ $7.8 $1.7 $9.5 $19.0 $4.1 $23.2 $28.2 $6.1 $34.3 $34.9 $7.6 $42.4 $42.5 $9.2 $ $7.9 $1.7 $9.6 $19.1 $4.1 $23.3 $28.3 $6.1 $34.5 $35.0 $7.6 $42.6 $42.8 $9.3 $ $7.9 $1.7 $9.6 $19.2 $4.2 $23.4 $28.4 $6.2 $34.6 $35.2 $7.6 $42.8 $43.0 $9.3 $ $7.9 $1.7 $9.6 $19.3 $4.2 $23.5 $28.6 $6.2 $34.7 $35.3 $7.7 $43.0 $43.2 $9.3 $ $8.0 $1.7 $9.7 $19.4 $4.2 $23.6 $28.7 $6.2 $34.9 $35.5 $7.7 $43.2 $43.4 $9.4 $ $8.0 $1.7 $9.7 $19.5 $4.2 $23.7 $28.8 $6.2 $35.0 $35.7 $7.7 $43.4 $43.6 $9.4 $ $8.0 $1.7 $9.8 $19.6 $4.2 $23.8 $28.9 $6.3 $35.2 $35.8 $7.8 $43.6 $43.8 $9.5 $ $8.1 $1.7 $9.8 $19.7 $4.3 $24.0 $29.0 $6.3 $35.3 $36.0 $7.8 $43.8 $44.0 $9.5 $ $8.1 $1.8 $9.8 $19.8 $4.3 $24.1 $29.2 $6.3 $35.5 $36.1 $7.8 $44.0 $44.3 $9.6 $ $8.1 $1.8 $9.9 $19.9 $4.3 $24.2 $29.3 $6.3 $35.6 $36.3 $7.9 $44.2 $44.5 $9.6 $ $8.2 $1.8 $9.9 $20.0 $4.3 $24.3 $29.4 $6.4 $35.8 $36.5 $7.9 $44.3 $44.7 $9.7 $ $8.2 $1.8 $10.0 $20.1 $4.3 $24.4 $29.5 $6.4 $35.9 $36.6 $7.9 $44.5 $44.9 $9.7 $ $8.2 $1.8 $10.0 $20.2 $4.4 $24.6 $29.7 $6.4 $36.1 $36.8 $8.0 $44.7 $45.1 $9.8 $ $8.3 $1.8 $10.0 $20.3 $4.4 $24.7 $29.8 $6.5 $36.2 $36.9 $8.0 $44.9 $45.4 $9.8 $ $8.3 $1.8 $10.1 $20.4 $4.4 $24.8 $29.9 $6.5 $36.4 $37.1 $8.0 $45.1 $45.6 $9.9 $ $8.3 $1.8 $10.1 $20.5 $4.4 $24.9 $30.1 $6.5 $36.6 $37.3 $8.1 $45.3 $45.8 $9.9 $ $8.4 $1.8 $10.2 $20.6 $4.5 $25.0 $30.2 $6.5 $36.7 $37.4 $8.1 $45.5 $46.0 $10.0 $ $8.4 $1.8 $10.2 $20.7 $4.5 $25.2 $30.3 $6.6 $36.9 $37.6 $8.1 $45.7 $46.3 $10.0 $ $8.4 $1.8 $10.3 $20.8 $4.5 $25.3 $30.4 $6.6 $37.0 $37.8 $8.2 $46.0 $46.5 $10.1 $ $8.5 $1.8 $10.3 $20.9 $4.5 $25.4 $30.6 $6.6 $37.2 $37.9 $8.2 $46.2 $46.7 $10.1 $ $8.5 $1.8 $10.3 $21.0 $4.5 $25.5 $30.7 $6.6 $37.3 $38.1 $8.3 $46.4 $46.9 $10.2 $ $8.5 $1.9 $10.4 $21.1 $4.6 $25.7 $30.8 $6.7 $37.5 $38.3 $8.3 $46.6 $47.2 $10.2 $ Year Total $203.1 $44.0 $247.1 $497.6 $107.7 $605.3 $732.7 $158.7 $891.4 $907.8 $196.6 $1,104.4 $1,112.4 $240.9 $1,353.3 Avg. Annual $8.1 $1.8 $9.9 $19.90 $4.3 $24.2 $29.31 $6.3 $35.7 $36.31 $7.9 $44.2 $44.50 $9.6 $54.1 White Paper A Conceptual Look at Tolling Highways in Connecticut 31
41 W:\Northern Region\Projects\CT 97692\Graphics\Powerpoint\Portrait.pptx\ CTDOT Statewide Strategic Transportation Plan $70 $60 Operating Cost (1) Net Toll Revenue Average Annual Revenue (Millions) ( ) $50 $40 $30 $20 $10 Passenger Car Tolls $0 $0.25 $0.50 $0.75 $1.00 $1.25 $1.50 Average Car Toll Per Trip Average Overall Toll / Trip Number of Toll Gantries Capital Cost to Deploy (Millions) (1) Operating cost includes collection cost plus annualized capital cost of system deployment. $0.25 $0.50 $0.75 $1.00 $1.25 $1.50 $0.29 $0.58 $0.87 $1.16 $1.43 $ $ $ $ $ $ $12 In State vs. Out of State Proportion of Revenue Passenger Cars vs. Trucks In State 82% Out of State 18% Passenger Cars 81% Trucks 19% REVENUE AND COST SUMMARY SCENARIO E: SPOT TOLLING (I-84 EXAMPLE) FIGURE 8
42 Approximately 18 percent of revenue at this location in downtown Hartford would come from out-ofstate traffic; 82 percent from in-state vehicles. Passenger cars would account for 81 percent of revenue while trucks would contribute about 19 percent. Scenario F Corridor Tolling In this hypothetical case, it was assumed that tolls would be added to all lanes on I-95 between the New York line and New Haven. This corridor extends about 48 miles and includes dozens of intermediate interchanges. Under the hypothetical concept considered, it was also assumed that I-95 would be widened between Bridgeport and Stamford, an area of exceptionally high levels of recurring congestion on weekdays (and some weekends) throughout the year. One lane was assumed to be added in each travel direction. As shown in Table 10, for purposes of the conceptual review, toll rates were tested between $0.10 and $0.20 per mile, similar to the rate levels tested on the statewide tolling options. In each case, it was assumed that average toll rates per mile for trucks would be approximately three times that of cars, although truck rates themselves would vary with size and number of axles. At the lower toll rate, full tolling of all lanes on I-95 between New York and New Haven would generate an average of about $315 million per year in revenue, almost $126 million of which would come from out-of-state motorists. After deducting average operating costs (including annualization of the capital cost to implement the tolling system) annual net revenue would be reduced to $282.3 million per year, or a 25-year total of $7.1 billion. At the higher rate of $0.20 per mile, average annual net revenue, after collection costs, would reach more than $449 million per year, or more than $11.0 billion over the 25-year projection period. It should be kept in mind that a toll of $0.10 per mile is still less in 2014 dollars than the inflation adjusted rates per mile charged on the original Connecticut Turnpike when it was opened in Figure 9 presents a revenue and cost summary for Scenario F. It shows that net revenue of $282 million per year on this single portion of I-95 could be achieved with an overall average toll rate of $0.10 per mile for passenger cars. This section of I-95 has an average trip length of about 10 miles, resulting in an average passenger car toll per trip of about $1.00 (2014 dollars) and an overall average toll per trip, including trucks, of just over $1.28. The capital cost to deploy all electronic tolling on this portion of I-95 is estimated at about $92 million with 12 overhead tolling gantries required. As shown in the lower portion of Figure 9, about 40 percent of revenue on this critical section of I-95 would come from out-of-state motorists. About one-third of revenue would come from trucks, while 67 percent would come from passenger cars. 32
43 Table 10 Estimated Annual Net Revenue Hypothetical Project Tolling Scenario F Toll All Lanes - I-95 - New Haven to New York (All figures in millions, 2014 dollars) Assuming $0.10 /$0.30 Per Mile Rates Assuming $0.20 / $0.60 Per Mile Rates Annual Annual Toll Revenue Operating Annual Net Annual Annual Toll Revenue Operating Annual Net Year Transactions CT Vehicles Out-of -State Total Cost Revenue Transactions CT Vehicles Out-of -State Total Cost Revenue 2013 Level $163.4 $109.0 $272.4 $29.1 $ $247.0 $164.7 $411.7 $24.1 $ $172.3 $114.8 $287.1 $30.2 $ $260.4 $173.6 $433.9 $24.9 $ $173.6 $115.7 $289.3 $30.3 $ $262.3 $174.9 $437.2 $25.0 $ $174.9 $116.6 $291.4 $30.5 $ $264.3 $176.2 $440.5 $25.2 $ $176.2 $117.4 $293.6 $30.6 $ $266.3 $177.5 $443.8 $25.3 $ $177.5 $118.3 $295.8 $30.8 $ $268.3 $178.8 $447.1 $25.4 $ $178.8 $119.2 $298.0 $31.0 $ $270.3 $180.2 $450.5 $25.5 $ $180.2 $120.1 $300.3 $31.1 $ $272.3 $181.5 $453.8 $25.6 $ $181.5 $121.0 $302.5 $31.3 $ $274.3 $182.9 $457.2 $25.8 $ $182.9 $121.9 $304.8 $31.4 $ $276.4 $184.3 $460.7 $25.9 $ $184.2 $122.8 $307.1 $31.6 $ $278.5 $185.6 $464.1 $26.0 $ $185.6 $123.8 $309.4 $31.8 $ $280.6 $187.0 $467.6 $26.1 $ $187.0 $124.7 $311.7 $31.9 $ $282.7 $188.4 $471.1 $26.3 $ $188.4 $125.6 $314.0 $32.1 $ $284.8 $189.9 $474.6 $26.4 $ $189.8 $126.6 $316.4 $32.3 $ $286.9 $191.3 $478.2 $26.5 $ $191.3 $127.5 $318.8 $32.5 $ $289.1 $192.7 $481.8 $26.7 $ $192.7 $128.5 $321.2 $32.6 $ $291.2 $194.2 $485.4 $26.8 $ $194.1 $129.4 $323.6 $32.8 $ $293.4 $195.6 $489.0 $26.9 $ $195.6 $130.4 $326.0 $33.0 $ $295.6 $197.1 $492.7 $27.1 $ $197.1 $131.4 $328.4 $33.2 $ $297.8 $198.6 $496.4 $27.2 $ $198.5 $132.4 $330.9 $33.4 $ $300.1 $200.0 $500.1 $27.3 $ $200.0 $133.4 $333.4 $33.5 $ $302.3 $201.5 $503.9 $27.5 $ $201.5 $134.4 $335.9 $33.7 $ $304.6 $203.1 $507.7 $27.6 $ $203.0 $135.4 $338.4 $33.9 $ $306.9 $204.6 $511.5 $27.7 $ $204.6 $136.4 $340.9 $34.1 $ $309.2 $206.1 $515.3 $27.9 $ $206.1 $137.4 $343.5 $34.3 $ $311.5 $207.7 $519.2 $28.0 $ Year Total 6,376.0 $4,717.5 $3,145.0 $7,862.5 $803.8 $7, ,785.6 $7,129.9 $4,753.3 $11,883.2 $660.7 $11,222.5 Avg. Annual $188.7 $125.8 $314.5 $32.2 $ $285.2 $190.1 $475.3 $26.4 $448.9 Average Toll / Trip $1.233 Average Toll / Trip $
 (2020-2045) $500 $400 $300 $200 $100 Operating Cost (1) Net Toll Revenue $0 Passenger Car Per Mile Toll $0.")
 (1) Operating cost includes collection cost plus annualized capital cost of system")
44 W:\Northern Region\Projects\CT 97692\Graphics\Powerpoint\Portrait.pptx\ CTDOT Statewide Strategic Transportation Plan Average Annual Revenue (Millions) ( ) $500 $400 $300 $200 $100 Operating Cost (1) Net Toll Revenue $0 Passenger Car Per Mile Toll $0.10 $0.12 $0.14 $0.16 $0.18 $0.20 Average Car Toll Per Trip Average Overall Toll / Trip Number of Toll Gantries Capital Cost to Deploy (Millions) (1) Operating cost includes collection cost plus annualized capital cost of system deployment. $1.000 $1.200 $ $1.800 $2.000 $1.278 $1.534 $1.790 $2.045 $2.301 $ $92 12 $92 12 $92 12 $92 12 $92 12 $92 In State vs. Out of State Proportion of Revenue Passenger Cars vs. Trucks In State Passenger Cars 60% Out of State 67% Trucks 40% 33% REVENUE AND COST SUMMARY SCENARIO F: I-95 CORRIDOR TOLLS FIGURE 9
Funding Scenario Descriptions & Performance
 Funding Scenario Descriptions & Performance These scenarios were developed based on direction set by the Task Force at previous meetings. They represent approaches for funding to further Task Force discussion
RhodeWorks Initiative
 RhodeWorks Initiative Accent image here Fixing Rhode Island s bridges and getting Rhode Islanders back to work Rhode Island Department of Transportation Primary Image here International Bridge, Tunnel
Task Force Meeting January 15, 2009
 Task Force Meeting January 15, 2009 Study Update August 14 th Task Force Meeting Update on Traffic Projections and Financial Feasibility Study presented by Kane County and WSA staff The presentation summarized
WASHINGTON STATE ROAD USAGE CHARGE ASSESSMENT
 1 WASHINGTON STATE ROAD USAGE CHARGE ASSESSMENT Anthony L. Buckley Director, Office of Innovative Partnerships Washington State Department of Transportation Overview: Washington State Infrastructure 2
State Tolling Authority adopts all state Highway and bridge tolls sets fares for Washington State Ferries
 6/11/2015 State Tolling Authority adopts all state Highway and bridge tolls sets fares for Washington State Ferries Proposes transportation policy and finance recommendations, such as road usage charge
Policy Note. Vanpools in the Puget Sound Region The case for expanding vanpool programs to move the most people for the least cost.
 Policy Note Vanpools in the Puget Sound Region The case for expanding vanpool programs to move the most people for the least cost Recommendations 1. Saturate vanpool market before expanding other intercity
Washington State Road Usage Charge Assessment
 Washington State Road Usage Charge Assessment Jeff Doyle Director of Public/Private Partnerships; and State Project Director Road User Charge Assessment August 15, 2013 Tallahassee, Florida Similarities
Future Funding The sustainability of current transport revenue tools model and report November 2014
 Future Funding The sustainability of current transport revenue tools model and report November 214 Ensuring our transport system helps New Zealand thrive Future Funding: The sustainability of current transport
NEW HAVEN HARTFORD SPRINGFIELD RAIL PROGRAM
 NEW HAVEN HARTFORD SPRINGFIELD RAIL PROGRAM Hartford Rail Alternatives Analysis www.nhhsrail.com What Is This Study About? The Connecticut Department of Transportation (CTDOT) conducted an Alternatives
CITY OF LONDON STRATEGIC MULTI-YEAR BUDGET ADDITIONAL INVESTMENTS BUSINESS CASE # 6
 2016 2019 CITY OF LONDON STRATEGIC MULTI-YEAR BUDGET ADDITIONAL INVESTMENTS BUSINESS CASE # 6 STRATEGIC AREA OF FOCUS: SUB-PRIORITY: STRATEGY: INITIATIVE: INITIATIVE LEAD(S): BUILDING A SUSTAINABLE CITY
All Electronic Tolling (AET): Frequently Asked Questions
: Frequently Asked Questions") Charles D. Baker, Governor Karyn E. Polito, Lieutenant. Governor Stephanie Pollack, MassDOT Secretary & CEO 8/22/2016 All Electronic Tolling (AET): Frequently Asked Questions In 2012, MassDOT made the
Charles D. Baker, Governor Karyn E. Polito, Lieutenant. Governor Stephanie Pollack, MassDOT Secretary & CEO 8/22/2016 All Electronic Tolling (AET): Frequently Asked Questions In 2012, MassDOT made the
The Future is Bright! So how do we get there? Council of State Governments West Annual Meeting August 18, 2017
 The Future is Bright! So how do we get there? Council of State Governments West Annual Meeting August 18, 2017 1 The Intersection of Technology Transportation options that were once a fantasy are now reality:
IMPROVING CITIES THROUGH PUBLIC-PRIVATE PARTNERSHIPS. Toronto Forum For Global Cities December 2008
 IMPROVING CITIES THROUGH PUBLIC-PRIVATE PARTNERSHIPS Toronto Forum For Global Cities December 2008 TORONTO S CHALLENGE GTA suffers from traffic congestion The average Torontonian spends seven hours a week
Disruptive Technology and Mobility Change
 Disruptive Technology and Mobility Change What it Might Mean for Urban Transportation Ed Regan Senior Vice President June 1, 2018 Presented at Transport Chicago Ed Regan, SVP, CDM Smith 43-year veteran
When Grids Get Smart - ABB s Vision for the Power System of the Future
 When Grids Get Smart - ABB s Vision for the Power System of the Future When Grids Get Smart ABB s Vision for the Power System of the Future There is a convergence occurring between the business realities
SEPULVEDA PASS CORRIDOR
 SEPULVEDA PASS CORRIDOR PUBLIC PRIVATE PARTNERSHIP DELIVERY PRE-DEVELOPMENT AGREEMENT PDA Sepulveda Pass Mobility Issues Most congested highway segment in the U.S. 295,000 vehicles per day (2010) 430,000
The Case for. Business. investment. in Public Transportation
 The Case for Business investment in Public Transportation Introduction Public transportation is an enterprise with expenditure of $55 billion in the United States. There has been a steady growth trend
Aging of the light vehicle fleet May 2011
 Aging of the light vehicle fleet May 211 1 The Scope At an average age of 12.7 years in 21, New Zealand has one of the oldest light vehicle fleets in the developed world. This report looks at some of the
Traffic and Toll Revenue Estimates
 The results of WSA s assessment of traffic and toll revenue characteristics of the proposed LBJ (MLs) are presented in this chapter. As discussed in Chapter 1, Alternatives 2 and 6 were selected as the
Electric Vehicles and State Funds
 Electric s and State Funds Current Contributions in Massachusetts and Long-Term Solutions to Transportation Funding March 2018 Overview Electric vehicles are a practical, commercially available option
4 COSTS AND OPERATIONS
 4 COSTS AND OPERATIONS 4.1 INTRODUCTION This chapter summarizes the estimated capital and operations and maintenance (O&M) costs for the Modal and High-Speed Train (HST) Alternatives evaluated in this
Road Tolls and Road Pricing Innovative Methods to Charge for the Use of Road Systems
 Road Tolls and Road Pricing Innovative Methods to Charge for the Use of Road Systems by Daphnée Benayoun & René P. Cousin The Louis Berger Group, Inc. Introduction Major challenges facing now the road
STRATEGIC PRIORITIES AND POLICY COMMITTEE MAY 5, 2016
 STRATEGIC PRIORITIES AND POLICY COMMITTEE MAY 5, 2016 Shift Rapid Transit Initiative Largest infrastructure project in the city s history. Rapid Transit initiative will transform London s public transit
Regulatory Treatment Of Recoating Costs
 Regulatory Treatment Of Recoating Costs Prepared for the INGAA Foundation, Inc., by: Brown, Williams, Scarbrough & Quinn, Inc. 815 Connecticut Ave., N.W. Suite 750 Washington, DC 20006 F-9302 Copyright
The Renewable Energy Market Investment Opportunities In Lithium. Prepared by: MAC Energy Research
 The Renewable Energy Market Investment Opportunities In Lithium Prepared by: MAC Energy Research 2016 Table of Contents: Introduction. Page 2 What is Lithium?... Page 2 Global Lithium Demand Page 3 Energy
May 23, 2011 APTA Bus & Paratransit Conference. Metro ExpressLanes
 May 23, 2011 APTA Bus & Paratransit Conference Metro ExpressLanes Program Overview > Conversion of HOV lanes to HOT lanes on I-10 and I-110 > Multi-modal Integrated Corridor Emphasis > 1 of 6 Nationwide
National and Regional Electronic Toll Interoperability
 National and Regional Electronic Toll Interoperability Presented to The Oklahoma Traffic Engineering Association October 23,2014 By: David Machamer Toll Operations Director Oklahoma Turnpike Authority
The Status of Transportation Funding, Road Charge and Vehicle Miles Traveled in California
 The Status of Transportation Funding, Road Charge and Vehicle Miles Traveled in California Long-Term Policy Options for Sustainable Transportation Options NCSL State Transportation Leaders Symposium October
GAS TAX GETTING OUT OF GAS? WASHINGTON STATE ROAD USAGE CHARGE Pilot Project. Paul Parker Deputy Director Washington State Transportation Commission
 GAS TAX GETTING OUT OF GAS? WASHINGTON STATE ROAD USAGE CHARGE Pilot Project Paul Parker Deputy Director Washington State Transportation Commission Problem Future funding gap TODAY S PRESENTATION Potential
what you need to know FREEWAY IMPROVEMENT PROJECT (GFIP)
") what you need to know Road users are already experiencing the benefits of the upgraded Gauteng freeway network through reduced travel time, which means more time to engage in business and doing things
what you need to know Road users are already experiencing the benefits of the upgraded Gauteng freeway network through reduced travel time, which means more time to engage in business and doing things
Independence Institute Denver West Parkway, Suite 185 Golden, Colorado i2i.org/cad.aspx BRT = BTR
 Independence Institute 14142 Denver West Parkway, Suite 185 Golden, Colorado 80401 303-279-6536 i2i.org/cad.aspx BRT = BTR Bus-Rapid Transit Is Better Than Rail: The Smart Alternative to Light Rail Joseph
RIETI BBL Seminar Handout
 Research Institute of Economy, Trade and Industry (RIETI) RIETI BBL Seminar Handout Autonomous Vehicles, Infrastructure Policy, and Economic Growth September 25, 2018 Speaker: Clifford Winston https://www.rieti.go.jp/jp/index.html
All Electronic Tolling August 22, Media Overview
 All Electronic Tolling August 22, 2016 Media Overview Why is MassDOT implementing All-Electronic Tolling? MassDOT decided in 2012 to replace tolls on the Massachusetts Turnpike, Tobin Bridge and airport
USDOT CMAQ Program. Southeast Diesel Collaborative Annual Conference September, 2017
 USDOT CMAQ Program Southeast Diesel Collaborative Annual Conference September, 2017 1 CMAQ & Title 23: What and Why? Section 149: The CMAQ program is established for transportation projects that contribute
Stakeholders Advisory Working Groups (SAWGs) Traffic and Transit SAWG Meeting #7
 Traffic and Transit SAWG Meeting #7") Presentation Tappan Zee Bridge/I-287 Corridor Environmental Review December 4, 2008 Slide 1 Title Slide Slide 2 This presentation discusses the contents of the Transit Mode Selection Report. Slide 3 The
Presentation Tappan Zee Bridge/I-287 Corridor Environmental Review December 4, 2008 Slide 1 Title Slide Slide 2 This presentation discusses the contents of the Transit Mode Selection Report. Slide 3 The
The Preferred Alternative: a Vision for Growth on the Northeast Corridor
 A Long-Term Vision is Needed The Preferred Alternative: a Vision for Growth on the Northeast Corridor The Federal Railroad Administration (FRA) has released the Tier 1 Final Environmental Impact Statement
I-820 (East) Project Description. Fort Worth District. Reconstruct Southern I-820/SH 121 Interchange
 Project Description. Fort Worth District. Reconstruct Southern I-820/SH 121 Interchange") I-820 (East) Project Description Fort Worth District Reconstruct Southern I-820/SH 121 Interchange I-820 from approximately 2,000 feet north of Pipeline Road/Glenview Drive to approximately 3,200 feet
I-820 (East) Project Description Fort Worth District Reconstruct Southern I-820/SH 121 Interchange I-820 from approximately 2,000 feet north of Pipeline Road/Glenview Drive to approximately 3,200 feet
Options for Scenario Five Mileage Fee (DMV Collection)
") Options for Scenario Five Mileage Fee (DMV Collection) Mileage data is uploaded to Department of Motor Vehicles locations for fee calculation and payment as a condition of registering passenger vehicles.
Options for Scenario Five Mileage Fee (DMV Collection) Mileage data is uploaded to Department of Motor Vehicles locations for fee calculation and payment as a condition of registering passenger vehicles.
REPORT CARD FOR CALIFORNIA S INFRASTRUCTURE WHAT YOU SHOULD KNOW ABOUT CALIFORNIA S TRANSIT FACILITIES
 TRANSIT GRADE: C- WHAT YOU SHOULD KNOW ABOUT TRANSIT FACILITIES California needs robust, flexible and reliable transit systems to reduce peak congestion on our highways, provide options for citizens who
Update on Community or Heritage Rail Project (Project Manager Services) The Engineering Department recommends that Council:
 The Engineering Department recommends that Council:") Corporate NO: R279 Report COUNCIL DATE: DECEMBER 18, 2006 REGULAR COUNCIL TO: Mayor & Council DATE: December 15, 2006 FROM: General Manager, Engineering FILE: 8710-20 (Heritage) SUBJECT: Update on Community
Corporate NO: R279 Report COUNCIL DATE: DECEMBER 18, 2006 REGULAR COUNCIL TO: Mayor & Council DATE: December 15, 2006 FROM: General Manager, Engineering FILE: 8710-20 (Heritage) SUBJECT: Update on Community
Passenger Rail Solar Electrification: A Primer. Oregon Department of Transportation Rail Division. June 2009
 Passenger Rail Solar Electrification: A Primer Oregon Department of Transportation Rail Division June 2009 Betsy Imholt ODOT Rail Division 503.986.4077 phone betsy.imholt@odot.state.or.us Executive Summary
PREFACE 2015 CALSTART
 PREFACE This report was researched and produced by CALSTART, which is solely responsible for its content. The report was prepared by CALSTART technical staff including Ted Bloch-Rubin, Jean-Baptiste Gallo,
FREQUENTLY ASKED QUESTIONS
 FREQUENTLY ASKED QUESTIONS 2018 What is the More MARTA Atlanta program? The More MARTA Atlanta program is a collaborative partnership between MARTA and the City of Atlanta to develop and implement a program
DAILY TRAVEL AND CO 2 EMISSIONS FROM PASSENGER TRANSPORT: A COMPARISON OF GERMANY AND THE UNITED STATES
 DAILY TRAVEL AND CO 2 EMISSIONS FROM PASSENGER TRANSPORT: A COMPARISON OF GERMANY AND THE UNITED STATES Ralph Buehler, Associate Professor, Virginia Tech, Alexandria, VA Supported by American Institute
WASHINGTON STATE ROAD USAGE CHARGE ASSESSMENT. Reema Griffith Executive Director Washington State Transportation Commission
 WASHINGTON STATE ROAD USAGE CHARGE ASSESSMENT Reema Griffith Executive Director Washington State Transportation Commission THE PROBLEM STATEMENT 2 IMPROVING VEHICLE MPG THREATENS OUR GAS TAX REVENUES Conservative
Electric Vehicle Cost-Benefit Analyses
 Electric Vehicle Cost-Benefit Analyses Results of plug-in electric vehicle modeling in eight US states Quick Take M.J. Bradley & Associates (MJB&A) evaluated the costs and States Evaluated benefits of
Broward County Intermodal Center And People Mover. AASHTO Value Engineering Conference Presentation. September 1, 2009 San Diego, CA
 Project Development & Environment Study Broward County Intermodal Center And People Mover AASHTO Value Engineering Conference Presentation September 1, 2009 San Diego, CA Background P D & E Study Regional
Miami Dade's move to all-electronic cashless tolling Posted Wed, :27
 Miami Dade's move to all-electronic cashless tolling Posted Wed, 2008-07-23 19:27 Miami Dade Expressway Authority (MDX) is expected to begin formal procurement in early September of the toll systems needed
Montgomery Township Community Energy Aggregation
 Montgomery Township Community Energy Aggregation MCEA Round 2 Program Announcement! The Township of Montgomery is excited to announce another Montgomery Community Energy Aggregation program (MCEA Round
Reducing Congestion and Funding Transportation Using Road Pricing
 Reducing Congestion and Funding Transportation Using Road Pricing April 2010 US Road Pricing Context 1.! Traffic congestion in major urban areas is a significant and growing problem 2.! Lack of sustainable
US 81 Bypass of Chickasha Environmental Assessment Public Meeting
 US 81 Bypass of Chickasha Environmental Assessment Public Meeting March 14, 2013 Introductions ODOT FHWA SAIC Meeting Purpose Present need for bypass Provide responses to 10/04/11 public meeting comments
Electric Vehicle Cost-Benefit Analyses
 Electric Vehicle Cost-Benefit Analyses Results of plug-in electric vehicle modeling in five Northeast & Mid-Atlantic states Quick Take With growing interest in the electrification of transportation in
Sales and Use Transportation Tax Implementation Plan
 Sales and Use Transportation Tax Implementation Plan Transportation is more than just a way of getting from here to there. Reliable, safe transportation is necessary for commerce, economic development,
Open House. Highway212. Meetings. Corridor Access Management, Safety & Phasing Plan. 5:30 to 6:30 p.m. - Southwest Corridor Transportation Coalition
 Welcome Meetings 5:30 to 6:30 p.m. - Southwest Corridor Transportation Coalition 6:30 to 8:00 p.m. - Open House Why is Highway 212 Project Important? Important Arterial Route Local Support Highway 212
AGENDA INTERCITY TRANSIT AUTHORITY WORK SESSION January 20, :30 P.M. 1) APPROVAL OF AGENDA 1 min.
 APPROVAL OF AGENDA 1 min.") AGENDA INTERCITY TRANSIT AUTHORITY WORK SESSION January 20, 2016 5:30 P.M. CALL TO ORDER 1) APPROVAL OF AGENDA 1 min. 2) INTRODUCTIONS 5 min. A. Welcome City of Yelm Councilmember Molly Carmody B. Welcome
AGENDA INTERCITY TRANSIT AUTHORITY WORK SESSION January 20, 2016 5:30 P.M. CALL TO ORDER 1) APPROVAL OF AGENDA 1 min. 2) INTRODUCTIONS 5 min. A. Welcome City of Yelm Councilmember Molly Carmody B. Welcome
Innovative, Sustainable Funding Options for State DOTs
 Innovative, Sustainable Funding Options for State DOTs Issues for policy and practice October 29, 2012 Eric Sundquist/Mary Ebeling Today s Panelists Paul Morris Deputy Secretary for Transit North Carolina
RTID Travel Demand Modeling: Assumptions and Method of Analysis
 RTID Travel Demand Modeling: Assumptions and Method of Analysis Overall Model and Scenario Assumptions The Puget Sound Regional Council s (PSRC) regional travel demand model was used to forecast travel
The USDOT Congestion Pricing Program: A New Era for Congestion Management
 The USDOT Congestion Pricing Program: A New Era for Congestion Management Patrick DeCorla-Souza, AICP Federal Highway Administration Presentation at Congestion Pricing Discovery Workshop Los Angeles, CA
Chapter 740, Street Vending One Year Review
 STAFF REPORT ACTION REQUIRED Chapter 740, Street Vending One Year Review Date: April 7, 2015 To: From: Wards: Reference Number: Licensing and Standards Committee Executive Director, Municipal Licensing
MINUTES MATTER. Travel Time and Frequency of Train Service to Grand Central Terminal the Metro-North Railroad System Executive Summary
 MINUTES MATTER Travel Time and Frequency of Train Service to Grand Central Terminal the Metro-North Railroad System 1976-2017 Executive Summary The Business Council of Fairfield County One Landmark Square,
Transportation 2040: Plan Performance. Transportation Policy Board September 14, 2017
 Transportation 2040: Plan Performance Transportation Policy Board September 14, 2017 Today Background Plan Performance Today s Meeting Background Board and Committee Direction 2016-2017 Transportation
! " # $ % # & " ' % ( ' ) "
") "#!! $% ! " # $ % # " ' % ( ' ) ",-..*-/--0"-00"0**0 2 In agreement with the Terms of Reference, we have conducted an analysis of the road user charges (RUC) paid by the users of the road networks in the
"#!! $% ! " # $ % # " ' % ( ' ) ",-..*-/--0"-00"0**0 2 In agreement with the Terms of Reference, we have conducted an analysis of the road user charges (RUC) paid by the users of the road networks in the
Electric Vehicle Charging Station Installation and Eco-Pass Updates. Report Prepared by: A. Rolston, Parking Operations Coordinator
 Report to Council Date: File: 1862-01 To: From: Subject: City Manager D. Duncan, Manager, Parking Services Electric Vehicle Charging Station Installation and Eco-Pass Updates Report Prepared by: A. Rolston,
SMART Program: Ensuring Expanded Access for Low-Income Ratepayers and Communities Updated May 11, 2017
 SMART Program: Ensuring Expanded Access for Low-Income Ratepayers and Communities Updated May 11, 2017 Overview: Massachusetts proposed SMART 1 program has the potential to significantly expand the benefits
The Value of Travel-Time: Estimates of the Hourly Value of Time for Vehicles in Oregon 2007
 The Value of Travel-Time: Estimates of the Hourly Value of Time for Vehicles in Oregon 2007 Oregon Department of Transportation Long Range Planning Unit June 2008 For questions contact: Denise Whitney
FURTHER TECHNICAL AND OPERATIONAL MEASURES FOR ENHANCING ENERGY EFFICIENCY OF INTERNATIONAL SHIPPING
 E MARINE ENVIRONMENT PROTECTION COMMITTEE 67th session Agenda item 5 MEPC 67/5 1 August 2014 Original: ENGLISH FURTHER TECHNICAL AND OPERATIONAL MEASURES FOR ENHANCING ENERGY EFFICIENCY OF INTERNATIONAL
Planning Distributed Generation for Transmission Savings 1 By Kenneth Sahm White and Stephanie Wang 2 March 19, 2014
 Planning Distributed Generation for Transmission Savings 1 By Kenneth Sahm White and Stephanie Wang 2 March 19, 2014 The Clean Coalition recommends that state regulators and utilities account for potential
Submission to Select Committee on Electric Vehicles - inquiry into the use and manufacture of electric vehicles in Australia
 31 July 2018 Senator Tim Storer Department of the Senate PO Box 6100 Parliament House Canberra ACT 2600 Dear Senator Storer, RE: Submission to Select Committee on Electric Vehicles - inquiry into the use
Thank you, Chairman Taylor, Chairman Keller, Representative Quinn and members of
 Testimony of Andrew Daga President and CEO, Momentum Dynamics Corporation Pennsylvania House of Representatives Committee on Transportation November 13, 2017 Thank you, Chairman Taylor, Chairman Keller,
State Zero-Emission Vehicle Programs Memorandum of Understanding
 State Zero-Emission Vehicle Programs Memorandum of Understanding WHEREAS, the Signatory States have adopted regulations requiring increasing sales of zeroemission vehicles (ZEVs), or are considering doing
2010 Symposium on Mileage-Based User Fees: Moving Forward MOVING TO A VMT-FEE SYSTEM: TRANSITION CONSIDERATIONS. U n i v ersi ty o f Minnesota
 2010 Symposium on Mileage-Based User Fees: Moving Forward MOVING TO A VMT-FEE SYSTEM: TRANSITION CONSIDERATIONS F errol O. Robinson, R esearch F ellow Humphrey Institute o f Public Affairs U n i v ersi
TRAFFIC DEPARTMENT 404 EAST WASHINGTON BROWNSVILLE, TEXAS City of Brownsville Speed Hump Installation Policy
 A. GENERAL Speed humps are an effective and appropriate device for safely reducing vehicle speeds on certain types of streets when installed accordance with the provisions of this policy. In order for
Senate Standing Committees on Economics 27 June 2014 PO Box 6100 Parliament House CANBERRA ACT 2600 By
 Senate Standing Committees on Economics 27 June 2014 PO Box 6100 Parliament House CANBERRA ACT 2600 By email: economics.sen@aph.gov.au Submission: Inquiry into Fuel Indexation (Road Funding) Bill 2014
BENEFITS OF RECENT IMPROVEMENTS IN VEHICLE FUEL ECONOMY
 UMTRI-2014-28 OCTOBER 2014 BENEFITS OF RECENT IMPROVEMENTS IN VEHICLE FUEL ECONOMY MICHAEL SIVAK BRANDON SCHOETTLE BENEFITS OF RECENT IMPROVEMENTS IN VEHICLE FUEL ECONOMY Michael Sivak Brandon Schoettle
Transportation Challenges
 Transportation Challenges Parker Williams SVP Business Development Xerox Government and Transportation Sector ITE Mid-Colonial and MASITE Joint Annual Meeting May 20, 2014 Hershey, PA 2013 Xerox Corporation.
Town of Londonderry, New Hampshire NH Route 28 Western Segment Traffic Impact Fee Methodology
 Town of Londonderry, New Hampshire NH Route 28 Western Segment Traffic Impact Fee Methodology Prepared by the Londonderry Community Development Department Planning & Economic Development Division Based
Air. Goals: Improve statewide air quality Reduce greenhouse gas emissions 9 DRAFT DRAFT
 Air Goals: Improve statewide air quality Reduce greenhouse gas emissions MassClean Diesel, Revere MassClean Diesel installed retrofits on more than 2,000 dieselpowered school buses, at no expense to bus
Working through the electric motor replacement maze
 Working through the electric motor replacement maze Taking a total cost of ownership approach to motor replacement can save big dollars -- and help save the planet The Department of Commerce currently
House Committee on Transportation Policy Public Hearing HB April 5, 2017
 REPRESENTATIVE RICH VIAL OREGON HOUSE OF REPRESENTATIVES HOUSE DISTRICT 26 House Committee on Transportation Policy Public Hearing HB 3231 April 5, 2017 Background House District 26 Wilsonville Sherwood
Appendix C. Parking Strategies
 Appendix C. Parking Strategies Bremerton Parking Study Introduction & Project Scope Community concerns regarding parking impacts in Downtown Bremerton and the surrounding residential areas have existed
STH 60 Northern Reliever Route Feasibility Study Report
 #233087 v3 STH 60 Northern Reliever Route Feasibility Study Report Washington County Public Works Committee Meeting September 28, 2016 1 STH 60 Northern Reliever Route Feasibility Study Hartford Area Development
Net Metering in Missouri
 Net Metering in Missouri Make A Good Policy Great (AGAIN) Executive Summary More and more Americans every year are able to produce their own electricity. As the cost of solar continues to plummet, homeowners
Submission to the Transport and Public Works Committee s inquiry into the operations of toll roads in Queensland
 9 August 2018 Mr Shane King MP Chair Transport and Public Works Committee Parliament House BRISBANE QLD 4000 Via email: tollroads@parliament.qld.gov.au Dear Mr King, RE: Submission to the Transport and
AAA ON THE ISSUES
 AAA ON THE ISSUES 2 0 1 7 TABLE OF CONTENTS Introduction Safety on Our Roadways Occupant Protection Child Passenger Safety Senior Mobility Teen Driving Motorcycle Helmets Recreational Marijuana Transportation
Parking Management Element
 Parking Management Element The State Transportation Planning Rule, adopted in 1991, requires that the Metropolitan Planning Organization (MPO) area implement, through its member jurisdictions, a parking
Department of Legislative Services
 Department of Legislative Services Maryland General Assembly 2005 Session SB 740 Senate Bill 740 Budget and Taxation FISCAL AND POLICY NOTE Revised (Senator Middleton, et al.) Environmental Matters Renewable
The fact that SkyToll is able to deliver quality results has been proven by its successful projects.
 www.skytoll.com At present, an efficient and well-functioning transport sector and the quality of transport infrastructure itself are a prerequisite for the further growth of the economy and ensure the
Steve Rubin, Managing Director, Finance and Support Services. It is requested that the Board or Harbor Commissioners approve the following actions:
 Memorandum Date: To: From: Subject: Board of Harbor Commissioners Steve Rubin, Managing Director, Finance and Support Services Requested Action It is requested that the Board or Harbor Commissioners approve
Agreement with Enbridge for the Installation of Compressed Natural Gas Refuelling Stations at City Facilities
 PW9.3 STAFF REPORT ACTION REQUIRED Agreement with Enbridge for the Installation of Compressed Natural Gas Refuelling Stations at City Facilities Date: October 20, 2015 To: From: Wards: Reference Number:
Annual KRTA Report for the Year 2016
 Annual KRTA Report for the Year 2016 Tracy Golden, CPE, CPA Chief Financial Officer Board Meeting August 21, 2017 Key Ratio Trend Analysis Provided by CFC each year Numbers come from annual CFC Form 7
Single Occupancy HOV Lane
 This does not constitute tax advice. All persons considering use of available incentives should consult with their own tax professional to determine eligibility, specific amount of benefit available, if
Merger of the generator interconnection processes of Valley Electric and the ISO;
 California Independent System Operator Corporation Memorandum To: ISO Board of Governors From: Karen Edson Vice President, Policy & Client Services Date: August 18, 2011 Re: Decision on Valley Electric
Written Exam Public Transport + Answers
 Faculty of Engineering Technology Written Exam Public Transport + Written Exam Public Transport (195421200-1A) Teacher van Zuilekom Course code 195421200 Date and time 7-11-2011, 8:45-12:15 Location OH116
Fueling Savings: Higher Fuel Economy Standards Result In Big Savings for Consumers
 Fueling Savings: Higher Fuel Economy Standards Result In Big Savings for Consumers Prepared for Consumers Union September 7, 2016 AUTHORS Tyler Comings Avi Allison Frank Ackerman, PhD 485 Massachusetts
6/6/2018. June 7, Item #1 CITIZENS PARTICIPATION
 June 7, 2018 Item #1 CITIZENS PARTICIPATION 1 Item #2 APPROVAL OF MINUTES Item #3 TRAC GOALS, FRAMEWORK & AGENDA REVIEW 2 COMMITTEE GOALS Learn about Southern Nevada s mobility challenges, new developments
Benefit Cost Analysis
 Benefit Cost Analysis The Benefit Cost Analysis (BCA) was performed in accordance with the ARRA guidance provided in the Federal Register. These benefits and costs were quantified in accordance with the
6 Things to Consider when Selecting a Weigh Station Bypass System
 6 Things to Consider when Selecting a Weigh Station Bypass System Moving truck freight from one point to another often comes with delays; including weather, road conditions, accidents, and potential enforcement
Paid Parking at Park & Ride Lots: Framing the Issues. Capital Programs Committee May 2014
 Paid Parking at Park & Ride Lots: Framing the Issues Capital Programs Committee May 2014 Outline Current Status Industry Review DART Case Study Issues Alternatives Mechanics 2 Current Status: All Lots
ASSEMBLY, No STATE OF NEW JERSEY. 218th LEGISLATURE INTRODUCED MARCH 13, 2018
 ASSEMBLY, No. STATE OF NEW JERSEY th LEGISLATURE INTRODUCED MARCH, 0 Sponsored by: Assemblyman DANIEL R. BENSON District (Mercer and Middlesex) Assemblywoman NANCY J. PINKIN District (Middlesex) Assemblywoman
Reforming the TAC and Retail Transmission Rates. Robert Levin California Public Utilities Commission Energy Division August 29, 2017
 Reforming the TAC and Retail Transmission Rates. Robert Levin California Public Utilities Commission Energy Division August 29, 2017 1 CPUC Staff Rate Design Proposals Restructure the High-Voltage TAC