State Avenue Corridor Transit Planning Study Alternatives Analysis
|
|
|
- Audrey Foster
- 6 years ago
- Views:
Transcription


1 State Avenue Corridor Transit Planning Study Alternatives Analysis August 18, 2008 KANSAS CITY AREA TRANSPORTATION AUTHORITY UNIFIED GOVERNMENT OF WYANDOTTE COUNTY/ KANSAS CITY, KANSAS
2 Executive Summary The State Avenue Corridor Transit Planning Study Alternatives Analysis was commissioned by KC ATA and the Unified Government of Wyandotte County to use objective screening criteria and public input to analyze alternative transit modes and service levels against the currently provided transit service. Modes analyzed were: Bus Rapid Transit (BRT) exclusive lanes, BRT mixed lane, Enhanced Bus service, Express Bus, and Light Rail. This report recommends BRT-mixed traffic to be advanced to a project planning phase due to its best meeting screening criteria and other pertinent factors such as required implementation time,. The expected development costs for this alternative is $2 million to $3 million per mile, with a total system capital cost of about $30 million. It is also recommended that a service plan for the Enhanced Bus alternative be developed and implemented as an interim transit service enhancement to the corridor. The State Avenue corridor has seen significant changes in the past few years with the development, of among others, the Sprint Arena and Power and Light district near downtown KCMO, the planned redevelopment of Indian Springs shopping center near I- 635, and in western Wyandotte county, the Village West shopping center along with the planned developments of a Schlitterbahn Waterpark and a casino/convention center. During this time job opportunities have increased throughout the entire corridor, but particularly in the western third which increased from 627 in the year 2000 to a forecasted 7,050 by Population growth has been slow but steady, and corridor population demographics have higher levels of transit-dependent characteristics than Wyandotte County or the Kansas City metropolitan area in general, including low vehicle ownership rates, higher population and job density, and higher poverty levels. Corridor transit service has changed little during the recent development activity, while transportation destinations and needs have changed greatly. Current corridor transit service provided by both the Kansas City Area Transit Agency and the Unified Government is characterized by roughly half hour to one hour weekday frequency with limited evening service. Transit riders can take an hour or more, and multiple buses, to travel from downtown Kansas City Missouri to Village West via transit whereas driving time is under thirty minutes. Transit facilities including bus shelters and park and rides are often undistinguished and lack comfortable pedestrian access. Alternative modes were studied by analyzing current corridor transit service, and corridor population and economic characteristics. Corridor transit service goals and objectives were reached through a combination of public input meetings, stakeholders, and advisory groups. Along with these goals and objectives, alternatives were analyzed against screening criteria that included overall transit efficiency, potential to spur economic development, capital costs, connections with employment, medical and activity centers, and land use compatibility. The alternative BRT-Mixed traffic best measured up against these screening criteria due to its moderate roadway improvements, and little, if any right-of-way acquisition. This alternative would closely resemble KCATA s Main Street MAX BRT route or the developing Troost Avenue MAX route. 1
3 TABLE OF CONTENTS Executive Summary... 1 Background... 5 Description of State Avenue Corridor Study Area... 5 Land Use and Activity Centers... 7 Corridor Segment 1 (Downtown KCMO to I-635)... 7 Corridor Segment 2 (I-635 to I-435)... 7 Corridor Segment 3 ((I-435 to 110 th Street)... 8 Demographic and Socio-economic Characteristics 2000 Census... 9 Population Characteristics... 9 Household Characteristics Demographic and Socio-economic Forecasts Population Forecasts Household Forecasts Low Income Household Forecasts Employment Forecasts Current Transit Service Route #101 Minnesota Route #106 - Quindaro Route #107 Seventh Street/Parallel Route #114 State Avenue Route #116 West Parallel Existing Transit Facilities & Infrastructure Segment 1 transit facilities and infrastructure Segment 2 transit facilities and infrastructure Segment 3 transit facilities and infrastructure Recent and Projected Future Development Corridor Segment 1 (Downtown KCMO to I-635) Corridor Segment 2 (I-635 to I-435) Corridor Segment 3 ((I-435 to 110 th Street) Public Input on Transit Needs Study Team Advisory Committee Public Meetings Project Purpose and Need Purpose of the Project Summary of Transportation Needs Population shows slow but steady population growth Goals and Objectives Transit efficiency and competitiveness Objectives Transit service quality Objectives Land Use Objectives Connectivity Objectives Access Objectives
4 Growth Objectives Cost Objectives Environment Objectives Transit Alternatives Definitions Enhanced Bus Bus Rapid Transit (BRT) - Exclusive lane Bus Rapid Transit (BRT) Mixed Traffic Light Rail Transit (LRT) Express Bus I Initial Screening of Transit Alternatives Evaluation of Range of Potential Transit Alternatives Initial Screening Screening Criteria Summary of Findings Rating Methodology Satisfies Purpose and Goals Statement Transit Efficiency Economic Development Typical Capital Costs (2007 $) Connectivity Land Use Compatibility Comparison of Alternatives Conclusion Recommended Alternative MAPS MAP 1 STUDY AREA... 6 MAP 2A SEGMENT 1 ACTIVITY CENTERS... 7 MAP 2B SEGMENT 2 ACTIVITY CENTERS... 8 MAP 2C SEGMENT 3 ACTIVITY CENTERS... 9 MAP 3 POPULATION DENSITY MAP 4 RACE MAP 5 HOUSEHOLD DENSITY MAP 6 OWNER-OCCUPIED HOUSING MAP 7 MEDIAN HOUSEHOLD INCOME MAP 8 VEHICLES/HOUSEHOLD MAP 9 EMPLOYMENT DENSITY MAP 10A SEGMENT 1 TRANSIT FACILITIES & INFRASTRUCTURE MAP 10B SEGMENT 2 TRANSIT FACILITIES & INFRASTRUCTURE MAP 10C SEGMENT 3 TRANSIT FACILITIES & INFRASTRUCTURE
5 TABLES TABLE 1 POPULATION AND POPULATION DENSITY TABLE 2 RACIAL CHARACTERISTICS TABLE 3 HOUSEHOLD DENSITY TABLE 4 OWNER OCCUPANCY TABLE 5 HOUSEHOLD INCOME AND POVERTY STATUS TABLE 6 VEHICLES PER HOUSEHOLD TABLE 7 EMPLOYMENT DENSITY TABLE 8 POPULATION FORECAST TABLE 9 HOUSEHOLD FORECAST TABLE 10 LOW INCOME HOUSEHOLD FORECAST TABLE 11 EMPLOYMENT FORECAST TABLE 12 COMPARISON OF ALTERNATIVES SUMMARY FIGURES FIGURE 1 POPULATION FORECAST FIGURE 2 HOUSEHOLD FORECAST FIGURE 3 LOW INCOME HOUSEHOLD FORECAST FIGURE 4 EMPLOYMENT FORECAST FIGURE 5 - #101 MINNESOTA ROUTE FIGURE 6 ROUTE 101 BOARDINGS/DE-BOARDINGS FIGURE 7 - #106 QUINDARO ROUTE FIGURE 8 ROUTE 106 BOARDINGS/DE-BOARDINGS FIGURE 9 - #107 SEVENTH STREET/PARALLEL ROUTE FIGURE 10 ROUTE 107 BOARDINGS/DE-BOARDINGS FIGURE 11 - #114 STATE AVENUE ROUTE FIGURE 12 ROUTE 114 BOARDINGS/DE-BOARDINGS FIGURE 13 - #116 WEST PARALLEL ROUTE FIGURE TH & MAIN TRANSIT CENTER FIGURE 15 WOODSWEATHER RD. SHELTERED STOP FIGURE 16 GATEWAY PLAZA SHELTERED STOP FIGURE 17 ANN & 6 TH SHELTERED STOP FIGURE 18 7 TH & STATE SHELTERED STOP FIGURE 19 MINNESOTA & 18 TH SHELTERED STOP FIGURE 20 MINNESOTA & 34 TH SHELTERED STOP FIGURE 21 INDIAN SPRINGS TRANSIT CENTER FIGURE 22 STATE & 57 TH SHELTERED STOP FIGURE 23 VILLAGE WEST SHELTERED STOP # FIGURE 24 VILLAGE WEST SHELTERED STOP # FIGURE 25 THE LEGENDS SHELTERED STOP FIGURE 26 BRT EXCLUSIVE LANE TYPICAL STREET PROFILE FIGURE 27 BRT MIXED TRAFFIC TYPICAL STREET PROFILE FIGURE 28 LIGHT RAIL TYPICAL STREET PROFILE A FIGURE 29 LIGHT RAIL TYPICAL STREET PROFILE B
6 State Avenue Corridor Transit Alternatives Analysis Background The Unified Government of Wyandotte County/Kansas City, Kansas is experiencing a renaissance brought on by a newly established catalyst and an emerging one, separated from downtown Kansas City, Kansas by eleven miles and connected by the State Avenue Corridor. Village West, the newly established and phenomenally successful shopping, dining and entertainment center on the west end of State Avenue is drawing visitors at the rate of 12 million a year, making it the largest tourist destination in Kansas and one of the largest in the Midwest., Downtown Kansas City, Kansas on the east end of the State Avenue corridor has, as noted in its Master Plan document, evolved in an opportunistic fashion. Several new Downtown developments such as the EPA Building and the Federal Courthouse along with the established neighborhoods which surround them are anchoring a community passion for advancing Downtown in the future. The bus service that currently serves this corridor is seemingly a pre-renaissance vestige when barely six years ago Village West was merely acres of undeveloped land and Downtown had more vacant buildings than occupied ones. The current transit experience from Downtown to Village West takes almost an hour, which is a significant obstacle for employees and shoppers alike. Considering the limited hours of current bus service, it is nearly impossible to use the State Avenue route in the evenings. Because of the recent development momentum and the vision of the Mayor and Board of Commissioners, Wyandotte County and Kansas City, Kansas are providing direction for their community s renaissance by undertaking a master planning effort. Throughout multiple community and work team meetings over the past year, improved public transportation has surfaced as a significant community need. The intention of the Unified Government and the Kansas City Area Transportation Authority that this study review different transit alternatives including bus rapid transit (BRT), improved local or express bus services, develop new transit centers and locations for possible park and ride lots can be interpreted as an effort to bridge these two catalysts and ensure that the renaissance permeates the corridor between them. Description of State Avenue Corridor Study Area The location of the State Avenue Corridor within the Kansas City metropolitan area is shown in Map 1. The corridor is centered on State Avenue in Kansas City, Kansas and extends from the Kansas City, Missouri Central Business District (CBD) westward for approximately 13 miles through downtown Kansas City, Kansas to 110th Street. The corridor study area encompasses the Village West retail/entertainment and the Kansas Speedway. Today, five local bus routes traverse the corridor and provide connections to its major activity centers. 5

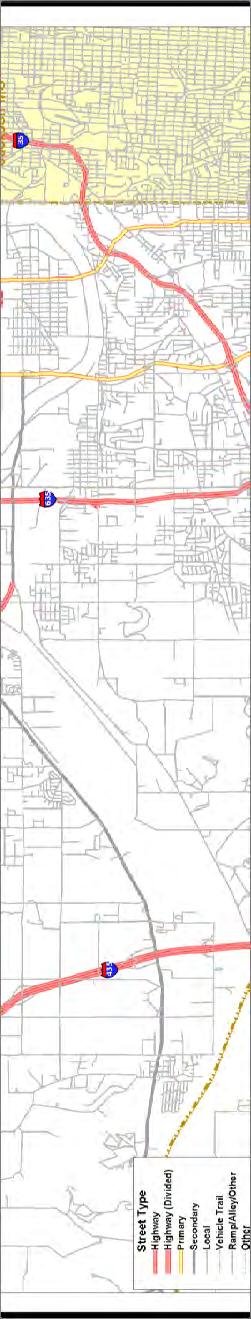
7 MAP 1 STUDY AREA 6
8 Land Use and Activity Centers Corridor Segment 1 (Downtown KCMO to I-635) Segment 1 includes the central business districts of both Kansas City, Missouri and Kansas City, Kansas (see Map 1B). Land uses within the segment are characterized by a mix of high-rise and mid-rise office buildings, restaurants and urban residences in the two CBD s and a mix of commercial and residential uses in the remainder. The Kansas City, Missouri CBD is currently the Metropolitan Area s largest office center; is the Center of City and County government; home to the City s convention center and many of the Metro Area s important existing cultural institutions including the future Performing Arts Center; is the location of a major future retail and entertainment district; and a growing residential community. The Kansas City, Kansas CBD is also a center of City and County government and is home to a number of federal offices. Activity Centers include: Downtown KCMO Downtown KCKS Kansas School for the Visually Impaired Westheight Manor Indian Springs MAP 2A SEGMENT 1 ACTIVITY CENTERS Corridor Segment 2 (I-635 to I-435) Segment 2 includes several retail commercial shopping centers. It is characterized by a mix of suburban style commercial and residential uses (see Map 1C). The campus of The Kansas City, Kansas Community College is also located along this segment. 7
 Segment 3 is encompassed by a rapidly developing retail commercial/entertainment district that")
9 Activity centers include: Providence Medical Center KCK Community College UG Government Annex Salvation Army Wal-mart Plaza Towers Wyandotte Plaza Shopping Center K-Mart Westfield Shopping Center West Branch Library MAP 2B SEGMENT 2 ACTIVITY CENTERS Corridor Segment 3 ((I-435 to 110 th Street) Segment 3 is encompassed by a rapidly developing retail commercial/entertainment district that includes The Kansas Speedway, The Legends shopping center, Comerica Park (a minor league baseball facility), several large box and specialty retailers, hotels and restaurants. The district is also the site of significant planned developments that include a large water park/resort, additional commercial retail and a casino/convention center. Activity centers include: Village West The Legends Kansas Speedway Community America Park 8

10 MAP 2C SEGMENT 3 ACTIVITY CENTERS Demographic and Socio-economic Characteristics 2000 Census Population Characteristics The population characteristics of the State Avenue corridor are shown in Tables 1 and 2, and in Maps 2 and 3. Population/Population Density In general, the overall population density of the corridor is higher than that of Wyandotte County and of the Kansas City MSA. However, population density varies significantly between the three corridor segments. Segment 1 exhibits density characteristics that reflect its urban nature. Segment 2 is more reflective of the typical inner-ring suburban environment and segment 3 reflects neo-suburban density characteristics. 9

11 TABLE 1 POPULATION AND POPULATION DENSITY Corridor Section Area (Acres) Population 2000 Number Pop./Acre 1 4,570 24, ,037 19, ,174 1, Corridor Total 16,781 45, Wyandotte County 96, , Kansas City MSA 2,419,200 1,776, Source: US Census, 2000 and MARC MAP 3 POPULATION DENSITY Race Corridor segments 1 and 2 reflect a racially diverse population with non-caucasian population percentages of at least fifty-percent. These percentages exceed that of Wyandotte County as a whole as well as of the entire MSA. Corridor segment 3, on the other hand, reflects a non-caucasian population of only eleven-percent. This is lower than that of Wyandotte County as a whole and the entire MSA. 10

12 TABLE 2 RACIAL CHARACTERISTICS Corridor Section Total Population Caucasian Non-Caucasian Number % Number % 1 24,536 10, % 14, % 2 19,496 9, % 9, % 3 1,622 1, % % Corridor Total 45,654 21, % 24, % Wyandotte County 157,882 91, % 66, % Kansas City MSA 1,776,062 1,434, % 341, % Source: US Census, 2000 MAP 4 RACE Household Characteristics The household characteristics of the State Avenue corridor are shown in Tables 3, 4, 5 and 6, and in Maps 4, 5, 6 and 7. Household Density Household densities in the corridor are consistent with population densities. Densities in segment 1 are consistent with that segment s urban nature. Densities in segment 2 are reflective of the segment s inner-ring suburban nature, and densities in segment 3 reflect more neo-suburban/rural development characteristics. 11

13 TABLE 3 HOUSEHOLD DENSITY Corridor Section Area (Acres) Households Household Density 1 4,570 9, ,037 7, , Corridor Total 16,781 18, Wyandotte County 96,890 59, Kansas City MSA 2,419, , Source: US Census, 2000 MAP 5 HOUSEHOLD DENSITY Owner-Occupied Housing Only about fifty-percent of the homes in the corridor are occupied by the homeowner(s). This is significantly lower than the owner-occupancy percentages in both Wyandotte County as a whole and the metropolitan region. Segment 1 exhibits an even lower owner- occupancy percentage with less than forty-four-percent of homes occupied by the homeowner. At fifty-seven-percent, owner-occupancy in segment 2 is higher, but still below the County and metro area levels. Owner occupancy in segment 3 is much higher than that in the other two segments, Wyandotte County and the metro area, however, the number of households in segment three is only a fraction of those in segments one and two. 12

14 TABLE 4 OWNER OCCUPANCY Corridor Section Households Owner-occupied Households Owner Occupancy 1 9,831 4, % 2 7,683 4, % % Corridor Total 18,006 9, % Wyandotte County 59,700 37, % Kansas City MSA 694, , % Source: US Census, 2000 MAP 6 OWNER-OCCUPIED HOUSING Household Income and Poverty Status Median Household income can be used as an indicator of the level of transit dependency. Median household income in the State Avenue corridor study area is comparable to that of Wyandotte County as a whole, but, is significantly lower than that of the region as a whole. An examination of the corridor segments reveals that segment 1, with the highest number of households, has a median household income below the County s and well below the regions, while segments 2 and 3 both have median household incomes higher than the County s and segment 3 has a household median income higher than the region s. 13

15 Likewise, the percentage of households in the corridor that are below the poverty level is comparable to that of Wyandotte County, but higher than the region as a whole. Segment 1 has a much higher percentage of households below the poverty level while segments 2 and 3 are both lower the County s and segment 3 is lower than the region s. TABLE 5 HOUSEHOLD INCOME AND POVERTY STATUS Corridor Section Households Median Household Income Households Below Poverty Level % Below Poverty Level 1 9,831 $ 26,099 2,061 21% 2 7,683 $ 38, % $ 58, % Corridor Total 18,006 $ 32,399 3,018 17% Wyandotte County 59,700 $ 33,784 9,389 16% Kansas City MSA 694,971 $ 46,193 58,234 8% Source: US Census, 2000 MAP 7 MEDIAN HOUSEHOLD INCOME 0-1 Vehicles/Household The number of vehicles per household is another indicator of transit dependence. Persons living in households with fewer than two vehicles are more likely to rely on public transit for their transportation needs than those in households with two or more 14
16 vehicles. In the State Avenue corridor study area the percentage of households with one or no vehicle available to the household is higher than that of the County and the region. An examination of the corridor segments reveals that the number of households in segment 1 with one or no vehicles is significantly higher than Wyandotte County and the region, while the percentage of households in segment 2 with one or no vehicles is comparable to the County and the percentage of households in segment 3 with one or no vehicle is significantly higher than the County and the region. TABLE 6 VEHICLES PER HOUSEHOLD Corridor Section Households Vehicles per Household or more % w/ 0 or1 Vehicle(s)/HH 1 9,831 2,014 4,463 3,354 66% 2 7, ,112 3,739 51% % Corridor Total 18,006 2,859 7,655 7,492 58% Wyandotte County 59,700 6,751 23,041 29,908 50% Kansas City MSA 694,971 50, , ,565 41% Source: US Census, 2000 MAP 8 VEHICLES/HOUSEHOLD 15

17 Employment Characteristics Employment Density Employment density in segment 1 is significantly higher than employment density in Wyandotte County and the region. This reflects the presence of both the Kansas City, Missouri and the Kansas City, Kansas central business districts within the segment boundaries. Employment densities in segments 2 and 3 are comparable to the County and the region. TABLE 7 EMPLOYMENT DENSITY Corridor Section Area (Acres) Employment 2000 Number Employees/Acre 1 4,570 67, ,037 8, , Corridor Total 16,781 77, Wyandotte County 96,890 94, Kansas City MSA 2,419,200 1,166, Source: US Census, 2000 and MARC MAP 9 EMPLOYMENT DENSITY 16
18 Demographic and Socio-economic Forecasts Population Forecasts TABLE 8 POPULATION FORECAST Population Corridor Section Year ,536 26,297 26,611 26, ,496 18,863 18,829 18, ,622 2,720 3,189 3,612 Corridor Total 45,654 47,880 48,629 48,801 Wyandotte County 157, , , ,146 Kansas City MSA 1,776,062 1,905,522 2,083,776 2,248,933 Source: US Census, 2000 and MARC FIGURE 1 POPULATION FORECAST 60,000 50,000 40,000 Population 30,000 20,000 10, Year Segment 1 Segment 2 Segment 3 Corridor Total Source: US Census, 2000 and MARC 17
19 Household Forecasts TABLE 9 HOUSEHOLD FORECAST Corridor Section Households Year ,040 10,172 10,130 10, ,981 7,564 7,748 7, ,019 1,180 Corridor Total 17,579 18,594 18,897 19,069 Wyandotte County 59,698 62,580 64,381 66,082 Kansas City MSA 664, , , ,954 Source: US Census, 2000 and MARC FIGURE 2 HOUSEHOLD FORECAST 25,000 20,000 15,000 10,000 5, Segment 1 Segment 2 Segment 3 Corridor Total Source: US Census, 2000 and MARC 18
20 Low Income Household Forecasts TABLE 10 LOW INCOME HOUSEHOLD FORECAST Low Income Households Corridor Section Year ,270 4,459 4,469 4, ,215 2,470 2,626 2, Corridor Total 6,555 7,034 7,219 7,188 Wyandotte County 21,725 22,499 22,930 22,899 Kansas City MSA 158, , , ,870 Source: US Census, 2000 and MARC FIGURE 3 LOW INCOME HOUSEHOLD FORECAST 8,000 7,000 6,000 5,000 4,000 3,000 2,000 1, Segment 1 Segment 2 Segment 3 Corridor Total Source: US Census, 2000 and MARC 19
21 Employment Forecasts TABLE 11 EMPLOYMENT FORECAST Employment Corridor Section Year ,605 68,259 70,134 71, ,934 10,262 11,127 11, ,050 10,159 10,426 Corridor Total 77,166 85,571 91,420 93,221 Wyandotte County 94, , , ,454 Kansas City MSA 1,166,709 1,426,048 1,659,343 1,773,819 Source: US Census, 2000 and MARC FIGURE 4 EMPLOYMENT FORECAST 100,000 90,000 80,000 70,000 60,000 Employees 50,000 40,000 30,000 20,000 10, Year Segment 1 Segment 2 Segment 3 Corridor Total Source: US Census, 2000 and MARC 20

22 Current Transit Service The State Avenue corridor study area is currently served by the following five bus routes; Route #101 Minnesota Description The Minnesota route operates in the State Avenue corridor study area between Downtown Kansas City, Missouri and the Indian Springs Transit Center, located at the former Indian Springs Shopping Center. The Minnesota route is shown in Figure 5. The route circulates through Downtown Kansas City, Missouri on 10 th and 11 th Streets between Broadway and Main terminating at the KCATA s 10th & Main Transit Center. From Downtown KCMO the route travels west along 12th Street through the West Bottoms Industrial District and across the State line using James Street. The route then circulates through Downtown Kansas City, Kansas and continues westward along Minnesota Avenue to 38th Street. At 38th Street the route continues north to State Avenue and then terminates at the Indian Springs Transit Center. FIGURE 5 - #101 MINNESOTA ROUTE Service Span and Service Frequency The Minnesota route operates Monday through Friday with a 30-minute service frequency between 5:30 a.m. and 6:30 p.m. and 60-minute frequency from 6:30 p.m. to 10:30 p.m. On Saturday, the frequency is 60-minutes between 6:30 a.m. and 6:30 p.m. There is no service on Saturdays after 6:30 p.m. and no service at all on Sundays. Route length, Operating Speed and Travel Time The total length of the route is approximately 8 miles. Weekday travel time between the two route termini varies by direction of travel and time of day. During the a.m. peak period the travel time is 34 minutes in the westbound direction and 35 minutes in the eastbound direction. In the p.m. peak period the travel time is 34 minutes in both directions. Midday travel time is 26 minutes in both directions and evening travel time is 21


23 27 minutes in both directions. Saturday travel time between the two termini is 34 minutes in the westbound direction and 32 minutes in the eastbound direction. Ridership Average weekday ridership on the Minnesota route is approximately 1,000. Average Saturday ridership is approximately 500. The highest number of boardings and deboardings are at the transit centers on either end of the route and in Downtown Kansas City, Kansas where transfers with connecting routes occur. Figure 6 shows the average weekday boardings and de-boardings at each of the stops, with labels at the busiest stops. The ridership data comes from the KCATA automated passenger counting (APC) system. FIGURE 6 ROUTE 101 BOARDINGS/DE-BOARDINGS 22

24 Route #106 - Quindaro Description The Quindaro route operates in the State Avenue corridor study area between Downtown Kansas City, Missouri and the Indian Springs Transit Center, located at the former Indian Springs Shopping Center. The Quindaro route is shown in Figure 7. The route circulates through Downtown Kansas City, Missouri on 10 th and 11 th Streets between Broadway and Main terminating at the KCATA s 10th & Main Transit Center. From Downtown KCMO the route travels west north Broadway circulating through the River Market area before continuing west on Woodsweather Road into the West Bottoms Industrial District and across the State line using James Street. The route then circulates through Downtown Kansas City, Kansas and continues northward along 7 th Street to Quindaro. At Quindaro the route continues west to 27 th Street, north on 27 th Street to Brown, west on Brown to Praun, south on Praun to State Avenue and then west on State Avenue to the route terminus at the Indian Springs Transit Center. FIGURE 7 - #106 QUINDARO ROUTE Service Span and Service Frequency The Quindaro route operates Monday through Friday with a 30-minute service frequency between 4:30 a.m. and 7:00 p.m. and 60-minute frequency from 7:00 p.m. to midnight. On Saturday, the frequency is 60-minutes between 6:00 a.m. and 8:00 p.m. There is no service on Saturdays after 8:00 p.m. and no service at all on Sundays. Route length, Operating Speed and Travel Time The total length of the route is approximately 11.5 miles. Weekday travel time between the two route termini varies by direction of travel and time of day. During the a.m. peak period the travel time is 49 minutes in both directions. In the p.m. peak period the travel 23


25 time is 50 minutes in the westbound direction and 48 minutes in the eastbound direction. Midday travel time is 43 minutes in the westbound direction and 42 minutes in the eastbound direction. Evening travel time is 40 minutes in both directions. Saturday travel time between the two termini is 45 minutes in the westbound direction and 44 minutes in the eastbound direction. Ridership Average weekday ridership on the Quindaro route is approximately 1,050. Average Saturday ridership is approximately 460. The highest number of boardings and deboardings are at the transit centers on either end of the route and in Downtown Kansas City, Kansas where transfers with connecting routes occur. Figure 8 shows the average weekday boardings and de-boardings at each of the stops, with labels at the busiest stops. The ridership data comes from the KCATA automated passenger counting (APC) system. FIGURE 8 ROUTE 106 BOARDINGS/DE-BOARDINGS 24

26 Route #107 Seventh Street/Parallel Description The Seventh Street/Parallel route operates between the Kansas University Medical Center and the Indian Springs Transit center, located at the former Indian Springs Shopping Center. It operates in the State Avenue corridor study area between Downtown Kansas City, Kansas and the Indian Springs Transit Center. The Seventh Street/Parallel route is shown in Figure 9. The route circulates around the KUMC campus and then continues north on 7 th Street to Downtown Kansas City Kansas. From Downtown KCK it continues westward along Washington Boulevard to 10 th Street, north on 10 th Street to Walker, west on Walker to 11 th Street, north on 11 th Street to Wood, west on Wood to 13 th Street, north on 13 th Street to Parallel Parkway, west on Parallel Parkway to 24 th Street south on 24 th Street to Parallel, west on Parallel to 27 th Street, south on 27 th Street to Wood, west on Wood to 38 th Street, south on 38 th Street to State Avenue and then west on State Avenue to the Indian Springs Transit Center FIGURE 9 - #107 SEVENTH STREET/PARALLEL ROUTE 25
27 Service Span and Service Frequency The Seventh Street/Parallel route operates Monday through Friday with a 30-minute peak service frequency and a 60-minute midday service frequency. Beginning at approximately 6:30 p.m. the route operates only between the KUMC campus and Downtown KCK with a 60-minute frequency from 6:30 p.m. to 11:00 p.m. On Saturday, the route operates only between the KUMC campus and Downtown KCK with a 60- minute frequency from 6:00 p.m. to 6:30 p.m. There is no service on Saturdays after 6:30 p.m. and no service at all on Sundays. Route length, Operating Speed and Travel Time The total length of the route is approximately 11.5 miles between the KUMC campus and the Indian Springs Transit Center, and 6 miles between the KUMC campus and Downtown KCK. Weekday travel time between the two route termini varies by direction of travel and time of day. During the a.m. peak period the travel time is 40 minutes in the northbound/westbound direction and 68 minutes in the eastbound/southbound direction. In the p.m. peak period the travel time is 41 minutes in the northbound/westbound direction and 61 minutes in the eastbound/southbound direction. Midday travel time is 40 minutes in the northbound/westbound direction and 61 minutes in the eastbound/southbound direction. Evening travel time is 20 minutes in the northbound/westbound direction and 38 minutes in the eastbound/southbound direction. Saturday travel time between the two termini is 21 minutes in the northbound/westbound direction and 37 minutes in the eastbound/southbound direction. Ridership Average weekday ridership on the Seventh Street/Parallel route is approximately 500. Average Saturday ridership is approximately 130. The highest number of boardings and de-boardings are at the Indian Springs transit center, the KU Medical Center and in Downtown Kansas City, Kansas where transfers with connecting routes occur. Figure 10 shows the average weekday boardings and de-boardings at each of the stops, with labels at the busiest stops. The ridership data comes from the KCATA automated passenger counting (APC) system. 26


28 FIGURE 10 ROUTE 107 BOARDINGS/DE-BOARDINGS Route #114 State Avenue Description The State Avenue route operates in the State Avenue corridor study area between the Indian Springs Transit Center, located at the former Indian Springs Shopping Center, and the Village West retail/entertainment district. The State Avenue route is shown in Figure 11. From the Indian Springs Transit Center the route travels west along State Avenue to the Kansas City, Kansas Community College campus. After circulating through the campus, the route continues west on State Avenue to 82 nd Street, north on 82 nd Street to Parallel, west on Parallel to the Providence Medical Center, south on 90 th Street to State Avenue and west on State Avenue to Village West, where it circulates through the district. 27

29 FIGURE 11 - #114 STATE AVENUE ROUTE Service Span and Service Frequency The State Avenue route operates Monday through Friday with a 30-minute service frequency between 5:30 a.m. and 6:30 p.m. and 40-minute frequency from 6:30 p.m. to 10:30 p.m. On Saturday, the frequency is 40-minutes between 6:00 a.m. and 7:15 p.m. There is no service on Saturdays after 7:15 p.m. and no service at all on Sundays. Route length, Operating Speed and Travel Time The total length of the route is approximately 9 miles. Weekday travel time between the two route termini varies by direction of travel and time of day. During the a.m. peak period the travel time is 49 minutes in both directions. Travel time during the weekday is 30 minutes in the eastbound direction and 25 minutes in the westbound direction. Evening travel time is 30 minutes in the eastbound direction and 35 minutes in the westbound direction. Saturday travel time between the two termini is 30 minutes in the eastbound direction and 35 minutes in the westbound direction. Ridership Average weekday ridership on the Seventh State Avenue route is approximately 500. Average Saturday ridership is approximately 225. The highest number of boardings and de-boardings are at the Indian Springs transit center, Village West and at a shopping center at 65 th & State Avenue. Figure 12 shows the average weekday boardings and de-boardings at each of the stops, with labels at the busiest stops. The ridership data comes from the KCATA automated passenger counting (APC) system. 28


30 FIGURE 12 ROUTE 114 BOARDINGS/DE-BOARDINGS Route #116 West Parallel Description The West Parallel route operates in the State Avenue corridor study area between the Indian Springs Transit Center, located at the former Indian Springs Shopping Center, and the Providence Medical Center. The West Parallel route is shown in Figure 13. From the Indian Springs Transit Center the route travels north along 47 th Street to Parallel Parkway and then west on Parallel Parkway to the Kansas City, Kansas Community College campus. After circulating through the campus, the route continues west on Parallel Parkway to 88 th Street and then south on 88 th Street to Providence Medical Center. 29

31 FIGURE 13 - #116 WEST PARALLEL ROUTE Service Span and Service Frequency The West Parallel route operates Monday through Friday from 6:00 a.m. to 7:00 p.m. with a 60-minute service frequency. There is no weekday evening, Saturday or Sunday service. Route length, Operating Speed and Travel Time The total length of the route is approximately 7 miles. Travel time during the weekday is 26 minutes in the westbound direction and 28 minutes in the eastbound direction. Ridership Average weekday ridership on the West Parallel route is approximately 125. Stop level boarding/de-boarding data was unavailable for this route. Existing Transit Facilities & Infrastructure Existing transit facilities and infrastructure supporting transit services in the corridor study area include transit centers, sheltered stops and non-sheltered stops. There are no fixed-guideway elements (i.e. bus only lanes) and there is no technology infrastructure (i.e. traffic signal priority). Maps 10A, 10B and 10C show the location of the facilities in the corridor. 30
.")
32 Segment 1 transit facilities and infrastructure MAP 10A SEGMENT 1 TRANSIT FACILITIES & INFRASTRUCTURE Transit Centers 10th & Main Transit Center The 10 th & Main Transit Center is owned and operated by the Kansas city, Area Transportation Authority. It is located in the heart of the Kansas City, Missouri central business district (see figure 14). The 10 th and Main Transit Center is the primary hub of the regional transit system and serves as an eastern terminus for both the #101- Minnesota and the #106 Quindaro routes (described above). Linkages between the State Avenue corridor and other parts of the region occur at this location. The facility encompasses an area of approximately 22,500 square feet. It provides sheltered waiting areas for transit patrons in an attractively landscaped environment. The facility can accommodate up to five transit coaches at off-street boarding sites and five at boarding sites on its perimeter. Amenities provided include informational kiosks, lighting, trash receptacles, public art displays, restroom facilities for transit employees and inter-city bus connections. 31

33 FIGURE TH & MAIN TRANSIT CENTER Sheltered Stops There are six sheltered bus stops located in segment 1 of the corridor (see figures 15 20). Following is a description of each. Woodsweather Road This stop is located on the south side of Woodsweather Road in the West Bottoms industrial district. It includes a shelter structure and bench situated on a concrete pad and a trash receptacle. There is an absence of sidewalks in the area, which makes pedestrian access somewhat difficult. 32


34 FIGURE 15 WOODSWEATHER RD. SHELTERED STOP Gateway Plaza This stop is located on the southwest corner of the Gateway Plaza office building. It includes a shelter structure and bench situated on a concrete pad. FIGURE 16 GATEWAY PLAZA SHELTERED STOP 33

35 Ann and 6 th Street This stop is located on Ann Street at the northeast corner of the intersection of Ann and 6 th Street. It includes a shelter structure and bench situated on a concrete pad and a trash receptacle. FIGURE 17 ANN & 6 TH SHELTERED STOP 7 th Street & State This stop is located on west side of 7th Street roughly mid-block between Minnesota Avenue and State Avenue. It includes a shelter structure and bench situated on a concrete pad and a trash receptacle. 34


36 FIGURE 18 7 TH & STATE SHELTERED STOP Minnesota & 18 th Street This stop is located on Minnesota Avenue at the southwest corner of the intersection of Minnesota and 18 th Street. It includes a shelter structure and bench situated on a concrete pad. FIGURE 19 MINNESOTA & 18 TH SHELTERED STOP Minnesota & 34 th Street This stop is located on Minnesota Avenue at the southwest corner of the intersection of Minnesota and 34 th Street. It includes a shelter structure and bench situated on a concrete pad. 35


37 FIGURE 20 MINNESOTA & 34 TH SHELTERED STOP Segment 2 transit facilities and infrastructure MAP 10B SEGMENT 2 TRANSIT FACILITIES & INFRASTRUCTURE Transit Centers Indian Springs Transit Center 36

38 The Indian Springs Transit Center is located adjacent to the former Indian Springs Shopping Center. Accommodations for up to seven transit coaches exist by taking advantage of existing infrastructure associated with the former Mall. Amenities are limited and include only a single bus shelter, trash receptacle and limited route informational signage. There is an absence of lighting and very limited landscaping (see figure 21). FIGURE 21 INDIAN SPRINGS TRANSIT CENTER Sheltered Stops There is one sheltered bus stop located in segment 2 of the corridor (see figure 22). Following is a description of this stop. State & 57 th Street This stop is located on State Avenue at the southwest corner of the intersection of State and 57 th Street. It includes a shelter structure and bench situated on a concrete pad. 37


39 FIGURE 22 STATE & 57 TH SHELTERED STOP Segment 3 transit facilities and infrastructure MAP 10C SEGMENT 3 TRANSIT FACILITIES & INFRASTRUCTURE Transit Centers None 38

40 Sheltered Stops There are three sheltered bus stops located in segment 3 of the corridor (see figures 23 25). Following is a description of each. Village West #1 This stop is located on the northeast side of Village West Parkway between Cabela Drive and France Family Drive. It includes a shelter structure and bench situated on a concrete pad that mimics the architectural theme of the surrounding development. The stop also includes a trash receptacle and an informational kiosk. FIGURE 23 VILLAGE WEST SHELTERED STOP #1 Village West #2 This stop is located on the northeast side of Village West Parkway between France Family Drive and Prairie Crossing. It includes a shelter structure and bench situated on a concrete pad that mimics the architectural theme of the surrounding development. The stop also includes a trash receptacle and an informational kiosk. 39


41 FIGURE 24 VILLAGE WEST SHELTERED STOP #2 The Legends This stop is located on the northeast side of Village West Parkway between Sunflower Lane and Stadium Parkway. It includes a shelter structure and bench situated on a concrete pad that mimics the architectural theme of the surrounding development. The stop also includes a trash receptacle and an informational kiosk. FIGURE 25 THE LEGENDS SHELTERED STOP 40
42 Recent and Projected Future Development Corridor Segment 1 (Downtown KCMO to I-635) Significant development activities include: Sprint Arena Power & Light Entertainment District Bartle Hall Convention Center Ball Room H & R Block Headquarters Corridor Segment 2 (I-635 to I-435) Significant development activities include: Indian Springs Redevelopment (Planned) Lowe s Salvation Army Corridor Segment 3 ((I-435 to 110 th Street) Significant development activities include: Cabela s Great Wolf Lodge Nebraska Furniture Mart The Legends Community America Ballpark Target JC Penney s Schlitterbahn Waterpark Casino/Convention Center (Planned) Public Input on Transit Needs The public involvement process provided an opportunity for stakeholders representing the transit providers, transit users, public officials and the business community to have full and equal access to the planning process. Public input on transit needs was obtained in a number of ways to ensure full opportunity for input into the planning process. Input was obtained through the following activities: 41
43 Study Team The Study Team is comprised of officials from the Unified Government of Wyandotte County, the Kansas City Area Transportation Authority, the Mid-America Regional Council, and the Kansas Department of Transportation. The Study Team provided coordination and guidance in the development of the study. Advisory Committee A series of Advisory Committee Meetings were held to discuss the purpose and opportunities provided by the study and to provide input on transportation needs. A list of the members of the Advisory Committee and meeting summaries are provided in the Appendix. Public Meetings A public meeting was held on October 9 th, 2007 to discuss transit needs in the corridor. The meeting was attended by approximately 90 persons. Transit needs identified included: Greater span of service (night service, weekend service) More frequent service Better regional connectivity of service Faster travel time More direct access to activity centers Better stop and station amenities A list of input provided at the public meeting is included in the Appendix. Project Purpose and Need Working with project stakeholders, project goals and objectives were defined. A purpose and need statement was prepared to establish the need for the study and identify problems to be addressed by transportation improvements considered as part of the study process. The purpose and need statement reflects project goals and objectives. The purpose and need statement will provide the initial background information for developing evaluation measures. 42
44 Purpose of the Project To provide safe and effective transportation alternatives for residents, workers and visitors traveling within the corridor in a way that improves access, supports the environment and promotes economic investment in the community. Summary of Transportation Needs Existing and future baseline conditions and development trends for the State Avenue Corridor were described in previous sections of this report. The analysis included a summary of the character of the corridor in terms of land use density, income and vehicle ownership and major travel destinations. Also described were existing transit service levels. Following is a summary of findings. Population shows slow but steady population growth Employment strong employment growth, in retail and office sectors. Office growth primarily downtown, retail growth primarily in west part of corridor. Village West has emerged as a regional tourism and retail destination. Two strong anchors on each end of the corridor, with the Kansas City, Missouri and Kansas City, Kansas CBDs located at the eastern end of the corridor and Village West and adjacent development located at the west end of the corridor. Density density is highest in eastern portion of the corridor and becomes less dense moving to the west. Low income high concentrations of low income households located in the corridor. Highest concentrations are in the eastern portion of the corridor. Auto ownership correlates with income. There are concentrations of high transit dependent populations in the corridor, with the highest concentrations in the eastern portion. Major destinations In addition to the activities located in Village West and Downtown, other major activity centers which need transit access include the Kansas City, Kansas Community College, Providence Medical Center, as well as other destinations described in the previous sections. Current transit service and accessibility is provided but at a base level. Transit travel times for the length of the corridor are over 60 minutes while auto travel times are less than 30 minutes. Connectivity between activity centers in the corridor often requires a transfer at the Indian Springs Transfer Center. Connectivity to regional system Connections to the regional transit system are made in Downtown Kansas City, Missouri. The travel times for transit trips are typically well over an hour long and a number of destinations outside the State Avenue Corridor, such as 43
45 destination in Johnson County, Platte County, Clay County or suburban Jackson County take well over an hour or cannot be reached at all. Transit stops and transfer centers lack amenities, are uncomfortable and in some cases lack the supportive pedestrian features such as sidewalks that would allow improved access to transit. Goals and Objectives Transit efficiency and competitiveness Reinforce the significance of the corridor as the major spine of the Wyandotte County transit system by providing efficient connections from neighborhoods and to activity centers in the corridor Objectives Significantly improved transit travel times for major trip movements. Improve the area provided transit service Increase the frequency of service Increase the service span of service to include evenings and weekends Improve route information (provide real time information) Transit service quality Provide transit facilities in the corridor that that will attract additional transit users and reinforce the significance of the corridor as the major spine of the Wyandotte County transit system. Objectives Provide convenient stops Accommodate bicycle users Maximize the potential for bus transfer access Provide vehicles which are reliable, comfortable and safe Land Use Support transit service in the corridor with land use policies. Objectives Provide opportunities for transit oriented development. Maximize the potential for walk access Provide service consistent with the community s master plan 44
46 Connectivity Improve connections from the corridor to other regional transit systems. Objectives Provide a system that is well-integrated with other transit systems serving the Kansas City region Provide opportunities for access to the system for persons located outside the corridor by providing park and ride lots or other strategies. Develop transit center facilities that provide safe and convenient locations for connections between various transit and other transportation modes. Access Provide transit service in the corridor that enables all persons regardless of vehicle availability to be able to access services and to participate in the regional economy. Objectives Provide reliable, attractive alternatives to the automobile, including off-peak periods Accommodate persons with disabilities Provide sidewalks for walk access transit users Connect neighborhoods with employment centers, medical facilities and to other services. Growth Provide transit infrastructure in the corridor to support long-term sustainable growth in Wyandotte County. Objectives Promote business and job creation by providing transportation options to major job and activity centers Locate transit service in a way as to enhance the vitality of business districts and activity centers Enhance Wyandotte County s place in the regional economy by connecting major activity centers. Cost Demonstrate responsible stewardship of public funding for transit in the corridor. Objectives Identify a system that includes transit elements that have the potential to be funded with a mix of local, federal and state funding. Develop a system for which the capital and operating costs are reasonable, based on the benefits provided. 45
47 Environment Support a healthy environment within the corridor. Objectives Develop a transit alternative that will improve or maintain air quality and noise standards Minimize the impacts from construction and operations. Transit Alternatives Definitions Enhanced Bus Enhanced bus service would include additional buses during peak periods in order to offer increased service frequency. Enhanced bus service would provide additional frequency of service to existing routes. This alternative creates a new route along state avenue route that essentially combines the two existing routes 101 and route 114 such that a rider would not require a transfer traveling from the CBD to a terminus at Village West. Thus, providing a one-seat ride from downtown CBD s to the western terminus. The Alignment would remain primarily along State Avenue from Indian Springs Transfer center west. From Indian Springs Transit Center East, the alignment could run on either State Avenue or Minnesota depending on congestion conditions that may compromise schedule reliability. A variation of this could be a couplet concept where State Avenue is westbound bus transit and Minnesota would provide for eastbound directional transit. This assumes that the walk access is less that foot to directional stations. This alignment would also remove certain extensive out of direction routing such as the community college. Modal Technology: The mode or vehicle type would remain the current fleet buses of foot length with some modest upgrades to cleanliness and fleet size. As vehicles are retired, replacement vehicles could be purchased that could include low floor, hybrid propulsion, etc. Service Plan - would link the existing stops that are currently serviced by both routes The service of this alternative would include more frequent headways and a longer service span. As such, these operational expansions would likely replace in whole the two routes currently running. Headways of 15 minutes at peak and minutes during off-peak periods would be initially assessed. The peak headways would reflect forecasted demand while the off-peak headways would likely be established as a determinate policy. 46
5. OPPORTUNITIES AND NEXT STEPS
 5. OPPORTUNITIES AND NEXT STEPS When the METRO Green Line LRT begins operating in mid-2014, a strong emphasis will be placed on providing frequent connecting bus service with Green Line trains. Bus hours
Troost Corridor Transit Study
 Troost Corridor Transit Study May 23, 2007 Kansas City Area Transportation Authority Agenda Welcome Troost Corridor Planning Study Public participation What is MAX? Survey of Troost Riders Proposed Transit
Click to edit Master title style
 Nelson/Nygaard Consulting Associates SERVICE IMPROVEMENT STRATEGIES September 22, 2015 1 PROJECT OVERVIEW & WORK TO DATE 1. Extensive stakeholder involvement Throughout 2. System and market assessment
West Broadway Transit Study. Community Advisory Committee September 17, 2015
 West Broadway Transit Study Community Advisory Committee September 17, 2015 Introductions Community Engagement Summer Outreach Fall Outreach Technical Analysis Process Update Alternatives Review Economic
Public Meeting. City of Chicago Department of Transportation & Department of Housing and Economic Development
 Public Meeting City of Chicago Department of Transportation & Department of Housing and Economic Development Funded by Regional Transportation Authority September 12, 2011 In partnership with Presentation
EUGENE-SPRINGFIELD, OREGON EAST WEST PILOT BRT LANE TRANSIT DISTRICT
 EUGENE-SPRINGFIELD, OREGON EAST WEST PILOT BRT LANE TRANSIT DISTRICT (BRIEF) Table of Contents EUGENE-SPRINGFIELD, OREGON (USA)... 1 COUNTY CONTEXT AND SYSTEM DESCRIPTION... 1 SYSTEM OVERVIEW... 1 PLANNING
BROWARD BOULEVARD CORRIDOR TRANSIT STUDY
 BROWARD BOULEVARD CORRIDOR TRANSIT STUDY FM # 42802411201 EXECUTIVE SUMMARY July 2012 GOBROWARD Broward Boulevard Corridor Transit Study FM # 42802411201 Executive Summary Prepared For: Ms. Khalilah Ffrench,
Green Line Long-Term Investments
 Enhancements Short-term improvements to keep Austin moving. Investments Long-term projects to support our future. Mobility Hubs MetroRapid MetroRail MetroExpress Connectors Circulators Project Connect
State Avenue Corridor Bus Rapid Transit (BRT)
") State Avenue Corridor Bus Rapid Transit (BRT) Moving Forward Incrementally April 2010 State Ave. BRT Update Bus Rapid Transit Overview State Ave. Alternatives Analysis Results What s Coming Up Right Away!
State Avenue Corridor Bus Rapid Transit (BRT) Moving Forward Incrementally April 2010 State Ave. BRT Update Bus Rapid Transit Overview State Ave. Alternatives Analysis Results What s Coming Up Right Away!
US 29 Bus Rapid Transit Planning Board Briefing. February 16, 2017
 US 29 Bus Rapid Transit Planning Board Briefing February 16, 2017 Project Goals Improve the quality of transit service Improve mobility opportunities and choices Enhance quality of life Support master
STRATEGIC PRIORITIES AND POLICY COMMITTEE MAY 5, 2016
 STRATEGIC PRIORITIES AND POLICY COMMITTEE MAY 5, 2016 Shift Rapid Transit Initiative Largest infrastructure project in the city s history. Rapid Transit initiative will transform London s public transit
2 EXISTING ROUTE STRUCTURE AND SERVICE LEVELS
 2 EXISTING ROUTE STRUCTURE AND SERVICE LEVELS In the Study Area, as in most of the Metro Transit network, there are two distinct route structures. The base service structure operates all day and the peak
Bi-County Transitway/ Bethesda Station Access Demand Analysis
 Bi-County Transitway/ Bethesda Station Access Demand Analysis Prepared for: Washington Metropolitan Area Transit Authority Office of Planning and Project Development May 2005 Prepared by: in conjunction
Waco Rapid Transit Corridor (RTC) Feasibility Study
 Feasibility Study") Waco Rapid Transit Corridor (RTC) Feasibility Study Chris Evilia, Director of Waco Metropolitan Planning Organization Allen Hunter, General Manager Waco Transit System Jimi Mitchell, Project Manager AECOM
Waco Rapid Transit Corridor (RTC) Feasibility Study Chris Evilia, Director of Waco Metropolitan Planning Organization Allen Hunter, General Manager Waco Transit System Jimi Mitchell, Project Manager AECOM
Needs and Community Characteristics
 Needs and Community Characteristics Anticipate Population and Job Growth in the City Strongest density of population and jobs in Ann Arbor are within the Study Area Population expected to grow 8.4% by
CTfastrak Expansion. Stakeholder Meeting #4 Manchester Town Hall June 3, 2016
 CTfastrak Expansion Stakeholder Meeting #4 Manchester Town Hall June 3, 2016 Today s Agenda Phase I Update 2016 Service Plan Implementation Schedule & Cost Update Phase II Services Timeline Market Analysis
Executive Summary. Draft Environmental Impact Statement/Environmental Impact Report ES-1
 Executive Summary Introduction The Eastside Transit Corridor Phase 2 Project is a vital public transit infrastructure investment that would provide a transit connection to the existing Metro Gold Line
2.0 Development Driveways. Movin Out June 2017
 Movin Out June 2017 1.0 Introduction The proposed Movin Out development is a mixed use development in the northeast quadrant of the intersection of West Broadway and Fayette Avenue in the City of Madison.
Service Quality: Higher Ridership: Very Affordable: Image:
 Over the past decade, much attention has been placed on the development of Bus Rapid Transit (BRT) systems. These systems provide rail-like service, but with buses, and are typically less expensive to
UTA Transportation Equity Study and Staff Analysis. Board Workshop January 6, 2018
 UTA Transportation Equity Study and Staff Analysis Board Workshop January 6, 2018 1 Executive Summary UTA ranks DART 6 th out of top 20 Transit Agencies in the country for ridership. UTA Study confirms
Point A Point B Point C Point D. Fulton County Board of Commissioners and Mayors Meeting December 14, 2017
 Fulton County Board of Commissioners and Mayors Meeting December 14, 2017 Master Plan Overview Phase 1 Community Vision and Existing Transit Conditions Phase 2 Scenario Development Phase 3 Transit Master
METRO Orange Line BRT American Boulevard Station Options
 METRO Orange Line BRT American Boulevard Station Options Bloomington City Council Work Session November 18, 2013 Christina Morrison BRT/Small Starts Project Office Coordinating Planning and Design AMERICAN
Executive Summary. Treasure Valley High Capacity Transit Study Priority Corridor Phase 1 Alternatives Analysis October 13, 2009.
 Treasure Valley High Capacity Transit Study Priority Corridor Phase 1 Alternatives Analysis October 13, 2009 Background As the Treasure Valley continues to grow, high-quality transportation connections
THE WAY WE MOVE LRT FOR EVERYONE
 THE WAY WE MOVE LRT FOR EVERYONE 2 LRT for Everyone LRT FOR EVERYONE Light rail is about more than transit; it s about transforming Edmonton. As the city grows, so do its transportation needs. LRT is an
Preliminary Definition of Alternatives. 3.0 Preliminary Definition of Alternatives
 3.0 What preliminary alternatives are being evaluated? The alternatives for the East San Fernando Valley Transit Corridor project that were considered for screening include the No Build Alternative, Transportation
Northeast Corridor Alternatives Analysis. Public Involvement Round 2 Input on Alternatives for Further Study
 Northeast Corridor Alternatives Analysis Public Involvement Round 2 Input on Alternatives for Further Study Feb. 7-9, 2012 Agenda Review project background Progress summary Recommended alternatives for
1 Downtown LRT Connector: Draft Concept
 Downtown LRT Connector: Draft Concept Plan November 2010 We re moving forward. Get involved. On June 21, 2010, City Council approved a street-level downtown LRT route, including a connector for the future
FREQUENTLY ASKED QUESTIONS
 FREQUENTLY ASKED QUESTIONS 2018 What is the More MARTA Atlanta program? The More MARTA Atlanta program is a collaborative partnership between MARTA and the City of Atlanta to develop and implement a program
Chapter 4 : THEME 2. Transportation
 Chapter 4 : THEME 2 Strengthen connections to keep the Central Area easy to reach and get around 55 Figure 4.2.1 Promote region-wide transit investments. Metra commuter rail provides service to the east,
Michigan/Grand River Avenue Transportation Study TECHNICAL MEMORANDUM #18 PROJECTED CARBON DIOXIDE (CO 2 ) EMISSIONS
 EMISSIONS") TECHNICAL MEMORANDUM #18 PROJECTED CARBON DIOXIDE (CO 2 ) EMISSIONS Michigan / Grand River Avenue TECHNICAL MEMORANDUM #18 From: URS Consultant Team To: CATA Project Staff and Technical Committee Topic:
TECHNICAL MEMORANDUM #18 PROJECTED CARBON DIOXIDE (CO 2 ) EMISSIONS Michigan / Grand River Avenue TECHNICAL MEMORANDUM #18 From: URS Consultant Team To: CATA Project Staff and Technical Committee Topic:
CEDAR AVENUE TRANSITWAY Implementation Plan Update
 CEDAR AVENUE TRANSITWAY Implementation Plan Update EECUTIVE SUMMARY DECEMBER 2015 Executive Summary In 2013, the Twin Cities metropolitan area s first bus rapid transit (BRT) line, the METRO Red Line,
Sales and Use Transportation Tax Implementation Plan
 Sales and Use Transportation Tax Implementation Plan Transportation is more than just a way of getting from here to there. Reliable, safe transportation is necessary for commerce, economic development,
Madison BRT Transit Corridor Study Proposed BRT Operations Plans
 Madison BRT Transit Corridor Study Proposed BRT Operations Plans This paper presents a description of the proposed BRT operations plan for use in the Madison BRT Transit Corridor Study. The objective is
SERVICE DESIGN GUIDELINES
 VTA TRANSIT SUSTAINABILITY POLICY: APPENDIX A SERVICE DESIGN GUIDELINES Adopted February 2007 COMMUNITYBUS LOCALBUS EXPRESSBUS BUSRAPIDTRANSIT LIGHTRAILTRANSIT STATIONAREAS S A N T A C L A R A Valley Transportation
appendix 4: Parking Management Study, Phase II
 appendix 4: Parking Management Study, Phase II A4-1 A4-2 Eastlake Parking Management Study Final Phase 2 Report Future Parking Demand & Supply January 6, 2017 Submitted by Denver Corp Center III 7900 E.
Executive Summary October 2013
 Executive Summary October 2013 Table of Contents Introduction... 1 Rider Transit and Regional Connectivity... 1 Plan Overview... 2 Network Overview... 2 Outreach... 3 Rider Performance... 4 Findings...
Analysis of Radial and Trunk Feeder Transit System Configurations in Downtown Charlottesville
 Analysis of Radial and Trunk Feeder Transit System Configurations in Downtown Charlottesville 1. Introduction During the stakeholder input sessions of Charlottesville Area Transit s (CAT) Transit Development
Kendall Drive Premium Transit PD&E Study Project Kick-Off Meeting SR 94/Kendall Drive/SW 88 Street Project Development and Environment (PD&E) Study
 Study") Florida Department of Transportation District Six Kendall Drive Premium Transit PD&E Study Project Kick-Off Meeting SR 94/Kendall Drive/SW 88 Street Project Development and Environment (PD&E) Study What
Florida Department of Transportation District Six Kendall Drive Premium Transit PD&E Study Project Kick-Off Meeting SR 94/Kendall Drive/SW 88 Street Project Development and Environment (PD&E) Study What
TRANSIT AND MOBILITY PLAN FOR THE KANSAS CITY REGION 3.0 EXECUTIVE SUMMARY A PROJECT OF THE MID-AMERICA REGIONAL COUNCIL AND ITS PARTNERS
 smartmoves 3.0 TRANSIT AND MOBILITY PLAN FOR THE KANSAS CITY REGION EXECUTIVE SUMMARY A PROJECT OF THE MID-AMERICA REGIONAL COUNCIL AND ITS PARTNERS UNIFIED GOVERNMENT Wyandotte County Kansas City, Kansas
Making Mobility Better, Together
 Making Mobility Better, Together Austin Transportation Department Gordon Derr, P.E., for Robert J. Spillar, P.E Director, Austin Transportation Department 1 AUSTIN TRANSPORTATION DEPARTMENT Our Mission
The Engineering Department recommends Council receive this report for information.
 CORPORATE REPORT NO: R161 COUNCIL DATE: July 23, 2018 REGULAR COUNCIL TO: Mayor & Council DATE: July 19, 2018 FROM: General Manager, Engineering FILE: 8740-01 SUBJECT: Surrey Long-Range Rapid Transit Vision
Charlotte-Mecklenburg Region Rapid Transit and Land-Use Integration
 Charlotte-Mecklenburg Region Rapid Transit and Land-Use Integration Legislative Committee on Urban Growth and Infrastructure Carolyn Flowers CEO Charlotte Area Transit System March 23, 2010 Charlotte Region
KANSAS CITY STREETCAR
 KANSAS CITY STREETCAR KAREN CLAWSON MID-AMERICA REGIONAL COUNCIL KANSAS CITY STREETCAR Regional Context Alternatives Analysis Kansas City Streetcar Project KANSAS CITY REGION KANSAS CITY REGION KANSAS
9. Downtown Transit Plan
 CORRADINO 9. Downtown Transit Plan KAT Transit Development Plan As part of the planning process for the TDP, an examination of downtown transit operations was conducted. The Downtown Transit Plan 1 is
Maryland Gets to Work
 I-695/Leeds Avenue Interchange Reconstruction Baltimore County Reconstruction of the I-695/Leeds Avenue interchange including replacing the I-695 Inner Loop bridges over Benson Avenue, Amtrak s Northeast
A Transit Plan for the Future. Draft Network Plan
 A Transit Plan for the Future Draft Network Plan Project Overview and Status Completed Market Analysis and Service Evaluation. Developed Plan Framework and Guiding Principles. Developed a draft Five Year
Help shape your community investment in Wake Transit. Fiscal Year 2019 Draft Work Plan Summary
 Help shape your community investment in Wake Transit Fiscal Year 2019 Draft Work Plan Summary Wake County, growth and transit The Triangle is one of the fastest-growing regions in the nation. Wake County
CITY OF LONDON STRATEGIC MULTI-YEAR BUDGET ADDITIONAL INVESTMENTS BUSINESS CASE # 6
 2016 2019 CITY OF LONDON STRATEGIC MULTI-YEAR BUDGET ADDITIONAL INVESTMENTS BUSINESS CASE # 6 STRATEGIC AREA OF FOCUS: SUB-PRIORITY: STRATEGY: INITIATIVE: INITIATIVE LEAD(S): BUILDING A SUSTAINABLE CITY
7 COMPARATIVE EVALUATION OF ALTERNATIVES
 7 COMPARATIVE EVALUATION OF ALTERNATIVES 7.1 INTRODUCTION This chapter presents the comparative analysis of the four Level 2 build alternatives along with a discussion of the relative performance of the
August 2, 2010 Public Meeting
 Public Meeting LYMMO Expansion Alternatives Analysis Study Purpose of study is to provide a fresh look at potential LYMMO expansion, following Federal Transit Administration (FTA) Alternatives Analysis
What is the Connector?
 What is the Connector? The Connector is a plan for a high-capacity transit system from northeast to south Ann Arbor, connecting major destinations including downtown, commercial, and residential areas,
6/6/2018. June 7, Item #1 CITIZENS PARTICIPATION
 June 7, 2018 Item #1 CITIZENS PARTICIPATION 1 Item #2 APPROVAL OF MINUTES Item #3 TRAC GOALS, FRAMEWORK & AGENDA REVIEW 2 COMMITTEE GOALS Learn about Southern Nevada s mobility challenges, new developments
Rapid Transit and Land-Use Integration a Reality
 City of Charlotte Rapid Transit and Land-Use Integration a Reality Transportation Oversight Committee Carolyn Flowers CEO Charlotte Area Transit System April 29, 2010 Charlotte Region Statistics Mecklenburg
Downtown Lee s Summit Parking Study
 Downtown Lee s Summit Parking Study As part of the Downtown Lee s Summit Master Plan, a downtown parking and traffic study was completed by TranSystems Corporation in November 2003. The parking analysis
Yonge-Eglinton. Mobility Hub Profile. September 19, 2012 YONGE- EGLINTON
 September 19, 2012 PEEL YORK HALTON DURHAM HAMILTON TORONTO YONGE- EGLINTON MOBILITY HUBS: places of connectivity between regional and rapid transit services, where different modes of transportation come
WAKE TRANSIT PLAN Summer 2018
 WAKE TRANSIT PLAN Summer 2018 Planning for growth WAKE COUNTY s population already exceeds ONE MILLION and grows by more than 60 people a day. That s 23,000 people a year or basically another Morrisville.
Midtown Corridor Alternatives Analysis. Policy Advisory Committee Meeting February 12, 2014
 Midtown Corridor Alternatives Analysis Policy Advisory Committee Meeting February 12, 2014 Today s Agenda Introductions Outreach efforts and survey results Other updates since last meeting Evaluation results
Snelling Bus Rapid Transit. May 13, 2013 Technical Advisory Committee Meeting #1
 Snelling Bus Rapid Transit May 13, 2013 Technical Advisory Committee Meeting #1 1 Today s meeting TAC Introductions Project Overview Arterial BRT Concept Background Snelling Corridor Plan, Funding & Schedule
Downtown Transit Connector. Making Transit Work for Rhode Island
 Downtown Transit Connector Making Transit Work for Rhode Island 3.17.17 Project Evolution Transit 2020 (Stakeholders identify need for better transit) Providence Core Connector Study (Streetcar project
Findings from the Limassol SUMP study
 5 th European Conference on Sustainable Urban Mobility Plans 14-15 May 2018 Nicosia, Cyprus Findings from the Limassol SUMP study Apostolos Bizakis Deputy PM General Information The largest city in the
Midtown Corridor Alternatives Analysis Key Issues Memo
 Midtown Corridor Alternatives Analysis Key Issues Memo 1/4/2013 Prepared by the SRF Consulting Group Team for Table of Contents Introduction... 1 1. Markets... 1 External Markets... 1 Intra-Corridor Travel...
Fresno County. Sustainable Communities Strategy (SCS) Public Workshop
 Public Workshop") Fresno County Sustainable Communities Strategy (SCS) Public Workshop Project Background Senate Bill 375 Regional Transportation Plan (RTP) Greenhouse gas emission reduction through integrated transportation
Fresno County Sustainable Communities Strategy (SCS) Public Workshop Project Background Senate Bill 375 Regional Transportation Plan (RTP) Greenhouse gas emission reduction through integrated transportation
GO Transit s deliverable: the 2020 Service Plan
 GO Transit s deliverable: the 2020 Service Plan GO Transit s 2020 Service Plan describes GO s commitment to customers, existing and new, to provide a dramatically expanded interregional transit option
Public Meeting. June 15, :30 7:30 p.m.
 Public Meeting June 15, 2017 5:30 7:30 p.m. Welcome 2015 Naval Station Norfolk Transit Extension Study 2015 Naval Station Norfolk Transit Extension Study 2017 Norfolk Westside Transit Study HRT and the
BUS STOP DESIGN & PLANNING GUIDE
 BUS STOP DESIGN & PLANNING GUIDE Prepared by the Operations and Planning Departments 2011 PURPOSE OF GUIDE The design of passenger waiting areas plays a significant role in a person s decision of whether
West Broadway Transit Study. Minnesota APA Conference Charles Carlson, Metro Transit Adele Hall, SRF Consulting September 24, 2015
 West Broadway Transit Study Minnesota APA Conference Charles Carlson, Metro Transit Adele Hall, SRF Consulting September 24, 2015 Study Context: Blue Line Planning 2 Study Context: Arterial BRT Study completed
FasTracks News. RTD s Eagle P3 Transit Project Nears Halfway Mark to Opening Day EP3 will add three commuter rail lines to metro area in 2016
 July 29, 2013 Welcome to Inside RTD FasTracks a monthly e- update to keep you informed about the progress of the Regional Transportation District's FasTracks program. FasTracks News RTD s Eagle P3 Transit
Table 8-1: Service Frequencies for All Short-List Alternatives by Day of Week and Time of Day Frequency Day of Week Time of Day Time Period
 8. Operating Plans The following Section presents the operating plans for the Short-List Alternatives. The modern streetcar operating plans are presented for Alternatives 2 and 3, followed by bus rapid
NAVY YARD BALLPARK STATION ACCESS IMPROVEMENTS STUDY. Final Report. Washington Metropolitan Area Transit Authority
 NAVY YARD BALLPARK STATION ACCESS IMPROVEMENTS STUDY Final Report Washington Metropolitan Area Transit Authority Office of Real Estate and Station Planning April 2016 [This page intentionally left blank]
Draft Results and Open House
 Waco Rapid Transit Corridor (RTC) Feasibility Study Draft Results and Open House Chris Evilia, Director of Waco Metropolitan Planning Organization Allen Hunter, General Manager Waco Transit System Jimi
Executive Summary. Phase 2 Evaluation Report. Introduction
 , Executive Summary Executive Summary Introduction TransLink and the Province of British Columbia sponsored a multi-phase study to evaluate alternatives for rapid transit service in the Broadway corridor
Background Information for MPRB Community Advisory Committee for 2010 Southwest Light Rail Transit Project DEIS Comment Letter Section 2
 Background Information for MPRB Community Advisory Committee for 2010 Southwest Light Rail Transit Project DEIS Comment Letter Section 2 1 2. SW LRT Corridor Overview Source: http://www.southwesttransitway.org/home.html
Metro Transit Update. Christina Morrison, Senior Planner Metro Transit BRT/Small Starts Project Office. John Dillery, Senior Transit Planner
 Metro Transit Update Christina Morrison, Senior Planner Metro Transit BRT/Small Starts Project Office John Dillery, Senior Transit Planner Metro Transit Service Development May 16, 2013 1 Transit Planning
Metra Milwaukee District West Line Transit-Friendly Development Plan
 Metra Milwaukee District West Line Transit-Friendly Development Plan Community Input Workshop April 6, 2011 Overview of Presentation Workshop Goals Study Context Existing Conditions Market Overview Employment
ANDERSON PROPERTY SITE ANALYSIS
 ANDERSON PROPERTY SITE ANALYSIS Introduction The Montgomery County Department of Transportation (MCDOT) initiated a feasibility study in the fall of 2012 to evaluate the need for transit service expansion
Travel Time Savings Memorandum
 04-05-2018 TABLE OF CONTENTS 1 Background 3 Methodology 3 Inputs and Calculation 3 Assumptions 4 Light Rail Transit (LRT) Travel Times 5 Auto Travel Times 5 Bus Travel Times 6 Findings 7 Generalized Cost
Address Land Use Approximate GSF
 M E M O R A N D U M To: Kara Brewton, From: Nelson\Nygaard Date: March 26, 2014 Subject: Brookline Place Shared Parking Analysis- Final Memo This memorandum presents a comparative analysis of expected
QUALITY OF LIFE EXECUTIVE SUMMARY REPORT I O N S TAT I O N
 QUALITY OF LIFE EXECUTIVE SUMMARY REPORT UN I O N S TAT I O N T R AV E L by TR A I N Published September 2017 2015 PROGRESS MAP This document reports FasTracks progress through 2015 BACKGROUND RTD The
CORE AREA SPECIFIC PLAN
 only four (A, B, D, and F) extend past Eighth Street to the north, and only Richards Boulevard leaves the Core Area to the south. This street pattern, compounded by the fact that Richards Boulevard is
4.0 TIER 2 ALTERNATIVES
 4.0 TIER 2 ALTERNATIVES The Tier 2 Alternatives represent the highest performing Tier 1 Alternatives. The purpose of the Tier 2 Screening was to identify the LPA utilizing a more robust list of evaluation
Citizens Committee for Facilities
 Citizens Committee for Facilities AGENDA Thursday, December 11, 2014 City Council Chambers 305 3 rd Avenue East -Twin Falls, Idaho 11:30 A.M. AGENDA ITEMS Purpose By 1. Discussion and possible action on
Proposed Program of Interrelated Projects
 DALLAS AREA RAPID TRANSIT Proposed Program of Interrelated Projects Federal Transit Administration Capital Investment Program Summer 204 INTRODUCTION The current federal transportation bill, Moving Ahead
FINAL. Sound Transit Long-Range Plan Update. Issue Paper S.1: Tacoma Link Integration with Central Link. Prepared for: Sound Transit
 Sound Transit Long-Range Plan Update Issue Paper S.1: Tacoma Link Integration with Central Link Prepared for: Sound Transit Prepared by: Quade & Douglas, Inc. FINAL March 2005 Foreword This issue paper
Chapter 7: Travel Demand Analysis. Chapter 8. Plan Scenarios. LaSalle Community Center. Image Credit: Town of LaSalle
 Chapter 7: Travel Demand Analysis Chapter 8 Plan Scenarios LaSalle Community Center. Image Credit: Town of LaSalle 164 Chapter 8: Plan Scenarios Moving Ahead for Progress in the 21 st Century Act (MAP
PARKING OCCUPANCY IN WINDSOR CENTER
 PARKING OCCUPANCY IN WINDSOR CENTER TOWN OF WINDSOR, CONNECTICUT REPORT JUNE 2017 CONTENTS Background... 3 Other Relevant Data... 3 Parking Survey Design... 6 Parking Supply Inventory... 6 Parking Demand
Attachment D Environmental Justice and Outreach
 Attachment D Environmental Justice and Outreach ATTACHMENT D Environmental Justice and Outreach Indicate whether the project will have disproportionately high and adverse impacts on minority or low income
I-405 and SR 522/NE 145th Bus Rapid Transit. Elected Leadership Groups Meeting November 30, 2018
 I-405 and SR 522/NE 145th Bus Rapid Transit Elected Leadership Groups Meeting November 30, 2018 Agenda Welcome and Introductions Public Comment BRT Connection in Bothell Common Elements: Bus base, Station
King County Metro. Columbia Street Transit Priority Improvements Alternative Analysis. Downtown Southend Transit Study. May 2014.
 King County Metro Columbia Street Transit Priority Improvements Alternative Analysis Downtown Southend Transit Study May 2014 Parametrix Table of Contents Introduction... 1 Methodology... 1 Study Area...
residents of data near walking. related to bicycling and Safety According available. available. 2.2 Land adopted by
 2. Assessment of Current Conditions and Needs In order to prepare a plan to reach the vision desired by the residents of Texarkana, it is first necessary to ascertain the current situation. Since there
GROWTH & DEVELOPMENT. Residents enjoying the newly opened Brickell City Centre on Nov. 3, 2016.
 GROWTH & DEVELOPMENT Residents enjoying the newly opened Brickell City Centre on Nov. 3, 2016. 20 Growth & Development Overview With over 450,000 residents, the City of Miami is at the heart of one of
The City of Toronto s Transportation Strategy July 2007
 The City of Toronto s Transportation Strategy July 2007 Presentation Outline Transportation Statistics Transportation Building Blocks Toronto s Official Plan Transportation and City Building Vision Projects
BERKELEY DOWNTOWN AREA PLAN PROGRAM ENVIRONMENTAL IMPACT REPORT TRAFFIC IMPACT ANALYSIS
 BERKELEY DOWNTOWN AREA PLAN PROGRAM ENVIRONMENTAL IMPACT REPORT TRAFFIC IMPACT ANALYSIS Prepared for: City of Berkeley Prepared by: REVISED JANUARY 9, 2009 Berkeley Downtown Area Plan Program EIR Traffic
Restoration of Historic Streetcar Services in Downtown Los Angeles
 Restoration of Historic Streetcar Services in Downtown Los Angeles Early Scoping Meeting for Alternatives Analysis (AA) May 17, 2011 Introduction Key players Local lead agency: Metro Federal lead agency:
Restoration of Historic Streetcar Services in Downtown Los Angeles
 Restoration of Historic Streetcar Services in Downtown Los Angeles Alternatives Analysis Community Update Meeting August 2, 2011 Introduction Key players Local lead agency: Metro Federal lead agency: Federal
King County Metro. Sustainably and equitably achieving a zero-emission fleet
 King County Metro Sustainably and equitably achieving a zero-emission fleet Agenda Background Purpose Service area Fleet size Climate goals Process Stakeholder engagement Analyses Service Equity Final
1.0 Detailed Definition of Alternatives
 1.0 Detailed Definition of Alternatives 1.1 Introduction This chapter provides supplemental information on the four alternatives, including both physical and operational characteristics (e.g. service plans)
TRAVEL DEMAND FORECASTS
 Jiangxi Ji an Sustainable Urban Transport Project (RRP PRC 45022) TRAVEL DEMAND FORECASTS A. Introduction 1. The purpose of the travel demand forecasts is to assess the impact of the project components
Parking Management Element
 Parking Management Element The State Transportation Planning Rule, adopted in 1991, requires that the Metropolitan Planning Organization (MPO) area implement, through its member jurisdictions, a parking
Midtown Corridor Alternatives Analysis Initial Screening Analysis
 Midtown Corridor Alternatives Analysis Initial Screening Analysis 7/24/2013 Prepared by the SRF Consulting Group Team for Table of Contents Purpose... 1 Initial Screening Analysis Methodology... 1 Screening...
Office of Transportation Bureau of Traffic Management Downtown Parking Meter District Rate Report
 Office of Transportation Bureau of Traffic Management 1997 Downtown Parking Meter District Rate Report Introduction The City operates approximately 5,600 parking meters in the core area of downtown. 1