Tarrant County Projected Population Growth
|
|
|
- Amberly Warner
- 6 years ago
- Views:
Transcription


1
2


, Rapid Bus, streetcar, and more.")
3 Based on the information provided in the preceding chapters, it is apparent that there are a number of issues that must be addressed as The T works to develop an excellent transit system for Fort Worth and Tarrant County. These include: Fort Worth has grown from a small city to a medium-sized city in a major metropolitan area. However, the area s population and employment have grown much faster than The T s system. Tarrant County s population will continue to grow, and increasing shares of older adults, Millennials, and minority residents will contribute to much higher demand for transit service. Limited avenues of funding, especially from local sources, have long constrained The T s ability to increase and expand transit service. Fort Worth and Tarrant County will continue to grow rapidly much more rapidly than The T will be able to expand service based on current funding levels. The T s service is very limited in terms of how frequently it operates and the hours that it operates. As a result, transit is not a convenient or attractive option for many of the county s residents and employees who have other travel options. Most of The T s services are provided within the I-820 loop, yet much of the county s recent growth has been to the north, northeast, and east of the loop. There is a significant and growing demand for transit in these areas but very little service. Throughout the country, there has been an increased emphasis on the development of new types of higher quality transit services. These include commuter rail, rapid transit, light rail, Bus Rapid Transit (BRT), Rapid Bus, streetcar, and more. The T has already started to develop premium services, such as TRE, Molly the Trolley, and the Spur* rapid bus line. However, with those exceptions, many of The T s most important bus routes continue to provide regular local service. Experience from nearby Dallas and throughout the country shows that the development of premium transit service will attract more riders and a much broader cross-section of an area s population.
4 Population (thousands) The input from stakeholders received as part of this project (and particularly during stakeholder interviews) indicates that many view the services provided by The T as being only for those without other options, particularly low-income residents and people with disabilities, and not the broader population. To a certain extent, this perception reflects reality and is a consequence of the issues described above. Texas is one of the fastest growing states in the country, and Fort Worth and Tarrant County are among the fastest growing places in Texas. Tarrant County has grown significantly in the last 30 years and is projected to continue growing for the next 30 years. Since 1980, Fort Worth s population has doubled from 400,000 to 800,000 people. Between 2000 and 2013 alone, the city of Fort Worth grew by 42% and ranked as the fastest-growing city in the U.S. with a population of more than 500,000. Looking forward, rapid growth will continue. By 2040, Tarrant County s population is projected to increase by another 40%, from 1.8 million to 2.5 million (see Figure 5-1). 3,000 2,500 Tarrant County Projected Population Growth 2.5 million 2,000 1, million 1, Despite the ongoing growth in Tarrant County, The T s bus system has remained relatively unchanged during this time. As shown in Figure 5-2, individual routes have changed over time but the amount of service coverage has not changed substantially most service is still limited to within the I-820 loop, with little service outside this boundary. Looking forward, The T will need to grow rapidly just to match the county s population and employment growth. However, it is almost certain that transit demand will grow even faster than population and employment. The projected higher density of future development will enable the provision of better transit and increase the demand for transit at proportionally higher rates. Upward ridership and productivity trends in The T s services already show that more people are looking towards transit as a viable option to meet their transportation needs (see Figure 5-3).


5
6 Annual Ridership (100,000s/ Passenger per Vehicle Hour Subsidy per Passenger $8.00 $7.00 $ FY09 FY10 FY11 FY12 FY13 $5.00 $4.00 $3.00 $2.00 $1.00 $0.00 Passenger Trips (hundred thousands) Passengers per Hour Subsidy per Passenger Changing demographics are also driving demand for more and better transit, in particular due to three key groups: Baby boomers, who are aging and desire to drive less and use transit more. Millennials, who have a very strong desire to use the most convenient travel option for different types of trips rather than driving everywhere. In particular, Millennials want to use transit and other options more and to drive less. Minorities, including immigrants, who traditionally use transit to a much greater extent than other populations. Because demand is also increasing from within existing populations, demand has been growing and will continue to grow faster than underlying population growth. Baby boomers are quickly growing older. Many want to age in place, and most are remaining active for much longer than previous generations. However, as with older adults before them, they have a greater desire and need to use transit than middle-aged residents. In Tarrant County, the population of residents age 65 and older is projected to increase by 174% by 2040, far more than any other age group in the county (see Figure 5-4).
7 65 and older 174% % % Younger than 20 18% 0% 50% 100% 150% 200% Population Increase Throughout the United States, Millennials are driving demand for better transit. The Dallas-Fort Worth area was recently ranked as one of the best cities for Millennials in the country. 1 The Metroplex is growing, and a large share of that growth is projected to come from Millennials (the population of those between 20 and 35 years of age) their population is expected to grow by 31% between 2010 and Looking forward, better transit options will be crucial to attracting and retaining Millennials in Fort Worth and Tarrant County. A recent survey conducted on behalf of The Rockefeller Foundation and Transportation for America 2 reported that nearly two-thirds of Millennials nationwide view access to high quality transportation as one of the top three criteria when deciding where to live next. Key takeaways from the survey were: 54%of Millennial respondents would consider moving if another city had better transit options. 47% of Millennials would give up their cars if their city had robust public transportation. Cities that don t invest in effective transit solutions today stand to lose out in the long run. Minority residents use transit to a greater extent than non-minority residents. One major reason for this is that minority residents, on average, have lower incomes, and transit provides a much more affordable travel option than a private automobile. In addition, many minority residents are new immigrants and come from places where transit is much more commonly used than in the United States. The Fort Worth region has become increasingly diverse in recent years. In 2000, Tarrant County s population was 71% white, with barely 20% of the population identifying as Hispanic. Between 2010 and 2040, the percentage of white residents is projected to decline from 52% to 34%, while the county s Hispanic population is projected to increase to 41%, becoming the largest population group (see Figure 5-5). 1 Forbes Magazine, Best Cities and Neighborhoods for Millennials, April 14, Rockefeller Millennials Survey, April 2014.
8 % of Population 60% 52% 40% 41% 34% 27% 20% 15% 15% 7% 10% 0% White Hispanic Black Other The vast majority of The T s revenue comes from local sales taxes. The T receives dedicated revenue from a ½-cent sales tax administered in its member communities. This sales tax is a significant source of revenue for The T, representing approximately 41% of total revenue for service operations. In fiscal year (FY) 2015, revenues are projected to total about $157 million. However, only three of the 41 municipalities in Tarrant County are full members of The T. 3 This limited membership impedes the ability of The T to provide more comprehensive regional service in Tarrant County and also limits The T s revenue. Compared to other transit agencies in Texas that generate revenue through local sales taxes, The T s 0.5% tax rate is at the low end of the range (see Table 5-1), and the small number of member communities presents an additional funding challenge. Meeting the increasing demand for transit service in Tarrant County may rely on adding more communities as members as well as bolstering operating funds with additional sources of revenue. The limited amount of funding that The T receives translates to lower levels of service than may be expected with a service area of its size. Although The T s service area population is slightly smaller than that of the larger transit systems in Texas, the amount of service that it provides to its population is a fraction of that offered by other systems. For example, the Fort Worth service area is about 83% of Austin s service area in terms of population, but The T has only 60% of the vehicles and provides only 60% of the service in terms of service mileage (see Table 5-2). As a result, The T carries only one quarter of Austin s ridership. Compared to the major transit systems in Texas, The T provides proportionately less service based on its size and, as a result, carries significantly less ridership. 3 Grapevine is a partial member and contributes funding for planned TEX Rail service.
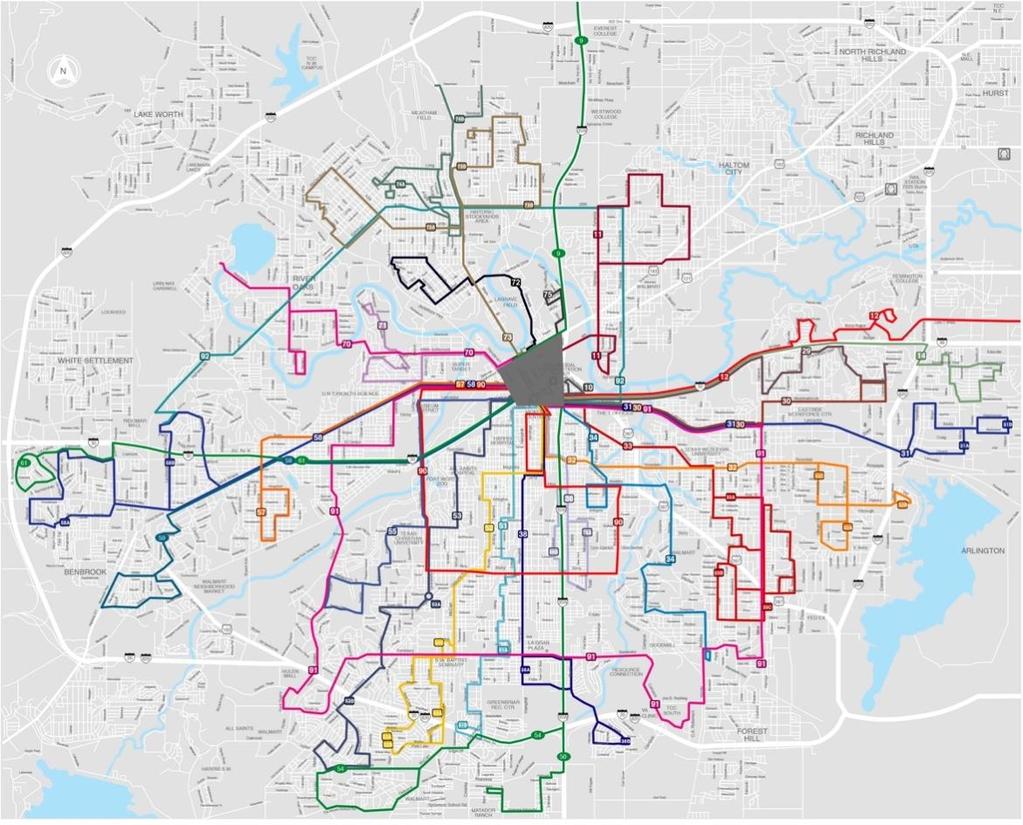
9 The T provides generally comprehensive service coverage in Fort Worth and within the I-820 loop. However, service frequencies and hours of service are very limited. Beyond the loop, where much of the county s growth has occurred, there is very little service. The combination of these factors means that service is either not attractive or not available to a broad cross-section of Tarrant County s population. The T operates 41 routes on weekdays, including seven express routes and two circulators that operate only during peak hours as well as three routes that operate one or two special trips per day. Weekday service also includes Molly the Trolley downtown circulator and the TCU Shuttle service. Excluding peakonly Express and Limited services, there are 26 routes that operate throughout the day and into the evening during weekdays. Significantly fewer routes operate on weekends 25 routes operate on Saturdays, and 16 run on Sundays.
10 Most riders consider service that operates every 10 minutes or less to be very convenient and service that operates every 15 minutes or less to be relatively convenient. Conversely, service that operates every 30 minutes or more becomes too infrequent for most travelers who have other opportunities to travel, such as driving. In terms of these common definitions of frequency, on weekdays during the day (through the end of the PM peak): Only four of The T s routes provide service every 15 minutes or better throughout the day on weekdays (see Table 3). Molly the Trolley and the TCU Shuttle are the only two routes in the system that operate every 10 minutes. 15 routes provide service every 16 to 30 minutes during peak periods, but only 10 during the midday. 10 routes provide service every 31 to 60 minutes during peak periods, and 13 during the midday. 10 routes provide only limited service (the Express routes and Limited/Other routes that only operate a limited number of trips during peak hours). On weekday evenings and on weekends, service is much less frequent. During these times, most routes operate every 60 minutes or less often. Only one route operates every 10 minutes on weekday evenings (Molly the Trolley), while the Spur* operates every 15 minutes until 7:00 p.m. On Saturdays, Molly the Trolley continues to run every 10 minutes, and five routes run every 15 to 30 minutes (including the Spur*). On Sunday, only Molly the Trolley and Route 1 North Main operate more often than once an hour. The lack of frequent service is one of the major issues facing The T, as relatively little service operates frequently enough for most potential riders to consider service to be convenient. The span of service meaning the hours that service operates during the day is a second factor that strongly influences the convenience of the transit system. The T s services operate for more limited hours than in most major metropolitan areas. On weekdays, the first trip departs at 4:45 a.m., which is early and consistent with other similar systems; most other routes begin by 6:00 a.m. However, the last trips depart at 10:51 p.m.; there
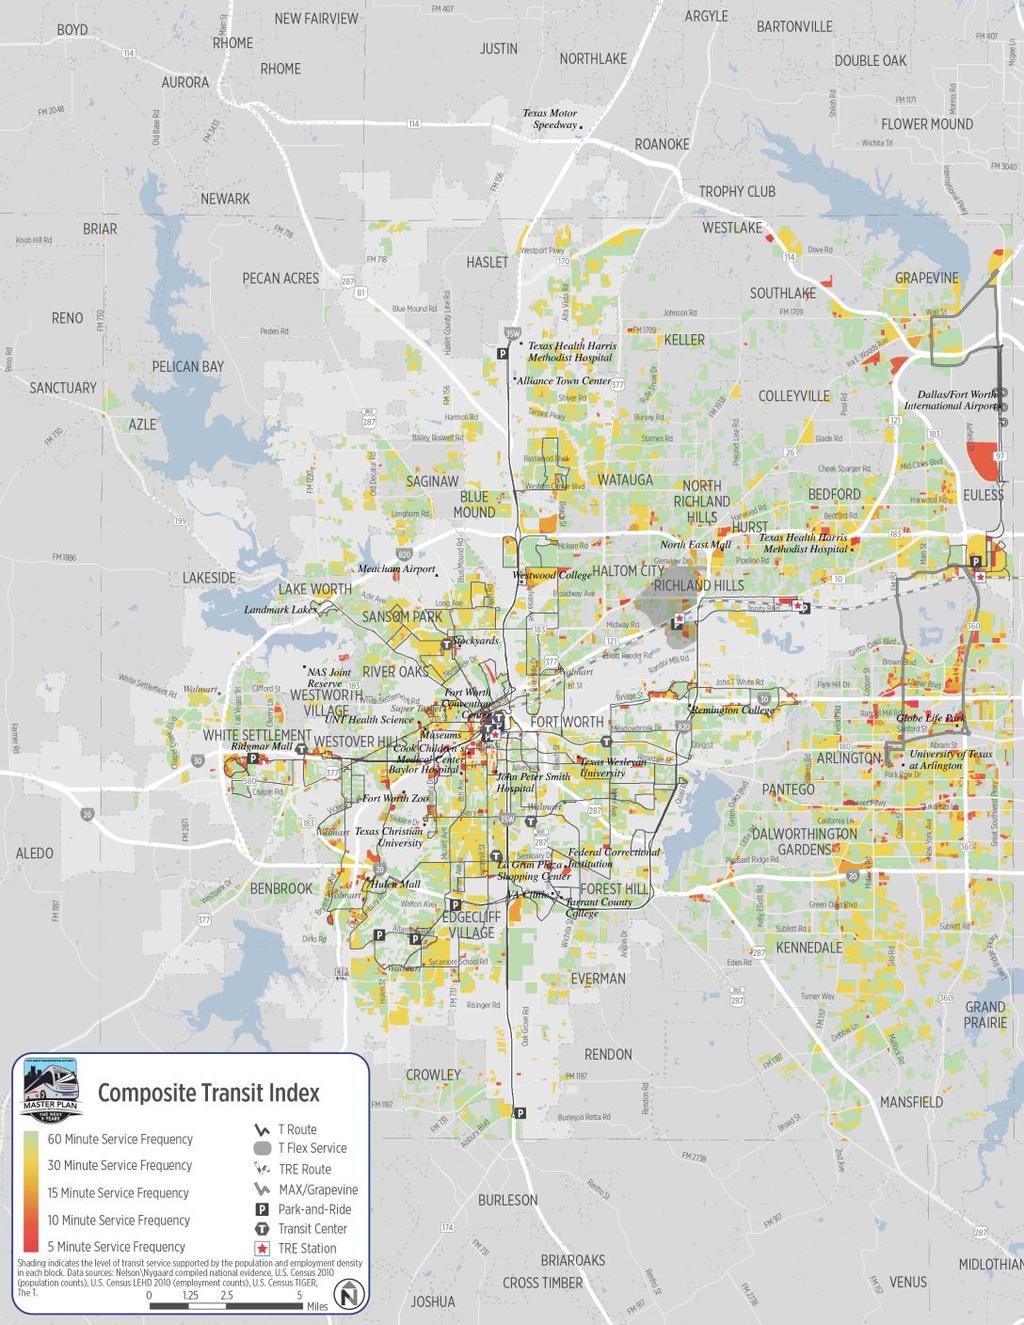
11 is no service that begins its last trip after 11:00 p.m. Moreover, most routes end service much earlier: only 16 of 41 routes have a trip that departs past 8:00 p.m. on weekdays. On Saturdays, most service begins by 6:00 a.m., which is reasonably early. However, service ends relatively early in the evenings, as it does on weekdays. Only 18 routes have trips departing after 8:00 p.m., and no service operates after 11:00 p.m. On Sundays, most routes begin operation between 6:00 and 8:00 a.m. One route, Molly the Trolley, operates until 10:00 p.m., but all other service ends by 8:30 p.m. Viewed together with the service frequencies described above, The T s service operates neither frequently enough nor late enough to provide the flexibility that most riders with other options require. This limited service makes it difficult for riders or potential riders with alternative schedules or second- and third-shift employment. It also poses a challenge to those who would use transit to reach social or entertainment activities in the evening if service were available. The T s service is almost entirely located within the I-820 loop around Fort Worth. Consequently, The T s service is currently most useful for those who both live and work within I-820 and very limited for those who need to travel to or from areas outside of this loop. This is the case even though much of the county s recent growth has occurred beyond I-820. As a result, service is provided to only a minority of the county s residents and workers. In many of these communities, transit demand is low, too low for transit to be both effective and productive. However, there are several areas with significant demand for transit that are unserved or only minimally served today. These areas include much of the eastern half of Tarrant County, generally located in an arc east and south of I-35W to the north and east of Route 287 (see Figure 5-6), in and around: Arlington Dallas-Fort Worth (DFW) Airport Grapevine Richland Hills/North Richland Hills Bedford and around Texas Health Harris Methodist Hospital White Settlement/Naval Air Station/Joint Reserve Base The major reason that The T does not provide more service in these areas is because, as described above, most communities are not members of The T. The consequence is that there are significant mismatches between transit demand and supply, including large areas with demand but little or no service. Just to meet current transit demands, The T will need to significantly expand service to new areas, provide more frequent service, and provide earlier and later service. Looking forward, these mismatches will only increase. Projections of future growth indicate that rapid growth will continue in areas beyond the I-820 loop by 2035, transit demand will generally be as high as within the loop (see Figure 5-7). The areas with the highest levels of new demand will be the same as those listed above, plus additional areas such as Alliance.

12


13 Throughout the country, there has been an increased emphasis on the development of new types of higher quality transit services. These include commuter rail, rapid transit, light rail, BRT, Rapid Bus, streetcar, and more. The T has already started to develop premium services, such as TRE commuter rail, Molly the Trolley, and the Spur* rapid bus line. However, with those exceptions, many of The T s most important bus routes continue to provide regular local service. To develop a great transit system, The T and its regional partners will need to significantly expand efforts to develop premium services. Developing a High Capacity Transit Network of BRT, Rapid Bus, and other high quality services as has been done in other cities (see Figure 4-8) would make it convenient to travel throughout Tarrant County. While the specific types of high quality services that would be included in this network have not yet been determined, a High Capacity Transit Network consisting of premium services will be a key element in developing more compelling transit service. Largely due to the issues described above, The T is viewed as providing transit service only for those without other options, particularly low-income residents and people with disabilities, and not for a broad cross-section of Tarrant County s residents, workers, and visitors. As a tacit reflection of this, many of the newer services that The T has developed have been branded primarily as something other than The T. Examples include TRE, Molly the Trolley, MAX in Arlington, and planned TEX Rail service.
14 The services that use different brands are viewed more favorably by many, and to this extent, the unique branding efforts have been successful. However, the use of different brands also means that many potential riders view available services as separate from the overall system. As a result, the whole is not greater than the sum of its parts. With the development of a stronger system, The T will need to address this image problem. Potential solutions include strengthening The T s brand, rebranding other services to better identify them with The T, or developing a new brand altogether. The T has maintained and added services as its resources have allowed. In recent years, those improvements have included the Spur* service, Molly the Trolley, TRE (and forthcoming TEX Rail), and the Intermodal Transportation Center. However, The T s resources have not nearly kept pace with the county s growth and the demand for better transit. As a result, Fort Worth has become a much larger city in a major metropolitan area, but it has a transit system designed to serve a small city. In addition, demographic and attitudinal changes mean that the demand for better transit is growing faster than just population or employment. Baby boomers who are growing older want to drive less and take transit more. Millennials want many more travel choices, but are particularly interested in better transit. Minorities, who traditionally use transit in very high numbers, will comprise most of the county s population by The T needs to catch up with the growth that has already occurred and continue to expand at a faster pace to keep up with projected growth in Tarrant County. To achieve this, major transit investments will be needed, both to address the issues described above and to develop a more robust system that will be attractive to a much broader cross-section of Tarrant County s residents, workers, and visitors.
 Texas is one of the fastest growing states in the country, and Fort Worth and Tarrant County are among the fastest growing places in Texas. The T has taken important steps to improve transit service to
 Page Texas is one of the fastest growing states in the country, and Fort Worth and Tarrant County are among the fastest growing places in Texas. Since 1980, Fort Worth s population has doubled from 400,000
STATE OF THE MTA SYSTEM REPORT EXECUTIVE SUMMARY
 NASHVILLE MTA/RTA STRATEGIC NASHVILLE MTA STRATEGIC PLAN PLAN STATE OF THE MTA SYSTEM REPORT EXECUTIVE SUMMARY Overview Since 1965, the Nashville region has grown from approximately 750,000 residents to
Click to edit Master title style
 Nelson/Nygaard Consulting Associates SERVICE IMPROVEMENT STRATEGIES September 22, 2015 1 PROJECT OVERVIEW & WORK TO DATE 1. Extensive stakeholder involvement Throughout 2. System and market assessment
Metropolitan Council Budget Overview SFY
 Metropolitan Council Budget Overview SFY 2016-2017 H T t ti C itt House Transportation Committee February 4, 2015 Transit connects us to the places that matter Transportation Needs Grow as the Region Grows
Service Quality: Higher Ridership: Very Affordable: Image:
 Over the past decade, much attention has been placed on the development of Bus Rapid Transit (BRT) systems. These systems provide rail-like service, but with buses, and are typically less expensive to
UTA Transportation Equity Study and Staff Analysis. Board Workshop January 6, 2018
 UTA Transportation Equity Study and Staff Analysis Board Workshop January 6, 2018 1 Executive Summary UTA ranks DART 6 th out of top 20 Transit Agencies in the country for ridership. UTA Study confirms
9. Downtown Transit Plan
 CORRADINO 9. Downtown Transit Plan KAT Transit Development Plan As part of the planning process for the TDP, an examination of downtown transit operations was conducted. The Downtown Transit Plan 1 is
Executive Summary October 2013
 Executive Summary October 2013 Table of Contents Introduction... 1 Rider Transit and Regional Connectivity... 1 Plan Overview... 2 Network Overview... 2 Outreach... 3 Rider Performance... 4 Findings...
TORONTO TRANSIT COMMISSION REPORT NO.
 Revised: March/13 TORONTO TRANSIT COMMISSION REPORT NO. MEETING DATE: March 26, 2014 SUBJECT: COMMUNITY BUS SERVICES ACTION ITEM RECOMMENDATION It is recommended that the Board not approve any routing
Denver Car Share Program 2017 Program Summary
 Denver Car Share Program 2017 Program Summary Prepared for: Prepared by: Project Manager: Malinda Reese, PE Apex Design Reference No. P170271, Task Order #3 January 2018 Table of Contents 1. Introduction...
5. OPPORTUNITIES AND NEXT STEPS
 5. OPPORTUNITIES AND NEXT STEPS When the METRO Green Line LRT begins operating in mid-2014, a strong emphasis will be placed on providing frequent connecting bus service with Green Line trains. Bus hours
Whither the Dashing Commuter?
 Whither the Dashing Commuter? The MTA in a Changing Region William Wheeler Director of Special Project Development and Planning Travel in the New York Region has changed from the days of the 9 to 5 commute
Vanpooling and Transit Agencies. Module 3: Benefits to Incorporating Vanpools. into a Transit Agency s Services
 Vanpooling and Transit Agencies Module 3: Benefits to Incorporating Vanpools into a Transit Agency s Services A common theme we heard among the reasons why the transit agencies described in Module 2 began
Building Equitable Sustainable Transit OPEN HOUSE
 Building Equitable Sustainable Transit OPEN HOUSE Getting Around In Southeast Michigan Southeast Michigan Is Spread Out More Than Ever Before 1970 2010 POPULATION 35% 16% JOBS SE MICHIGAN DETROIT 42% 9%
Transportation Demand Management Element
 Transportation Demand Management Element Over the years, our reliance on the private automobile as our primary mode of transportation has grown substantially. Our dependence on the automobile is evidenced
Proposed Program of Interrelated Projects
 DALLAS AREA RAPID TRANSIT Proposed Program of Interrelated Projects Federal Transit Administration Capital Investment Program Summer 204 INTRODUCTION The current federal transportation bill, Moving Ahead
A Transit Plan for the Future. Draft Network Plan
 A Transit Plan for the Future Draft Network Plan Project Overview and Status Completed Market Analysis and Service Evaluation. Developed Plan Framework and Guiding Principles. Developed a draft Five Year
US 29 Bus Rapid Transit Planning Board Briefing. February 16, 2017
 US 29 Bus Rapid Transit Planning Board Briefing February 16, 2017 Project Goals Improve the quality of transit service Improve mobility opportunities and choices Enhance quality of life Support master
Mass Transit in Charlotte and San Antonio. Keith T. Parker, AICP
 Mass Transit in Charlotte and San Antonio Keith T. Parker, AICP President/CEO Presentation Overview Charlotte Agency and Customer Profile San Antonio Agency and Customer Profile Attracting New Customers
2 EXISTING ROUTE STRUCTURE AND SERVICE LEVELS
 2 EXISTING ROUTE STRUCTURE AND SERVICE LEVELS In the Study Area, as in most of the Metro Transit network, there are two distinct route structures. The base service structure operates all day and the peak
Sales and Use Transportation Tax Implementation Plan
 Sales and Use Transportation Tax Implementation Plan Transportation is more than just a way of getting from here to there. Reliable, safe transportation is necessary for commerce, economic development,
The Case for. Business. investment. in Public Transportation
 The Case for Business investment in Public Transportation Introduction Public transportation is an enterprise with expenditure of $55 billion in the United States. There has been a steady growth trend
CITY OF LONDON STRATEGIC MULTI-YEAR BUDGET ADDITIONAL INVESTMENTS BUSINESS CASE # 6
 2016 2019 CITY OF LONDON STRATEGIC MULTI-YEAR BUDGET ADDITIONAL INVESTMENTS BUSINESS CASE # 6 STRATEGIC AREA OF FOCUS: SUB-PRIORITY: STRATEGY: INITIATIVE: INITIATIVE LEAD(S): BUILDING A SUSTAINABLE CITY
Leadership NC. November 8, 2018
 v Leadership NC November 8, 2018 Planning for our region s growth The Triangle is one of the fastestgrowing regions in the nation. More than 2 million people are already part of the equation, and the
Appendix C: GAPS ANALYSIS
 Appendix C: GAPS ANALYSIS Appendix C Gaps Analysis While portions of Salt Lake City are well served by transit, some portions of the city experience a mismatch in the existing transit supply and current
CTfastrak Expansion. Stakeholder Meeting #4 Manchester Town Hall June 3, 2016
 CTfastrak Expansion Stakeholder Meeting #4 Manchester Town Hall June 3, 2016 Today s Agenda Phase I Update 2016 Service Plan Implementation Schedule & Cost Update Phase II Services Timeline Market Analysis
GO Transit s deliverable: the 2020 Service Plan
 GO Transit s deliverable: the 2020 Service Plan GO Transit s 2020 Service Plan describes GO s commitment to customers, existing and new, to provide a dramatically expanded interregional transit option
Valley Metro Overview. ITE/IMSA Spring Conference March 6, 2014
 Valley Metro Overview ITE/IMSA Spring Conference March 6, 2014 Valley Metro Who Are We? Operate Regional Transit Services Valley Metro and Phoenix are region s primary service providers Light Rail and
FREQUENTLY ASKED QUESTIONS
 FREQUENTLY ASKED QUESTIONS 2018 What is the More MARTA Atlanta program? The More MARTA Atlanta program is a collaborative partnership between MARTA and the City of Atlanta to develop and implement a program
Help shape your community investment in Wake Transit. Fiscal Year 2019 Draft Work Plan Summary
 Help shape your community investment in Wake Transit Fiscal Year 2019 Draft Work Plan Summary Wake County, growth and transit The Triangle is one of the fastest-growing regions in the nation. Wake County
The Engineering Department recommends Council receive this report for information.
 CORPORATE REPORT NO: R161 COUNCIL DATE: July 23, 2018 REGULAR COUNCIL TO: Mayor & Council DATE: July 19, 2018 FROM: General Manager, Engineering FILE: 8740-01 SUBJECT: Surrey Long-Range Rapid Transit Vision
DRAFT BUS TRANSFORMATION PROJECT
 BUS TRANSFORMATION PROJECT Bus System Today October 2018 The current regional system includes nine bus service providers: WMATA Loudoun County Transit The Bus Fairfax County Connector RideOn ART DASH CUE
Green Line Long-Term Investments
 Enhancements Short-term improvements to keep Austin moving. Investments Long-term projects to support our future. Mobility Hubs MetroRapid MetroRail MetroExpress Connectors Circulators Project Connect
EUGENE-SPRINGFIELD, OREGON EAST WEST PILOT BRT LANE TRANSIT DISTRICT
 EUGENE-SPRINGFIELD, OREGON EAST WEST PILOT BRT LANE TRANSIT DISTRICT (BRIEF) Table of Contents EUGENE-SPRINGFIELD, OREGON (USA)... 1 COUNTY CONTEXT AND SYSTEM DESCRIPTION... 1 SYSTEM OVERVIEW... 1 PLANNING
WAKE TRANSIT PLAN Summer 2018
 WAKE TRANSIT PLAN Summer 2018 Planning for growth WAKE COUNTY s population already exceeds ONE MILLION and grows by more than 60 people a day. That s 23,000 people a year or basically another Morrisville.
NCTCOG MOD Workshop Toyota Motor North America (TMNA) and Denton County Transit Authority (DCTA)
 and Denton County Transit Authority (DCTA)") NCTCOG MOD Workshop Toyota Motor North America (TMNA) and Denton County Transit Authority (DCTA) DCTA: REGIONAL PARTNER TOYOTA SOCIAL INNOVATION Toyota aims to directly enable affordable, low emissions
NCTCOG MOD Workshop Toyota Motor North America (TMNA) and Denton County Transit Authority (DCTA) DCTA: REGIONAL PARTNER TOYOTA SOCIAL INNOVATION Toyota aims to directly enable affordable, low emissions
Transit System Technical Report
 Transit System Technical Report Table of Contents Introduction... 1 Regional Setting... 1 Road Network... 1 The Mass Transportation Authority FY 2016-2020 Plan... 2 Other Growth Areas... 5 Senior Citizens...
Rapid Transit and Land-Use Integration a Reality
 City of Charlotte Rapid Transit and Land-Use Integration a Reality Transportation Oversight Committee Carolyn Flowers CEO Charlotte Area Transit System April 29, 2010 Charlotte Region Statistics Mecklenburg
Summit County Greenhouse Gas Emissions Summary, 2017
 Summit County Greenhouse Gas Emissions Summary, 2017 In 2018, Summit County completed its first greenhouse gas inventory to better understand its emissions profile and to give insight to policies and programs
APPENDIX I: [FIXED-GUIDEWAY TRANSIT FEASIBILITY]
![APPENDIX I: [FIXED-GUIDEWAY TRANSIT FEASIBILITY]](/thumbs/83/87090921.jpg "APPENDIX I: [FIXED-GUIDEWAY TRANSIT FEASIBILITY]") APPENDIX I: [FIXED-GUIDEWAY TRANSIT FEASIBILITY] Jackson/Teton Integrated Transportation Plan 2015 Appendix I. Fixed-Guideway Transit Feasibility Jackson/Teton County Integrated Transportation Plan v2
APPENDIX I: [FIXED-GUIDEWAY TRANSIT FEASIBILITY] Jackson/Teton Integrated Transportation Plan 2015 Appendix I. Fixed-Guideway Transit Feasibility Jackson/Teton County Integrated Transportation Plan v2
Downtown Transit Connector. Making Transit Work for Rhode Island
 Downtown Transit Connector Making Transit Work for Rhode Island 3.17.17 Project Evolution Transit 2020 (Stakeholders identify need for better transit) Providence Core Connector Study (Streetcar project
August 2, 2010 Public Meeting
 Public Meeting LYMMO Expansion Alternatives Analysis Study Purpose of study is to provide a fresh look at potential LYMMO expansion, following Federal Transit Administration (FTA) Alternatives Analysis
Needs and Community Characteristics
 Needs and Community Characteristics Anticipate Population and Job Growth in the City Strongest density of population and jobs in Ann Arbor are within the Study Area Population expected to grow 8.4% by
REPORT CARD FOR CALIFORNIA S INFRASTRUCTURE WHAT YOU SHOULD KNOW ABOUT CALIFORNIA S TRANSIT FACILITIES
 TRANSIT GRADE: C- WHAT YOU SHOULD KNOW ABOUT TRANSIT FACILITIES California needs robust, flexible and reliable transit systems to reduce peak congestion on our highways, provide options for citizens who
Breakout Session. The Mobility Challenges of Our Growing & Sprawling Upstate
 Breakout Session The Mobility Challenges of Our Growing & Sprawling Upstate The Mobility Challenges of Our Growing & Sprawling Upstate Why is our suburban and sprawling development pattern a challenge
Facts and Figures. October 2006 List Release Special Edition BWC National Benefits and Related Facts October, 2006 (Previous Versions Obsolete)
") Facts and Figures Date October 2006 List Release Special Edition BWC National Benefits and Related Facts October, 2006 (Previous Versions Obsolete) Best Workplaces for Commuters - Environmental and Energy
Facts and Figures Date October 2006 List Release Special Edition BWC National Benefits and Related Facts October, 2006 (Previous Versions Obsolete) Best Workplaces for Commuters - Environmental and Energy
MARTA s blueprint for the future. COFFEE AND CONVERSATION Kyle Keahey, More MARTA Atlanta Dec. 5, 2018
 MARTA s blueprint for the future COFFEE AND CONVERSATION Kyle Keahey, More MARTA Atlanta Dec. 5, 2018 TODAY S AGENDA About MARTA Economic development/local impact More MARTA Atlanta program Program summary/timeline
TRANSIT FEASIBILITY STUDY Town of Bradford West Gwillimbury
 TRANSIT FEASIBILITY STUDY Town of Bradford West Gwillimbury Open House Presentation January 19, 2012 Study Objectives Quantify the need for transit service in BWG Determine transit service priorities based
Background Information about the Metrobus 29 Lines Study
 Background Information about the Metrobus 29 Lines Study Questions Overview of Existing Service Q. Why is the study being conducted? A. The 29 Lines provide an important connection between Annandale and
Northeast Corridor Alternatives Analysis. Public Involvement Round 2 Input on Alternatives for Further Study
 Northeast Corridor Alternatives Analysis Public Involvement Round 2 Input on Alternatives for Further Study Feb. 7-9, 2012 Agenda Review project background Progress summary Recommended alternatives for
Car Sharing at a. with great results.
 Car Sharing at a Denver tweaks its parking system with great results. By Robert Ferrin L aunched earlier this year, Denver s car sharing program is a fee-based service that provides a shared vehicle fleet
Memorandum. To: The Arlington County Board Date: June 29, 2018 From: Subject:
 OFFICE OF THE COUNTY MANAGER 2100 Clarendon Boulevard, Suite 302, Arlington, VA 22201 TEL 703.228.3120 FAX 703.228.3218 TTY 703.228.4611 www.arlingtonva.us Memorandum To: The Arlington County Board Date:
Public Meeting. City of Chicago Department of Transportation & Department of Housing and Economic Development
 Public Meeting City of Chicago Department of Transportation & Department of Housing and Economic Development Funded by Regional Transportation Authority September 12, 2011 In partnership with Presentation
Chapter 7: Travel Demand Analysis. Chapter 8. Plan Scenarios. LaSalle Community Center. Image Credit: Town of LaSalle
 Chapter 7: Travel Demand Analysis Chapter 8 Plan Scenarios LaSalle Community Center. Image Credit: Town of LaSalle 164 Chapter 8: Plan Scenarios Moving Ahead for Progress in the 21 st Century Act (MAP
ExxonMobil Basestocks Industry Pulse Report
 ExxonMobil Basestocks 2018 Industry Pulse Report 1 The base oils industry is ever evolving While Group I, Group II and Group III base oils all undeniably have a valued place in the market, the way they
Chicago Milwaukee Intercity Passenger Rail Corridor
 Chicago Milwaukee Intercity Passenger Rail Corridor Past, Present, and Future Arun Rao, Passenger Rail Manager Wisconsin Department of Transportation Elliot Ramos, Passenger Rail Engineer Illinois Department
CEDAR AVENUE TRANSITWAY Implementation Plan Update
 CEDAR AVENUE TRANSITWAY Implementation Plan Update EECUTIVE SUMMARY DECEMBER 2015 Executive Summary In 2013, the Twin Cities metropolitan area s first bus rapid transit (BRT) line, the METRO Red Line,
Figure 1 Unleaded Gasoline Prices
 Policy Issues Just How Costly Is Gas? Summer 26 Introduction. Across the nation, the price at the pump has reached record highs. From unleaded to premium grade, prices have broken three dollars per gallon
Madison BRT Transit Corridor Study Proposed BRT Operations Plans
 Madison BRT Transit Corridor Study Proposed BRT Operations Plans This paper presents a description of the proposed BRT operations plan for use in the Madison BRT Transit Corridor Study. The objective is
ROCHESTER, MINNESOTA
 ROCHESTER, MINNESOTA Rochester Public Works TRANSIT AND PARKING DIVISION Transit and Parking Manager Tony Knauer tknauer@rochestermn.gov SERVICE ATTITUDE CONSISTENCY - TEAMWORK ROCHESTER TRANSIT & PARKING
West Broadway Transit Study. Community Advisory Committee September 17, 2015
 West Broadway Transit Study Community Advisory Committee September 17, 2015 Introductions Community Engagement Summer Outreach Fall Outreach Technical Analysis Process Update Alternatives Review Economic
Dr. K. Gunasekaran Associate Professor Division of Transportation Engineering Anna University Chennai
 Dr. K. Gunasekaran Associate Professor Division of Transportation Engineering Anna University Chennai INTRODUCTION Bus Transport is the most preferred Public Transport System in many Indian cities Recent
National Household Travel Survey Add-On Use in the Des Moines, Iowa, Metropolitan Area
 National Household Travel Survey Add-On Use in the Des Moines, Iowa, Metropolitan Area Presentation to the Transportation Research Board s National Household Travel Survey Conference: Data for Understanding
PHILADELPHIA SUBURBAN RAIL SUMMARY (COMMUTER RAIL, REGIONAL RAIL)
") PHILADELPHIA SUBURBAN RAIL SUMMARY (COMMUTER RAIL, REGIONAL RAIL) October 2003 The Philadelphia commuter rail service area consists of 5.1 million people, spread over 1,800 square miles at an average population
PHILADELPHIA SUBURBAN RAIL SUMMARY (COMMUTER RAIL, REGIONAL RAIL) October 2003 The Philadelphia commuter rail service area consists of 5.1 million people, spread over 1,800 square miles at an average population
SERVICE IMPROVEMENT GUIDE
 SOUTH COOK COUNTY / WILL COUNTY RESTRUCTURING INITIATIVE SERVICE IMPROVEMENT GUIDE Working to Improve Your Commute Change has arrived for residents of south and southwest Cook County, in the form of improved
2 VALUE PROPOSITION VALUE PROPOSITION DEVELOPMENT
 2 VALUE PROPOSITION The purpose of the Value Proposition is to define a number of metrics or interesting facts that clearly demonstrate the value of the existing Xpress system to external audiences including
METRO TRANSIT a n n ua l re p o r t. madison, wisconsin // mymetrobus.com
 METRO TRANSIT 2016 a n n ua l re p o r t madison, wisconsin // mymetrobus.com metro transit In 2016, Metro Transit took steps to address capacity issues both on and off the road. Off the road, Metro began
Blue Ribbon Committee
 Blue Ribbon Committee February 26, 2015 Kick-off Meeting Blue Ribbon Committee 1 2,228 Metro CNG Buses 170 Bus Routes 18 are Contract Lines Metro Statistics 2 Transitway Lines (Orange/Silver Lines) 20
Utah Transit Authority Rideshare. CTAA Conference June 12, 2014
 Utah Transit Authority Rideshare CTAA Conference June 12, 2014 UTA Statistics and Info A Public Transit Agency Six counties, about 1600 square miles Within this area is 80% of the state s population, an
Parking Management Element
 Parking Management Element The State Transportation Planning Rule, adopted in 1991, requires that the Metropolitan Planning Organization (MPO) area implement, through its member jurisdictions, a parking
DECEMBER The Public Transportation Network in Northeastern Illinois: An Analysis of Existing Conditions
 DECEMBER 2013 The Public Transportation Network in Northeastern Illinois: An Analysis of Existing Conditions Table of Contents 3 Introduction 4 Funding 6 Spending 9 System Reach 12 Ridership 16 Conclusion
is being pushed by the locomotive, which reduces the number of seats in that car.
 Commuter rail is passenger rail service that is designed to transport large volumes of passengers over long distances in a fast and comfortable manner. The primary market for commuter rail service is usually
NEW YORK SUBURBAN RAIL SUMMARY (COMMUTER RAIL, REGIONAL RAIL)
") NEW YORK SUBURBAN RAIL SUMMARY (COMMUTER RAIL, REGIONAL RAIL) October 2003 New York: The New York commuter rail service area consists of 20.3 million people, spread over 4,700 square miles at an average
NEW YORK SUBURBAN RAIL SUMMARY (COMMUTER RAIL, REGIONAL RAIL) October 2003 New York: The New York commuter rail service area consists of 20.3 million people, spread over 4,700 square miles at an average
Waco Rapid Transit Corridor (RTC) Feasibility Study
 Feasibility Study") Waco Rapid Transit Corridor (RTC) Feasibility Study Chris Evilia, Director of Waco Metropolitan Planning Organization Allen Hunter, General Manager Waco Transit System Jimi Mitchell, Project Manager AECOM
Waco Rapid Transit Corridor (RTC) Feasibility Study Chris Evilia, Director of Waco Metropolitan Planning Organization Allen Hunter, General Manager Waco Transit System Jimi Mitchell, Project Manager AECOM
Draft Results and Recommendations
 Waco Rapid Transit Corridor (RTC) Feasibility Study Draft Results and Recommendations Chris Evilia, Director of Waco Metropolitan Planning Organization Allen Hunter, General Manager Waco Transit System
Bi-County Transitway/ Bethesda Station Access Demand Analysis
 Bi-County Transitway/ Bethesda Station Access Demand Analysis Prepared for: Washington Metropolitan Area Transit Authority Office of Planning and Project Development May 2005 Prepared by: in conjunction
The South Waterfront District and the Portland Aerial Tram
 The South Waterfront District and the Portland Aerial Tram How infrastructure investment can catalyze redevelopment and remove barriers to healthy lifestyles Role of transportation infrastructure in creating
Frequent Service Network Proposal
 Frequent Service Network Proposal Presented to Capital Metro Operations, Safety and Planning Committee January 12, 2015 1 capmetro.org Ten Actions to Grow Transit Grow Transit First and Last Mile Frequent
Tempe Streetcar. March 2, 2016
 Tempe Streetcar March 2, 2016 Tempe Profile 40 sq. miles, highest density in state University Town, center of region Imposed growth boundaries (density increase) Mixed use growth/intensifying land use
Presentation A Blue Slides 1-5.
 Presentation A Blue Slides 1-5. 1 Presentation A Blue Slides 1-5. 2 Presentation A Blue Slides 1-5. 3 Presentation A Blue Slides 1-5. 4 Presentation A Blue Slides 1-5. 5 Transit Service right. service
Alternative Transportation Options:
 Alternative Transportation Options: an Overview and Look at Feasibility ISSUES TO CONSIDER a White Paper July 2016 Charleston Metro Chamber of Commerce charlestonchamber.net Alternative Transportation
Office of Transportation Bureau of Traffic Management Downtown Parking Meter District Rate Report
 Office of Transportation Bureau of Traffic Management 1997 Downtown Parking Meter District Rate Report Introduction The City operates approximately 5,600 parking meters in the core area of downtown. 1
Proposed Revised Network Presented 10/17/2017. Kitsap Transit Board Workshop October 17, 2017
 Kitsap Transit Board Workshop October 17, 2017 Agenda Revised Route Network: What We Heard Service Options Phase 2 Public Outreach Wrap Up and Next Steps TRANSFORM Comprehensive TRANSIT: Route Let s Analysis
Draft Results and Open House
 Waco Rapid Transit Corridor (RTC) Feasibility Study Draft Results and Open House Chris Evilia, Director of Waco Metropolitan Planning Organization Allen Hunter, General Manager Waco Transit System Jimi
The Preferred Alternative: a Vision for Growth on the Northeast Corridor
 A Long-Term Vision is Needed The Preferred Alternative: a Vision for Growth on the Northeast Corridor The Federal Railroad Administration (FRA) has released the Tier 1 Final Environmental Impact Statement
High Quality Service through Continuous Improvement st Quarter Performance Report
 High Quality Service through Continuous Improvement 6 st Quarter Performance Report TriMet Board Meeting May 5, 6 Quality is a never ending quest and continuous improvement is a never ending way to discover
COMMUNITY REPORT FISCAL YEAR We are making progress, are you on board? GOLD COAST TRANSIT DISTRICT
 FISCAL YEAR 178 GOLD COAST TRANSIT DISTRICT COMMUNITY REPORT We are making progress, are you on board? OJAI OXNARD PORT HUENEME VENTURA COUNTY OF VENTURA GENERAL MANAGER S MESSAGE STEVEN P. BROWN DEAR
CLRP. Performance Analysis of The Draft 2014 CLRP. Long-Range Transportation Plan For the National Capital Region
 NATIONAL CAPITAL REGION TRANSPORTATION PLANNING BOARD Item 12 CLRP Financially Constrained Long-Range Transportation Plan For the National Capital Region 2014 Performance Analysis of The Draft 2014 CLRP
Metro Reimagined. Project Overview October 2017
 Metro Reimagined Project Overview October 2017 Reimagining Metro Transit Continuing our Commitment to: Provide mobility based on existing and future needs Value the role of personal mobility in the quality
Charlotte-Mecklenburg Region Rapid Transit and Land-Use Integration
 Charlotte-Mecklenburg Region Rapid Transit and Land-Use Integration Legislative Committee on Urban Growth and Infrastructure Carolyn Flowers CEO Charlotte Area Transit System March 23, 2010 Charlotte Region
Policy Note. Vanpools in the Puget Sound Region The case for expanding vanpool programs to move the most people for the least cost.
 Policy Note Vanpools in the Puget Sound Region The case for expanding vanpool programs to move the most people for the least cost Recommendations 1. Saturate vanpool market before expanding other intercity
Aren t You Really a Mobility Agency? Why The Vanpool Works for Transit
 Aren t You Really a Mobility Agency? Why The Vanpool Works for Transit Presenter: Kevin Coggin, Coast Transit Authority, Gulfport, MS Presenter: Lyn Hellegaard, Missoula Ravalli TMA, Missoula, MT Moderator:
Point A Point B Point C Point D. Fulton County Board of Commissioners and Mayors Meeting December 14, 2017
 Fulton County Board of Commissioners and Mayors Meeting December 14, 2017 Master Plan Overview Phase 1 Community Vision and Existing Transit Conditions Phase 2 Scenario Development Phase 3 Transit Master
7 Mass Transit. 7.1 Existing Conditions. 7.2 Transit
 7 Mass Transit 7.1 Existing Conditions Rural public transportation presents a unique challenge. Long trips and low population densities mean that it is a challenge to get sufficient ridership to support
Strategic Plan Performance Metrics & Targets
 San Francisco Municipal Transportation Agency Strategic Plan Performance Metrics & Targets Fiscal Year 2019 Fiscal Year 2020 April 3, 2018 SAFETY Goal 1: Create a safer transportation experience for everyone.
Sound Transit Operations July 2016 Service Performance Report. Ridership
 Ridership Total Boardings by Mode Mode Jul-15 Jul-16 % YTD-15 YTD-16 % ST Express 1,618,779 1,545,852-4.5% 10,803,486 10,774,063-0.3% Sounder 333,000 323,233-2.9% 2,176,914 2,423,058 11.3% Tacoma Link
JOINT FACILITIES ADVISORY COMMISSION. ART and APS Bus Parking Informational Session July 27, :30 pm
 ART and APS Bus Parking Informational Session July 27, 2017 7 8:30 pm 2 Agenda Introductions & overview APS Bus Parking APS Bus Facts APS Bus Operations ART Bus Parking Story of ART and its role in County
LADOT Enhancing Transit Services through Competitive Bidding
 LADOT Enhancing Transit Services through Competitive Bidding Corinne Ralph, Chief of Transit Programs City of Los Angeles Department of Transportation October 1, 2018 LADOT Vision Los Angeles will have
Figure 2-14: Existing Bus Routing at Irwindale Station
 494 W oothill Blvd 69 N Irwindale Ave 185 Irwindale E 1st St 3 6 feet igure 2-14: Existing Bus Routing at Irwindale 39 Proposed Bus Route 494 W oothill Blvd Proposed Discontinued Bus Route Proposed New