|
|
|
- Cory Wheeler
- 6 years ago
- Views:
Transcription


1
2
, TRE commuter rail")
.")
3 Texas is one of the fastest growing states in the country, and Fort Worth and Tarrant County are among the fastest growing places in Texas. The T has taken important steps to improve transit service to support this growth; recent improvements have included the downtown Fort Worth Intermodal Transportation Center (ITC), TRE commuter rail service between Fort Worth and Dallas, the Spur* premium bus service, and additional bus service. The next major capital improvement will be new TEX Rail service between Fort Worth and Dallas-Fort Worth International Airport (DFW). Still, growth in Tarrant County has outpaced these improvements and general growth of the transit system. The T Master Plan is the vision for transit in Tarrant County and beyond. The plan will recommend the actions needed for The T to provide great transit service over the next 20 years, with a particular focus on what can be accomplished in the next five years. The T Master Plan will look at the transit service that exists today, identify the opportunities to expand transit service to meet the growing needs of the region, and determine how to make it all happen. Ultimately, the plan will provide a blueprint for transit improvements designed make Tarrant County a better place to live and do business. The State of the System Report provides an overview of existing transit services, current and future transit demand, an assessment of how well The T s current services meet that demand, and the issues that The T must address to develop a great transit system. Major issues include: Fort Worth has grown from a small city to a medium-sized city in a major metropolitan area. However, the area s population and employment have grown much faster than The T s system. Tarrant County s population will continue to grow, and increasing shares of older adults, Millennials, and minority residents will contribute to much higher demand for transit service. Limited avenues of funding, especially from local sources, have long constrained The T s ability to increase and expand transit service. Fort Worth and Tarrant County will continue to grow rapidly much more rapidly than The T will be able to expand service based on current funding levels.. Transit investment in the Fort Worth area is much lower than in most current peer cities. Consequently, service levels and transit ridership are also lower. Even more importantly, Fort Worth and Tarrant County are growing rapidly and becoming a region that will have significantly greater transit needs. In comparison to cities that are already like what Fort Worth is growing to become, transit investment lags even more significantly.

4 The T s services are very limited in terms of how frequently it operates and the hours that it operates. As a result, transit is not a convenient or attractive option for many of the county s residents and employees who have other options. Most of The T s services are provided within the I-820 loop, yet much of the county s recent growth has been to the north, northeast, and east of the loop. There is a significant and growing demand for transit in these areas, but very little service. Throughout the country, there has been an increased emphasis on the development of new types of higher-quality transit services. These include commuter rail, light rail, Bus Rapid Transit, Rapid Bus, streetcar, and more. As indicated by the development of TRE, Molly the Trolley, and the Spur* rapid bus line, The T has already started to develop premium services. However, with those exceptions, many of The T s most important bus routes continue to provide regular local service. Experience from nearby Dallas and throughout the country shows that the development of premium transit service will attract more riders and a much broader cross-section of an area s population. Major transit investments will be needed to address the issues described above and to develop a more robust system that will be attractive to a much broader cross-section of Tarrant County s residents, workers, and visitors. The input from stakeholders that has been received as part of this project (and particularly during stakeholder interviews) indicates that many view the services provided by The T as being only for those without other options, particularly low-income residents and people with disabilities, and not for the broader population. This perception reflects reality to a certain extent and is a consequence of the issues described above. The T operates a network of bus services that generally radiate outward from downtown Fort Worth to serve areas largely within the I-820 loop, plus complementary paratransit services. Through partnerships with public and private organizations, The T is also involved in the provision of TRE services between Fort Worth and Dallas, TRE feeder service between Arlington and TRE, and shuttle service between DFW and Grapevine. The services that The T directly provides include: 41 weekday fixed-route bus routes, including an enhanced bus line called the Spur*, that serve residents primarily in the city of Fort Worth and small surrounding communities. Door-to-door demand response service, called Mobility-Impaired Transportation Service (MITS), which provides service to those who are unable to use fixed-route service. The services that The T provides through partnerships include: TRE commuter rail service between Fort Worth and Dallas, which is jointly operated with Dallas Area Rapid Transit (DART).
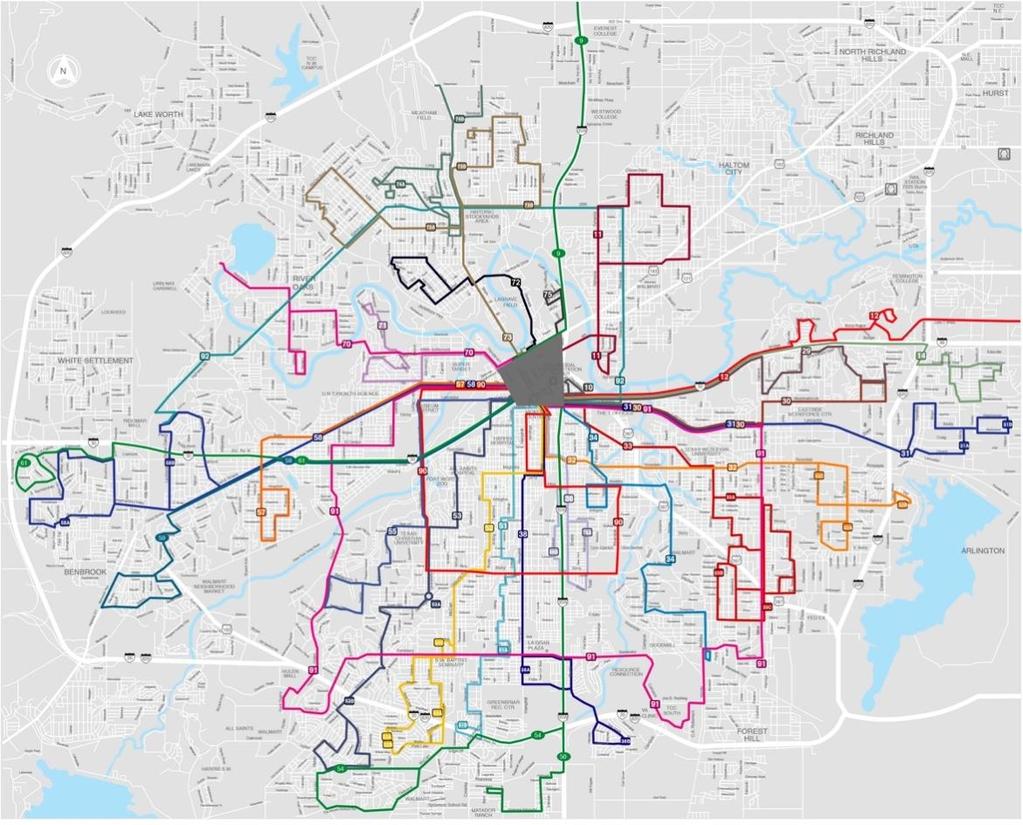
5 Metro ArlingtonXpress (MAX) service that provides feeder service between Arlington and TRE s CentrePort Station. This service is provided through a partnership between The T, the City of Arlington, the Arlington Chamber of Commerce, DART, and the University of Texas at Arlington (UTA). The Grapevine shuttle between DFW and Grapevine, which is provided through a partnership between The T and the City of Grapevine. There are significant mismatches between transit demand and supply. When The T was established in 1983, nearly all demand was within the I-820 loop; thus, The T focused its services in that area. However, as Fort Worth and Tarrant County have grown, development and transit demand have grown outward primarily to the east and northeast as Fort Worth and Dallas have grown closer together. While DART has expanded its services aggressively as Dallas County has grown, the geographic scope of The T s services have remained largely within the I-820 loop. This has been the case because only three communities (Fort Worth, Richland Hills, and Blue Mound) are members of The T. Even within its member communities, The T s ability to expand its services to match growth has been constrained by lower sales tax revenues (0.5% versus 1.0% for DART). As a result, service is only provided to a minority of Tarrant County s residents and workers. At present, there are several areas with significant demand for transit that are unserved or only minimally served (see Figure ES-1). By 2035, transit demand outside of I-820 will be similar to within it (see Figure ES-2). Areas with significant transit demand but little or no service include much of the eastern half of the county, generally located in an arc east of I-35W to north and east of Route 287, in and around: Arlington DFW Airport Grapevine Richland Hills/North Richland Hills Bedford/Euless and around Texas Health Harris Methodist Hospital White Settlement/Naval Air Station/Joint Reserve Base Just to meet current transit demands, The T will need to significantly expand service to new areas, provide more frequent service, and provide earlier and later service. Looking forward to 2035, The T will need to grow rapidly just to match the county s population and employment growth. Additionally, it is almost certain that transit demand will grow even faster than population and employment because new development is projected to be denser. Denser development, in turn, will enable the provision of better transit and increase the demand for transit at proportionally higher rates. Societal changes, such as greater preferences among Millennials to use transit and the desire by Baby Boomers to remain independent, will also increase transit demand. Through 2035: Demand will significantly increase in downtown Fort Worth, as well as neighborhoods to the west and southwest. These areas are projected to have combined population and employment levels that would support very frequent service. The demand for transit in Arlington and immediately surrounding areas will increase dramatically, and there will be demand for frequent service in and around downtown and UTA. Demand for transit will emerge or significantly grow in areas to the northeast, including Richland Hills, North Richland Hills, Euless, Bedford, and Grapevine, including DFW. Demand will also emerge in southwest Fort Worth near Hulen Mall and along I-20.


6 Note: These maps indicate underlying transit demand on a block group basis, and all routes serve many block groups. As a result, the amount of service that must be provided to serve multiple block groups is higher than indicated for a single block group.
7 A peer review was conducted to compare The T s performance with that of transit systems in three sets of peer cities/urban areas. These included: 1. Current peers, which represent other urban areas that are similar to Fort Worth as it is today 2. Aspirational peers, which are cities that today are similar to what Fort Worth is growing to become 3. Other large Texas transit systems, to account for the unique characteristics and challenges related to providing transit service in Texas This peer review reveals that transit investment in the Fort Worth area is much lower than in most current peer cities. Consequently, transit ridership is also lower. Even more importantly, Fort Worth and Tarrant County are growing rapidly and becoming a region that will have significantly greater transit needs. In comparison to cities that are already like what Fort Worth is growing to become, transit investment lags even more significantly. Compared to its current peers, the service that The T provides is generally well below average. Among the 15 transit systems in the current peer areas, Fort Worth ranks: 11 th in terms of operating funding per capita Second to last in terms of the amount of service provided per capita Last in terms of transit ridership per capita Compared to the aspirational peers and other major Texas systems, Fort Worth ranks last in all three measures, and usually by a large margin. Compared to other major Texas transit systems the differences are particularly stark (see Figure ES-3). Operating Funding per Capita Annual Service Hours per Capita Ridership per Capita Dallas $ Austin 1.6 Austin 38.8 Austin $ Dallas 1.3 San Antonio 29.6 Peer Average $ Peer Median 1.2 Peer Median 29.1 Peer Median $ San Antonio 1.2 Dallas 29.1 Houston $ Peer Average 1.2 Peer Average 26.0 San Antonio $98.26 Houston 1.2 Houston 22.9 Fort Worth $71.32 Fort Worth 0.7 Fort Worth 9.5 $0 $100 $200 $
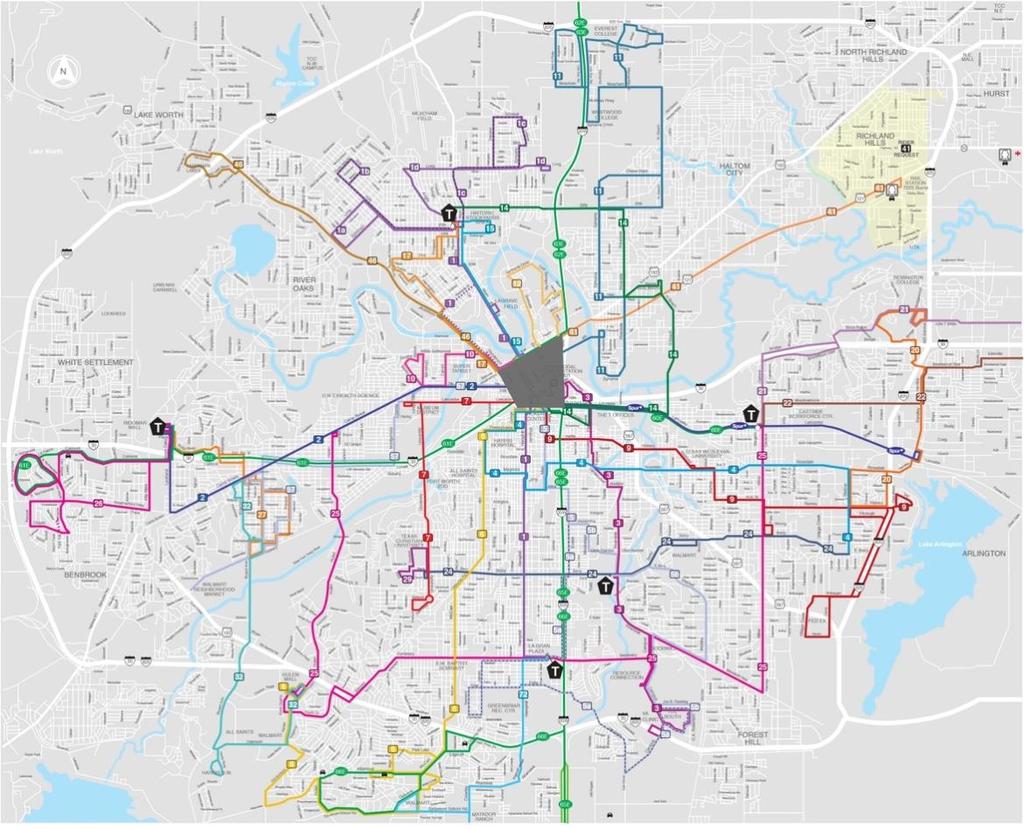
8 Population (thousands) Tarrant County has grown significantly in the last 30 years, and is projected to continue growing for the next 30 years as well. Since 1980, Fort Worth s population has doubled from 400,000 to 800,000 people. Between 2000 and 2013 alone, the city of Fort Worth grew by 42% and ranked as the fastest-growing city in the U.S. with a population of more than 500,000. Looking forward, rapid growth will continue. By 2040, Tarrant County s population is projected to increase by another 40%, from 1.8 million to 2.5 million (see Figure ES-4). 3,000 2,500 Tarrant County Projected Population Growth 2.5 million 2,000 1, million 1, Despite the ongoing growth in Tarrant County, The T s bus system has remained relatively unchanged during this time. As shown in Figure ES-5, individual routes have changed over time but the amount of service coverage has not changed substantially most service is still limited to within the I-820 loop, with little service outside this boundary. Looking forward, The T will need to grow rapidly just to match the county s population and employment growth. Additionally, it is almost certain that transit demand will grow even faster than population and employment. The projected higher density of future development will enable the provision of better transit and will increase the demand for transit at proportionally higher rates. Upward ridership and productivity trends in The T s services already show that more people are looking to transit as a viable option to meet their transportation needs.


9
10 Changing demographics are also driving demand for more and better transit, in particular due to three key groups: Baby Boomers, who are aging and desire to drive less and use transit more. Millennials, who have a very strong desire to use the most convenient travel option for different types of trips rather than driving everywhere. In particular, Millennials want to use transit and other options more and to drive less. Minorities, including immigrants, who traditionally use transit to a much greater extent than other populations. Because demand is also increasing from within existing populations, transit demand has been growing and will continue to grow faster than underlying population growth. Baby Boomers are quickly growing older. Many want to age in place, and most are remaining active for much longer. However, as with older adults before them, they have a greater desire and need to use transit than middle-aged residents. In Tarrant County, the population of residents age 65 and older is projected to increase by 174% by 2040, far more than any other age group in the county (see ES-6). 65 and older 174% % % Younger than 20 18% 0% 50% 100% 150% 200% Population Increase Throughout the United States, Millennials are driving demand for better transit. The cities of Dallas and Fort Worth were recently ranked among the best cities for Millennials in the country. 1 The Metroplex is growing, and a large share of that growth 31% between 2010 and 2040 is projected to come from Millennials, the population between 20 and 35 years of age. Looking forward, better transit options will be crucial to attracting and retaining Millennials in Fort Worth and Tarrant County. Minority residents use transit to a greater extent than non-minority residents. One major reason for this is that minority residents, on average, have lower incomes, and transit provides a much more affordable travel option than private automobiles. In addition, many minority residents are new immigrants, who come from places where transit is much more commonly used. 1 Forbes Magazine, Best Cities and Neighborhoods for Millennials, April 14, 2014.
11 % of Population 60% 52% 40% 41% 34% 27% 20% 15% 15% 7% 10% 0% White Hispanic Black Other The vast majority of The T s revenue comes from local sales taxes. The T receives dedicated revenue from a ½-cent sales tax administered in its member communities. This sales tax is a significant source of revenue for The T, representing approximately 41% of total revenue for service operations. In 2015, revenues are projected to total about $157 million. However, only three of the 41 municipalities in Tarrant County are full members of The T. 2 This limited membership impedes the ability of The T to provide more comprehensive regional service in Tarrant County and also limits the amount of revenue that The T receives. Compared to other transit agencies in Texas that generate revenue through local sales taxes, The T s 0.5% tax rate is at the low end of the range (see Table ES-1). Furthermore, the small number of member communities presents an additional funding challenge. Meeting the increasing demand for transit service in Tarrant County may rely on adding more communities as members as well as bolstering operating funds with additional sources of revenue. 2 Grapevine is a partial member and contributes funding for planned TEX Rail service.
12 The limited amount of funding that The T receives translates to lower levels of service than may be expected within a service area of its size. Although The T s service area population is slightly smaller than that of the larger transit systems in Texas, the amount of service that it provides to its population is a fraction of that offered by other systems. For example, the Fort Worth service area is about 83% of Austin s in terms of population, but it has only 60% of the vehicles and provides only 60% of the service in terms of service mileage (see Table ES-2). As a result, The T carries only one quarter of Austin s ridership. Compared to the major transit systems in Texas, The T provides proportionately less service based on its size and, as a result, carries significantly less ridership. The T provides generally comprehensive service coverage in Fort Worth and within the I-820 loop. However, service frequencies and hours of service are very limited. Beyond the loop, where much of the county s growth has occurred, there is very little service. The combination of these factors means that service is either not attractive or not available to a broad cross-section of Tarrant County s population. The T operates 41 routes on weekdays, in addition to the Molly the Trolley downtown circulator and the TCU Shuttle service. Excluding peak-only Express and Limited services, there are 26 routes that operate throughout the day and into the evening during weekdays. Significantly fewer routes operate on weekends: 25 routes operate on Saturday, and 16 run on Sunday. Most riders consider service that operates every 10 minutes or less as very convenient, and service that operates every 15 minutes or less as relatively convenient. Conversely, service that operates every 30 minutes or more becomes too infrequent for most people who have other travel options, such as driving. The lack of frequent service is one of the major issues facing The T only four routes provide service every 15 minutes or better throughout the day on weekdays. The hours that service operates during the day is another factor that strongly influences the convenience of a transit system. The T s services operate for more limited hours than in most major metropolitan areas, with most routes ending service by 8:00 p.m. Viewed together with the service frequencies described above, The T s service operates neither frequently enough nor late enough to provide the flexibility that most riders with other options require. This limited service makes it difficult for riders or potential riders with alternative schedules or second- and third-shift employment. It also poses a challenge to those who would use transit to reach social or entertainment activities in the evening if service were available.

.")

13 The T s service is almost entirely located within the I-820 loop around Fort Worth. Consequently, The T s service is currently most useful for those who both live and work within I-820 and is very limited for those who need to travel to or from areas outside of this loop. The major reason that The T does not provide more service in these areas is because, as described above, most communities are not members of The T. The consequence is that there are significant mismatches between transit demand and supply, including large areas with demand but little or no service (as shown earlier in Figure ES-1). Just to meet current transit demands, The T will need to significantly expand service to new areas, provide more frequent service, and provide earlier and later service. Looking forward, these mismatches will only increase. Projections indicate that rapid growth will continue in areas beyond the loop, and by 2035, transit demand will generally be as high as within the loop (as shown earlier in Figure ES-2). Throughout the country, there has been an increased emphasis on the development of new types of higher quality transit services. These include commuter rail, rapid transit, light rail, Bus Rapid Transit (BRT), Rapid Bus, streetcar, and more. The T has already started to develop premium services, such as TRE commuter rail, Molly the Trolley, and the Spur* rapid bus line. However, with those exceptions, many of The T s most important bus routes continue to provide regular local service. To develop a great transit system, The T and its regional partners will need to significantly expand efforts to develop premium services. The development of a High Capacity Transit Network of BRT, Rapid Bus, and other high quality services, as seen in other cities, would make it convenient to travel throughout Tarrant County by transit. While the specific types of high-quality services that would be included in this network have not yet been determined, a High Capacity Transit Network consisting of premium services will be a key element in developing more compelling transit service. Largely due to the issues described above, The T is viewed as providing transit service only for those without other options, particularly low-income residents and people with disabilities, and not for a broad cross-section of Tarrant County s residents, workers, and visitors. As a tacit reflection of this, many of the
14 newer services that The T has developed have been branded primarily as something other than The T. Examples include TRE, Molly the Trolley, MAX in Arlington, and planned TEX Rail service. The services that use different brands are viewed more favorably by many, and to this extent, the unique branding efforts have been successful. However, the use of different brands also means that many potential riders view available services as separate from the overall system. As a result, the whole is not greater than the sum of its parts. With the development of a stronger system, The T will need to address this image problem. Potential solutions include strengthening The T brand, rebranding other services to better identify them with The T, or developing a new brand altogether. The T has maintained and added services as its resources have allowed. In recent years, those improvements have included the Spur* service, Molly the Trolley, TRE (and forthcoming TEX Rail), and the Intermodal Transportation Center. However, The T s resources have not nearly kept pace with the county s growth and the demand for better transit. As a result, Fort Worth has become a much larger city in a major metropolitan area, but it has a transit system designed to serve a small city. In addition, demographic and attitudinal changes mean that the demand for better transit is growing faster than just population or employment. Baby boomers who are growing older want to drive less and take transit more. Millennials want many more travel choices but are particularly interested in better transit. Minorities who traditionally use transit in very high numbers will comprise most of the county s population by The T needs to catch up with the growth that has already occurred as well as continue to expand at a faster pace to keep up with projected growth in Tarrant County. To achieve this, major transit investments will be needed, both to address the issues described above and to develop a more robust system that will be attractive to a much broader cross-section of Tarrant County s residents, workers, and visitors.
Tarrant County Projected Population Growth
 Based on the information provided in the preceding chapters, it is apparent that there are a number of issues that must be addressed as The T works to develop an excellent transit system for Fort Worth
 Page Texas is one of the fastest growing states in the country, and Fort Worth and Tarrant County are among the fastest growing places in Texas. Since 1980, Fort Worth s population has doubled from 400,000
STATE OF THE MTA SYSTEM REPORT EXECUTIVE SUMMARY
 NASHVILLE MTA/RTA STRATEGIC NASHVILLE MTA STRATEGIC PLAN PLAN STATE OF THE MTA SYSTEM REPORT EXECUTIVE SUMMARY Overview Since 1965, the Nashville region has grown from approximately 750,000 residents to
Click to edit Master title style
 Nelson/Nygaard Consulting Associates SERVICE IMPROVEMENT STRATEGIES September 22, 2015 1 PROJECT OVERVIEW & WORK TO DATE 1. Extensive stakeholder involvement Throughout 2. System and market assessment
UTA Transportation Equity Study and Staff Analysis. Board Workshop January 6, 2018
 UTA Transportation Equity Study and Staff Analysis Board Workshop January 6, 2018 1 Executive Summary UTA ranks DART 6 th out of top 20 Transit Agencies in the country for ridership. UTA Study confirms
Metropolitan Council Budget Overview SFY
 Metropolitan Council Budget Overview SFY 2016-2017 H T t ti C itt House Transportation Committee February 4, 2015 Transit connects us to the places that matter Transportation Needs Grow as the Region Grows
Service Quality: Higher Ridership: Very Affordable: Image:
 Over the past decade, much attention has been placed on the development of Bus Rapid Transit (BRT) systems. These systems provide rail-like service, but with buses, and are typically less expensive to
Proposed Program of Interrelated Projects
 DALLAS AREA RAPID TRANSIT Proposed Program of Interrelated Projects Federal Transit Administration Capital Investment Program Summer 204 INTRODUCTION The current federal transportation bill, Moving Ahead
Executive Summary October 2013
 Executive Summary October 2013 Table of Contents Introduction... 1 Rider Transit and Regional Connectivity... 1 Plan Overview... 2 Network Overview... 2 Outreach... 3 Rider Performance... 4 Findings...
5. OPPORTUNITIES AND NEXT STEPS
 5. OPPORTUNITIES AND NEXT STEPS When the METRO Green Line LRT begins operating in mid-2014, a strong emphasis will be placed on providing frequent connecting bus service with Green Line trains. Bus hours
Denver Car Share Program 2017 Program Summary
 Denver Car Share Program 2017 Program Summary Prepared for: Prepared by: Project Manager: Malinda Reese, PE Apex Design Reference No. P170271, Task Order #3 January 2018 Table of Contents 1. Introduction...
Mass Transit in Charlotte and San Antonio. Keith T. Parker, AICP
 Mass Transit in Charlotte and San Antonio Keith T. Parker, AICP President/CEO Presentation Overview Charlotte Agency and Customer Profile San Antonio Agency and Customer Profile Attracting New Customers
Vanpooling and Transit Agencies. Module 3: Benefits to Incorporating Vanpools. into a Transit Agency s Services
 Vanpooling and Transit Agencies Module 3: Benefits to Incorporating Vanpools into a Transit Agency s Services A common theme we heard among the reasons why the transit agencies described in Module 2 began
Parking Management Element
 Parking Management Element The State Transportation Planning Rule, adopted in 1991, requires that the Metropolitan Planning Organization (MPO) area implement, through its member jurisdictions, a parking
A Transit Plan for the Future. Draft Network Plan
 A Transit Plan for the Future Draft Network Plan Project Overview and Status Completed Market Analysis and Service Evaluation. Developed Plan Framework and Guiding Principles. Developed a draft Five Year
CITY OF LONDON STRATEGIC MULTI-YEAR BUDGET ADDITIONAL INVESTMENTS BUSINESS CASE # 6
 2016 2019 CITY OF LONDON STRATEGIC MULTI-YEAR BUDGET ADDITIONAL INVESTMENTS BUSINESS CASE # 6 STRATEGIC AREA OF FOCUS: SUB-PRIORITY: STRATEGY: INITIATIVE: INITIATIVE LEAD(S): BUILDING A SUSTAINABLE CITY
Building Equitable Sustainable Transit OPEN HOUSE
 Building Equitable Sustainable Transit OPEN HOUSE Getting Around In Southeast Michigan Southeast Michigan Is Spread Out More Than Ever Before 1970 2010 POPULATION 35% 16% JOBS SE MICHIGAN DETROIT 42% 9%
TORONTO TRANSIT COMMISSION REPORT NO.
 Revised: March/13 TORONTO TRANSIT COMMISSION REPORT NO. MEETING DATE: March 26, 2014 SUBJECT: COMMUNITY BUS SERVICES ACTION ITEM RECOMMENDATION It is recommended that the Board not approve any routing
Tempe Streetcar. March 2, 2016
 Tempe Streetcar March 2, 2016 Tempe Profile 40 sq. miles, highest density in state University Town, center of region Imposed growth boundaries (density increase) Mixed use growth/intensifying land use
9. Downtown Transit Plan
 CORRADINO 9. Downtown Transit Plan KAT Transit Development Plan As part of the planning process for the TDP, an examination of downtown transit operations was conducted. The Downtown Transit Plan 1 is
Downtown Transit Connector. Making Transit Work for Rhode Island
 Downtown Transit Connector Making Transit Work for Rhode Island 3.17.17 Project Evolution Transit 2020 (Stakeholders identify need for better transit) Providence Core Connector Study (Streetcar project
Leadership NC. November 8, 2018
 v Leadership NC November 8, 2018 Planning for our region s growth The Triangle is one of the fastestgrowing regions in the nation. More than 2 million people are already part of the equation, and the
2 EXISTING ROUTE STRUCTURE AND SERVICE LEVELS
 2 EXISTING ROUTE STRUCTURE AND SERVICE LEVELS In the Study Area, as in most of the Metro Transit network, there are two distinct route structures. The base service structure operates all day and the peak
TRANSIT FEASIBILITY STUDY Town of Bradford West Gwillimbury
 TRANSIT FEASIBILITY STUDY Town of Bradford West Gwillimbury Open House Presentation January 19, 2012 Study Objectives Quantify the need for transit service in BWG Determine transit service priorities based
PEACHTREE CORRIDOR PARTNERSHIP. Current Status & Next Steps
 PEACHTREE CORRIDOR PARTNERSHIP Current Status & Next Steps PEACHTREE CORRIDOR PARTNERSHIP Why Peachtree? Why Now? I. THE CONTEXT High Level View of Phasing Discussion Potential Ridership Segment 3 Ease
Speaker Information Tweet about this presentation #TransitGIS
 Making the Case for Transit: the Transit Competitiveness Index Title William E. Walter, GISP Speaker Information Tweet about this presentation #TransitGIS Understanding Conditions in Each Travel Market
The Engineering Department recommends Council receive this report for information.
 CORPORATE REPORT NO: R161 COUNCIL DATE: July 23, 2018 REGULAR COUNCIL TO: Mayor & Council DATE: July 19, 2018 FROM: General Manager, Engineering FILE: 8740-01 SUBJECT: Surrey Long-Range Rapid Transit Vision
MARTA s blueprint for the future. COFFEE AND CONVERSATION Kyle Keahey, More MARTA Atlanta Dec. 5, 2018
 MARTA s blueprint for the future COFFEE AND CONVERSATION Kyle Keahey, More MARTA Atlanta Dec. 5, 2018 TODAY S AGENDA About MARTA Economic development/local impact More MARTA Atlanta program Program summary/timeline
Metro Reimagined. Project Overview October 2017
 Metro Reimagined Project Overview October 2017 Reimagining Metro Transit Continuing our Commitment to: Provide mobility based on existing and future needs Value the role of personal mobility in the quality
Car Sharing at a. with great results.
 Car Sharing at a Denver tweaks its parking system with great results. By Robert Ferrin L aunched earlier this year, Denver s car sharing program is a fee-based service that provides a shared vehicle fleet
REPORT CARD FOR CALIFORNIA S INFRASTRUCTURE WHAT YOU SHOULD KNOW ABOUT CALIFORNIA S TRANSIT FACILITIES
 TRANSIT GRADE: C- WHAT YOU SHOULD KNOW ABOUT TRANSIT FACILITIES California needs robust, flexible and reliable transit systems to reduce peak congestion on our highways, provide options for citizens who
Whither the Dashing Commuter?
 Whither the Dashing Commuter? The MTA in a Changing Region William Wheeler Director of Special Project Development and Planning Travel in the New York Region has changed from the days of the 9 to 5 commute
EUGENE-SPRINGFIELD, OREGON EAST WEST PILOT BRT LANE TRANSIT DISTRICT
 EUGENE-SPRINGFIELD, OREGON EAST WEST PILOT BRT LANE TRANSIT DISTRICT (BRIEF) Table of Contents EUGENE-SPRINGFIELD, OREGON (USA)... 1 COUNTY CONTEXT AND SYSTEM DESCRIPTION... 1 SYSTEM OVERVIEW... 1 PLANNING
Transportation Demand Management Element
 Transportation Demand Management Element Over the years, our reliance on the private automobile as our primary mode of transportation has grown substantially. Our dependence on the automobile is evidenced
CITY of GUELPH Transit Growth Strategy and Plan, Mobility Services Review. ECO Committee
 CITY of GUELPH Transit Growth Strategy and Plan, Mobility Services Review ECO Committee July 19, 2010 1 Study Purpose Vision and growth strategy for Guelph Transit, ensuring broad consultation Operational
Kenosha-Racine-Milwaukee (KRM)
") Kenosha-Racine-Milwaukee (KRM) Commuter Rail #147925 November 6, 2009 1 Guidance of KRM Commuter Rail Studies Intergovernmental Partnership Technical Steering Committee Temporary and Limited Authority
Kenosha-Racine-Milwaukee (KRM) Commuter Rail #147925 November 6, 2009 1 Guidance of KRM Commuter Rail Studies Intergovernmental Partnership Technical Steering Committee Temporary and Limited Authority
6/6/2018. June 7, Item #1 CITIZENS PARTICIPATION
 June 7, 2018 Item #1 CITIZENS PARTICIPATION 1 Item #2 APPROVAL OF MINUTES Item #3 TRAC GOALS, FRAMEWORK & AGENDA REVIEW 2 COMMITTEE GOALS Learn about Southern Nevada s mobility challenges, new developments
Analysis of Radial and Trunk Feeder Transit System Configurations in Downtown Charlottesville
 Analysis of Radial and Trunk Feeder Transit System Configurations in Downtown Charlottesville 1. Introduction During the stakeholder input sessions of Charlottesville Area Transit s (CAT) Transit Development
Shared Mobility Action Plan Overview
 The image part with relationship ID rid3 was not found in the file. Shared Mobility Action Plan Overview July 2017 With support from Expanding the ecosystem of transportation choices by creating a multimodal
Valley Metro Overview. ITE/IMSA Spring Conference March 6, 2014
 Valley Metro Overview ITE/IMSA Spring Conference March 6, 2014 Valley Metro Who Are We? Operate Regional Transit Services Valley Metro and Phoenix are region s primary service providers Light Rail and
APPENDIX I: [FIXED-GUIDEWAY TRANSIT FEASIBILITY]
![APPENDIX I: [FIXED-GUIDEWAY TRANSIT FEASIBILITY]](/thumbs/83/87090921.jpg "APPENDIX I: [FIXED-GUIDEWAY TRANSIT FEASIBILITY]") APPENDIX I: [FIXED-GUIDEWAY TRANSIT FEASIBILITY] Jackson/Teton Integrated Transportation Plan 2015 Appendix I. Fixed-Guideway Transit Feasibility Jackson/Teton County Integrated Transportation Plan v2
APPENDIX I: [FIXED-GUIDEWAY TRANSIT FEASIBILITY] Jackson/Teton Integrated Transportation Plan 2015 Appendix I. Fixed-Guideway Transit Feasibility Jackson/Teton County Integrated Transportation Plan v2
GO Transit s deliverable: the 2020 Service Plan
 GO Transit s deliverable: the 2020 Service Plan GO Transit s 2020 Service Plan describes GO s commitment to customers, existing and new, to provide a dramatically expanded interregional transit option
FREQUENTLY ASKED QUESTIONS
 FREQUENTLY ASKED QUESTIONS 2018 What is the More MARTA Atlanta program? The More MARTA Atlanta program is a collaborative partnership between MARTA and the City of Atlanta to develop and implement a program
THE WILSHIRE CORRIDOR: RAIL AND ITS ALTERNATIVES. Prepared By: Jacki Murdock Transportation and Environmental Planner
 THE WILSHIRE CORRIDOR: RAIL AND ITS ALTERNATIVES Prepared By: Jacki Murdock Transportation and Environmental Planner December 13 th, 2012 Overview Characteristics of Wilshire Boulevard Overview of the
Rapid Transit and Land-Use Integration a Reality
 City of Charlotte Rapid Transit and Land-Use Integration a Reality Transportation Oversight Committee Carolyn Flowers CEO Charlotte Area Transit System April 29, 2010 Charlotte Region Statistics Mecklenburg
Presentation A Blue Slides 1-5.
 Presentation A Blue Slides 1-5. 1 Presentation A Blue Slides 1-5. 2 Presentation A Blue Slides 1-5. 3 Presentation A Blue Slides 1-5. 4 Presentation A Blue Slides 1-5. 5 Transit Service right. service
Public Meeting. City of Chicago Department of Transportation & Department of Housing and Economic Development
 Public Meeting City of Chicago Department of Transportation & Department of Housing and Economic Development Funded by Regional Transportation Authority September 12, 2011 In partnership with Presentation
METRO TRANSIT a n n ua l re p o r t. madison, wisconsin // mymetrobus.com
 METRO TRANSIT 2016 a n n ua l re p o r t madison, wisconsin // mymetrobus.com metro transit In 2016, Metro Transit took steps to address capacity issues both on and off the road. Off the road, Metro began
Chapter 7: Travel Demand Analysis. Chapter 8. Plan Scenarios. LaSalle Community Center. Image Credit: Town of LaSalle
 Chapter 7: Travel Demand Analysis Chapter 8 Plan Scenarios LaSalle Community Center. Image Credit: Town of LaSalle 164 Chapter 8: Plan Scenarios Moving Ahead for Progress in the 21 st Century Act (MAP
STRATEGIC PRIORITIES AND POLICY COMMITTEE MAY 5, 2016
 STRATEGIC PRIORITIES AND POLICY COMMITTEE MAY 5, 2016 Shift Rapid Transit Initiative Largest infrastructure project in the city s history. Rapid Transit initiative will transform London s public transit
4.0 TIER 2 ALTERNATIVES
 4.0 TIER 2 ALTERNATIVES The Tier 2 Alternatives represent the highest performing Tier 1 Alternatives. The purpose of the Tier 2 Screening was to identify the LPA utilizing a more robust list of evaluation
Sales and Use Transportation Tax Implementation Plan
 Sales and Use Transportation Tax Implementation Plan Transportation is more than just a way of getting from here to there. Reliable, safe transportation is necessary for commerce, economic development,
Needs and Community Characteristics
 Needs and Community Characteristics Anticipate Population and Job Growth in the City Strongest density of population and jobs in Ann Arbor are within the Study Area Population expected to grow 8.4% by
WAKE TRANSIT PLAN Summer 2018
 WAKE TRANSIT PLAN Summer 2018 Planning for growth WAKE COUNTY s population already exceeds ONE MILLION and grows by more than 60 people a day. That s 23,000 people a year or basically another Morrisville.
Executive Summary. Treasure Valley High Capacity Transit Study Priority Corridor Phase 1 Alternatives Analysis October 13, 2009.
 Treasure Valley High Capacity Transit Study Priority Corridor Phase 1 Alternatives Analysis October 13, 2009 Background As the Treasure Valley continues to grow, high-quality transportation connections
Summit County Greenhouse Gas Emissions Summary, 2017
 Summit County Greenhouse Gas Emissions Summary, 2017 In 2018, Summit County completed its first greenhouse gas inventory to better understand its emissions profile and to give insight to policies and programs
Executive Summary. Draft Environmental Impact Statement/Environmental Impact Report ES-1
 Executive Summary Introduction The Eastside Transit Corridor Phase 2 Project is a vital public transit infrastructure investment that would provide a transit connection to the existing Metro Gold Line
Frequent Service Network Proposal
 Frequent Service Network Proposal Presented to Capital Metro Operations, Safety and Planning Committee January 12, 2015 1 capmetro.org Ten Actions to Grow Transit Grow Transit First and Last Mile Frequent
CTfastrak Expansion. Stakeholder Meeting #4 Manchester Town Hall June 3, 2016
 CTfastrak Expansion Stakeholder Meeting #4 Manchester Town Hall June 3, 2016 Today s Agenda Phase I Update 2016 Service Plan Implementation Schedule & Cost Update Phase II Services Timeline Market Analysis
Independence Institute Denver West Parkway, Suite 185 Golden, Colorado i2i.org/cad.aspx BRT = BTR
 Independence Institute 14142 Denver West Parkway, Suite 185 Golden, Colorado 80401 303-279-6536 i2i.org/cad.aspx BRT = BTR Bus-Rapid Transit Is Better Than Rail: The Smart Alternative to Light Rail Joseph
West Broadway Transit Study. Community Advisory Committee September 17, 2015
 West Broadway Transit Study Community Advisory Committee September 17, 2015 Introductions Community Engagement Summer Outreach Fall Outreach Technical Analysis Process Update Alternatives Review Economic
CNG Strategy/Overview
 CNG Strategy/Overview JACKSONVILLE TRANSPORTATION Future of Transit AUTHORITY Managing Mobility Brad Thoburn Vice President, Planning, Development and Innovation CNG State Strategy/Overview of the Industry
August 2, 2010 Public Meeting
 Public Meeting LYMMO Expansion Alternatives Analysis Study Purpose of study is to provide a fresh look at potential LYMMO expansion, following Federal Transit Administration (FTA) Alternatives Analysis
QUALITY OF LIFE EXECUTIVE SUMMARY REPORT I O N S TAT I O N
 QUALITY OF LIFE EXECUTIVE SUMMARY REPORT UN I O N S TAT I O N T R AV E L by TR A I N Published September 2017 2015 PROGRESS MAP This document reports FasTracks progress through 2015 BACKGROUND RTD The
Policy Note. Vanpools in the Puget Sound Region The case for expanding vanpool programs to move the most people for the least cost.
 Policy Note Vanpools in the Puget Sound Region The case for expanding vanpool programs to move the most people for the least cost Recommendations 1. Saturate vanpool market before expanding other intercity
Green Line Long-Term Investments
 Enhancements Short-term improvements to keep Austin moving. Investments Long-term projects to support our future. Mobility Hubs MetroRapid MetroRail MetroExpress Connectors Circulators Project Connect
Appendix C: GAPS ANALYSIS
 Appendix C: GAPS ANALYSIS Appendix C Gaps Analysis While portions of Salt Lake City are well served by transit, some portions of the city experience a mismatch in the existing transit supply and current
UCLA Lake Arrowhead Conference. October 18, 2010
 BART Click to Capacity edit Master Overview title style for UCLA Lake Arrowhead Conference October 18, 2010 0 BART Basics 360,000 daily riders 104 miles 43 stations 1.3 billion annual passenger miles 1
BROWARD BOULEVARD CORRIDOR TRANSIT STUDY
 BROWARD BOULEVARD CORRIDOR TRANSIT STUDY FM # 42802411201 EXECUTIVE SUMMARY July 2012 GOBROWARD Broward Boulevard Corridor Transit Study FM # 42802411201 Executive Summary Prepared For: Ms. Khalilah Ffrench,
Shared Mobility Action Plan Overview July 2017
 Shared Mobility Action Plan Overview July 2017 With support from Expanding the ecosystem of transportation choices by creating a multimodal transportation system that works for all Connect public agencies
10/4/2016. October 6, Item #1 CITIZENS PARTICIPATION
 October 6, 2016 Item #1 CITIZENS PARTICIPATION 1 Item #2 APPROVAL OF MINUTES Item #3 WELCOME 2 Item #4 TRAC ROADWAY RECOMMENDATIONS UPDATE Item #4 Completed Jurisdiction Presentations Boulder City August
US 29 Bus Rapid Transit Planning Board Briefing. February 16, 2017
 US 29 Bus Rapid Transit Planning Board Briefing February 16, 2017 Project Goals Improve the quality of transit service Improve mobility opportunities and choices Enhance quality of life Support master
Utah Transit Authority Rideshare. CTAA Conference June 12, 2014
 Utah Transit Authority Rideshare CTAA Conference June 12, 2014 UTA Statistics and Info A Public Transit Agency Six counties, about 1600 square miles Within this area is 80% of the state s population, an
Point A Point B Point C Point D. Fulton County Board of Commissioners and Mayors Meeting December 14, 2017
 Fulton County Board of Commissioners and Mayors Meeting December 14, 2017 Master Plan Overview Phase 1 Community Vision and Existing Transit Conditions Phase 2 Scenario Development Phase 3 Transit Master
Regional Transportation Commission, Washoe County Lee Gibson, Executive Director Roger Hanson, Senior Planner
 Regional Transportation Commission, Washoe County Lee Gibson, Executive Director Roger Hanson, Senior Planner Presentation Outline Transit System Facts Economic Challenges in the Truckee Meadows RTC Transit
National Household Travel Survey Add-On Use in the Des Moines, Iowa, Metropolitan Area
 National Household Travel Survey Add-On Use in the Des Moines, Iowa, Metropolitan Area Presentation to the Transportation Research Board s National Household Travel Survey Conference: Data for Understanding
Background Information about the Metrobus 29 Lines Study
 Background Information about the Metrobus 29 Lines Study Questions Overview of Existing Service Q. Why is the study being conducted? A. The 29 Lines provide an important connection between Annandale and
The TDM Plan for Fort Washington Office Park NOVEMBER 1 6, 2017 FORT WASHINGTON OFFICE PARK STAKEHOLDERS
 The TDM Plan for Fort Washington Office Park NOVEMBER 1 6, 2017 FORT WASHINGTON OFFICE PARK STAKEHOLDERS What is Transportation Demand Management (TDM)? Sources: Philly.com, Montgomery County, GVF Location
is being pushed by the locomotive, which reduces the number of seats in that car.
 Commuter rail is passenger rail service that is designed to transport large volumes of passengers over long distances in a fast and comfortable manner. The primary market for commuter rail service is usually
BIRMINGHAM CONNECTED Anne Shaw Tuesday 20 January 2015
 BIRMINGHAM CONNECTED Anne Shaw Tuesday 20 January 2015 www.birmingham.gov.uk/connected Birmingham Connected Setting the context challenges in Birmingham The need for action The EU the SUMP process Strategy
April 2010 April 2010 Presented by Alan Eirls
 April 2010 April 2010 Presented by Alan Eirls A Partnership Between the Coeur d Alene Tribe, the State of Idaho, the KMPO, and Kootenai County. Current System The Citylink system began on the Coeur d Alene
The Case for. Business. investment. in Public Transportation
 The Case for Business investment in Public Transportation Introduction Public transportation is an enterprise with expenditure of $55 billion in the United States. There has been a steady growth trend
CEDAR AVENUE TRANSITWAY Implementation Plan Update
 CEDAR AVENUE TRANSITWAY Implementation Plan Update EECUTIVE SUMMARY DECEMBER 2015 Executive Summary In 2013, the Twin Cities metropolitan area s first bus rapid transit (BRT) line, the METRO Red Line,
NCTCOG MOD Workshop Toyota Motor North America (TMNA) and Denton County Transit Authority (DCTA)
 and Denton County Transit Authority (DCTA)") NCTCOG MOD Workshop Toyota Motor North America (TMNA) and Denton County Transit Authority (DCTA) DCTA: REGIONAL PARTNER TOYOTA SOCIAL INNOVATION Toyota aims to directly enable affordable, low emissions
NCTCOG MOD Workshop Toyota Motor North America (TMNA) and Denton County Transit Authority (DCTA) DCTA: REGIONAL PARTNER TOYOTA SOCIAL INNOVATION Toyota aims to directly enable affordable, low emissions
ITEM 9 Information October 19, Briefing on the Performance Analysis of the Draft 2016 CLRP Amendment
 ITEM 9 Information October 19, 2016 Briefing on the Performance Analysis of the Draft 2016 CLRP Amendment Staff Recommendation: Issues: Background: Receive briefing None The board will be briefed on a
Central Maryland Transit Development Plan
 Central Maryland Transit Development Plan Planning the Future of Transit in Our Region Anne Arundel County Transportation Commission December 13, 2017 Anne Arundel County Howard County Prince George s
Chicago Milwaukee Intercity Passenger Rail Corridor
 Chicago Milwaukee Intercity Passenger Rail Corridor Past, Present, and Future Arun Rao, Passenger Rail Manager Wisconsin Department of Transportation Elliot Ramos, Passenger Rail Engineer Illinois Department
Draft Results and Recommendations
 Waco Rapid Transit Corridor (RTC) Feasibility Study Draft Results and Recommendations Chris Evilia, Director of Waco Metropolitan Planning Organization Allen Hunter, General Manager Waco Transit System
Technological Viability Evaluation. Results from the SWOT Analysis Diego Salzillo Arriaga, Siemens
 Technological Viability Evaluation Results from the SWOT Analysis Diego Salzillo Arriaga, Siemens 26.04.2018 Agenda Study Objectives and Scope SWOT Analysis Methodology Cluster 4 Results Cross-Cluster
Bi-County Transitway/ Bethesda Station Access Demand Analysis
 Bi-County Transitway/ Bethesda Station Access Demand Analysis Prepared for: Washington Metropolitan Area Transit Authority Office of Planning and Project Development May 2005 Prepared by: in conjunction
Draft Results and Open House
 Waco Rapid Transit Corridor (RTC) Feasibility Study Draft Results and Open House Chris Evilia, Director of Waco Metropolitan Planning Organization Allen Hunter, General Manager Waco Transit System Jimi
2/1/2018. February 1, Item #1 CITIZENS PARTICIPATION
 February 1, 2018 Item #1 CITIZENS PARTICIPATION 1 Item #2 APPROVAL OF MINUTES Item #3 TRAC GOALS, FRAMEWORK & AGENDA REVIEW 2 COMMITTEE GOALS Learn about Southern Nevada s mobility challenges, new developments
ROCHESTER, MINNESOTA
 ROCHESTER, MINNESOTA Rochester Public Works TRANSIT AND PARKING DIVISION Transit and Parking Manager Tony Knauer tknauer@rochestermn.gov SERVICE ATTITUDE CONSISTENCY - TEAMWORK ROCHESTER TRANSIT & PARKING
MetroExpress Improvements
 Improvements Enhancements Short-term improvements to keep Austin moving. Investments Long-term projects to support our future. Mobility Hubs MetroRapid MetroRail Commuters Connectors Circulators Project
Charlotte-Mecklenburg Region Rapid Transit and Land-Use Integration
 Charlotte-Mecklenburg Region Rapid Transit and Land-Use Integration Legislative Committee on Urban Growth and Infrastructure Carolyn Flowers CEO Charlotte Area Transit System March 23, 2010 Charlotte Region
Driving change. Investing in the Future of London s Mobility
 Driving change. Investing in the Future of London s Mobility Transit suits today s pace of life. With ridership in London forecast to grow by 50% over the next 10 years, the current transit system will
TORONTO TRANSIT COMMISSION REPORT NO.
 Form Revised: February 2005 TORONTO TRANSIT COMMISSION REPORT NO. MEETING DATE: October 24, 2012 SUBJECT: DOWNTOWN RAPID TRANSIT EXPANSION STUDY (DRTES) PHASE 1 STRATEGIC PLAN ACTION ITEM RECOMMENDATIONS
Multnomah County Commission December 15, 2016
 Powell-Division Transit and Development Project Multnomah County Commission December 15, 2016 POWELL-DIVISION TRANSIT AND DEVELOPMENT PROJECT A partnership of Metro, TriMet, the cities of Portland and
TRAVEL DEMAND FORECASTS
 Jiangxi Ji an Sustainable Urban Transport Project (RRP PRC 45022) TRAVEL DEMAND FORECASTS A. Introduction 1. The purpose of the travel demand forecasts is to assess the impact of the project components
PUBLIC TRANSPORTATION
 PUBLIC TRANSPORTATION PROJECT TITLE U-MED DISTRICT MULTI-MODAL IMPROVEMENTS- PHASE II Transit Vehicles and Upgrades MUNICIPALITY OF ANCHORAGE Capital Improvement Program PROJECT LIST BY DEPARTMENT Public