BE A TOP QUALITY MULTI-MODAL PASSENGER TRANSPORTATION HUB
|
|
|
- Tyler Doyle
- 5 years ago
- Views:
Transcription


1 GOAL 1 BE A TOP QUALITY MULTI-MODAL PASSENGER TRANSPORTATION HUB Goal number one of the On the Move Plan focuses on being a top quality multi-modal passenger transportation hub. A multi-modal passenger hub includes automobiles, air, transit, passenger rail, bicycles, and walking. This section identifies the current distribution of modes among users in the region, cites recent studies relating to passenger mobility, and describes needs related to these modes. Mode Split Modal split refers to the proportion of total person trips using various specified modes of transportation. TMACOG compiled mode split data from the Census Transportation Planning Package (CTPP) that is based on 2000 Census long form data. An analysis of modal split in the TMACOG region based on daily work trips shows that the vast majority of commuters drive alone, at over 81 percent. Nearly 9 percent of the population uses a carpool to get to work with walking ranking third in the list at about 3.5 percent. Figures 1 and 2 show mode split comparisons. Figure 1: Mode Split Graph Overwhelmingly, the data shows that people prefer to use their car over mass transit options or alternative modes such as walking or biking. There are a variety of reasons for an individual s mode choice including time, availability of other options, cost, as well as personal freedom. As fuel costs have risen, indications are the individuals are expanding their trip-making options to include buses, bicycling, and walking. TARTA has indicated that bus ridership has increased as the price of gasoline has increased. However, it can be assumed that if prices decrease, so will ridership. 1
2 Average Trip Distance and Time Mode Number of Trips % of Total All Modes 162, % Drive Alone 132, % Carpool 14, % Bus 1, % Railroad % Bicycle % Walk 5, % Taxicab % Motorcycle % All others % Work at home 7, % Figure 2: Mode Split Table Average trip distances within the TMACOG planning region are computed from TMACOG s Travel Demand Model and reported based on a variety of trip purposes. Overall, the model estimates that commuters make 2 million trips daily in the region. Of those trips, over 1.9 million are automobile related and 12,000 utilize transit. Trip purposes can be grouped into four basic categories for analysis: home-based, non-homebased commercial vehicles, and trucks. Home-based trips are those that begin at home with a destination of either work, shopping, school or other unspecified destinations. Non-home-based trips begin somewhere other than at home, such as work or school, and can end either at work or at any possible location including home, shopping, a restaurant, or soccer practice. Commercial vehicles include all short haul trips made by shipping companies, delivery services, etc. Truck trips are all of the long haul trips that are made within the region. From the modeling data (Figure 3), the average distance traveled for any particular trip made within the TMACOG region is 8.5 miles. Home-based trips range from 5 miles for shopping trips to nearly 9 miles for work trips. Non-home-based trips are generally shorter than homebased trips, due largely to trip chaining, such as trips made to drop children off at daycare and then traveling to work. Commercial vehicle trips average less than 5 miles and truck trips have the highest average at over 12.5 miles. PURPOSE Avg Distance (miles) Home-Based Work 8.79 Home-Based Shopping 5.05 Home-Based School 7.92 Home-Based Other 5.62 Non-Home Based Work 6.22 Non-Home Based Other 4.5 Commercial Vehicles 4.89 Trucks Average, all trips 8.52 Figure 3: Average Trip Distance Table 2
3 What this data tells us is that people have to make longer trips to work than they are willing to make for shopping and other home-based trips. This is often by necessity but it still shows that when evaluating trade-offs for a new home purchase, people are still willing to make a longer trip to work and live in their desired area than to live somewhere deemed less desirable but have a shorter drive. Shopping has the lowest average among home-based trips indicating that people prefer to shop at locations relatively close to home. This can be seen in the locations of the region s major grocery chains. For example, in the urbanized area, most grocery stores are located within four to five miles of each other demonstrating shoppers are seldom willing to drive longer distances to make purchases. Journey to Work: Average Travel Time Time (Minutes) All Means Of Transportation Drove Alone 2-Person Carpool 3-Or-More-Person Carpool Bus Railroad Bicycle, Walk, Taxicab, Motorcycle Or Other Mode of Travel Figure 4: Average Travel Time to Work Graph Another measure of tripmaking tendencies to work is travel time. TMACOG analyzed data from the Census Transportation Planning Package which reported travel time for people who drove alone, drove in carpools of two or more people, rode a bus or a train, or who bicycled, walked, took a cab, rode a motorcycle or used some other transportation option (Figures 4 & 5). Within the City of Toledo and Lucas County, the average commute to work is 21 minutes. Mode All Means Of Transportation Drove Alone 2- Person Carpool 3-Or-More- Person Carpool Figure 5: Average Travel Time to Work Table 3 Bus Railroad Bicycle, Walk, Taxicab, Motorcycle Or Other Time (Minutes)
4 The average trip length of all the modes identified is a little over 26 minutes. Workers who drove alone were slightly below the average at minutes. However, workers who drove in a two-person carpool took only slightly longer to get to work than single drivers at minutes. A three-person carpool averaged only four minutes longer than single drivers and two-person carpools. People that take a bus to work took nearly 38 minutes to get there. The trade-off with bus riders is travel time versus vehicle operation and maintenance costs which generally far exceed that of a bus fare. Studies show that riding the bus is usually a financial consideration more than a philosophical choice of utilizing mass transportation. The workers that had the shortest trips were those who either bicycled, walked, motorcycled, took a cab or some other means. Their trips averaged just less than 21 minutes. Regional Core Circulator Study The Toledo Regional Core Circulator Study (RCCS), initiated in July 2002, began as an effort to address transportation-related questions raised in the Downtown Toledo Master Plan, unveiled in Issues pertaining to street operations, a central transfer center, parking expansion and Toledo Area Regional Transit Authority (TARTA) bus operations needed additional study. These proposals spawned additional questions as to what is the best downtown transportation system. Stage 1 of the RCCS focused on this downtown area analysis. As alternatives were developed and refined, it became apparent that an economic analysis for the benefits of the proposed streetcar would facilitate the decision-making process. Stage 2 contained such an assessment. A third stage was added in mid-2004 to investigate transit options between the University of Toledo and downtown. This final analysis was prompted by the University of Toledo s plans for a Science, Research and Technology Corridor. An initial screening of alternatives included a wide range of modes such as tram trains, SMRTram, light rail, bus rapid transit and monorails that were not carried over as detailed alternatives. Modes reflected in the alternatives subject to detailed evaluation include: transitsupportive modes, including pedestrian and bicycle improvements, water taxi service and an aerial gondola; surface, flexible modes including rubber-tired trolleys and electric/hybrid buses; surface, fixed modes including vintage streetcar; and elevated modes including personal rapid transit (PRT). The variety of issues identified in the purpose and need analysis prompted a customized process, tailored specifically to Toledo conditions. The resulting process evolved around five key decisions, as reflected in Figure 6. 4
5 STUDY ALTERNATIVES Alternatives Study Question What is the best overall mode of downtown transportation? What is the best transportation connection to the Toledo Museum of Art and Zoo? What is the best transportation connection across the Maumee River? Should the existing bus loop operations and stations be changed, and if so how? What is the impact of changing streets from one-way to two-way? Are there new roadway connections that should be provided? Status quo, rubber-tired circulators, streetcar, personal rapid transit (PRT) Status quo, improved TARTA connections, dedicated bus or streetcar service Status quo, rubber-tired circulator, water taxi, aerial gondola Status quo, central transfer station, modified loop, modified stations Status quo, all streets two-way, modified two-way operation, improvements to Clayton, Michigan and 11 th streets Figure 6: Study Alternatives Table A major recurring theme in the stakeholder interviews was that downtown Toledo needs to be more pedestrian-friendly, easier to navigate on foot and by car. There are adequate sidewalk widths, but no interesting streetscape theme to make the walk attractive and interesting. Recent streetscape improvements on Adams Street have been successful in bringing more life and vitality to that corridor. There are information signs directing motorists to major activity centers, but the system is not complete or integrated. Also, there are no signs oriented to pedestrians. A package of relatively low-cost basic improvements that address these issues became known as the Fundamentals. Summarized in Figure 7, the improvements enhance walking and biking as well as add a sense of place to downtown Toledo with improved wayfinding for pedestrians and motorists. DESCRIPTION OF FUNDAMENTALS Element Description Cost Streetscape improvements On Madison Avenue and $2.6 million Huron Street Auto-oriented wayfinding Dynamic and static signs $1.1 million Pedestrian wayfinding Kiosks and signs $0.3 million Greenway improvements Cherry and Swan Creek $2.0 million improvements Bicycle improvements Kiosks and signs $0.1 million Total $6.1 million Figure 7: Fundamentals Table The Fundamentals also include a parking development policy guideline that proposes limiting new parking facilities to replacement parking only (no increase), and with vehicular access/egress away from major pedestrian streets such as Madison Avenue and Huron Street. The alternatives impact mobility, the environment and economic conditions in different ways or degrees. Both quantitative and qualitative measures were used to compare them against a status quo, no-build condition. An economic impact analysis was performed for the downtown streetcar that showed a positive return on public funds invested. It measured increased economic activity from redevelopment of 50 percent of currently vacant properties along the street car route. 5
6 The Locally Preferred Alternative (LPA) is based on the evaluation results presented to the steering committee and task force as well as input received during public meetings in September 2003 and December Overall Mode - The streetcar is the foundation of the LPA. There are two lines a Downtown line that extends from a proposed Transportation Center at Cherry Street to the Erie Street Market (1.7 miles) and the Toledo Museum of Art (TMA) line (1.4 miles) that runs from Erie Street Market to the TMA. Service would operate at approximately 15-minute frequencies from 7 a.m. to midnight every day on the Downtown line and every 20 minutes on the TMA line. The Transportation Center would house administrative offices and the maintenance facility for the streetcars. It has been designed to accommodate structured parking in the future. There are two rubber-tired circulator routes that supplement the streetcar service. The lunchtime Adams/Monroe route operates the same hours as TARTA s current lunchtime trolley (11 a.m. to 2 p.m. on weekdays) but on a simplified route to make it more understandable to passengers. There is another route, The Docks/Oliver House route that crosses the river, operating the same hours as the streetcar and at 10-minute frequencies. The total capital costs for the streetcar system depicted in Figure 8 include: Downtown Line $18.6 million TMA Line $17.7 million Transportation Center $ 7.9 million Circulators $ 2.4 million Total $46.6 million Connection to Toledo Museum of Art and Zoo The streetcar line to the TMA connects this attraction and the future Glass Pavilion with downtown and at the same time serves portions of the Old West End neighborhood area. Wrapping buses with a theme such as A to Z (Museum of Art to Zoo) is a short-term, low-cost measure ($60,000) that makes it clear to visitors what buses to use from downtown to the TMA or Zoo. Across the Maumee River Crossing the river can be accomplished using The Docks/Oliver House rubber-tired circulator route that supplements the streetcar system and is part of the overall streetcar system. The limited seasonal nature of water taxi service and the costs of the aerial gondola suggest these modes are more suitable when demand to cross the river is much greater than currently anticipated. Bus Loop Operations The current operation is a good balance of bus and traffic operations. As highlighted in Figure 9, the LPA includes an improvement with an extension of the loop one block south to Monroe Street to provide better connections to Fifth Third Field and the Warehouse District. This change eliminates the confusing Jefferson Avenue operation. Other options included eliminating the TARTA bus loop and adding parking on loop streets but this would have a serious impact on traffic safety and bus operating costs. Keeping the loop and 6


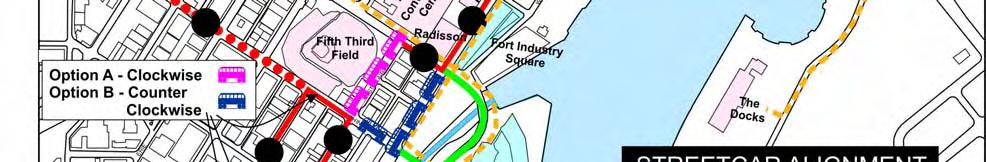
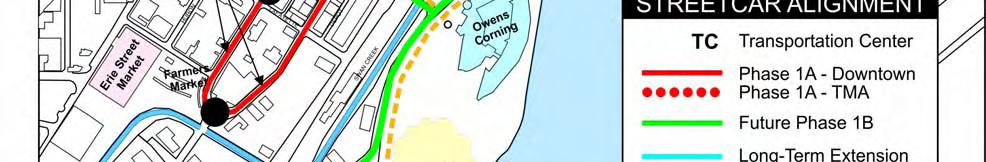
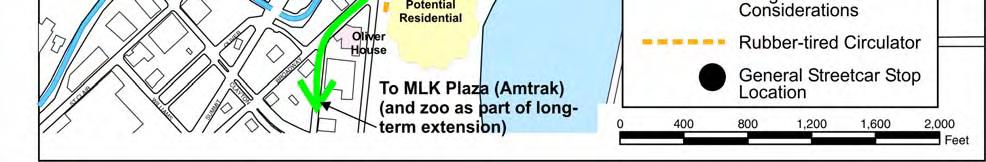
7 Figure 8: Streetcar Alignment Map 7
8 Figure 9: Bus Loop Map adding parking impacts safety, and increases bus operating costs and traffic congestion. Relocation of the Park and Promenade stations was also considered. This improved vistas along Madison Avenue and enhanced development potential on Madison Avenue without significantly affecting bus operations. Estimated capital costs of the bus loop changes include: Repave streets to extend transit lane and add new bus shelter on Monroe Street: $210,000; and Relocate Promenade and Park stations: $650,000. 8
9 Street Operations The conversion of many of the one-way streets to two-way will make it easier for visitors to the city to navigate downtown streets, without incurring any significant change in travel time. This, in turn, fosters and facilitates downtown growth potential. Improvement in traffic operations by adding new roads or making major capacity modifications was not sufficient to offset the anticipated capital cost or community disruptions. Figure 10: Street Operations Map The Erie/Michigan streets and 11 th /14 th streets one-way pairs remain one-way. As illustrated in Figure 10, major one-way streets changed to two-way include Huron Street, 12 th Street, Jefferson and Madison Avenues. The cost to implement the changes in street operation by grinding out street markings and re-striping, signing, reconstructing intersections and changing signals for two-way operation is estimated at $3.8 million. 9

10 Air Facility Inventory The TMACOG region is serviced by eight air facilities located within the region and by a multitude of others throughout Northwest Ohio and Southeastern Michigan. The facilities in the region are Bradner, Wood County, Metcalf, Toledo Express, Erie Aerodrome, Toledo Suburban, Seagate Helistop, and the Deshler Muni Landing Strip. The largest of these is Toledo Express Airport which transported 600,000 passengers in Although located roughly an hour from Toledo, 976,000 passengers are drawn away from Toledo Express Airport and fly out of Detroit Metropolitan Airport annually. The reason cited by many travelers using Detroit Metro is the number of direct flights and the wider range of flight times. Toledo Express Airport is the primary air freight service in the region and is home to BAX Global (formerly Burlington Air Express Inc.) Most of the air facilities in the region provide only private air service. Toledo Express and Detroit Metropolitan Airports are the primary provider of commercial airline service for regional air passengers. Passenger Rail Passenger rail service through the TMACOG region is provided by Amtrak which in 2005 operated four trains per day into Martin Luther King Jr. Plaza, two eastbound and two westbound. More than 80,000 passengers per year utilize the Toledo station, the most of any Amtrak station in Ohio. The Lake Shore Limited travels from Chicago through Toledo with destinations in Boston and New York and the Capital Limited travels from Chicago through Toledo to Washington DC. Figure 11: Regional Hub Map 10
11 Figure 12: Air Facilities Inventory Map 11
12 12
13 Amtrak s service through Toledo has remained consistent over the past decade despite the ongoing funding issues surrounding Amtrak nationally. Regardless of the uncertainty of Amtrak s future, passenger rail has received a great deal of support in the region and a plan has been developed by the Ohio Rail Development Authority (ORDC) that proposes a high speed rail line linking Toledo with numerous other destinations in the Midwest. The ORDC and the Ohio Department of Transportation (ODOT) recognized the potential for intercity passenger rail service and completed a feasibility study of a regional rail system of four corridors with a central hub in Cleveland. The study goal was to determine, at a conceptual level, the financial and economic feasibility of developing a system serving four intercity travel corridors: Cleveland Columbus Dayton Cincinnati Cleveland Toledo Detroit Cleveland Pittsburgh Cleveland Buffalo Niagara Falls Toronto The rail system concept involves constructing and operating an 860-mile intercity passenger service with 32 passenger stations. It would serve more than 22 million people in four states and southern Ontario, Canada. The four corridors connect nine major metropolitan areas and many smaller cities and towns. Stations would be located in downtown centers, in suburban areas near interstate highways, and adjacent to major international airports. Feeder bus service to smaller communities, colleges and university towns would enhance the reach of the rail system. The envisioned passenger rail system would provide same-day, round-trip service throughout the region by reducing downtown-to-downtown travel times and increasing train speeds. The rail service would complement both automobile and air travel by offering a modern transportation option with competitive travel times, reliable and frequent schedules and new, comfortable passenger trains. The overall capital cost projection for the Ohio Hub System is approximately $2.607 billion or about $3.5 million per mile for a 79-mph system, or $3.324 billion or about $4.5 million per mile for a 110-mph system. A fleet of 24 trains is needed for a total cost of $322 million. The estimated capital cost for each corridor is highlighted in Figure 13 below. Cleveland- Columbus- Cincinnati Cleveland- Detroit via Detroit Airport Cleveland- Pittsburgh via Youngstown Cleveland- Buffalo- Toronto Ohio Hub System Total Cost Start-up Year Infrastructure $1,161.6 $445.0 $535.0 $841.2 $2,982.8 Rolling Stock $80.5 $80.5 $80.5 $80.5 $322.0 $1,242.1 $525.5 $615.5 $941.7 $3,324.8 Figure 13: Ohio Hub System Capital Costs Table 13
14 Pedestrian and Bike As the price of gasoline increased in 2005, the number of people walking and riding a bicycle noticeably increased as a result. There are a variety of reasons that residents choose to walk or bicycle instead of driving a car, such as cost, physical fitness, accessibility, or personal preference, and it is vital that their transportation needs be addressed in the overall transportation picture. Under state law, bicycles are vehicles and are legally able to operate on roadways unless explicitly stated otherwise. Within the TMACOG region, only a few roadways prohibit bicycles, including interstate routes and the Anthony Wayne Trail. In the development of the 2025 Regional Transportation Plan, a key component was the regional bicycle network (Figure 14). The bicycle network identifies existing paths and streets that are ideal for cyclists and proposes additional paths and streets that need minor improvements or are under development that will become part of the network in the future. The bike network helped to set the future direction of bicycling infrastructure and to ensure that an interconnected system exist for the community. In addition to the bicycle network, another important reference is the 2025 Trail Component of the bicycle network (Figure 15). This map shows the locations of existing and proposed trails in the TMACOG region. This map is particularly useful for identifying where linkages could be pursued in order to more fully connect the trail system. A major connection that still needs to be made is the completion of the Northcoast Inland Trail to connect with existing trails in the region. When this connection is made, there will be a nearly complete system of trails extending across Ohio from Indiana to Pennsylvania. Another desirable connection would be from the Wabash Cannonball Trail, through the Oak Openings, and connecting with the University Parks Trail and the Olander Park System. There are three basic types of bicycle facilities that are most commonly provided - bike lanes, bike paths or trails, and bike routes. A bike path or trail is usually feet wide, paved or unpaved. It is separate form the road and usually designed for two-way travel. All in our region are multi-purpose trails for non-motorized uses (biking, walking, rollerblading, etc.). The more rural trails usually permit horseback riding. A bike lane is a one-way specially-marked lane, usually 5 feet wide, adjoining each side of the road. A signed bike route is a numbered or named route that cyclists can follow. It often connects to major destinations. A route may include streets, bike lanes, and paths. Public Transit Recognizing that there are potentially a host of unmet needs for public transportation in the region, TMACOG formed a Transit Study Committee. The committee was made up of key regional stakeholders and decision makers in the transportation, governmental and human services sectors, TMACOG and transit agency staff, and concerned citizens, to study the transit needs of the region. The analysis by the consultant team, TMACOG staff and the study 14
15 committees began in April The Transit Study report documents the results of that study and summarizes the unmet needs in the region, and proposes next steps in the process. Figure17 shows the existing transit service area. The TMACOG region is serviced by three main providers of public transit. They are the Toledo Area Regional Transit Authority (TARTA), the Toledo Area Regional Paratransit Service (TARPS), and the Bedford Dial-a-Ride. The University of Toledo, Bowling Green State University, the Area Office on Aging, and the Mental Retardation and Developmental Disabilities Board (MRDD) also operate transit services. TARTA operates an extensive system of 54 fixed-routes and services (including route branches and variations, school-oriented routes and the Maumee and Perrysburg Call-a-Ride services) in the Toledo region. The agency s mission is to be the most innovative and responsive public transit system, by providing transit in a reliable, timely, safe, accessible, affordable and friendly manner. In addition to the City of Toledo, TARTA also serves the City of Sylvania and Sylvania Township, Ottawa Hills, Maumee, Perrysburg, Rossford, Spencer Township and Waterville. TARTA s ridership is approximately 4.6 million riders per year. TARTA also operates a door-to-door, on-demand Paratransit service called TARPS (Toledo Area Regional Paratransit Service) providing over 86,000 rides per year. TARPS provide Paratransit service to persons with disabilities throughout the communities it serves. This standard exceeds the requirements of the Americans with Disabilities Act of 1990 (ADA), which requires that transit systems serve only trips within.75 mile of fixed route bus routes. TARTA contracts with Laidlaw Transportation Services to provide the TARPS service. TARTA owns the vehicles, radios, and scheduling software but does not directly employ the operators of the TARPS service. Laidlaw employees operate and maintain the vehicles and schedule the services, and Laidlaw owns the operating and maintenance facility in west Toledo. The Bedford Dial-a-Ride provides 13,000 rides per year of curb-to-curb service for Bedford Township (Michigan) residents, for trips within the township, nearby locations in adjacent Erie and Whiteford Townships, and connections to TARTA at transfer points in Toledo. Bedford Dial-a-Ride is a one-bus operation, operating as a route deviation circulator bus service. Lake Erie Transportation Commission operates the service. The Commission also operates Lake Erie Transit (LET), the seven-route, public bus system in Monroe County, Michigan; the Essential Transportation Service (ETS), a fully accessible door-to-door demand responsive service in Monroe County designed to serve handicapped persons and senior citizens. ETS is a contracted service that primarily serves community mental health and the Commission on Aging. The fixed route service and ETS is focused on the City of Monroe, located about 10 miles north of Bedford Township, and provides no service to Bedford Township or connection to the Bedford Dial-a- Ride service. Bedford Dial-a-Ride is a dial-a-ride service that links to the TARTA fixed-route service. The Regional Transit Study is the region s response to perceived shortcomings in the public transportation systems. These include a perceived lack of transportation options for growth areas and a lack of mobility for seniors, persons with disabilities, and other people who need or desire public transportation. 15
16 The purpose of the study was to determine whether there are unmet needs for public transportation in the region and the extent and nature of these needs. The study area includes Lucas and Wood counties in Ohio and Erie, Bedford and Whiteford townships in Monroe County, Michigan. Project sponsors include a wide range of local governmental agencies, transit providers, and non-profit entities from throughout the study area. The following table (Figure 16) outlines recommended objectives related to key concerns. They are organized by whether they are recommended for short or longer-term action, and whether they primarily are issues of existing or new service areas. Within these categories, the objectives are listed in general priority order for implementation, reflecting both the importance of the objective and the time, funding, and political factors that will impact how soon the strategy can be implemented. Specific projects and policy changes resulting from these efforts will be implemented though the coordinated efforts of regional stakeholders. These projects and policies will join other transitrelated initiatives currently underway in the region and will be incorporated into regional and local plans and programs. The Regional Transportation Plan (RTP) includes major project and policy initiatives. Each transit agency maintains a multi-year program of projects. 16
17 Figure 14: 2025 Regional Bicycle Network Map 17
18 18


19 Figure 15: 2025 Trail Component of the Bicycle Network Map 19
20 20
21 A. Existing Transit Areas Short Term (1-3 years) 1) Investigate options and fund service improvements to address the following: Add direct service between nondowntown destinations (cross-town routes) in the TARTA service area Add/expand evening, night, weekend, and holiday service in all transit service areas Increase service frequency in all service areas Expand the Bedford Dial-a-Ride service area, and add more connections to TARTA Longer Term (4-10 years) 1) Add connection between Bedford and Monroe City area 2) Add connection between Bowling Green and the metro area B. New Transit Areas 2) Work with stakeholders to coordinate transportation resources of senior citizen, workforce development, Medicare, and social service agencies to address transportation needs 3) Continue to provide ADA-compliant Paratransit service to the growing disabled population in transit service areas 4) Improve transit marketing / public information 5) Work with local governments to improve pedestrian access to bus stops (sidewalks, paved pads, snow removal, etc.) 1) Work with local stakeholders to investigate alternatives for providing service, and pursue new service in the following areas: 1. Oregon area 2. Northwood 3. Holland/Springfield 4. Perrysburg Township 1) Reorganize transit to operate and fund it as a county-wide or multi-county system, allowing areas of need to be served 2) Pursue coordination and connectivity with adjoining rural county transit systems (Ottawa County, etc.) Figure 16: Transit Study Recommendations Table 21
22 22


23 Figure 17: Existing Transit Service Areas 23
24 24


25 Transit Supportive Areas Based on the existing characteristics of the TMACOG region and areas served by transit, industry standards and standards established by other transit systems, the transit study consultant team developed a transit-supportive area standard for the TMACOG region. A transit-supportive area is one which by density of population could be expected to use public transit services. This standard stipulated a minimum density of employment and population: Gross employment density of 3 persons per acre. Gross population density of 4 persons per acre. Such densities are consistent with national guidelines for transit supportiveness, though on the lower end of the standards, befitting the relatively lower density of much of the TMACOG region. Areas meeting these density standards are considered transit supportive, and could support transit service within walking distance, ¼ mile of the transit route. Figure 18: Transit Supportive Areas Map Figure 18 shows these transit-supportive areas and compare them with the fixed transit routes in the area. While many of these transit supportive areas are located near downtown Toledo and within the City of Toledo, many are located far from downtown Toledo, and some are located 25
26 outside the fixed-route transit service area. Oregon, Northwood, Perrysburg Township, Monclova Township and Springfield Township, and much of Bowling Green are among the locations of significant concentrations of transit-supportive development not served by fixedroute transit. Needs Identified through Public Input From the needs input received from public meetings and through surveys, numerous responses related to the need for improved transit, pedestrian, bicycling, and passenger rail options. Specifically, comments included: Ineffective urban and interurban transportation options Lack of sidewalk(s) or path connectivity between communities Improve bike path connectivity (walk paths, multi utility paths) with the Anthony Wayne Trail/Mud Hens Stadium/ Point Place Passenger rail: Toledo-Columbus, Toledo-Cincinnati, Toledo-Cleveland, Toledo- Chicago, Toledo-Detroit. Dependable, higher speed trains desired Need more passenger trains and better times of day Bus routes - More cross connections Lack of transportation services for seniors and disabled Conflicts between various transportation modes 26
Chapter 4 : THEME 2. Transportation
 Chapter 4 : THEME 2 Strengthen connections to keep the Central Area easy to reach and get around 55 Figure 4.2.1 Promote region-wide transit investments. Metra commuter rail provides service to the east,
5. OPPORTUNITIES AND NEXT STEPS
 5. OPPORTUNITIES AND NEXT STEPS When the METRO Green Line LRT begins operating in mid-2014, a strong emphasis will be placed on providing frequent connecting bus service with Green Line trains. Bus hours
Public Meeting. City of Chicago Department of Transportation & Department of Housing and Economic Development
 Public Meeting City of Chicago Department of Transportation & Department of Housing and Economic Development Funded by Regional Transportation Authority September 12, 2011 In partnership with Presentation
BROWARD BOULEVARD CORRIDOR TRANSIT STUDY
 BROWARD BOULEVARD CORRIDOR TRANSIT STUDY FM # 42802411201 EXECUTIVE SUMMARY July 2012 GOBROWARD Broward Boulevard Corridor Transit Study FM # 42802411201 Executive Summary Prepared For: Ms. Khalilah Ffrench,
Ohio Passenger Rail Development. Northwest Ohio Passenger Rail Association
 Ohio Passenger Rail Development Northwest Ohio Passenger Rail Association Ohio Rail Development Commission June 11, 2010 Ohio Strategy Establish the Market Grow the Market Capture the Value of the Market
Needs and Community Characteristics
 Needs and Community Characteristics Anticipate Population and Job Growth in the City Strongest density of population and jobs in Ann Arbor are within the Study Area Population expected to grow 8.4% by
FREQUENTLY ASKED QUESTIONS
 FREQUENTLY ASKED QUESTIONS 2018 What is the More MARTA Atlanta program? The More MARTA Atlanta program is a collaborative partnership between MARTA and the City of Atlanta to develop and implement a program
Kenosha-Racine-Milwaukee (KRM)
") Kenosha-Racine-Milwaukee (KRM) Commuter Rail #147925 November 6, 2009 1 Guidance of KRM Commuter Rail Studies Intergovernmental Partnership Technical Steering Committee Temporary and Limited Authority
Kenosha-Racine-Milwaukee (KRM) Commuter Rail #147925 November 6, 2009 1 Guidance of KRM Commuter Rail Studies Intergovernmental Partnership Technical Steering Committee Temporary and Limited Authority
Help shape your community investment in Wake Transit. Fiscal Year 2019 Draft Work Plan Summary
 Help shape your community investment in Wake Transit Fiscal Year 2019 Draft Work Plan Summary Wake County, growth and transit The Triangle is one of the fastest-growing regions in the nation. Wake County
Status of Plans March Presented by CAPITOL REGION COUNCIL OF GOVERNMENTS
 Status of Plans March 2011 Presented by CAPITOL REGION COUNCIL OF GOVERNMENTS Transit project update Project rationale The system New Britain Hartford Busway New Haven/Hartford/ Springfield Passenger Rail
Parking Management Element
 Parking Management Element The State Transportation Planning Rule, adopted in 1991, requires that the Metropolitan Planning Organization (MPO) area implement, through its member jurisdictions, a parking
Downtown Transit Connector. Making Transit Work for Rhode Island
 Downtown Transit Connector Making Transit Work for Rhode Island 3.17.17 Project Evolution Transit 2020 (Stakeholders identify need for better transit) Providence Core Connector Study (Streetcar project
appendix 4: Parking Management Study, Phase II
 appendix 4: Parking Management Study, Phase II A4-1 A4-2 Eastlake Parking Management Study Final Phase 2 Report Future Parking Demand & Supply January 6, 2017 Submitted by Denver Corp Center III 7900 E.
Green Line Long-Term Investments
 Enhancements Short-term improvements to keep Austin moving. Investments Long-term projects to support our future. Mobility Hubs MetroRapid MetroRail MetroExpress Connectors Circulators Project Connect
CITY OF ANN ARBOR, MICHIGAN 301 E. Huron St., P.O. Box 8647 Ann Arbor, Michigan
 Date: Wednesday, June 18, 2014 Location: Ann Arbor District Library Attendees: 14 citizen attendees Ann Arbor Station Environmental Review Citizen Working Group Meeting Notes Meeting #3 The third meeting
Brainstormed Solutions - Passenger
 1-1a Air / Exand: Expand capacity (runway lengths) at BG airport (LOW) find solution! 1-1b Air / fuel: Improve fuel availabilty and reduce cost (LOW) Sound Walls X X X Reduce scatter lighting - more focused
UTA Transportation Equity Study and Staff Analysis. Board Workshop January 6, 2018
 UTA Transportation Equity Study and Staff Analysis Board Workshop January 6, 2018 1 Executive Summary UTA ranks DART 6 th out of top 20 Transit Agencies in the country for ridership. UTA Study confirms
THE WAY WE MOVE LRT FOR EVERYONE
 THE WAY WE MOVE LRT FOR EVERYONE 2 LRT for Everyone LRT FOR EVERYONE Light rail is about more than transit; it s about transforming Edmonton. As the city grows, so do its transportation needs. LRT is an
STRATEGIC PRIORITIES AND POLICY COMMITTEE MAY 5, 2016
 STRATEGIC PRIORITIES AND POLICY COMMITTEE MAY 5, 2016 Shift Rapid Transit Initiative Largest infrastructure project in the city s history. Rapid Transit initiative will transform London s public transit
6/6/2018. June 7, Item #1 CITIZENS PARTICIPATION
 June 7, 2018 Item #1 CITIZENS PARTICIPATION 1 Item #2 APPROVAL OF MINUTES Item #3 TRAC GOALS, FRAMEWORK & AGENDA REVIEW 2 COMMITTEE GOALS Learn about Southern Nevada s mobility challenges, new developments
A Transit Plan for the Future. Draft Network Plan
 A Transit Plan for the Future Draft Network Plan Project Overview and Status Completed Market Analysis and Service Evaluation. Developed Plan Framework and Guiding Principles. Developed a draft Five Year
EUGENE-SPRINGFIELD, OREGON EAST WEST PILOT BRT LANE TRANSIT DISTRICT
 EUGENE-SPRINGFIELD, OREGON EAST WEST PILOT BRT LANE TRANSIT DISTRICT (BRIEF) Table of Contents EUGENE-SPRINGFIELD, OREGON (USA)... 1 COUNTY CONTEXT AND SYSTEM DESCRIPTION... 1 SYSTEM OVERVIEW... 1 PLANNING
Sean P. McBride, Executive Director Kalamazoo Metro Transit. Presentation to Michigan Transportation Planning Association July 13, 2016
 Sean P. McBride, Executive Director Kalamazoo Metro Transit Presentation to Michigan Transportation Planning Association July 13, 2016 Metro Transit in Kalamazoo County Square Miles = 132 Urbanized Population:
Restoration of Historic Streetcar Services in Downtown Los Angeles
 Restoration of Historic Streetcar Services in Downtown Los Angeles Early Scoping Meeting for Alternatives Analysis (AA) May 17, 2011 Introduction Key players Local lead agency: Metro Federal lead agency:
PUBLIC TRANSPORTATION
 PUBLIC TRANSPORTATION PROJECT TITLE U-MED DISTRICT MULTI-MODAL IMPROVEMENTS- PHASE II Transit Vehicles and Upgrades MUNICIPALITY OF ANCHORAGE Capital Improvement Program PROJECT LIST BY DEPARTMENT Public
Click to edit Master title style
 Nelson/Nygaard Consulting Associates SERVICE IMPROVEMENT STRATEGIES September 22, 2015 1 PROJECT OVERVIEW & WORK TO DATE 1. Extensive stakeholder involvement Throughout 2. System and market assessment
Denver Car Share Program 2017 Program Summary
 Denver Car Share Program 2017 Program Summary Prepared for: Prepared by: Project Manager: Malinda Reese, PE Apex Design Reference No. P170271, Task Order #3 January 2018 Table of Contents 1. Introduction...
The City of Toronto s Transportation Strategy July 2007
 The City of Toronto s Transportation Strategy July 2007 Presentation Outline Transportation Statistics Transportation Building Blocks Toronto s Official Plan Transportation and City Building Vision Projects
Midtown Corridor Alternatives Analysis. Policy Advisory Committee Meeting February 12, 2014
 Midtown Corridor Alternatives Analysis Policy Advisory Committee Meeting February 12, 2014 Today s Agenda Introductions Outreach efforts and survey results Other updates since last meeting Evaluation results
Central Loop Bus Rapid Transit
 Central Loop Bus Rapid Transit Transportation Goals of the Chicago Central Area ACTION Plan, page 2-6 Central Area Plan Improve Transit in Central Area Improve Pedestrian Environment Manage Traffic Circulation
The Case for. Business. investment. in Public Transportation
 The Case for Business investment in Public Transportation Introduction Public transportation is an enterprise with expenditure of $55 billion in the United States. There has been a steady growth trend
APPENDIX I: [FIXED-GUIDEWAY TRANSIT FEASIBILITY]
![APPENDIX I: [FIXED-GUIDEWAY TRANSIT FEASIBILITY]](/thumbs/83/87090921.jpg "APPENDIX I: [FIXED-GUIDEWAY TRANSIT FEASIBILITY]") APPENDIX I: [FIXED-GUIDEWAY TRANSIT FEASIBILITY] Jackson/Teton Integrated Transportation Plan 2015 Appendix I. Fixed-Guideway Transit Feasibility Jackson/Teton County Integrated Transportation Plan v2
APPENDIX I: [FIXED-GUIDEWAY TRANSIT FEASIBILITY] Jackson/Teton Integrated Transportation Plan 2015 Appendix I. Fixed-Guideway Transit Feasibility Jackson/Teton County Integrated Transportation Plan v2
Waco Rapid Transit Corridor (RTC) Feasibility Study
 Feasibility Study") Waco Rapid Transit Corridor (RTC) Feasibility Study Chris Evilia, Director of Waco Metropolitan Planning Organization Allen Hunter, General Manager Waco Transit System Jimi Mitchell, Project Manager AECOM
Waco Rapid Transit Corridor (RTC) Feasibility Study Chris Evilia, Director of Waco Metropolitan Planning Organization Allen Hunter, General Manager Waco Transit System Jimi Mitchell, Project Manager AECOM
Transportation Demand Management Element
 Transportation Demand Management Element Over the years, our reliance on the private automobile as our primary mode of transportation has grown substantially. Our dependence on the automobile is evidenced
Kendall Drive Premium Transit PD&E Study Project Kick-Off Meeting SR 94/Kendall Drive/SW 88 Street Project Development and Environment (PD&E) Study
 Study") Florida Department of Transportation District Six Kendall Drive Premium Transit PD&E Study Project Kick-Off Meeting SR 94/Kendall Drive/SW 88 Street Project Development and Environment (PD&E) Study What
Florida Department of Transportation District Six Kendall Drive Premium Transit PD&E Study Project Kick-Off Meeting SR 94/Kendall Drive/SW 88 Street Project Development and Environment (PD&E) Study What
Bi-County Transitway/ Bethesda Station Access Demand Analysis
 Bi-County Transitway/ Bethesda Station Access Demand Analysis Prepared for: Washington Metropolitan Area Transit Authority Office of Planning and Project Development May 2005 Prepared by: in conjunction
Proposed Program of Interrelated Projects
 DALLAS AREA RAPID TRANSIT Proposed Program of Interrelated Projects Federal Transit Administration Capital Investment Program Summer 204 INTRODUCTION The current federal transportation bill, Moving Ahead
PEACHTREE CORRIDOR PARTNERSHIP. Current Status & Next Steps
 PEACHTREE CORRIDOR PARTNERSHIP Current Status & Next Steps PEACHTREE CORRIDOR PARTNERSHIP Why Peachtree? Why Now? I. THE CONTEXT High Level View of Phasing Discussion Potential Ridership Segment 3 Ease
Policy Note. Vanpools in the Puget Sound Region The case for expanding vanpool programs to move the most people for the least cost.
 Policy Note Vanpools in the Puget Sound Region The case for expanding vanpool programs to move the most people for the least cost Recommendations 1. Saturate vanpool market before expanding other intercity
August 2, 2010 Public Meeting
 Public Meeting LYMMO Expansion Alternatives Analysis Study Purpose of study is to provide a fresh look at potential LYMMO expansion, following Federal Transit Administration (FTA) Alternatives Analysis
Revised Evaluation Scores. System Preservation
 Revised Evaluation s System Preservation This page provides a summary of any revisions made to the draft scores presented at the October th Attributable Funds mmittee meeting. The information below highlights
6/11/2018. June 7, Item #1 CITIZENS PARTICIPATION
 June 7, 2018 Item #1 CITIZENS PARTICIPATION 1 Item #2 APPROVAL OF MINUTES Item #3 TRAC GOALS, FRAMEWORK & AGENDA REVIEW 2 COMMITTEE GOALS Learn about Southern Nevada s mobility challenges, new developments
2.1 TRANSIT VISION 2040 FROM VISION TO ACTION. Expand regional rapid transit networks STRATEGIC DIRECTION
 TRANSIT VISION 2040 FROM VISION TO ACTION TRANSIT VISION 2040 defines a future in which public transit maximizes its contribution to quality of life with benefits that support a vibrant and equitable society,
GO Transit s deliverable: the 2020 Service Plan
 GO Transit s deliverable: the 2020 Service Plan GO Transit s 2020 Service Plan describes GO s commitment to customers, existing and new, to provide a dramatically expanded interregional transit option
CTA Blue Line Study Area
 CTA Blue Line Study Area HISTORY OF THE CTA BLUE LINE / I-290 SYSTEM Blue Line / I-290 infrastructure is 55 years old First integrated transit / highway facility in the U.S. PROJECT STUDY AREA EXISTING
Valley Metro Overview. ITE/IMSA Spring Conference March 6, 2014
 Valley Metro Overview ITE/IMSA Spring Conference March 6, 2014 Valley Metro Who Are We? Operate Regional Transit Services Valley Metro and Phoenix are region s primary service providers Light Rail and
Public Meeting. March 21, 2013 Mimosa Elementary School
 Public Meeting March 21, 2013 Mimosa Elementary School Today s Meeting Purpose 2 Where We Are The Process What We ve Heard and Findings Transit Technologies Station Types Break-out Session Where We Are
Charlotte-Mecklenburg Region Rapid Transit and Land-Use Integration
 Charlotte-Mecklenburg Region Rapid Transit and Land-Use Integration Legislative Committee on Urban Growth and Infrastructure Carolyn Flowers CEO Charlotte Area Transit System March 23, 2010 Charlotte Region
Leadership NC. November 8, 2018
 v Leadership NC November 8, 2018 Planning for our region s growth The Triangle is one of the fastestgrowing regions in the nation. More than 2 million people are already part of the equation, and the
Develop ground transportation improvements to make the Airport a multi-modal regional
 Project Overview TRANSPORTATION IMPROVEMENTS WHAT ARE THE PROJECT GOALS? Transportation transportation hub. Develop ground transportation improvements to make the Airport a multi-modal regional Land Use
STH 60 Northern Reliever Route Feasibility Study Report
 #233087 v3 STH 60 Northern Reliever Route Feasibility Study Report Washington County Public Works Committee Meeting September 28, 2016 1 STH 60 Northern Reliever Route Feasibility Study Hartford Area Development
Travel Time Savings Memorandum
 04-05-2018 TABLE OF CONTENTS 1 Background 3 Methodology 3 Inputs and Calculation 3 Assumptions 4 Light Rail Transit (LRT) Travel Times 5 Auto Travel Times 5 Bus Travel Times 6 Findings 7 Generalized Cost
TRANSIT FEASIBILITY STUDY Town of Bradford West Gwillimbury
 TRANSIT FEASIBILITY STUDY Town of Bradford West Gwillimbury Open House Presentation January 19, 2012 Study Objectives Quantify the need for transit service in BWG Determine transit service priorities based
METRO Orange Line BRT American Boulevard Station Options
 METRO Orange Line BRT American Boulevard Station Options Bloomington City Council Work Session November 18, 2013 Christina Morrison BRT/Small Starts Project Office Coordinating Planning and Design AMERICAN
Northeast Corridor Alternatives Analysis. Public Involvement Round 2 Input on Alternatives for Further Study
 Northeast Corridor Alternatives Analysis Public Involvement Round 2 Input on Alternatives for Further Study Feb. 7-9, 2012 Agenda Review project background Progress summary Recommended alternatives for
Energy Technical Memorandum
 Southeast Extension Project Lincoln Station to RidgeGate Parkway Prepared for: Federal Transit Administration Prepared by: Denver Regional Transportation District May 2014 Table of Contents Page No. Chapter
Rapid Transit and Land-Use Integration a Reality
 City of Charlotte Rapid Transit and Land-Use Integration a Reality Transportation Oversight Committee Carolyn Flowers CEO Charlotte Area Transit System April 29, 2010 Charlotte Region Statistics Mecklenburg
Pedestrians, Cars, Buses and Trains? Considerations for Rapid Transit Service at Western University
 Pedestrians, Cars, Buses and Trains? Considerations for Rapid Transit Service at Western University Shift: The City of London s Rapid Transit Proposal Shift: The City of London s Rapid Transit Proposal
Madison BRT Transit Corridor Study Proposed BRT Operations Plans
 Madison BRT Transit Corridor Study Proposed BRT Operations Plans This paper presents a description of the proposed BRT operations plan for use in the Madison BRT Transit Corridor Study. The objective is
Executive Summary. Treasure Valley High Capacity Transit Study Priority Corridor Phase 1 Alternatives Analysis October 13, 2009.
 Treasure Valley High Capacity Transit Study Priority Corridor Phase 1 Alternatives Analysis October 13, 2009 Background As the Treasure Valley continues to grow, high-quality transportation connections
TORONTO TRANSIT COMMISSION REPORT NO.
 Form Revised: February 2005 TORONTO TRANSIT COMMISSION REPORT NO. MEETING DATE: October 24, 2012 SUBJECT: DOWNTOWN RAPID TRANSIT EXPANSION STUDY (DRTES) PHASE 1 STRATEGIC PLAN ACTION ITEM RECOMMENDATIONS
Breakout Session. The Mobility Challenges of Our Growing & Sprawling Upstate
 Breakout Session The Mobility Challenges of Our Growing & Sprawling Upstate The Mobility Challenges of Our Growing & Sprawling Upstate Why is our suburban and sprawling development pattern a challenge
Executive Summary. Draft Environmental Impact Statement/Environmental Impact Report ES-1
 Executive Summary Introduction The Eastside Transit Corridor Phase 2 Project is a vital public transit infrastructure investment that would provide a transit connection to the existing Metro Gold Line
Preliminary Definition of Alternatives. 3.0 Preliminary Definition of Alternatives
 3.0 What preliminary alternatives are being evaluated? The alternatives for the East San Fernando Valley Transit Corridor project that were considered for screening include the No Build Alternative, Transportation
Maryland Gets to Work
 I-695/Leeds Avenue Interchange Reconstruction Baltimore County Reconstruction of the I-695/Leeds Avenue interchange including replacing the I-695 Inner Loop bridges over Benson Avenue, Amtrak s Northeast
The Smart Growth Countywide Transit Master Plan
 Choose the Future The Smart Growth Transit Master Plan What is the Transit Master Plan? A robust and integrated plan to establish countywide public transportation priorities over the next thirty years
2 EXISTING ROUTE STRUCTURE AND SERVICE LEVELS
 2 EXISTING ROUTE STRUCTURE AND SERVICE LEVELS In the Study Area, as in most of the Metro Transit network, there are two distinct route structures. The base service structure operates all day and the peak
Update on Community or Heritage Rail Project (Project Manager Services) The Engineering Department recommends that Council:
 The Engineering Department recommends that Council:") Corporate NO: R279 Report COUNCIL DATE: DECEMBER 18, 2006 REGULAR COUNCIL TO: Mayor & Council DATE: December 15, 2006 FROM: General Manager, Engineering FILE: 8710-20 (Heritage) SUBJECT: Update on Community
Corporate NO: R279 Report COUNCIL DATE: DECEMBER 18, 2006 REGULAR COUNCIL TO: Mayor & Council DATE: December 15, 2006 FROM: General Manager, Engineering FILE: 8710-20 (Heritage) SUBJECT: Update on Community
CITY OF ANN ARBOR, MICHIGAN 301 E. Huron St., P.O. Box 8647 Ann Arbor, Michigan
 Date: Wednesday, June 24, 2014 Location: Ann Arbor District Library Attendees: 40 citizen attendees Ann Arbor Station Environmental Review Public Meeting Meeting Notes Meeting #2 The second public meeting
9. Downtown Transit Plan
 CORRADINO 9. Downtown Transit Plan KAT Transit Development Plan As part of the planning process for the TDP, an examination of downtown transit operations was conducted. The Downtown Transit Plan 1 is
2.4 TRANSIT VISION 2040 FROM VISION TO ACTION. Support the revitalization of urban cores STRATEGIC DIRECTION
 TRANSIT VISION 2040 FROM VISION TO ACTION TRANSIT VISION 2040 defines a future in which public transit maximizes its contribution to quality of life with benefits that support a vibrant and equitable society,
Sales and Use Transportation Tax Implementation Plan
 Sales and Use Transportation Tax Implementation Plan Transportation is more than just a way of getting from here to there. Reliable, safe transportation is necessary for commerce, economic development,
The Engineering Department recommends Council receive this report for information.
 CORPORATE REPORT NO: R161 COUNCIL DATE: July 23, 2018 REGULAR COUNCIL TO: Mayor & Council DATE: July 19, 2018 FROM: General Manager, Engineering FILE: 8740-01 SUBJECT: Surrey Long-Range Rapid Transit Vision
Midtown Corridor Alternatives Analysis Key Issues Memo
 Midtown Corridor Alternatives Analysis Key Issues Memo 1/4/2013 Prepared by the SRF Consulting Group Team for Table of Contents Introduction... 1 1. Markets... 1 External Markets... 1 Intra-Corridor Travel...
Feasibility Study. Community Meeting March, North-South Commuter Rail Feasibility Study
 Feasibility Study Community Meeting March, 2017 1 Agenda 1. Welcome / Introductions 2. Background / Meeting Purpose 3. Progress to Date Options Evaluated Capital/Operating Costs Ridership 4. Financial
CTfastrak Expansion. Stakeholder Meeting #4 Manchester Town Hall June 3, 2016
 CTfastrak Expansion Stakeholder Meeting #4 Manchester Town Hall June 3, 2016 Today s Agenda Phase I Update 2016 Service Plan Implementation Schedule & Cost Update Phase II Services Timeline Market Analysis
Presentation A Blue Slides 1-5.
 Presentation A Blue Slides 1-5. 1 Presentation A Blue Slides 1-5. 2 Presentation A Blue Slides 1-5. 3 Presentation A Blue Slides 1-5. 4 Presentation A Blue Slides 1-5. 5 Transit Service right. service
Community Advisory Committee. October 5, 2015
 Community Advisory Committee October 5, 2015 1 Today s Topics Hennepin County Community Works Update Project Ridership Estimates Technical Issue #4:Golden Valley Rd and Plymouth Ave Stations Technical
The South Waterfront District and the Portland Aerial Tram
 The South Waterfront District and the Portland Aerial Tram How infrastructure investment can catalyze redevelopment and remove barriers to healthy lifestyles Role of transportation infrastructure in creating
AMERICA. rides the BUS
 AMERICA rides the BUS This brochure provides information on the positive development and direction of the bus industry today, as well as on the broad-based need the bus industry fills in American communities.
US 29 Bus Rapid Transit Planning Board Briefing. February 16, 2017
 US 29 Bus Rapid Transit Planning Board Briefing February 16, 2017 Project Goals Improve the quality of transit service Improve mobility opportunities and choices Enhance quality of life Support master
King County Metro. Columbia Street Transit Priority Improvements Alternative Analysis. Downtown Southend Transit Study. May 2014.
 King County Metro Columbia Street Transit Priority Improvements Alternative Analysis Downtown Southend Transit Study May 2014 Parametrix Table of Contents Introduction... 1 Methodology... 1 Study Area...
Rocky Mount. Transportation Plan. Transportation Planning Division. Virginia Department of Transportation
 2020 Transportation Plan Developed by the Transportation Planning Division of the Virginia Department of Transportation in cooperation with the U.S. Department of Transportation, Federal Highway Administration
Office of Transportation Bureau of Traffic Management Downtown Parking Meter District Rate Report
 Office of Transportation Bureau of Traffic Management 1997 Downtown Parking Meter District Rate Report Introduction The City operates approximately 5,600 parking meters in the core area of downtown. 1
Central City Line Locally Preferred Alternative (LPA) Amendment Public Hearing. July 24, 2014
 Amendment Public Hearing. July 24, 2014") Central City Line Locally Preferred Alternative (LPA) Amendment Public Hearing July 24, 2014 Project Description The Central City Line is a High Performance Transit project that will extend from Browne
Central City Line Locally Preferred Alternative (LPA) Amendment Public Hearing July 24, 2014 Project Description The Central City Line is a High Performance Transit project that will extend from Browne
ANDERSON PROPERTY SITE ANALYSIS
 ANDERSON PROPERTY SITE ANALYSIS Introduction The Montgomery County Department of Transportation (MCDOT) initiated a feasibility study in the fall of 2012 to evaluate the need for transit service expansion
We Want Your Input! Review the design alternatives and tell us what s important to you in the design of these areas of the approved BRT Network:
 We Want Your Input! Review the design alternatives and tell us what s important to you in the design of these areas of the approved BRT Network: Richmond North of Oxford Street Richmond Row Dundas Street
Michigan Avenue Corridor Study. Joint Policy / Technical Committee Meeting Wednesday, June 8, 2016
 Michigan Avenue Corridor Study Joint Policy / Technical Committee Meeting Wednesday, June 8, 2016 Agenda 1. Welcome and Introductions 2. Project Update 3. Recap from May 11 Joint Committee Meetings 4.
IMPROVEMENT CONCEPTS
 IMPROVEMENT CONCEPTS for the South Novato Transit Hub Study Prepared by: January 11, 2010 DKS Associates With Wilbur Smith Associates IMPROVEMENT CONCEPTS Chapter 1: Introduction 1. INTRODUCTION The strategic
The Boston South Station HSIPR Expansion Project Cost-Benefit Analysis. High Speed Intercity Passenger Rail Technical Appendix
 The Boston South Station HSIPR Expansion Project Cost-Benefit Analysis High Speed Intercity Passenger Rail Technical Appendix Prepared by HDR August 5, 2010 The Boston South Station HSIPR Expansion Project
Green Line LRT: Beltline Segment Update April 19, 2017
 Green Line LRT: Beltline Segment Update April 19, 2017 Quick Facts On April 11, 2017, City Council approved Administration s recommendation for the Green Line to be underground in the Beltline from 2 Street
4 COSTS AND OPERATIONS
 4 COSTS AND OPERATIONS 4.1 INTRODUCTION This chapter summarizes the estimated capital and operations and maintenance (O&M) costs for the Modal and High-Speed Train (HST) Alternatives evaluated in this
DRAFT Evaluation Scores. Transit
 DRAFT Evaluation s The criteria for evaluating applications for new funding commitments are used to measure how well they advance the six goals identified for the MTP. Through transportation: Reduce per
I-20 EAST TRANSIT INITIATIVE Tier 1 and Tier 2 Alternatives Screening Report EXECUTIVE SUMMARY
 EXECUTIVE SUMMARY The purpose of this report is to document the results of the Tier 1 and Tier 2 Screening of alternatives for the I-20 East Transit Initiative. The two-tier screening process presented
Green Line LRT: Beltline Recommendation Frequently Asked Questions
 Green Line LRT: Beltline Recommendation Frequently Asked Questions June 2017 Quick Facts Administration has evaluated several alignment options that would connect the Green Line in the Beltline to Victoria
Recommended Vision for the Downtown Rapid Transit Network
 Recommended Vision for the Downtown Rapid Transit Network April 2008 Presentation Overview Context Transit options Assessment of options Recommended network Building the network 2 1 Rapid Our Vision Reliable
Strategic Plan
 2005-2015 Strategic Plan SUMMARY OF THE REVISED PLAN IN 2011 A decade focused on developing mass transit in the Outaouais A updated vision of mass transit in the region The STO is embracing the future
5. Assessment of Existing Transit
 5. Assessment of Existing Transit 5.1 Public Transit Operations i. Description of Services and Operating Characteristics Several transit agencies and other entities provide a variety of transit services
Service Quality: Higher Ridership: Very Affordable: Image:
 Over the past decade, much attention has been placed on the development of Bus Rapid Transit (BRT) systems. These systems provide rail-like service, but with buses, and are typically less expensive to
What We Heard Report - Metro Line NW LRT
 What We Heard Report - Metro Line NW LRT by Metro Line NW LRT Project Team LRT Projects City of Edmonton April 11, 2018 Project / Initiative Background Name Date Location Metro Line Northwest Light Rail