Alaska Department of Transportation & Public Facilities
|
|
|
- Rachel Spencer
- 5 years ago
- Views:
Transcription


1 Alaska Department of Transportation & Public Facilities Demonstration of Non-intrusive Traffic Data Collection Devices in Alaska Prepared By: Authors: Erik D. Minge, P.E. SFR Consulting Group, Inc. One Carlson Parkway, Suite 150 Minneapolis, MN May 2010 Prepared For: Alaska Department of Transportation & Public Facilities Research, Development, and Technology Transfer 2301 Peger Road Fairbanks, AK FHWA-AK-RD-10-10
2
3 Foreword The purpose of this document is to present findings from the Demonstration of Non-Intrusive Traffic Data Collection Devices in Alaska (Project T ). This project was initiated by the Alaska Department of Transportation and Public Facilities (DOT&PF) to evaluate innovative methods for detecting traffic. This project procured and field tested two portable non-intrusive traffic detection systems. This report documents the performance of these systems as tested by the DOT&PF personnel, and the feasibility of integrating into the Department s data collection program. This is the project s final report and is intended for data collection staff. Notice This document is disseminated under the sponsorship of the U.S. Department of Transportation in the interest of information exchange. The U.S. Government assumes no liability for the use of the information contained in this document. The U.S. Government does not endorse products or manufacturers. Trademarks or manufacturers' names appear in this report only because they are considered essential to the objective of the document. Quality Assurance Statement The Federal Highway Administration (FHWA) provides high-quality information to serve Government, industry, and the public in a manner that promotes public understanding. Standards and policies are used to ensure and maximize the quality, objectivity, utility, and integrity of its information. FHWA periodically reviews quality issues and adjusts its programs and processes to ensure continuous quality improvement.
4 REPORT DOCUMENTATION PAGE Form approved OMB No. Public reporting for this collection of information is estimated to average 1 hour per response, including the time for reviewing instructions, searching existing data sources, gathering and maintaining the data needed, and completing and reviewing the collection of information. Send comments regarding this burden estimate or any other aspect of this collection of information, including suggestion for reducing this burden to Washington Headquarters Services, Directorate for Information Operations and Reports, 1215 Jefferson Davis Highway, Suite 1204, Arlington, VA , and to the Office of Management and Budget, Paperwork Reduction Project ( ), Washington, DC AGENCY USE ONLY (LEAVE BLANK) 2. REPORT DATE 3. REPORT TYPE AND DATES COVERED FHWA-AK-RD TITLE AND SUBTITLE May 2010 FINAL, February 1, 2008 to May 31, FUNDING NUMBERS Demonstration of Non-intrusive Traffic Data Collection Devices in Alaska 6. AUTHOR(S) AKSAS #76997/T Federal # HPR-4000(63) Erik D. Minge, P.E. 7. PERFORMING ORGANIZATION NAME(S) AND ADDRESS(ES) SFR Consulting Group, Inc. One Carlson Parkway, Suite 150 Minneapolis, MN SPONSORING/MONITORING AGENCY NAME(S) AND ADDRESS(ES) Alaska Department of Transportation and Public Facilities Research, Development &Technology Transfer 2301 Peger Rd Fairbanks, AK SUPPLEMENTARY NOTES 8. PERFORMING ORGANIZATION REPORT NUMBER SPONSORING/MONITORING AGENCY REPORT NUMBER FHWA-AK-RD a. DISTRIBUTION / AVAILABILITY STATEMENT 12b. DISTRIBUTION CODE No restrictions. 13. ABSTRACT (Maximum 200 words) The purpose of this document is to present findings from the Demonstration of Non-Intrusive Traffic Data Collection Devices in Alaska. This project was initiated by the Alaska Department of Transportation and Public Facilities (DOT&PF) to evaluate innovative methods for detecting traffic. Two different portable traffic detection systems were evaluated: a pole-mount radar system and a ground-mount axle-counting system. Data was collected from nine sites from July 2008 to February 2010, representing all three DOT&PF Regions. Results indicate that the pole-mounted system performed accurately in detecting traffic. However, several deployment issues were noted, namely the size and weight of the system s batteries, which impact the system s portability, and the need for a minimum amount of traffic in order to successfully calibrate the system. These deployment issues limit the utility of the system as a replacement for current data collection practices. The pole-mounted system was also briefly tested for its ability to detect pedestrians and bicyclists. The system demonstrated an ability to detect bicycles, but pedestrian detection was not satisfactory. Testing with the axle-based detection system did not produce valid traffic data. Alaska DOT&PF staff was not able to successfully setup and calibrate the system. 14. KEYWORDS: Traffic counting stations, traffic data, axle loads, radar vehicle detectors. 15. NUMBER OF PAGES PRICE CODE 17. SECURITY CLASSIFICATION OF REPORT 18. SECURITY CLASSIFICATION OF THIS PAGE 19. SECURITY CLASSIFICATION OF ABSTRACT N/A 20. LIMITATION OF ABSTRACT Unclassified Unclassified Unclassified N/A NSN STANDARD FORM 298 (Rev. 2-98) Prescribed by ANSI Std
5 i
6 i
7 APPROXIMATE CONVERSIONS TO SI UNITS METRIC (SI*) CONVERSION FACTORS APPROXIMATE CONVERSIONS FROM SI UNITS Symbol When You Know Multiply By To Find Symbol Symbol When You Know Multiply By To Find Symbol LENGTH LENGTH in inches 25.4 mm mm millimeters inches in ft feet m m meters 3.28 feet ft yd yards m m meters 1.09 yards yd mi Miles (statute) 1.61 km km kilometers Miles (statute) mi AREA AREA in 2 square inches millimeters squared cm 2 mm 2 millimeters squared square inches in 2 ft 2 square feet meters squared m 2 m 2 meters squared square feet ft 2 yd 2 square yards meters squared m 2 km 2 kilometers squared 0.39 square miles mi 2 mi 2 square miles 2.59 kilometers squared km 2 ha hectares (10,000 m 2 ) acres ac ac acres hectares ha MASS (weight) MASS (weight) oz Ounces (avdp) grams g g grams Ounces (avdp) oz lb Pounds (avdp) kilograms kg kg kilograms Pounds (avdp) lb T Short tons (2000 lb) megagrams mg mg megagrams (1000 kg) short tons T VOLUME VOLUME fl oz fluid ounces (US) milliliters ml ml milliliters fluid ounces (US) fl oz gal Gallons (liq) liters liters liters liters Gallons (liq) gal ft 3 cubic feet meters cubed m 3 m 3 meters cubed cubic feet ft 3 yd 3 cubic yards meters cubed m 3 m 3 meters cubed cubic yards yd 3 Note: Volumes greater than 1000 L shall be shown in m 3 TEMPERATURE (exact) TEMPERATURE (exact) o F Fahrenheit temperature 5/9 ( o F-32) Celsius temperature o C o C Celsius temperature 9/5 o C+32 Fahrenheit temperature o F ILLUMINATION ILLUMINATION fc Foot-candles lux lx lx lux foot-candles fc fl foot-lamberts candela/m 2 cd/cm 2 cd/cm 2 candela/m foot-lamberts fl FORCE and PRESSURE or STRESS FORCE and PRESSURE or STRESS lbf pound-force 4.45 newtons N N newtons pound-force lbf psi pound-force per 6.89 kilopascals kpa kpa kilopascals pound-force per psi square inch square inch These factors conform to the requirement of FHWA Order A *SI is the symbol for the International System of Measurements -40 o F -40 o C o F o C ii
8 TABLE OF CONTENTS CHAPTER 1. INTRODUCTION...1 Background... 1 Pole-Mount System Description... 1 Sidefire Axle Classification System Description... 4 Project Goals And Objectives... 5 CHAPTER 2. TEST METHODOLOGY...7 Baseline Data Collection And Verification... 7 Sensor Calibration... 7 Sensor Data Collection... 7 CHAPTER 3. DATA ANALYSIS...9 CHAPTER 4. TEST RESULTS...11 Test Plan Criterion 1: Evaluate Sensor Performance Test Plan Criterion 2: Document Sensor Deployment Issues CHAPTER 5. CONCLUSIONS...31 Pole-Mount System Axle-Based System CHAPTER 6. RECOMMENDATIONS...33 APPENDIX A: TEST LOG FORMS...35 iii
9 LIST OF FIGURES 1. Photo. Pole-mount System Components Photo. Pole-mount System Installation Photo. Axle-Based System Setup Graph. Per Lane Scatter Plots, Steese Highway North of Fox Graph. Both Lanes Scatter Plot, Steese Highway North of Fox Graph. Per Lane Scatter Plots, Peger Road at DOT Building Graph. All Lanes Scatter Plot, Peger Road at DOT Building Graph. Per Lane Scatter Plots, North Cushman Street at Illinois Street Graph. All Lanes Scatter Plot, North Cushman Street at Illinois Street Graph. All Directions Scatter Plot, Dalton Highway South of Yukon Bridge Graph. Per Lane Scatter Plots Mitchell Expressway West of Chena River Graph. All Lanes Scatter Plot, Mitchell Expressway West of Chena River Graph. Per Lane Scatter Plots, Seward Highway at Potter Marsh Graph. Both Lanes Scatter Plot, Seward Highway at Potter Marsh Graph. Glacier Highway/16 Mile PTR Station, Lane Graph. Glacier Highway/16 Mile PTR Station, Lane Graph. Glacier Highway/16 Mile PTR Station, Both Lanes Graph. Per Lane Scatter Plots, Riverside Drive Graph. Riverside Drive Scatter Plot, Both Lanes Graph. South Douglas Highway Scatter Plot, Both Lanes Graph. South Douglas Highway Scatter Plot, Both Lanes...26 iv
10 LIST OF TABLES 1. Wavetronix Sensor Specifications Recommended Accuracy Requirements Steese Highway North of Fox Statistical Summary Peger Road at DOT Building Statistical Summary North Cushman Street at Illinois Street Statistical Summary Dalton Highway South of Yukon Bridge Statistical Summary Mitchell Expressway West of Chena River Statistical Summary Seward Highway at Potter Marsh Statistical Summary Glacier Highway/16 Mile PTR Station Statistical Summary Riverside Drive Statistical Summary South Douglas Highway at John Street Statistical Summary Bicycle and Pedestrian Counts Deployment Issues (Pole-Mount System) Summary of Results...31 v
11
12 ABSTRACT The purpose of this document is to present findings from the Demonstration of Non- Intrusive Traffic Data Collection Devices in Alaska. This project was initiated by the Alaska Department of Transportation and Public Facilities (DOT&PF) to evaluate innovative methods for detecting traffic. Two different portable traffic detection systems were evaluated: a pole-mount radar system and a ground-mount axle-counting system. Data was collected from nine sites from July 2008 to February 2010, representing all three DOT&PF Regions. Results indicate that the pole-mounted system performed accurately in detecting traffic. However, several deployment issues were noted, namely the size and weight of the system s batteries, which impact the system s portability, and the need for a minimum amount of traffic in order to successfully calibrate the system. These deployment issues limit the utility of the system as a replacement for current data collection practices. The pole-mounted system was also briefly tested for its ability to detect pedestrians and bicyclists. The system demonstrated an ability to detect bicycles, but pedestrian detection was not satisfactory. Testing with the axle-based detection system did not produce valid traffic data. Alaska DOT&PF staff was not able to successfully setup and calibrate the system.
13
14 CHAPTER 1. INTRODUCTION BACKGROUND This project, Demonstration of Non-Intrusive Traffic Data Collection Devices in Alaska (T ), was initiated in 2008 to procure and field test two innovative methods for collecting traffic data. These methods were sought as alternatives to conventional data collection practices, such as road tubes and inductive loop detectors, which do not function well in certain data collection environments experienced in Alaska. Specifically, road tubes are difficult to use on gravel roads because they can be easily punctured and pulled out of position. Also, inductive loops are subject to damage as the roadways in which they are installed expand and contract with changing seasons. Tubes and loops have the additional safety issue of exposing personnel to traffic during their installation. In 2005, the Alaska DOT&PF participated in a pooled fund study to develop and evaluate an innovative method for detecting traffic, the Portable Non-Intrusive Traffic Detection System (PNITDS). Based on the outcome of the PNITDS project, and on the shortcomings of existing practices, the DOT&PF decided to procure three pole-mounted radar systems and three nonintrusive axle-counting systems for deployment and testing. In May 2008, DOT&PF data collection personnel from each region were trained on the operation of the pole-mounted systems. Data was then collected from nine sites between July 2008 and February Data collection occurred on a combination of two and four lane roadways in the Fairbanks area (Northern Region), Juneau area (Southeast Region) and the Anchorage area (Central Region). Sensor data was compared to a baseline data source, typically an in place Permanent Traffic Recorder (PTR) station that utilizes inductive loop detectors. Data collection personnel were also tasked with recording information about the roadway geometry, location of the sensor, and notes pertaining to issues related to the system setup or calibration. In addition, the pole-mounted system was used to detect pedestrians and bicyclists at one of the test sites. The purpose of this report is to document the performance of the non-intrusive detection systems as tested by the DOT&PF personnel. Issues encountered during system deployment and calibration are also noted. In addition, the feasibility of integrating these non-intrusive systems into the Alaska DOT&PF s data collection program is explored in the Conclusion chapter. POLE-MOUNT SYSTEM DESCRIPTION The pole-mount system is intended to collect traffic volume, speed and vehicle classification in a variety of locations. When mounted to existing roadside infrastructure, such as a sign, vehicles are detected with a radar sensor in a side-fire fashion. The system uses high-capacity, deep-cycle batteries that are charged and then left to power the system for the duration of the seven-day data collection period. Data is stored in bins on the sensor s internal memory. The system is designed to detect motorized traffic, but detection of bicycles and to a lesser extent pedestrians, was also examined for this project. 1
15 A complete system is comprised of two or three vertical poles with mounting hardware, a telescoping rod for fine vertical angle adjustment, batteries, and battery box. A laptop or PDA is also needed to configure the sensor and download data at the end of the collection period. As designed, a two-pole setup can host a sensor to a height of 16 feet and a three-pole setup can support a sensor to a height of 24 feet. For sensors mounted at 16 feet, the mounting angle can be adjusted from the ground with a telescoping pole. Higher than this, adjustments need to be made by hand. Based on the results of the PNITDS pooled fund study, the Wavetronix SmartSensor HD was selected for this application. Refer to Table 1 for the Wavetronix sensor s specifications. Table 1. Wavetronix Sensor Specifications Specification Wavetronix SmartSensor HD Technology Digital Radar Traffic Data - Volume - Speed - 3 User Defined Class by Length Output Type - Contact closure - Ethernet serial adapter (TCP/IP Addressable) Installation Height Installation Offset (sidefire only) Detection Range Up to 8 lanes (200 total distance) Power Supply 9-36 VDC, 7.5 W Comm. Interface RS or RS Cost $5,666 (including cabling & software) A set of nine mechanical drawings for the pole-mounted system was prepared for this project. These drawings were provided earlier in the project s System Specifications document. Power is supplied by four 12 VDC deep cycle rechargeable 55 amp-hour batteries (Optima Spiralcell) that were purchased for the system. Each battery can support a 7.5-watt Wavetronix HD sensor for a minimum of three days. Four batteries can support the system for nine days without depleting the battery below 20 percent of its capacity. Off-the-shelf battery cases were also procured to house the batteries and any necessary accessories onsite during the test. Refer to Figure 1, a photograph of the pole-mounted system, and Figure 2, system setup during the training in May Note that the final battery box selected for this project was larger than the box shown in Figure 1. The size and weight of the battery power system was identified as an issue in deploying and transporting the system. This issue is further addressed in Chapter 4. 2


16 Figure 1. Photo. Pole-mount System Components Figure 2. Photo. Pole-mount System Installation 3

17 SIDEFIRE AXLE CLASSIFICATION SYSTEM DESCRIPTION The axle classification system evaluated by this project is the AxleLight sensor manufactured by PEEK. This system uses laser sensors mounted on one side of the road to detect traffic volume, speed and axle based classification. The system can classify vehicles with FHWA s 13-class scheme or a user-configurable classification scheme. Site selection is an important criterion for deploying the system. The system is most often mounted on guardrail adjacent to the roadway. In order to do classification, two AxleLight sensors should be mounted approximately 10 to 15 feet apart on posts (such as guard rail posts). The sensors must be mounted so that the lasers are one to two inches higher than the crown of the roadway. The sensor mounting hardware has fine adjustment capabilities that allow adjustment to the height, horizontal angle and vertical angle of the lasers. Each of these lasers is connected to a data recorder. The AxleLight uses ranging lasers to determine the distance from the sensor to the vehicle. The sensor constantly outputs a laser beam and vehicles that pass by the sensors reflect the laser back. The laser interprets the information that is reflected back and assigns the axle hit to a lane. Configuration is mostly a manual process. The sensor s configuration tool reports back the axle hit that was nearest to the sensor and uses that information to determine the dimensions of the first lane. The user can enter a lane width that the sensor adds to the first lane to determine the dimensions of the additional lanes. If the lane geometry differs from this configuration, such as if there is a median, there are options for manually inputting lane information. See Figure 3 for a photo of the system. As discussed further in Chapter 4, calibration proved to be a significant issue in the use of this sensor. Figure 3. Photo. Axle-Based System Setup 4
18 PROJECT GOALS AND OBJECTIVES The primary goal of this project is to evaluate whether the non-intrusive traffic detection systems can be successfully integrated into the Alaska DOT&PF s data collection program. This evaluation focused on two aspects: first, the performance of the sensor in terms of accuracy when compared to an inductive loop or road tube based counter; and second, the ease of deployment and calibration at a field site. To be successful, the system must be able to accurately detect traffic in multiple lanes under various conditions without exposing personnel to traffic. This must be accomplished within the existing resources of the Department s data collection program. Two goals and supporting objectives were developed as part of the Evaluation Test Plan to guide the evaluation. Goal 1: Compare Sensor Performance to Alternate Data Collection Practices in Various Locations Objective 1-1: Evaluate Performance on High Volume Roads Objective 1-2: Evaluate Performance on Low Volume Roads Objective 1-3: Evaluate Performance on Gravel Roads Objective 1-4: Evaluate Performance for Bike and Pedestrian Detection Objective 1-5: Evaluate Performance on Roads with Rutting Objective 1-6: Evaluate Performance in Other Situations Goal 2: Document Sensor Deployment Issues Objective 2-1: Document Deployment Issues in Various Locations Objective 2-2: Document Deployment Issues on Various Post Types Objective 2-3: Document Calibration Issues Objective 2-4: Document Maintenance Issues Objective 2-5: Document System Costs The Evaluation Test plan was developed to address the following questions: How to mount the pole-mount to existing roadside infrastructure (i.e., guard rail posts, roadside signs)? Which locations offer ease of installation and best sensor performance? Pros and cons of the selected battery system? What are the system costs, including all components and sensors? Should the systems be incorporated into the Department s data collection program? 5
19
20 CHAPTER 2. TEST METHODOLOGY BASELINE DATA COLLECTION AND VERIFICATION Inductive loop detectors and piezo-electric sensors provide an excellent source of baseline data because they are accurate and reliable when correctly installed and calibrated. At least one test in each region was conducted at an existing PTR station. Manual data collection was used for bicycle and pedestrian counts. Since the system evaluation relies on comparisons between the sensor and a baseline data source, it was important to verify proper performance of the baseline source before each test. Baseline verification for traffic volumes consisted of manually collecting sample data (ideally 50 observations) and comparing the results to a baseline source. SENSOR CALIBRATION The traffic sensors must be carefully calibrated before the start of any official data collection. The calibration of a sensor consists of an iterative process including sensor aiming, calibration, and sample data collection. Vendor guidelines were followed and the ease of calibration was documented. Suggested accuracy targets for volume, speed and classification using either the Wavetronix or AxleLight systems is presented in Table 2. Table 2. Recommended Accuracy Requirements Traffic Parameter Volume Speed Classification Accuracy for Typical Applications 2 to 7 percent 2 to 5 mph 10 to 20 percent per class SENSOR DATA COLLECTION Data collection consisted of allowing the sensor to automatically record traffic volumes for a specified time (from one to nine days) and extracting the data to a text file for analysis. At the completion of each test a log document was completed indicating the time and location of the test, as well as the lane/roadway geometry and any issues encountered during setup and calibration. The test log forms are provided in Appendix A. 7
21
22 CHAPTER 3. DATA ANALYSIS This chapter presents the standard statistical analysis techniques for evaluating the sensors performance. Data analysis focuses on comparing the sensor volume data against the verified baseline data. Percentage Difference: The percent difference is an easily understood expression of the difference between data sets. A lower number indicates less difference between the test data and baseline data. Absolute Percentage Difference: The absolute percent difference is similar to percent difference, but is calculated from the absolute value of the differences for each time interval. This information indicates how close the data collected from the sensors are to the baseline data without the compensating errors caused by data aggregation. Absolute percentage difference is always equal to or greater than percent difference. Scatter Plots: Scatter plots show the relationship between two sets of numbers as one series of x-y coordinates. Each point on a scatter plot represents aggregated traffic data for a onehour sample interval as measured on the horizontal axis (baseline data), and the sensor being tested on the vertical axis. All data points falling on a straight line represent perfect agreement between the two compared data sets which provides a powerful, straightforward visual representation of variation between sensor data and baseline data. Correlation Coefficient: The correlation coefficient is a dimensionless index that ranges from -1.0 to 1.0. It quantifies the linear nature of the data points seen on a scatter plot, providing a measure of each sensor s variation from the baseline data from one time interval to the next. The closer the correlation coefficient is to 1.0, the more closely the data sets match. The Pearson s product-moment correlation coefficient was calculated for each of the evaluation tests. 9
23
24 CHAPTER 4. TEST RESULTS As described earlier, two criteria were established to guide evaluation activities, examining sensor accuracy and deployment issues. Sensor accuracy is addressed in the following section and deployment issues are covered in the next section, beginning on page 27. TEST PLAN CRITERION 1: EVALUATE SENSOR PERFORMANCE The results presented in this section are only for the pole-mounted Wavetronix system. No valid data was collected from the axle-based system (AxleLight) because DOT&PF personnel were not able to get the units to operate successfully. The AxleLight issues are explored in the next section. The results presented here are primarily for vehicle detection. Bicycle and pedestrian detection was attempted at one location, the South Douglas Highway at John Street in the Southeast Region. See the last test site in this section. Northern Region Steese Highway North of Fox, Alaska This test occurred on a section of Steese Highway, which runs in a northeast/southwest direction just north of Fox, Alaska, a town approximately 10 miles north of Fairbanks. The roadway is a two-lane undivided rural highway, with a 55 MPH speed limit. The Wavetronix SmartSensor HD was installed approximately 16 feet from the traveled way at a height of approximately 16 feet. Reported calibration time at this site was one hour. Field notes indicate that there was some difficulty with calibration, as the sensor reported an alignment error. Nevertheless, the data appeared to have good agreement with observed traffic. A clock error in the Wavetronix required a minor adjustment to the collected data (one hour shift) for analysis. In general, the data showed good correlation between the PTR and the Wavetronix. The correlation coefficient and the scatter plots both indicate high similarity between the data sets. The measures of data distribution (standard deviation and variance) are also similar between the data sets, this also indicates good agreement. See Table 3 for a summary of calculated statistics. See Figures 4 and 5 for scatter plots of the sensor vs. PTR data. As described in Chapter 3, data points falling on a straight line represent agreement between the two data sets. The PTR data is shown on the x-axis and the Wavetronix data on the y-axis. The absolute percent difference is higher for the northbound lane than southbound (7.4 vs. 4.1 percent). This is likely due to two factors: 1) an unresolved alignment error message reported by the Wavetronix, and; 2) lower volumes in the eastbound lane may have affected calibration and gave a smaller sample for comparison. Overall absolute error was 5.6 percent, and the percent difference, which allows compensating errors due to data aggregation, was 1.6 percent. Both of these values fall within the expected accuracy target of 2 to 7 percent. 11
25 Table 3. Steese Highway North of Fox Statistical Summary Lane 1 (NB) Lane 2 (SB) All PTR Volume 1,958 2,005 3,963 Sensor Volume 2,014 2,011 4,025 Percent Difference 2.9% 0.3% 1.6% Abs Percent Difference 7.4% 4.1% 5.7% Correlation Coefficient Lane 1 Lane Lane 1 80 Lane Figure 4. Graph. Per Lane Scatter Plots, Steese Highway North of Fox Both Lanes Both Lanes Figure 5. Graph. Both Lanes Scatter Plot, Steese Highway North of Fox 12
26 Northern Region Peger Road at DOT Building Peger Road is a north/south four-lane roadway in Fairbanks. There is also a center turn lane that is shared by traffic traveling in both directions. The chosen site (near the DOT&PF building at 2301 Peger Road) is in a low to mid-density urban area with a 45 MPH speed limit and signalized intersections. The Wavetronix was installed 22 feet from the edge of the traveled roadway at a height of 16 feet. As with the Steese Highway site, the sensor reported an alignment error, although it appeared to count vehicles correctly. The center turn lane was not included in the analysis because there were no loops available to provide a baseline reference. In addition, staff was not trained on how to setup the Wavetronix to function on a bi-directional lane. A time shift adjustment of nine hours to the Wavetronix data was required to correct for a clock error. Overall, the data displays good correlation between the Wavetronix and PTR. The lanes farthest from the detector (three and four) showed increased error at higher volumes, as shown in the scatter plots. However, the correlation coefficient and percent difference indicate similarity between the data sets. Aggregated (all lanes) absolute error was 6 percent, within the target accuracy range. The greater error in more distant lanes may be attributable to the unresolved alignment error reported by the sensor. Table 4 details the computed statistics for this site s data sets. Table 4. Peger Road at DOT Building Statistical Summary Lane 1 (NB) Lane 2 (NB) Lane 3 (SB) Lane 4 (SB) All PTR Volume 17,363 30,405 26,268 25,268 99,586 Sensor Volume 17,651 30,647 26,779 25, ,754 Percent Difference -1.7% -0.8% -0.9% -1.6% -1.2% Abs Percent Difference 5.7% 5.2% 6.6% 6.3% 6.0% Correlation Coefficient
27 Lane 1 Lane Lane Lane Lane 3 Lane Lane Lane Figure 6. Graph. Per Lane Scatter Plots, Peger Road at DOT Building All Lanes All Lanes Figure 7. Graph. All Lanes Scatter Plot, Peger Road at DOT Building 14
28 Northern Region North Cushman Street at Illinois Street The Cushman Street site was located just north of a bridge near the Fairbanks Central Business District (CBD). At this site, Cushman Street runs north/south and has four lanes with a 30 MPH speed limit. The Wavetronix was installed 14 feet from the roadway at a height of 16 feet. No calibration difficulties were reported, but the data from the sensor required a one-hour adjustment to correct for a clock error. This site shows anomalous error readings from Lane 2 (northbound, inside lane). Where other individual lanes error ranges from 3.2 to 4.4 percent difference, Lane 2 had 13.5 percent difference. There are several different possible explanations for this condition. There is a leftturn lane just to the north of the detection site, and a substantial portion of the traffic could be changing lanes at this location, which can influence Wavetronix accuracy. Also, the volume is much lower in this lane than the others that can affect accuracy through less accurate calibration and lower overall sample sizes. The other lanes all showed very good agreement with percent differences below five percent. Table 5. North Cushman Street at Illinois Street Statistical Summary Lane 1 (NB) Lane 2 (NB) Lane 3 (SB) Lane 4 (SB) All PTR Volume 47,971 12,160 31,337 20, ,034 Sensor Volume 49,423 10,540 32,096 20, ,797 Percent Difference 3.0% -13.3% 2.4% 0.8% 0.7% Abs Percent Difference 3.2% 13.5% 3.2% 4.4% 4.6% Correlation Coefficient
29 l ane 1 l ane l ane l ane l ane 3 l ane l ane 3 l ane Figure 8. Graph. Per Lane Scatter Plots, North Cushman Street at Illinois Street All Lanes All Lanes Figure 9. Graph. All Lanes Scatter Plot, North Cushman Street at Illinois Street 16
30 Northern Region Dalton Highway South of Yukon Bridge The Dalton Highway site is at a remote location near the E.L. Patton Bridge over the Yukon River. This roadway is characterized by low overall volumes with a high percentage of heavy truck traffic. The roadway itself has a hard surface with narrow, gravel shoulders and does not have lanes marked. PTR data is captured as a bi-directional total, so that individual direction/lane data is not available. Of all test sites examined, the overall accuracy for the Wavetronix was the lowest at this site, with an overall absolute percent difference of 13.8 percent. Several factors may contribute to the comparatively poor performance: 1) The PTR baseline may have inaccuracies that make comparison to Wavetronix data less meaningful. 2) The Wavetronix sensor operates on the principal of directional lanes of traffic. The lack of lane markings may have allowed traffic to travel in either direction in a virtual lane, pushing the limits of the sensor. 3) The low volumes result in small sample sizes and smaller number of vehicles to use during the calibration process. 4) The high proportion of truck traffic may have exacerbated the tendency of a detector to double count long or articulated vehicles. Although the correlation coefficient was still greater than 0.87, the scatter plot and distribution statistics show significant differences between the PTR and Wavetronix data. For future use, manually adjusting detection parameters (lane widths, sensitivities, etc.) may improve sensor performance in difficult conditions such as those at the Yukon River Bridge. Summary statistics are shown in the table below. Table 6. Dalton Highway South of Yukon Bridge Statistical Summary All Traffic PTR Volume 2,359 Sensor Volume 2,161 Percent Difference -8.5% Abs Percent Difference 13.8% Correlation Coefficient
31 Both Directions Both Directions Figure 10. Graph. All Directions Scatter Plot, Dalton Highway South of Yukon Bridge Northern Region Mitchell Expressway West of Chena River Mitchell Expressway is a four lane divided highway west of the Fairbanks CBD with a northwest/southeast orientation. This roadway has a grass median with paved shoulders in both directions and a speed limit of 55 MPH. The Wavetronix was installed 16 feet from the edge of traveled pavement at a height of 16 feet. A one-hour adjustment was needed to correct for a clock error in the sensor, but no other setup difficulties were noted. Overall sensor performance was very good with an all lanes absolute percent difference was 1.5 percent, and no lane exceeding 4.7 percent. Correlation coefficients were all above 0.99 and measures of distribution were very close for all lanes. Lane 3 shows the greatest error from the PTR data. The scatter plot shows these errors to be distributed throughout the range of volumes observed. These errors could be accounted for by either sensor or PTR (loop) calibration problems. 18
32 Table 7. Mitchell Expressway West of Chena River Statistical Summary Lane 1 (NB) Lane 2 (NB) Lane 3 (SB) Lane 4 (SB) All Lanes PTR Volume 44,199 9,306 5,731 55, ,274 Sensor Volume 44,239 9,567 5,581 55, ,944 Percent Difference 0.1% 2.8% -2.6% 1.6% 0.6% Abs Percent Difference 0.8% 2.7% 4.7% 1.4% 1.5% Correlation Coefficient Lane 1 Lane Lane Lane Lane 3 Lane Lane Lane Figure 11. Graph. Per Lane Scatter Plots Mitchell Expressway West of Chena River 19
33 Total Total Figure 12. Graph. All Lanes Scatter Plot, Mitchell Expressway West of Chena River Central Region Seward Highway at Potter Marsh Seward Highway in the vicinity of the test site is a two-lane 55 MPH roadway bounded by a large wetland area (Potter Marsh) to the east and a railroad facility to the west. The sensor was installed 25 feet from the nearest traveled lane, at a height of 24 feet. The detection area past the southbound lane was deactivated in the sensor, to prevent detection of trains. Some bicycle traffic was also observed on the shoulder of the roadway, but it is not likely that the sensor detected this. No other issues were reported with installation and calibration. A large volume of data was returned for this sensor, covering approximately nine months. Examination of this data suggested that the sensor was not properly aligned during most of its operational period. Because of this, only a subset of data was selected for analysis: 11/13/2009 to 11/22/2009. During that time, sensor volumes matched the PTR-recorded volumes. This data also required an adjustment to match PTR time data to Wavetronix time data of 11 hours. Sensor performance was fair in this test, with an overall absolute percent difference of 5.7 percent. Examination of the scatter plots shows that several anomalous or outlier data points are influencing the percent difference calculation, as the correlation coefficient and distribution statistics still indicate a fair degree of agreement between the data sets. These outlier points may be explained by poor lane discipline as snow events may have obscured the pavement markings. 20
34 Table 8. Seward Highway at Potter Marsh Statistical Summary Lane 1 (NB) Lane 2 (SB) Both Lanes PTR Volume 27,002 27,027 54,029 Sensor Volume 27,377 28,974 56,351 Percent Difference 1.4% 7.2% 4.3% Abs Percent Difference 3.5% 7.7% 5.7% Correlation Coefficient Lane 01 Lane Lane Lane 02 Figure 13. Graph. Per Lane Scatter Plots, Seward Highway at Potter Marsh Both Lanes Both Lanes Figure 14. Graph. Both Lanes Scatter Plot, Seward Highway at Potter Marsh 21
35 Southeast Region Glacier Highway/16 Mile PTR Station Glacier Highway at the test site is an undivided, two-lane rural highway with paved shoulders in each direction. In this case the sensor was installed 20 feet from the nearest traveled lane at a height of 22 feet. A long calibration period was noted by field personnel during set-up, due to the low traffic volumes on the road. No other issues that would affect volume measurement were noted. The Wavetronix had very good performance, with an aggregate absolute percent difference of 2.8 percent. Correlation was above 0.99 in all cases and measures of distribution were very close for both lanes and the aggregate volume comparison. Table 9. Glacier Highway/16 Mile PTR Station Statistical Summary Lane 1 Lane 2 Both Lanes PTR Volume 4,611 4,575 9,186 Sensor Volume 4,589 4,575 9,164 Percent Difference -0.5% 0.0% -0.2% Abs Percent Difference 2.9% 2.6% 2.8% Correlation Coefficient Lane Lane Figure 15. Graph. Glacier Highway/16 Mile PTR Station, Lane 1 22
36 Lane Lane Figure 16. Graph. Glacier Highway/16 Mile PTR Station, Lane 2 Both Lanes Both Lanes Figure 17. Graph. Glacier Highway/16 Mile PTR Station, Both Lanes Southeast Region Riverside Drive Riverside Drive at the test site runs through a low-density residential/rural area. The roadway geometry is unusual in that wide, paved shoulders may be used by bicycle traffic in addition to a separate bicycle/pedestrian facility located on the east side of the roadway. The sensor for this test was installed 12 feet from the traveled roadway at a height of 15 feet. 23
37 Several equipment-related issued were reported during the set-up, consisting of multiple replacements of the Click 200 device that provided the physical interface between the Wavetronix and the computer used for calibration. Once replaced and correctly connected, the sensor calibrated without further issues. Performance at this site was again good, with aggregated absolute percent difference at 4.7 percent, which is below the seven percent target. Other measures and the scatter plots reinforce the assessment that the sensor performed well during the test. Table 10. Riverside Drive Statistical Summary Lane 1 Lane 2 Both Lanes PTR Volume 7,160 7,629 14,789 Sensor Volume 7,282 7,851 15,133 Percent Difference 1.7% 2.9% 2.3% Abs Percent Difference 4.6% 4.8% 4.7% Correlation Coefficient Lane 1 Lane Lane Lane Figure 18. Graph. Per Lane Scatter Plots, Riverside Drive 24
38 Both Lanes Both Lanes Figure 19. Graph. Riverside Drive Scatter Plot, Both Lanes Southeast Region South Douglas Highway at John Street South Douglas Highway at Johns Street is a residential two-lane undivided roadway with a 40 MPH speed limit, High Occupancy Vehicle (HOV) shoulder and a bicycle/pedestrian facility on the east side of the roadway. The sensor was installed nine feet from the traveled roadway at a height of 19 feet. This geometry approaches the limit for maximum height at a nine-foot offset recommended by the manufacturer to traffic for optimal performance. Field personnel reported a long calibration period (one hour) due to the low traffic volume. To assist in the calibration process, personnel used their own vehicle to provide a calibration target. Sensor performance is only fair at this site. The absolute percent differences for each lane were 8.6 and 9.1 percent. The geometry of the installation and small calibration sample likely account for the poorer accuracy at this site. The scatter plots illustrate the divergence of PTR and sensor data. Table 11. South Douglas Highway at John Street Statistical Summary Lane 1 (SB) Lane 2 (NB) Both Lanes PTR Volume 24,190 24,743 48,933 Sensor Volume 24,151 24,583 48,734 Percent Difference -0.2% -0.6% -0.4% Abs Percent Difference 8.6% 9.1% 8.8% Correlation Coefficient
39 Lane 1 Lane Lane Lane Figure 20. Graph. Per Lane Scatter Plots, South Douglas Highway Both Lanes Both Lanes ,000 Figure 21. Graph. South Douglas Highway Scatter Plot, Both Lanes Bicycle and Pedestrian Detection (South Douglas Highway site) The Wavetronix was also evaluated for its performance with bicycle and pedestrian traffic at the South Douglas Highway site. Data was manually collected, as no automated counter is present for this type of traffic. Manual data collection occurred on February 8, 2010 from 9:45 A.M. to 1:30 P.M. in 15-minute increments. Since the Wavetronix uses one-hour bins for data collection, the manual count was aggregated to a total four hourly data points. The complete hour-level data for bicycles and pedestrians is shown in Table 12 below. 26
40 Time Wavetronix Bike and Ped Manual Count 10:00: :00: :00: :00: TOTAL Table 12. Bicycle and Pedestrian Counts Field observations of the unit during testing revealed that bicycles were consistently detected by the detector, but pedestrians were not always detected, and often a group of pedestrians was counted as one. The possibility for bicycles and pedestrians to move in either direction in a detection lane, the lack of any specific manual tuning for this application, and the small sample size preclude making any definitive statements about the effectiveness of the Wavetronix HD for use with bicycle and pedestrian detection. Discussions with Wavetronix about this application reveal that the unit is optimized solely for vehicular traffic detection suggests that the sensor is not suited to this application. TEST PLAN CRITERION 2: DOCUMENT SENSOR DEPLOYMENT ISSUES Axle-Based System As mentioned earlier, DOT&PF personnel were not able to successfully install and calibrate the AxleLight system. DOT&PF personnel worked directly with the sensor manufacturer for system setup and training. Interviews conducted with these personnel indicate that several attempts were made to make the system operational, primarily in the Southeast Region, but the efforts were eventually abandoned due to the time and effort that was expended. Recent work to get the system repaired and used by the Northern Region is ongoing. Some additional deployment issues noted for the axle-based system: AxleLight system requires a lead acid battery system to power the system for the one-week data collection periods. The size and weight of this battery limits the portability of the device. Severe rutting on many of the roadway in Alaska results in vehicle tires being an inch or more lower than the surrounding roadway surface. This lessens the clearance between the pavement and vehicle body as seen by the AxleLight sensor, making site selection and calibration more challenging. AxleLight installations require the two roadside units to be aimed parallel to one another. Obtaining and verifying proper alignment proved challenging in the field deployments. The mechanism for strapping the units to guard rail posts made it difficult to obtain a secure attachment. Data collection personnel customized this portion of the system. 27
41 However, the AxleLight system has been successfully used by other State DOTs, and is being tested in other research projects. For example, AxleLight is included in the pooled fund study Evaluation of Non-Intrusive Traffic Detection Technologies Phase III (TPF-5(171). Preliminary results from this study indicate that challenges have been encountered with system setup and calibration, but valid data has been obtained from the unit. Final results from this study will be published in August Pole-Mount System Several deployment issues were noted with the pole-mounted system. The primary issue is the weight and size of the battery system, which limits the portability of the system. The seven-day data collection periods used by the Alaska DOT&PF require a battery system of this size in order to power the system. Other deployment issues noted for the pole-mounted system: A minimum number of vehicles are needed for the sensor to auto-calibrate after installation. In some low-volume locations, an excessive amount of time (more than one hour was required to reach this number. The sensor occasionally reported an alignment error that could not be corrected, but did not appear to affect detection, and thus was unresolved. Incorrect local time settings in the sensor clock resulted in post-processing to match data sets. Table 13 summarizes the issues reported by data collection personnel on the test log sheets. 28
42 Location Table 13. Deployment Issues (Pole-Mount System) Issue Description Northern Region Steese Highway North of Fox Sensor reported alignment issue that could not be identified by field personnel Clock offset by one hour Peger Road at DOT Building Sensor reported alignment issue that could not be identified by field personnel Clock offset by nine hours North Cushman St at Illinois St Clock offset by one hour Dalton Highway South of Yukon Bridge Clock offset by one hour Mitchell Expressway West of Chena River Clock offset by one hour Central Region Seward Highway at Potter Marsh None Southeast Region Glacier Highway/16 Mile PTR Station Low volume resulted in long calibration times Riverside Drive Hardware failures in Click 200 interface unit South Douglas Highway at John St Low volume resulted in long calibration times 29
43 30
44 CHAPTER 5. CONCLUSIONS POLE-MOUNT SYSTEM The pole-mounted Wavetronix HD sensor proved to be a capable method for collecting traffic volumes. Extensive testing at nine different locations throughout the state established it as an accurate sensor, with results generally within the percent difference target of 5 percent, see Table 14. Location Table 14. Summary of Results Percent Difference (All Lanes) Absolute Percent Difference (All Lanes) Northern Region Steese Highway North of Fox 1.6% 5.6% Peger Road at DOT Building -1.2% 6.0% North Cushman St at Illinois St 0.7% 4.6% Dalton Highway South of Yukon Bridge -8.5% 13.8% Mitchell Expressway West of Chena River 0.6% 1.5% Central Region Seward Highway at Potter Marsh 4.3% 5.7% Southeast Region Glacier Highway/16 Mile PTR Station -0.2% 2.8% Riverside Drive 2.3% 4.7% South Douglas Highway at John St -0.4% 8.8% The diversity of test locations verified the system performance on four out of the five performance test objectives: high volume roads, low volume roads, gravel roads, and roads with rutting. However, the performance test objective to detect bicycles and pedestrians was inconclusive. Testing on the South Douglas Highway in the Southeast Region provided a relatively small sample size, making definitive statements about the detector s accuracy difficult, but the testing that was done reveals that the sensor is capable of counting bicycles, but not pedestrians. Discussions with the manufacturer indicate the sensor has been developed for vehicular traffic detection only. The system s deployment issues were also assessed through several different test objectives. The most significant deployment issue is the size and weight of the battery system, which is needed to power the unit for the desired seven days of data collection. Battery system s large size and weight negatively affect how the system can be transported and deployed. Another significant 31
45 issue is the time required to calibrate the unit in locations with low traffic volumes. A certain amount of traffic is required for the system to auto-calibrate, making the system impractical for use on low-volume roadways. The system also proved difficult to deploy in areas that lack clear lanes and/or direction of travel, such as the Dalton Highway at Yukon Bridge test site. Related to this are roadways that experience poor lane discipline when snow obscures the pavement. Also noted was difficulty in finding roadside infrastructure to attach the system s pole to. The consensus of the data collection staff is that the Wavetronix system is an accurate traffic counting device that is relatively easy to calibrate, but the deployment issues noted above make it unable to compete with conventional road tubes and loop detector stations. For example, a data collection crew can install 20 road tube systems in a single day, making it a more cost-effective alternative. The utility of a system in a portable application must consider multiple factors, including transportability, site selection, setup time, cost and accuracy. For the Alaska DOT&PF s uses, the Wavetronix system is better suited to permanent or semi-permanent installations. AXLE-BASED SYSTEM The axle-based system, AxleLight, was not successfully tested in this project due to difficulty encountered in setting up and calibrating the units. Data collection personnel made several attempts to deploy the system in the Southeast Region, but the efforts there were eventually abandoned due to the time and effort that was expended. Other regions of the state are now experimenting with the device, but no results are available for this report. 32
46 CHAPTER 6. RECOMMENDATIONS Alaska DOT&PF personnel have gained valuable experience in setting up and collecting data with the non-intrusive systems tested through this project. This experience has provided insight into what is needed to meet their data collection needs. The following recommendations are offered for the Department s consideration: Investigate other, simpler, sensors that would meet the Northern Region s detection needs for low-volume roads. Other sensors on the market consume less power (reducing battery requirements) and are more quickly deployed (simply aim at the detection zone, no calibration required). Some sensors that may meet these requirements are manufactured by Quixote, Jamar, Telmark, MSedco and ASIM. Examine methods used by other public agencies to collect bicycle and pedestrian data and explore how these approaches could be integrated with existing data collection programs. Review findings from other research and/or contact state DOTs that have experience with the AxleLight sensor to understand how this system could be better used. Work with the AxleLight manufacturer to get the current systems operational. Continue to use and evaluate the non-intrusive systems in order to understand what, if any, environmental factors affect their performance. Consider using shorter data collection periods in order to reduce the size and weight of the battery needed to power the non-intrusive systems. 33
47
48 APPENDIX A: TEST LOG FORMS 35
49
50
51
52
53
54
55
56
57
58
59
60
61
62 REPORT DOCUMENTATION PAGE Form approved OMB No. Public reporting for this collection of information is estimated to average 1 hour per response, including the time for reviewing instructions, searching existing data sources, gathering and maintaining the data needed, and completing and reviewing the collection of information. Send comments regarding this burden estimate or any other aspect of this collection of information, including suggestion for reducing this burden to Washington Headquarters Services, Directorate for Information Operations and Reports, 1215 Jefferson Davis Highway, Suite 1204, Arlington, VA , and to the Office of Management and Budget, Paperwork Reduction Project ( ), Washington, DC AGENCY USE ONLY (LEAVE BLANK) 2. REPORT DATE 3. REPORT TYPE AND DATES COVERED FHWA-AK-RD TITLE AND SUBTITLE May 2010 FINAL, February 1, 2008 to May 31, FUNDING NUMBERS Demonstration of Non-intrusive Traffic Data Collection Devices in Alaska 6. AUTHOR(S) AKSAS #76997/T Federal # HPR-4000(63) Erik D. Minge, P.E. 7. PERFORMING ORGANIZATION NAME(S) AND ADDRESS(ES) SFR Consulting Group, Inc. One Carlson Parkway, Suite 150 Minneapolis, MN SPONSORING/MONITORING AGENCY NAME(S) AND ADDRESS(ES) Alaska Department of Transportation and Public Facilities Research, Development &Technology Transfer 2301 Peger Rd Fairbanks, AK SUPPLEMENTARY NOTES 8. PERFORMING ORGANIZATION REPORT NUMBER SPONSORING/MONITORING AGENCY REPORT NUMBER FHWA-AK-RD a. DISTRIBUTION / AVAILABILITY STATEMENT 12b. DISTRIBUTION CODE No restrictions. 13. ABSTRACT (Maximum 200 words) The purpose of this document is to present findings from the Demonstration of Non-Intrusive Traffic Data Collection Devices in Alaska. This project was initiated by the Alaska Department of Transportation and Public Facilities (DOT&PF) to evaluate innovative methods for detecting traffic. Two different portable traffic detection systems were evaluated: a pole-mount radar system and a ground-mount axle-counting system. Data was collected from nine sites from July 2008 to February 2010, representing all three DOT&PF Regions. Results indicate that the pole-mounted system performed accurately in detecting traffic. However, several deployment issues were noted, namely the size and weight of the system s batteries, which impact the system s portability, and the need for a minimum amount of traffic in order to successfully calibrate the system. These deployment issues limit the utility of the system as a replacement for current data collection practices. The pole-mounted system was also briefly tested for its ability to detect pedestrians and bicyclists. The system demonstrated an ability to detect bicycles, but pedestrian detection was not satisfactory. Testing with the axle-based detection system did not produce valid traffic data. Alaska DOT&PF staff was not able to successfully setup and calibrate the system. 14. KEYWORDS: Traffic counting stations, traffic data, axle loads, radar vehicle detectors. 15. NUMBER OF PAGES PRICE CODE 17. SECURITY CLASSIFICATION OF REPORT 18. SECURITY CLASSIFICATION OF THIS PAGE 19. SECURITY CLASSIFICATION OF ABSTRACT N/A 20. LIMITATION OF ABSTRACT Unclassified Unclassified Unclassified N/A NSN STANDARD FORM 298 (Rev. 2-98) Prescribed by ANSI Std
63
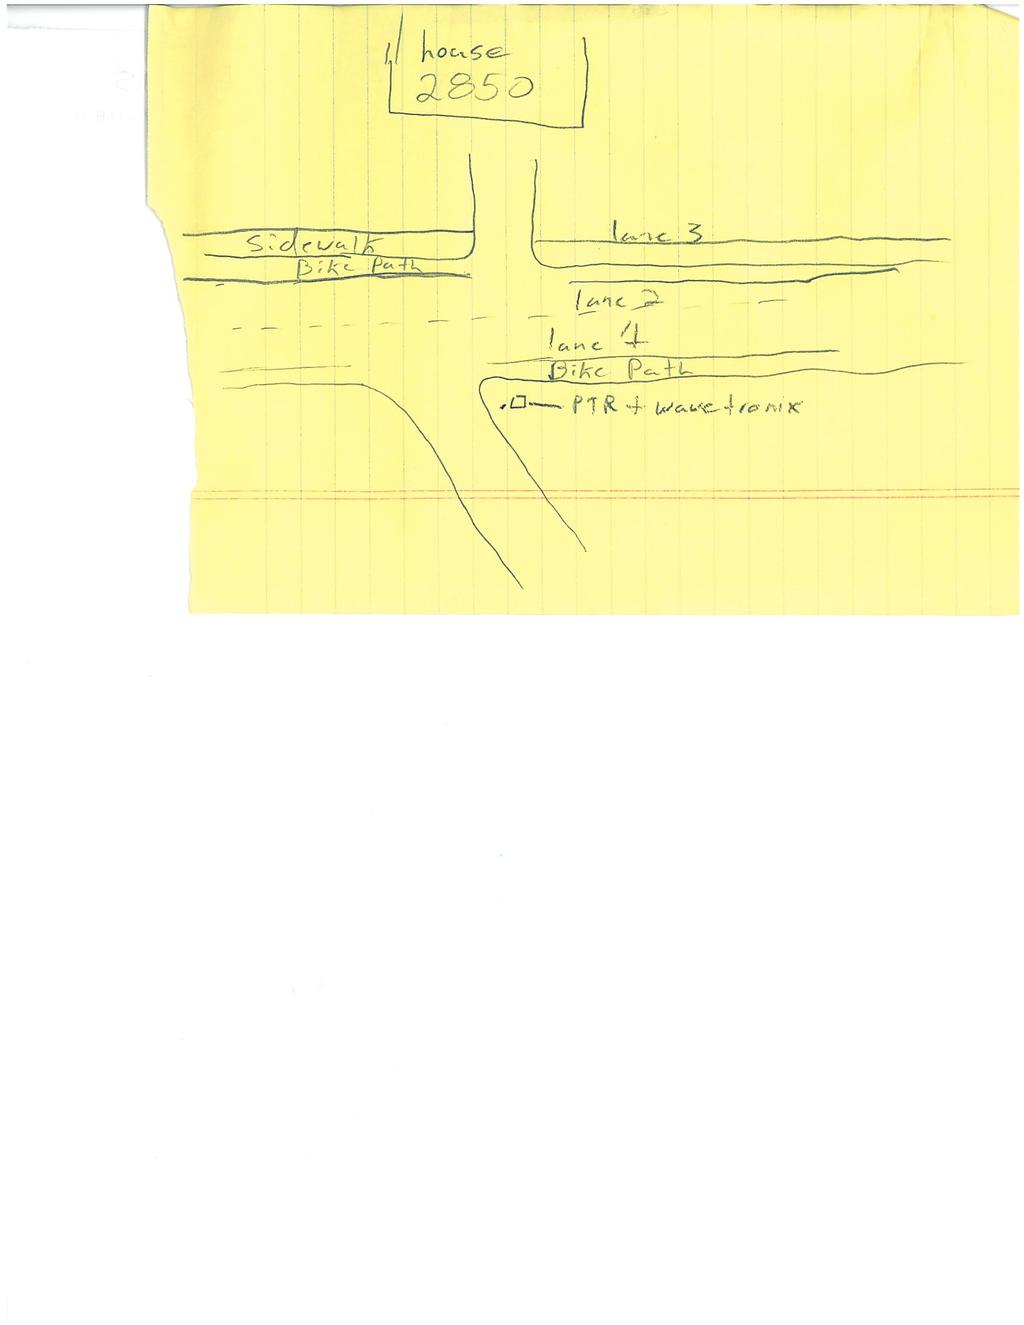
64 Please send test data and test log to Erik Minge after each test APPENDIX A Demonstration of Non-Intrusive Traffic Data Collection Test Log Location: Personnel: Juneau, AK, S. John St.(representing rural w/ sidewalk) Josh Mahle Wavetronix Calibration Process: Used Sensor Alignment readings and Lane Verification also added a lane for Ped and Bike counts Calibration Time: 1 hours Installed Height: 19 Installed Offset to Traveled Way: 9 AxleLight Calibration Process: n/a Calibration Time: n/a Installed Height: n\a Installed Offset to Traveled Way: n\a Baseline used (manual count, road tube or PTR): ADR (loops) & Manual Ped and Bike Count. Baseline accuracy (include volume, speed and class): Wavetronix Test AxleLight Test Data Collection Period Battery Data Collection Period Date Time Voltage Date Time Start: 2/2/ :00am Start: End: 2/9/ :00am End: Battery Voltage Data File Name: increments, send ALL data) (provide lane specific data in 1-hour 1
65 Site Sketch Include: Roadway(s) North Arrow Posted speed Pavement Condition (gravel, rutting, etc) Sensor Locations ( ) and Orientation Identify Lanes (1, 2, etc.) Bike/Ped facilities (if applicable) Photo of test site Setup process and time Calibration process and time Did personnel need to enter roadway? Was vendor-recommended process modified? Was the vendor supportive? Were there any traffic incidents? Weather incidents? Construction activity? Notes: This was the first temporary installation in our region involving a stand-alone power source. The Wavetronix sensor calibrated itself very well, however requires it a certain amount traffic to do so. We had to drive our own vehicle to calibrate the sensor, since this section of roadway does not have adequate ADT for a timely and accurate calibration. 2
66
Additional Transit Bus Life Cycle Cost Scenarios Based on Current and Future Fuel Prices
 U.S. Department Of Transportation Federal Transit Administration FTA-WV-26-7006.2008.1 Additional Transit Bus Life Cycle Cost Scenarios Based on Current and Future Fuel Prices Final Report Sep 2, 2008
Evaluation of the Sequential Dynamic Curve Warning System Summary of Full Report Publication No. FHWA-15-CAI-012-A November 2015
 Evaluation of the Sequential Dynamic Curve Warning System Summary of Full Report Publication No. FHWA-15-CAI-012-A November 2015 Source: ISU/TTI Notice This document is disseminated under the sponsorship
TEXAS TRANSPORTATION INSTITUTE THE TEXAS A & M UNIVERSITY SYSTEM COLLEGE STATION, TEXAS 77843
 NCHRP REPORT 350 ASSESSMENT OF EXISTING ROADSIDE SAFETY HARDWARE by C. Eugene Buth, P.E. Senior Research Engineer Wanda L. Menges Associate Research Specialist and Sandra K. Schoeneman Research Associate
AN The SmartSensor HD as an Automatic Traffic Recorder. Automatic Traffic Recorders
 AN-0006 The SmartSensor HD as an Automatic Traffic Recorder The Wavetronix SmartSensor HD can be used as an automatic traffic recorder (ATR) in the process of gathering, storing and analyzing traffic data.
2011 NDIA GROUND VEHICLE SYSTEMS ENGINEERING AND TECHNOLOGY SYMPOSIUM POWER AND MOBILITY (P&M) MINI-SYMPOSIUM AUGUST 9-11 DEARBORN, MICHIGAN
 MINI-SYMPOSIUM AUGUST 9-11 DEARBORN, MICHIGAN") 211 NDIA GROUND VEHICLE SYSTEMS ENGINEERING AND TECHNOLOGY SYMPOSIUM POWER AND MOBILITY (P&M) MINI-SYMPOSIUM AUGUST 9-11 DEARBORN, MICHIGAN Electrode material enhancements for lead-acid batteries Dr. William
211 NDIA GROUND VEHICLE SYSTEMS ENGINEERING AND TECHNOLOGY SYMPOSIUM POWER AND MOBILITY (P&M) MINI-SYMPOSIUM AUGUST 9-11 DEARBORN, MICHIGAN Electrode material enhancements for lead-acid batteries Dr. William
TARDEC --- TECHNICAL REPORT ---
 TARDEC --- TECHNICAL REPORT --- No. 21795 Comparison of Energy Loss in Talon Battery Trays: Penn State and IBAT By Ty Valascho UNCLASSIFIED: Dist A. Approved for public release U.S. Army Tank Automotive
High efficiency variable speed versatile power air conditioning system for military vehicles
 2013 NDIA GROUND VEHICLE SYSTEMS ENGINEERING AND TECHNOLOGY SYMPOSIUM POWER & MOBILITY (P&M) MINI-SYMPOSIUM AUGUST 21-22, 2013 - TROY, MICHIGAN High efficiency variable speed versatile power air conditioning
ANALYSIS OF DATA FROM THE THERMAL IMAGING INSPECTION SYSTEM PROJECT
 UMTRI-2009-38 DECEMBER 2009 ANALYSIS OF DATA FROM THE THERMAL IMAGING INSPECTION SYSTEM PROJECT PAUL E. GREEN UMTRI-2009-38 Analysis of Data from the Thermal Imaging Inspection System Project Paul E.
Project Title: Using Truck GPS Data for Freight Performance Analysis in the Twin Cities Metro Area Prepared by: Chen-Fu Liao (PI) Task Due: 9/30/2013
 Task Due: 9/30/2013") MnDOT Contract No. 998 Work Order No.47 213 Project Title: Using Truck GPS Data for Freight Performance Analysis in the Twin Cities Metro Area Prepared by: Chen-Fu Liao (PI) Task Due: 9/3/213 TASK #4:
MnDOT Contract No. 998 Work Order No.47 213 Project Title: Using Truck GPS Data for Freight Performance Analysis in the Twin Cities Metro Area Prepared by: Chen-Fu Liao (PI) Task Due: 9/3/213 TASK #4:
Reduction of vehicle noise at lower speeds due to a porous open-graded asphalt pavement
 Reduction of vehicle noise at lower speeds due to a porous open-graded asphalt pavement Paul Donavan 1 1 Illingworth & Rodkin, Inc., USA ABSTRACT Vehicle noise measurements were made on an arterial roadway
SmartSensor HD Performance Test Results
 Performance Test Results TEST REPORT In order to show compliance with specifications for bid submittal and verification purposes, several performance tests were conducted. The following sections contain
D-25 Speed Advisory System
 Report Title Report Date: 2002 D-25 Speed Advisory System Principle Investigator Name Pesti, Geza Affiliation Texas Transportation Institute Address CE/TTI, Room 405-H 3135 TAMU College Station, TX 77843-3135
REMOTE MINE AREA CLEARANCE EQUIPMENT (MACE) C-130 LOAD CELL TEST DATA
 C-130 LOAD CELL TEST DATA") AFRL-ML-TY-TR-2007-4543 REMOTE MINE AREA CLEARANCE EQUIPMENT (MACE) C-130 LOAD CELL TEST DATA Prepared by William R. Meldrum Mechanical Engineer Physical Simulation Team AMSRD-TAR-D U.S. Army Tank-Automotive
AFRL-ML-TY-TR-2007-4543 REMOTE MINE AREA CLEARANCE EQUIPMENT (MACE) C-130 LOAD CELL TEST DATA Prepared by William R. Meldrum Mechanical Engineer Physical Simulation Team AMSRD-TAR-D U.S. Army Tank-Automotive
UNCLASSIFIED: Distribution A. Approved for Public Release TACOM Case # 21906, 26 May Vehicle Electronics and Architecture
 TACOM Case # 21906, 26 May 2011. Vehicle Electronics and Architecture May 26, 2011 Report Documentation Page Form Approved OMB No. 0704-0188 Public reporting burden for the collection of information is
Navy Coalescence Test on Camelina HRJ5 Fuel
 Navy Coalescence Test on Camelina HRJ5 Fuel Prepared By: CHRISTOPHER J. LAING Filtration Test Engineer AIR-4.4.5.1 NAVAIR Public Release 2013-263 Distribution Statement A - Approved for public release;
EXPLORATORY DISCUSSIONS - PRE DECISIONAL
 A PROJECT FOR THE COOPERATIVE RESEARCH ON HYBRID ELECTRIC PROPULSION BETWEEN THE DEPARTMENT OF DEFENSE OF THE UNITED STATES OF AMERICA AND THE MINISTRY OF DEFENSE OF JAPAN v10 1 Report Documentation Page
Evaluation of Major Street Speeds for Minnesota Intersection Collision Warning Systems
 Evaluation of Major Street Speeds for Minnesota Intersection Collision Warning Systems Shauna Hallmark, Principal Investigator Center for Transportation Research and Education Iowa State University June
Motor Carrier Type and Factors Associated with Fatal Bus Crashes
 UMTRI 2004-03 Motor Carrier Type and Factors Associated with Fatal Bus Crashes Daniel Blower Anne Matteson Michael Shrank Prepared for: Federal Motor Carrier Safety Administration Office of Data Analysis
Evaluation of Digital Refractometers for Field Determination of FSII Concentration in JP-5 Fuel
 Evaluation of Digital Refractometers for Field Determination of FSII Concentration in JP-5 Fuel NAVAIRSYSCOM REPORT 441/13-011 Prepared By: JOHN KRIZOVENSKY Chemist AIR 4.4.5 NAVAIR Public Release 2013-867
Navy Coalescence Test on Petroleum F-76 Fuel with Infineum R655 Lubricity Improver at 300 ppm
 Navy Coalescence Test on Petroleum F-76 Fuel with Infineum R655 Lubricity Improver at 300 ppm NF&LCFT REPORT 441/12-015 Prepared By: CHRISTOPHER J. LAING Filtration Test Engineer AIR-4.4.5.1 NAVAIR Public
SpeedGuard Radar Speed Reporting System
 Report Title Report Date: 2000 SpeedGuard Radar Speed Reporting System Principle Investigator Vendor Name and Address Name Meyer, Eric Speed Measurement Labs Affiliation Meyer ITS Carl Fors Address 2617
Act 229 Evaluation Report
 R22-1 W21-19 W21-20 Act 229 Evaluation Report Prepared for Prepared by Table of Contents 1. Documentation Page 3 2. Executive Summary 4 2.1. Purpose 4 2.2. Evaluation Results 4 3. Background 4 4. Approach
Oregon DOT Slow-Speed Weigh-in-Motion (SWIM) Project: Analysis of Initial Weight Data
 Project: Analysis of Initial Weight Data") Portland State University PDXScholar Center for Urban Studies Publications and Reports Center for Urban Studies 7-1997 Oregon DOT Slow-Speed Weigh-in-Motion (SWIM) Project: Analysis of Initial Weight Data
Portland State University PDXScholar Center for Urban Studies Publications and Reports Center for Urban Studies 7-1997 Oregon DOT Slow-Speed Weigh-in-Motion (SWIM) Project: Analysis of Initial Weight Data
Robot Drive Motor Characterization Test Plan
 US ARMY TARDEC / GROUND VEHICLE ROBOTICS Robot Drive Motor Characterization Test Plan PackBot Modernization Project Ty Valascho 9/21/2012 This test plan is intended to characterize the drive motors of
Vehicle Systems Engineering and Integration Activities - Phase 3
 Vehicle Systems Engineering and Integration Activities - Phase 3 Interim Technical Report SERC-2011-TR-015-3 December 31, 2011 Principal Investigator: Dr. Walter Bryzik, DeVlieg Chairman and Professor
Introduction and Background Study Purpose
 Introduction and Background The Brent Spence Bridge on I-71/75 across the Ohio River is arguably the single most important piece of transportation infrastructure the Ohio-Kentucky-Indiana (OKI) region.
F100 ENGINE NACELLE FIRE FIGHTING TEST MOCKUP DRAWINGS
 AFRL-ML-TY-TR-2002-4604 F100 ENGINE NACELLE FIRE FIGHTING TEST MOCKUP DRAWINGS JULY 2002 Approved for Public Release; Distribution Unlimited MATERIALS & MANUFACTURING DIRECTORATE AIR FORCE RESEARCH LABORATORY
A NEW MODEL OF CRASH SEVERITIES REPORTABLE TO THE MCMIS CRASH FILE
 UMTRI-2010-39 SEPTEMBER 2010 A NEW MODEL OF CRASH SEVERITIES REPORTABLE TO THE MCMIS CRASH FILE PAUL E. GREEN DANIEL BLOWER UMTRI-2010-39 A New Model of Crash Severities Reportable to the MCMIS Crash
Joint Oil Analysis Program Spectrometer Standards VHG Labs Inc. Qualification Report For D19-0, D3-100 and D12-XXX Series Standards
 Joint Oil Analysis Program Spectrometer Standards VHG Labs Inc. Qualification Report For D19-0, D3-100 and D12-XXX Series Standards NF&LCFT REPORT 441/13-010 Prepared By: MICHAEL PERETICH, PhD Oil Analysis
STH 60 Northern Reliever Route Feasibility Study Report
 #233087 v3 STH 60 Northern Reliever Route Feasibility Study Report Washington County Public Works Committee Meeting September 28, 2016 1 STH 60 Northern Reliever Route Feasibility Study Hartford Area Development
KENTUCKY TRANSPORTATION CENTER
 Research Report KTC-08-10/UI56-07-1F KENTUCKY TRANSPORTATION CENTER EVALUATION OF 70 MPH SPEED LIMIT IN KENTUCKY OUR MISSION We provide services to the transportation community through research, technology
Southern Windsor County 2016 Traffic Count Program Summary April 2017
 Southern Windsor County 2016 Traffic Count Program Summary April 2017 The Southern Windsor County Regional Planning Commission (the RPC ) has been monitoring traffic at 19 locations throughout the southern
Vehicle Systems Engineering and Integration Activities - Phase 4
 Vehicle Systems Engineering and Integration Activities - Phase 4 Interim Technical Report SERC-2012-TR-015-4 March 31, 2012 Principal Investigator: Dr. Walter Bryzik, DeVlieg Chairman and Professor Mechanical
PVP Field Calibration and Accuracy of Torque Wrenches. Proceedings of ASME PVP ASME Pressure Vessel and Piping Conference PVP2011-
 Proceedings of ASME PVP2011 2011 ASME Pressure Vessel and Piping Conference Proceedings of the ASME 2011 Pressure Vessels July 17-21, & Piping 2011, Division Baltimore, Conference Maryland PVP2011 July
LAWRENCE TRANSIT CENTER LOCATION ANALYSIS 9 TH STREET & ROCKLEDGE ROAD / 21 ST STREET & IOWA STREET LAWRENCE, KANSAS
 LAWRENCE TRANSIT CENTER LOCATION ANALYSIS 9 TH STREET & ROCKLEDGE ROAD / 21 ST STREET & IOWA STREET LAWRENCE, KANSAS TRAFFIC IMPACT STUDY FEBRUARY 214 OA Project No. 213-542 TABLE OF CONTENTS 1. INTRODUCTION...
Surface- and Pressure-Dependent Characterization of SAE Baja Tire Rolling Resistance
 Surface- and Pressure-Dependent Characterization of SAE Baja Tire Rolling Resistance Abstract Cole Cochran David Mikesell Department of Mechanical Engineering Ohio Northern University Ada, OH 45810 Email:
Evaluation of Single Common Powertrain Lubricant (SCPL) Candidates for Fuel Consumption Benefits in Military Equipment
 Candidates for Fuel Consumption Benefits in Military Equipment") 2011 NDIA GROUND VEHICLE SYSTEMS ENGINEERING AND TECHNOLOGY SYMPOSIUM POWER AND MOBILITY (P&M) MINI-SYMPOSIUM AUGUST 9-11 DEARBORN, MICHIGAN Evaluation of Single Common Powertrain Lubricant (SCPL) Candidates
2011 NDIA GROUND VEHICLE SYSTEMS ENGINEERING AND TECHNOLOGY SYMPOSIUM POWER AND MOBILITY (P&M) MINI-SYMPOSIUM AUGUST 9-11 DEARBORN, MICHIGAN Evaluation of Single Common Powertrain Lubricant (SCPL) Candidates
FHWA/IN/JTRP-2000/23. Final Report. Sedat Gulen John Nagle John Weaver Victor Gallivan
 FHWA/IN/JTRP-2000/23 Final Report DETERMINATION OF PRACTICAL ESALS PER TRUCK VALUES ON INDIANA ROADS Sedat Gulen John Nagle John Weaver Victor Gallivan December 2000 Final Report FHWA/IN/JTRP-2000/23 DETERMINATION
An Advanced Fuel Filter
 An Advanced Fuel Filter Frank Margrif and Peter Yu U.S. Army Tank-automotive and Armaments Command Research Business Group Filtration Solutions, Inc www. Filtsol.com 1 Report Documentation Page Form Approved
Trip Generation Study: Provo Assisted Living Facility Land Use Code: 254
 Trip Generation Study: Provo Assisted Living Facility Land Use Code: 254 Introduction The Brigham Young University Institute of Transportation Engineers (BYU ITE) student chapter completed a trip generation
FINAL REPORT FOR THE C-130 RAMP TEST #3 OF A HYDREMA MINE CLEARING VEHICLE
 AFRL-RX-TY-TP-2008-4543 FINAL REPORT FOR THE C-130 RAMP TEST #3 OF A HYDREMA MINE CLEARING VEHICLE Prepared by: William R. Meldrum Mechanical Engineer Physical Simulation Team AMSRD-TAR-D U.S. Army Tank-Automotive
EXCEPTION TO STANDARDS REPORT
 EXCEPTION TO STANDARDS REPORT PROJECT DESCRIPTION AND NEED The project is located in Section 6, Township 23 North, Range 9 East and Section 31 Township 24 North, Range 9 East, in the Town of Stockton,
Energy Storage Commonality Military vs. Commercial Trucks
 DISTRIBUTION STATEMENT A: Approved for public release; distribution is unlimited. Energy Storage Commonality Military vs. Commercial Trucks Joseph K Heuvers, PE Energy Storage Team Ground Vehicle Power
Alpine Highway to North County Boulevard Connector Study
 Alpine Highway to North County Boulevard Connector Study prepared by Avenue Consultants March 16, 2017 North County Boulevard Connector Study March 16, 2017 Table of Contents 1 Summary of Findings... 1
Downtown Lee s Summit Parking Study
 Downtown Lee s Summit Parking Study As part of the Downtown Lee s Summit Master Plan, a downtown parking and traffic study was completed by TranSystems Corporation in November 2003. The parking analysis
TARDEC Technology Integration
 TARDEC Technology Integration Dr. Paul Rogers 15 April 2008 DISTRIBUTION STATEMENT A. Approved for public release; distribution is unlimited. 1 Report Documentation Page Form Approved OMB No. 0704-0188
Energy Technical Memorandum
 Southeast Extension Project Lincoln Station to RidgeGate Parkway Prepared for: Federal Transit Administration Prepared by: Denver Regional Transportation District May 2014 Table of Contents Page No. Chapter
NoFoam Unit Installation, Evaluation and Operations Manual
 AFRL-ML-TY-TR-03-4531 NoFoam Unit Installation, Evaluation and Operations Manual William Fischer Jennifer Kalberer AIR FORCE RESEARCH LABORATORY MATERIALS & MANUFACTURING DIRECTORATE AIRBASE TECHNOLOGIES
Evaluation of SpectroVisc Q3000 for Viscosity Determination
 Evaluation of SpectroVisc Q3000 for Viscosity Determination NF&LCFT REPORT 441/14-007 Prepared By: MICHAEL PERTICH, PHD Chemist AIR-4.4.6.1 NAVAIR Public Release 2014-24 Distribution Statement A - Approved
Table of Contents INTRODUCTION... 3 PROJECT STUDY AREA Figure 1 Vicinity Map Study Area... 4 EXISTING CONDITIONS... 5 TRAFFIC OPERATIONS...
 Crosshaven Drive Corridor Study City of Vestavia Hills, Alabama Table of Contents INTRODUCTION... 3 PROJECT STUDY AREA... 3 Figure 1 Vicinity Map Study Area... 4 EXISTING CONDITIONS... 5 TRAFFIC OPERATIONS...
Spatial and Temporal Analysis of Real-World Empirical Fuel Use and Emissions
 Spatial and Temporal Analysis of Real-World Empirical Fuel Use and Emissions Extended Abstract 27-A-285-AWMA H. Christopher Frey, Kaishan Zhang Department of Civil, Construction and Environmental Engineering,
Development of Turning Templates for Various Design Vehicles
 Transportation Kentucky Transportation Center Research Report University of Kentucky Year 1991 Development of Turning Templates for Various Design Vehicles Kenneth R. Agent Jerry G. Pigman University of
MERIVALE PRIORITY SQUARE 2852 MERIVALE ROAD CITY OF OTTAWA TRANSPORTATION BRIEF. Prepared for: ONT Inc. 25 Winding Way Nepean, Ontario K2C 3H1
 MERIVALE PRIORITY SQUARE 2852 MERIVALE ROAD CITY OF OTTAWA TRANSPORTATION BRIEF Prepared for: 2190986ONT Inc. 25 Winding Way Nepean, Ontario K2C 3H1 October 6, 2010 110-502 Report_1.doc D. J. Halpenny
BARRHAVEN FELLOWSHIP CRC 3058 JOCKVALE ROAD OTTAWA, ONTARIO TRANSPORTATION BRIEF. Prepared for:
 BARRHAVEN FELLOWSHIP CRC 3058 JOCKVALE ROAD OTTAWA, ONTARIO TRANSPORTATION BRIEF Prepared for: Barrhaven Fellowship CRC 3058 Jockvale Road Ottawa, ON K2J 2W7 December 7, 2016 116-649 Report_1.doc D. J.
Joint Oil Analysis Program Spectrometer Standards SCP Science (Conostan) Qualification Report For D19-0, D3-100, and D12-XXX Series Standards
 Qualification Report For D19-0, D3-100, and D12-XXX Series Standards") Joint Oil Analysis Program Spectrometer Standards SCP Science (Conostan) Qualification Report For D19-0, D3-100, and D12-XXX Series Standards NF&LCFT REPORT 441/15-008 Prepared By: MICHAEL PERETICH, PHD
Joint Oil Analysis Program Spectrometer Standards SCP Science (Conostan) Qualification Report For D19-0, D3-100, and D12-XXX Series Standards NF&LCFT REPORT 441/15-008 Prepared By: MICHAEL PERETICH, PHD
Appendix 3. DRAFT Policy on Vehicle Activated Signs
 Appendix 3 DRAFT Policy on Vehicle Activated Signs Ealing Council has been installing vehicle activated signs for around three years and there are now 45 across the borough. These signs help to reduce
Heating Comparison of Radial and Bias-Ply Tires on a B-727 Aircraft
 'S Heating Comparison of Radial and Bias-Ply Tires on a B-727 Aircraft November 1997 DOT/FAA/AR-TN97/50 This document is available to the U.S. public through the National Technical Information Service
Ch. 157 ESTABLISHED SOUND LEVELS CHAPTER 157. ESTABLISHED SOUND LEVELS
 Ch. 157 ESTABLISHED SOUND LEVELS 67 157.1 CHAPTER 157. ESTABLISHED SOUND LEVELS Subchap. A. GENERAL PROVISIONS... 157.1 B. NOISE LIMITS... 157.11 C. ADMINISTRATIVE PROVISIONS... 157.21 D. INSTRUMENTATION...
EVALUATING VOLTAGE REGULATION COMPLIANCE OF MIL-PRF-GCS600A(ARMY) FOR VEHICLE ON-BOARD GENERATORS AND ASSESSING OVERALL VEHICLE BUS COMPLIANCE
 FOR VEHICLE ON-BOARD GENERATORS AND ASSESSING OVERALL VEHICLE BUS COMPLIANCE") EVALUATING VOLTAGE REGULATION COMPLIANCE OF MIL-PRF-GCSA(ARMY) FOR VEHICLE ON-BOARD GENERATORS AND ASSESSING OVERALL VEHICLE BUS COMPLIANCE Wesley G. Zanardelli, Ph.D. Advanced Propulsion Team Disclaimer:
EVALUATING VOLTAGE REGULATION COMPLIANCE OF MIL-PRF-GCSA(ARMY) FOR VEHICLE ON-BOARD GENERATORS AND ASSESSING OVERALL VEHICLE BUS COMPLIANCE Wesley G. Zanardelli, Ph.D. Advanced Propulsion Team Disclaimer:
Feeding the Fleet. GreenGov Washington D.C. October 31, 2011
 Feeding the Fleet GreenGov Washington D.C. October 31, 2011 Tina Hastings Base Support Vehicle and Equipment Product Line Leader Naval Facilities Engineering Command Report Documentation Page Form Approved
INTELLIGENT ENERGY MANAGEMENT IN A TWO POWER-BUS VEHICLE SYSTEM. DISTRIBUTION STATEMENT A. Approved for public release; distribution is unlimited.
 INTELLIGENT ENERGY MANAGEMENT IN A TWO POWER-BUS VEHICLE SYSTEM 1 Report Documentation Page Form Approved OMB No. 0704-0188 Public reporting burden for the collection of information is estimated to average
Dual Use Ground Vehicle Condition-Based Maintenance Project B
 Center for Advanced Vehicle Design and Simulation Western Michigan University UNCLASSIFIED: Dist A. Approved for public release Dual Use Ground Vehicle Condition-Based Maintenance Project B Muralidhar
UNCLASSIFIED: DIST A. APPROVED FOR PUBLIC RELEASE. ARMY GREATEST INVENTIONS CY 2009 PROGRAM MRAP Overhead Wire Mitigation (OWM) Kit
 Kit") ARMY GREATEST INVENTIONS CY 2009 PROGRAM MRAP Overhead Wire Mitigation (OWM) Kit Report Documentation Page Form Approved OMB No. 0704-0188 Public reporting burden for the collection of information is estimated
ARMY GREATEST INVENTIONS CY 2009 PROGRAM MRAP Overhead Wire Mitigation (OWM) Kit Report Documentation Page Form Approved OMB No. 0704-0188 Public reporting burden for the collection of information is estimated
BROWARD BOULEVARD CORRIDOR TRANSIT STUDY
 BROWARD BOULEVARD CORRIDOR TRANSIT STUDY FM # 42802411201 EXECUTIVE SUMMARY July 2012 GOBROWARD Broward Boulevard Corridor Transit Study FM # 42802411201 Executive Summary Prepared For: Ms. Khalilah Ffrench,
UNCLASSIFIED: Dist A. Approved for public release. GVPM Energy Storage Overview Mr. David Skalny & Dr. Laurence Toomey 10 August 2011
 UNCLASSIFIED: Dist A. Approved for public release GVPM Energy Storage Overview Mr. David Skalny & Dr. Laurence Toomey 10 August 2011 Report Documentation Page Form Approved OMB No. 0704-0188 Public reporting
Speed Limit Study: Traffic Engineering Report
 Speed Limit Study: Traffic Engineering Report This report documents the engineering and traffic investigation required by Vermont Statutes Annotated Title 23, Chapter 13 1007 for a municipal legislative
Quarterly Progress Report
 Quarterly Progress Report Period of Performance: January 1 March 31, 2006 Prepared by: Dr. Kuo-Ta Hsieh Principal Investigator Institute for Advanced Technology The University of Texas at Austin 3925 W.
An Introduction to Automated Vehicles
 An Introduction to Automated Vehicles Grant Zammit Operations Team Manager Office of Technical Services - Resource Center Federal Highway Administration at the Purdue Road School - Purdue University West
APPENDIX C1 TRAFFIC ANALYSIS DESIGN YEAR TRAFFIC ANALYSIS
 APPENDIX C1 TRAFFIC ANALYSIS DESIGN YEAR TRAFFIC ANALYSIS DESIGN YEAR TRAFFIC ANALYSIS February 2018 Highway & Bridge Project PIN 6754.12 Route 13 Connector Road Chemung County February 2018 Appendix
REMOTE SENSING DEVICE HIGH EMITTER IDENTIFICATION WITH CONFIRMATORY ROADSIDE INSPECTION
 Final Report 2001-06 August 30, 2001 REMOTE SENSING DEVICE HIGH EMITTER IDENTIFICATION WITH CONFIRMATORY ROADSIDE INSPECTION Bureau of Automotive Repair Engineering and Research Branch INTRODUCTION Several
REPORT NUMBER: 111SB-MGA SAFETY COMPLIANCE TESTING FOR FMVSS NO. 111SB SCHOOL BUS REARVIEW MIRRORS
 REPORT NUMBER: 111SB-MGA-2009-001 SAFETY COMPLIANCE TESTING FOR FMVSS NO. 111SB SCHOOL BUS REARVIEW MIRRORS THOMAS BUILT BUSES 2009 THOMAS MINOTOUR SCHOOL BUS NHTSA NO.: C90901 PREPARED BY: MGA RESEARCH
Open & Evolutive UAV Architecture
 Open & Evolutive UAV Architecture 13th June UAV 2002 CEFIF 16-juin-02 Diapositive N 1 / 000 Report Documentation Page Form Approved OMB No. 0704-0188 Public reporting burden for the collection of information
U.S. Army s Ground Vehicle Energy Storage R&D Programs & Goals
 U.S. Army s Ground Vehicle Energy Storage R&D Programs & Goals Sonya Zanardelli Energy Storage Team, US Army TARDEC sonya.zanardelli@us.army.mil 586-282-5503 November 17, 2010 Report Documentation Page
EVALUATION OF 2009 VIRGINIA CRASH DATA REPORTED TO THE MCMIS CRASH FILE
 UMTRI-2011-26 JUNE 2011 EVALUATION OF 2009 VIRGINIA CRASH DATA REPORTED TO THE MCMIS CRASH FILE PAUL E. GREEN ANNE MATTESON UMTRI-2011-26 Evaluation of 2009 Virginia Crash Data Reported to the MCMIS Crash
Evaluation of Renton Ramp Meters on I-405
 Evaluation of Renton Ramp Meters on I-405 From the SE 8 th St. Interchange in Bellevue to the SR 167 Interchange in Renton January 2000 By Hien Trinh Edited by Jason Gibbens Northwest Region Traffic Systems
Table Existing Traffic Conditions for Arterial Segments along Construction Access Route. Daily
 5.8 TRAFFIC, ACCESS, AND CIRCULATION This section describes existing traffic conditions in the project area; summarizes applicable regulations; and analyzes the potential traffic, access, and circulation
Simulating Trucks in CORSIM
 Simulating Trucks in CORSIM Minnesota Department of Transportation September 13, 2004 Simulating Trucks in CORSIM. Table of Contents 1.0 Overview... 3 2.0 Acquiring Truck Count Information... 5 3.0 Data
WIM #39 MN 43, MP 45.2 WINONA, MN APRIL 2010 MONTHLY REPORT
 WIM #39 MN 43, MP 45.2 WINONA, MN APRIL 2010 MONTHLY REPORT In order to understand the vehicle classes and groupings the Mn/DOT Vehicle Classification Scheme and the Vehicle Class Groupings for Forecasting
Bennett Pit. Traffic Impact Study. J&T Consulting, Inc. Weld County, Colorado. March 3, 2017
 Bennett Pit Traffic Impact Study J&T Consulting, Inc. Weld County, Colorado March 3, 217 Prepared By: Sustainable Traffic Solutions, Inc. http://www.sustainabletrafficsolutions.com/ Joseph L. Henderson,
CHAPTER 9: VEHICULAR ACCESS CONTROL Introduction and Goals Administration Standards
 9.00 Introduction and Goals 9.01 Administration 9.02 Standards 9.1 9.00 INTRODUCTION AND GOALS City streets serve two purposes that are often in conflict moving traffic and accessing property. The higher
TIMBERVINE TRANSPORTATION IMPACT STUDY FORT COLLINS, COLORADO JANUARY Prepared for:
 TIMBERVINE TRANSPORTATION IMPACT STUDY FORT COLLINS, COLORADO JANUARY 2014 Prepared for: Hartford Companies 1218 W. Ash Street Suite A Windsor, Co 80550 Prepared by: DELICH ASSOCIATES 2272 Glen Haven Drive
WIM #40 US 52, MP S. ST. PAUL, MN APRIL 2010 MONTHLY REPORT
 WIM #40 US 52, MP 126.8 S. ST. PAUL, MN APRIL 2010 MONTHLY REPORT In order to understand the vehicle classes and groupings the Mn/DOT Vehicle Classification Scheme and the Vehicle Class Groupings for Forecasting
GM-TARDEC Autonomous Safety Collaboration Meeting
 GM-TARDEC Autonomous Safety Collaboration Meeting January 13, 2010 Report Documentation Page Form Approved OMB No. 0704-0188 Public reporting burden for the collection of information is estimated to average
Harlem Avenue between 63 rd and 65 th
 Harlem Avenue between 63 rd and 65 th Public Meeting #2 March 13, 2018 Summit Park District Welcome to the second Public Meeting for the preliminary engineering and environmental studies of Illinois 43
Does V50 Depend on Armor Mass?
 REPORT DOCUMENTATION PAGE Form Approved OMB No. 0704-088 Public reporting burden for this collection of information is estimated to average hour per response, including the time for reviewing instructions,
CHARACTERIZATION AND DEVELOPMENT OF TRUCK LOAD SPECTRA FOR CURRENT AND FUTURE PAVEMENT DESIGN PRACTICES IN LOUISIANA
 CHARACTERIZATION AND DEVELOPMENT OF TRUCK LOAD SPECTRA FOR CURRENT AND FUTURE PAVEMENT DESIGN PRACTICES IN LOUISIANA LSU Research Team Sherif Ishak Hak-Chul Shin Bharath K Sridhar OUTLINE BACKGROUND AND
REPORT NUMBER: 111-MGA SAFETY COMPLIANCE TESTING FOR FMVSS NO. 111 SCHOOL BUS REARVIEW MIRRORS
 REPORT NUMBER: 111-MGA-05-002 SAFETY COMPLIANCE TESTING FOR FMVSS NO. 111 SCHOOL BUS REARVIEW MIRRORS Girardin Minibus Inc. 2005 Minibus NHTSA No. C50902 PREPARED BY: MGA RESEARCH CORPORATION 5000 WARREN
The Deployable Gage Restraint Measurement System - Description and Operational Performance
 The Deployable Gage Restraint Measurement System - Description and Operational Performance GARY A. MARTIN ENSCO, INC 5400 PORT ROYAL ROAD SPRINGFIELD, VA 22151 703-321-4513 703-321-7619 (FAX) JEFFREY A.
CITY OF MINNEAPOLIS GREEN FLEET POLICY
 CITY OF MINNEAPOLIS GREEN FLEET POLICY TABLE OF CONTENTS I. Introduction Purpose & Objectives Oversight: The Green Fleet Team II. Establishing a Baseline for Inventory III. Implementation Strategies Optimize
WIM #41 CSAH 14, MP 14.9 CROOKSTON, MINNESOTA APRIL 2014 MONTHLY REPORT
 WIM #41 CSAH 14, MP 14.9 CROOKSTON, MINNESOTA APRIL 2014 MONTHLY REPORT In order to understand the vehicle classes and groupings, the MnDOT Vehicle Classification Scheme and the Vehicle Classification
APPENDIX E. Traffic Analysis Report
 APPENDIX E Traffic Analysis Report THIS PAGE INTENTIONALLY BLANK EAGLE RIVER TRAFFIC MITIGATION PHASE I OLD GLENN HIGHWAY/EAGLE RIVER ROAD INTERSECTION IMPROVEMENTS TRAFFIC ANALYSIS Eagle River, Alaska
Missouri Seat Belt Usage Survey for 2017
 Missouri Seat Belt Usage Survey for 2017 Conducted for the Highway Safety & Traffic Division of the Missouri Department of Transportation by The Missouri Safety Center University of Central Missouri Final
City of Pacific Grove
 Regional Study Utilizing Caltrans Intersection Evaluation Section 7: City of Pacific Grove s: FIRST STREET AT CENTRAL AVENUE Transportation Agency for Monterey County Prepared by Transportation Agency
Traffic Engineering Study
 Traffic Engineering Study Bellaire Boulevard Prepared For: International Management District Technical Services, Inc. Texas Registered Engineering Firm F-3580 November 2009 Executive Summary has been requested
Motor Carrier Type and Factors Associated with Fatal Bus Crashes
 UMTRI 2004-03 Motor Carrier Type and Factors Associated with Fatal Bus Crashes Daniel Blower Anne Matteson Michael Shrank Prepared for: Federal Motor Carrier Safety Administration Office of Data Analysis
PR V2. Submitted by. Professor MIDWEST Vine Street (402) Submitted to
 Submitted to") FINAL REPORT PR4893118-V2 ZONE OF INTRUSION STUDY Submitted by John D. Reid, Ph.D. Professor Dean L.. Sicking, Ph.D., P.E. Professorr and MwRSF Director MIDWEST ROADSIDE SAFETY FACILITY University of Nebraska-Lincoln
FINAL REPORT PR4893118-V2 ZONE OF INTRUSION STUDY Submitted by John D. Reid, Ph.D. Professor Dean L.. Sicking, Ph.D., P.E. Professorr and MwRSF Director MIDWEST ROADSIDE SAFETY FACILITY University of Nebraska-Lincoln
I-95 Corridor Coalition Vehicle Probe Project: HERE, INRIX and TOMTOM Data Validation. Report for North Carolina (#08) I-240, I-40 and I-26
 I-240, I-40 and I-26") I-95 Corridor Coalition Vehicle Probe Project: HERE, INRIX and TOMTOM Data Validation Report for North Carolina (#08) I-240, I-40 and I-26 Prepared by: Masoud Hamedi, Sanaz Aliari University of Maryland,
I-95 Corridor Coalition Vehicle Probe Project: HERE, INRIX and TOMTOM Data Validation Report for North Carolina (#08) I-240, I-40 and I-26 Prepared by: Masoud Hamedi, Sanaz Aliari University of Maryland,
U.S. Army/CERDEC's Portable Fuel Cell Evaluation and Field Testing 2011 Fuel Cell Seminar & Expo Orlando, FL 31 Oct 2011
 U.S. Army/CERDEC's Portable Fuel Cell Evaluation and Field Testing 2011 Fuel Cell Seminar & Expo Orlando, FL 31 Oct 2011 Tony Thampan, Jonathan Novoa, Mike Dominick, Shailesh Shah, Nick Andrews US ARMY/AMC/RDECOM/CERDEC/C2D/Army
Alberta Infrastructure HIGHWAY GEOMETRIC DESIGN GUIDE AUGUST 1999
 &+$37(5Ã)Ã Alberta Infrastructure HIGHWAY GEOMETRIC DESIGN GUIDE AUGUST 1999 &+$37(5) 52$'6,'()$&,/,7,(6 7$%/(2)&217(176 Section Subject Page Number Page Date F.1 VEHICLE INSPECTION STATIONS... F-3 April
UNCLASSIFIED: Dist A. Approved for public release. GVPM Track & Suspension Overview Mr. Jason Alef & Mr. Geoff Bossio 11 Aug 2011
 : Dist A. Approved for public release GVPM Track & Suspension Overview Mr. Jason Alef & Mr. Geoff Bossio 11 Aug 2011 Report Documentation Page Form Approved OMB No. 0704-0188 Public reporting burden for