SAA Financial Results 2008/09. Building on Restructuring
|
|
|
- Griselda McDonald
- 6 years ago
- Views:
Transcription

1 SAA Financial Results 2008/09 Building on Restructuring 1
2 Content 1. Industry, Strategic and Operational Overview 2. Financial Overview 3. Conclusion and Way Forward 2
3 Industry Overview The airline industry entered into a cyclical downturn in mid-2008 This was partly as a result of the global economic downturn which affected all airlines, but also due to the oil price hitting a historic peak of more than $147 last year Airlines around the globe were hard hit, with IATA estimating that the industry will lose $11-billion in 2009 Global airlines sought to cut costs by grounding aircraft, scrapping unprofitable routes and merging 3
4 SAA s Restructuring Programme SAA identified three (3) categories of initiatives in order to achieve most of the turnaround: Global initiatives Revenue initiatives Boeing 747 elimination Reduce manager numbers Labour negotiations Operational performance SAA restructuring Departmental initiatives Point of sale share gap Pricing and Yield mgt Cost reduction Removal of duplication Performance measurement and Accountability Contract review THE RESTRUCTURING PROGRAMME DELIVERED R2,5-BILLION IN COST SAVINGS AND REVENUE GROWTH VS A TARGET OF R2,3-BILLION 4
5 Strategic Overview - Restructuring SAA was fortunate to begin its restructuring in 2007 when the economy was in a growth phase In the first phase of restructuring ( ), the focus was largely on cutting costs and improved revenue generation The next phase will focused on improving customer service, the operational performance and ensuring the programme remains in place and is sustainable The success of restructuring can be seen in SAA s operating profit for Restructuring has now become part of operations to ensure it is sustainable 5
6 6 On Time Performance
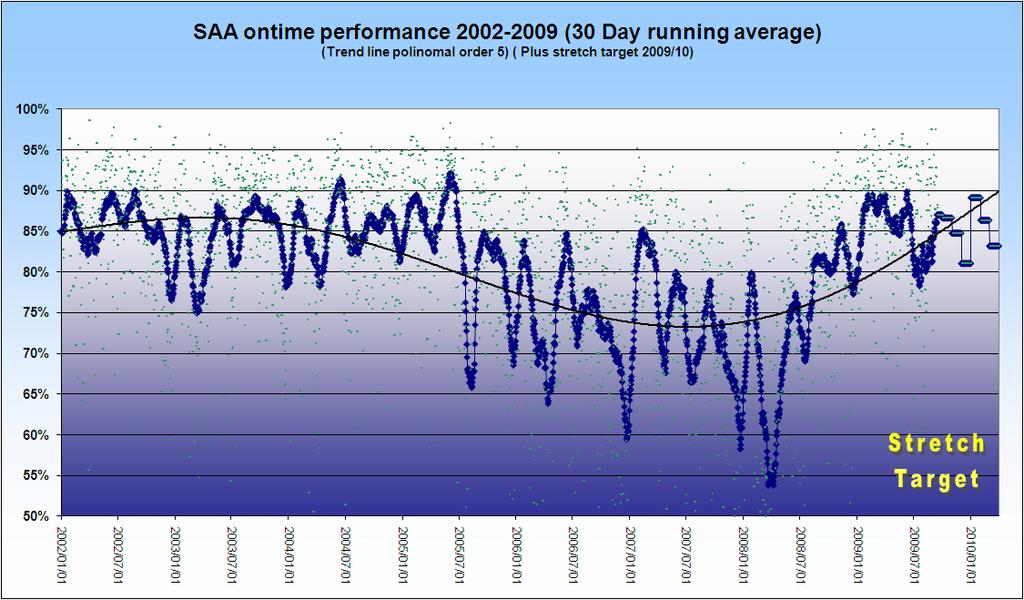
7 7 On Time Performance
8 Operational Statistics Δ 07/08 Δ 08/09 Capacity (ASK mil) 33,671 32,681 29,980 (3%) (8%) Uptake (RPK mil) 25,381 24,619 21,935 (3%) (11%) Pax Load Factors 75% 75% 73% 0% (3%) Pax carried ('000) 7,727 7,444 6,898 (4%) (7%) Cargo ('000 mt) (8%) (26%) Pax Yield (c/rpk) % 18% 8
9 Financial Performance Summary Δ 07/08 Δ 08/09 Turnover % 19% 9
10 Financial Performance Summary Δ 07/08 Δ 08/09 Turnover % 19% Passenger Turnover % 20% Cargo Revenue (4%) (11%) Other Turnover (5%) 36% 10
11 Financial Performance Summary Δ 07/08 Δ 08/09 Turnover % 19% Passenger Turnover % 20% Cargo Revenue (4%) (11%) Other Turnover (5%) 36% Operating Costs (21 174) (22 284) (24 526) 5% 10% 11
12 Financial Performance Summary Δ 07/08 Δ 08/09 Turnover % 19% Passenger Turnover % 20% Cargo Revenue (4%) (11%) Other Turnover (5%) 36% Operating Costs (21 174) (22 284) (24 526) 5% 10% Energy (5 734) (6 685) (8 589) 17% 28% Other (15 440) (15 599) (15 937) 1% 2% 12
13 Financial Performance Summary Δ 07/08 Δ 08/09 Turnover % 19% Passenger Turnover % 20% Cargo Revenue (4%) (11%) Other Turnover (5%) 36% Operating Costs (21 174) (22 284) (24 526) 5% 10% Energy (5 734) (6 685) (8 589) 17% 28% Other (15 440) (15 599) (15 937) 1% 2% Operating Profit / (Loss) (650) (27)
14 Financial Performance Summary Δ 07/08 Δ 08/09 Turnover % 19% Passenger Turnover % 20% Cargo Revenue (4%) (11%) Other Turnover (5%) 36% Operating Costs (21 174) (22 284) (24 526) 5% 10% Energy (5 734) (6 685) (8 589) 17% 28% Other (15 440) (15 599) (15 937) 1% 2% Operating Profit / (Loss) (650) (27) Interest, Hedge Prems, Other (302) (23) (399) Profit/(Loss) from Normal Ops (952) (50)
15 Financial Performance Summary Δ 07/08 Δ 08/09 Turnover % 19% Passenger Turnover % 20% Cargo Revenue (4%) (11%) Other Turnover (5%) 36% Operating Costs (21 174) (22 284) (24 526) 5% 10% Energy (5 734) (6 685) (8 589) 17% 28% Other (15 440) (15 599) (15 937) 1% 2% Operating Profit / (Loss) (650) (27) Interest, Hedge Prems, Other (302) (23) (399) Profit/(Loss) from Normal Ops (952) (50) Hedging Profit / (Loss) (1 046) 15
16 Financial Performance Summary Δ 07/08 Δ 08/09 Turnover % 19% Passenger Turnover % 20% Cargo Revenue (4%) (11%) Other Turnover (5%) 36% Operating Costs (21 174) (22 284) (24 526) 5% 10% Energy (5 734) (6 685) (8 589) 17% 28% Other (15 440) (15 599) (15 937) 1% 2% Operating Profit / (Loss) (650) (27) Interest, Hedge Prems, Other (302) (23) (399) Profit/(Loss) from Normal Ops (952) (50) Hedging Profit / (Loss) (1 046) Restructuring Costs - (1 345) (474) 16
17 Financial Performance Summary Δ 07/08 Δ 08/09 Turnover % 19% Passenger Turnover % 20% Cargo Revenue (4%) (11%) Other Turnover (5%) 36% Operating Costs (21 174) (22 284) (24 526) 5% 10% Energy (5 734) (6 685) (8 589) 17% 28% Other (15 440) (15 599) (15 937) 1% 2% Operating Profit / (Loss) (650) (27) Interest, Hedge Prems, Other (302) (23) (399) Profit/(Loss) from Normal Ops (952) (50) Hedging Profit / (Loss) (1 046) Restructuring Costs - (1 345) (474) Current Year Profit (883) (1 085) (10) 17
18 Financial Performance Summary Δ 07/08 Δ 08/09 Turnover % 19% Passenger Turnover % 20% Cargo Revenue (4%) (11%) Other Turnover (5%) 36% Operating Costs (21 174) (22 284) (24 526) 5% 10% Energy (5 734) (6 685) (8 589) 17% 28% Other (15 440) (15 599) (15 937) 1% 2% Operating Profit / (Loss) (650) (27) Interest, Hedge Prems, Other (302) (23) (399) Profit/(Loss) from Normal Ops (952) (50) Hedging Profit / (Loss) (1 046) Restructuring Costs - (1 345) (474) Current Year Profit / (Loss) (883) (1 085) (10) Reversal of PDP Impairment Final P/(L) after Tax (883) (1 085)
19 Content 1. Industry, Strategic and Operational Overview 2. Financial Overview 3. Conclusion and Way Forward 19
20 Income Statement Δ 07/08 Δ 08/09 Total airline income 20,524 22,257 26,435 8% 19% Operating costs 21,174 23,629 24,528 12% 4% Profit (loss) before fair value and translation (losses) gains (650) (1,372) 1, % 239% Fair value and translation (losses) gains (1,564) 898% -492% Operating (profit) loss (610) (973) % 135% Net finance costs (280) (130) 90 54% 169% Profit (loss) before taxation (890) (1,103) % 139% Taxation (42) 15 (22) 136% -247% Profit (loss) from continuing operations (932) (1,088) % 138% (Loss) profit from discontinuing operations 49 3 (13) -94% -533% Profit (loss) for the year (883) (1,085) % 137% 20
21 Total Airline Income Δ 07/08 Δ 08/09 Passenger revenue 17,274 19,141 23,028 11% 20% Freight & mail 1,829 1,765 1,561-3% -12% Technical services % 89% Voyager income % -10% Commission received % -8% Other income % 68% Total airline income 20,524 22,257 26,435 8% 19% 21
22 Operating Costs Δ 07/08 Δ 08/09 Energy 5,734 6,685 8,589 17% 28% Airline lease costs 2,514 3,021 2,266 20% -25% Accomodation & refreshments % 6% Distribution costs 1,409 1,430 1,728 1% 21% Electronic data costs % -15% Employee Benefit expenses 3,300 3,298 3,496 0% 6% Material 1,524 2,066 1,760 36% -15% Navigation, landing & parking 1,056 1,142 1,214 8% 6% Other operating costs 4,285 4,430 3,961 3% -11% Operating costs 21,174 23,629 24,528 12% 4% 22
23 Hedging Hedging is a critical tool in the arsenal of any company exposed to oil and currency movements in the financial markets SAA is conservative in its approach to hedging Approved target range is 40% to 60% for fuel and 50% to 75% for forex of the 12-month rolling future purchase. Industry norm is to hedge up to 80% of fuel uplift and for four years. In the environment of a declining oil price hedging, a net loss of R1,046- billion was incurred. 23
24 Balance Sheet Δ 08/09 Total Non-current assets 7,232 7, Property, aircraft And equipment 6,984 7, Other Non-current assets (47) Total Non-current liabilities (4,191) (3,729) 462 Long-Term Loans (3,519) (3,080) 439 Other Non-current liabilities (672) (649) 23 Net current liabilties (545) (1,042) (497) Current assets 10,243 9,024 (1,219) Cash and cash equivalents 5,393 3,778 (1,615) Trade and other receivables 3,598 4, Other Current assets 1,252 1,162 (90) Current liabilities (10,788) (10,066) 722 Trade and other payables (5,260) (5,127) 133 Air traffic liability (2,938) (2,623) 315 Other Current Liabilities (2,590) (2,316) 274 Net assets 2,496 2,
25 Balance Sheet Δ 08/09 Share capital 11,343 11,343 - Shareholder restructuring fund Non-distributable reserves (43) (75) (32) Accumulated losses (12,321) (12,282) 39 Shareholder's deficit (368) (361) 7 Subordinated loan guaranteed by government 1,300 1,300 - Subordinated loan guaranteed by government 1,564 1,564 - Total capital and reserves 2,496 2,
26 Content 1. Industry, Strategic and Operational Overview 2. Financial Overview 3. Conclusion and Way Forward 26


27 SAA s Strategic Value The geographical location of South Africa necessitates air services connectivity for the normal functioning of the economy and trade and industry. SAA s mandate is to be the African Airline with global reach Through its established network SAA provides: Intercontinental connections to major cities of strategic interest to South Africa SAA accounts for +/- 38% of international arrivals Through STAR, SAA offers 17,600 daily flights serving 943 cities in 159 countries Connections to key cities within Africa SAA accounts for +/- 49% of Africa arrivals from the 19 cities SAA serves SAA creates connectivity between South Africa, Africa and the rest of the World Intensive domestic schedule and connectivity SAA with its partners Airlink and SAX has the largest most frequent domestic schedule by far SAA moves over 50% of all air cargo in SA. 27
28 SAA s Strategic Value SAA contributes to and supports the broader National Governmental goals Employment Economic growth Africa footprint SAA and its subsidiaries employ people full-time Cargo allows quick movement of critical and high value goods Driving safety aviation standards in Africa Considerably more jobs generated in indirect employment in other sectors such as tourism. Training and development of technical aviation skills Access to and promotion of SA as a destination Contribution to local economy Revenue of over R7bn to local suppliers 45% of ACSA s aircraft revenue was paid by SAA R2b in direct local salaries Liberalisation of the Air traffic regulation in Africa. Largest and widest network in Africa which is an enabler for axpansion of SA companies into Africa 28
29 Looking Ahead The global economic downturn is far worse than expected and will continue longer than originally envisaged In the four months to end July 2009: - SAA passenger traffic fell by - 11% on international routes and 10% on domestic routes, but - rose by 9% on Intra African routes - Net airfares fell by 14%; - Nevertheless we are still above budget YTD 29
30 Looking Ahead We must prepare for the inevitable growth after this downturn through: Decision making on our fleet Network expansion through partnerships and The retention of, and investment in, our people Africa will remain SAA s key operational focus for expansion We will focus on: Continued strict cost containment culture Efficiency improvements Strategic and effective procurement Proactive revenue management New channels of distribution and targeted sales efforts While cost control is paramount, Safety stays non-negotiable 30
31 Conclusion SAA has delivered a net profit of R398 million this year despite: Unprecedented fuel prices, Associated hedging losses, and The onset in the 2nd half of the worst recession since 1929 Restructuring initiatives have over-delivered at R2.5 billion vs a target of R2.3 billion, and contributed significantly to this result. On time performance is the best that it has been in the past 5 years. SAA is expected to break even for 2009/10, provided: Passenger and Freight demand does not fall further Yields do not decline Rand does not weaken Fuel price does not rise SAA is confident about its future despite the challenges that the world economic crisis continues to pose. 31

32 32 Private and Confidential
National Treasury Presentation to the Standing Committee on Finance: South African Airways SOC Ltd ( SAA )
") National Treasury Presentation to the Standing Committee on Finance: South African Airways SOC Ltd ( SAA ) Presenter: National Treasury 18 November 2015 90 day Action Plan In November 2014, the Ministers
National Treasury Presentation to the Standing Committee on Finance: South African Airways SOC Ltd ( SAA ) Presenter: National Treasury 18 November 2015 90 day Action Plan In November 2014, the Ministers
Respect for customers, partners and staff. Service: another name for the respect that a company owes its customers, partners and staff.
 Respect for customers, partners and staff Service: another name for the respect that a company owes its customers, partners and staff. Vehicle glass KEY FIGURES (in EUR million) 2004 2003 % change Total
2002/03 Interim Announcement 11 November
 2002/03 Interim Announcement 11 November 2002 www.renold.com Financial Summary First Half First Half 2002/03 2001/02 m m Turnover 91.3 97.6 Trading profit before exceptional items 4.7 3.8 Profit before
Full-year Report 2009
 Full-year Report 2009 Joakim Olsson CEO and President February 12, 2009 Innovative Vehicle Technology 2010-02-12 Summary 2009 Sales of SEK 5,622m (8,403) Adjusted for currency effects sales decreased by
Strong performance by the Bolloré Group s operating activities in 2018 Mr Cyrille Bolloré unanimously appointed Chairman and Chief Executive Officer
 PRESS RELEASE 2018 results (1) March 14, 2019 Strong performance by the Bolloré Group s operating activities in 2018 Mr Cyrille Bolloré unanimously appointed Chairman and Chief Executive Officer Revenue:
2002 Preliminary Announcement 10 June 2002
 2002 Preliminary Announcement 10 June 2002 Financial Review Financial Summary 2002 2001 as restated m m Turnover 190.2 216.7 Trading profit (before exceptionals) 7.8 16.1 Profit before tax (before exceptionals)
FISCAL YEAR END MARCH 2013 FIRST HALF FINANCIAL RESULTS. New Mazda6 (Atenza)
") FISCAL YEAR END MARCH 2013 FIRST HALF FINANCIAL RESULTS New Mazda6 (Atenza) Mazda Motor Corporation October 31, 2012 1 PRESENTATION OUTLINE Highlights Fiscal Year March 2013 First Half Results Fiscal Year
FISCAL YEAR END MARCH 2013 FIRST HALF FINANCIAL RESULTS New Mazda6 (Atenza) Mazda Motor Corporation October 31, 2012 1 PRESENTATION OUTLINE Highlights Fiscal Year March 2013 First Half Results Fiscal Year
INVESTING IN GLOBAL GROWTH OPPORTUNITIES AND CHALLENGES FOR UK SUPPLY BASE.
 INVESTING IN GLOBAL GROWTH OPPORTUNITIES AND CHALLENGES FOR UK SUPPLY BASE. Rob Johnson Purchasing Director Jaguar Land Rover June 2013 Topics. Update and overview on Jaguar Land Rover New JLR UK Engine
Stronger Fundamental and Excellent Growth
 Investor Bulletin, First Half 2004 Stronger Fundamental and Excellent Growth For the first six months of 2004, PT United Tractors Tbk (UT/Company) recorded consolidated net revenue of IDR 4.29 trillion,
Spring forecasts : a tough 2009, but EU economy set to stabilise as support measures take effect
 IP/09/693 Brussels, 4 May 2009 Spring forecasts 2009-2010: a tough 2009, but EU economy set to stabilise as support measures take effect In the Commission's spring forecast, GDP in the European Union is
Kongsberg Automotive ASA. Fourth quarter February 28, 2019
 Kongsberg Automotive ASA Fourth quarter - February 28, 2019 Highlights Q4 Sales Revenues grew by 21 (7.3%) YoY to 288 including negative FX effects of 1. We booked new business with 77 in expected annual
Statistical tables S 0. Money and banking. Capital market. National financial account. Public finance
 Statistical tables Money and banking Page S South African Reserve Bank: Liabilities... 2 South African Reserve Bank: Assets... 3 Corporation for Public Deposits: Liabilities... 4 Corporation for Public
The Prospects for the Development of Jet Biofuels in China. Professor Xingwu, Zheng Civil Aviation University of China
 The Prospects for the Development of Jet Biofuels in China Professor Xingwu, Zheng Civil Aviation University of China zhengxwu@263.net Contents The Development of Air Transportation and the Demand of Jet
MOTOR VEHICLE PARTS EXPORTS FROM KWAZULU NATAL
 MOTOR VEHICLE PARTS EXPORTS FROM KWAZULU NATAL 1. Overview The automotive industry encompasses all companies that manufacture, sell, repair and recycle motor vehicles and motor vehicle parts and accessories
QUARTERLY REVIEW OF BUSINESS CONDITIONS: MOTOR VEHICLE MANUFACTURING INDUSTRY / AUTOMOTIVE SECTOR: 4 TH QUARTER 2016
 NATIONAL ASSOCIATION OF AUTOMOBILE MANUFACTURERS OF SOUTH AFRICA GROUND FLOOR, BUILDING F ALENTI OFFICE PARK 457 WITHERITE ROAD, THE WILLOWS, X82 PRETORIA PO BOX 40611, ARCADIA 0007 TELEPHONE: (012) 807-0152
Voith Group On a good footing for future growth
 Voith Group On a good footing for future growth Stuttgart, December 7, 2017 Annual press conference Stuttgart December 7, 2017 Public 1 Contents 1. Where we now stand 1.1 Highlights in the 2016/17 fiscal
QUARTERLY REVIEW OF BUSINESS CONDITIONS: NEW MOTOR VEHICLE MANUFACTURING INDUSTRY / AUTOMOTIVE SECTOR: 3 rd QUARTER 2018
 NATIONAL ASSOCIATION OF AUTOMOBILE MANUFACTURERS OF SOUTH AFRICA GROUND FLOOR, BUILDING F ALENTI OFFICE PARK 457 WITHERITE STREET, THE WILLOWS, X82 PO BOX 74166, LYNNWOOD RIDGE. 0040 TELEPHONE: (012) 807-0152
I remind you that our presentation is available on our website. We can start from the first 2 slides that show Piaggio Group First
 CONFERENCE CALL 2009 1 st HALF RESULTS Good afternoon and welcome to everybody. I remind you that our presentation is available on our website. We can start from the first 2 slides that show Piaggio Group
Deutsche Konjunktur 2012
 Frankfurt/M., 25 Januar Deutsche Konjunktur Stefan Kooths Forecasting Center, Office Berlin GDP: Moderate expansion ahead 114 25=1 QoQ annualized growth rate Level (chain index) + 2.9 +.5 + 1.7 1 112 5
DOWNSTREAM PETROLEUM 2017 DOWNSTREAM PETROLEUM
 DOWNSTREAM PETROLEUM Economic Contribution of the Industry KEY MESSAGES Australian refineries have been very long standing participants in the local market as the major transport fuel suppliers, with all
Interim Results and Business Overview 2010
 Introduction and Highlights Stobart Group recently completed its third full year as a Listed Company and I am pleased to be able to report on another period of further progress and increased profitability.
1 st Half 2018 Results. August 1 st, 2018
 1 st Half 2018 Results August 1 st, 2018 H1 HIGHLIGHTS & CATEGORY SPOTLIGHTS Gonzalve BICH 2 First Half 2018 Key Messages Challenging market and business environment Continued investment in targeted Brand
Investor Relations News
 Investor Relations News Financial year 2017: MTU Aero Engines AG once again posts record figures Earnings forecast for 2017 fully met Outlook for 2018: Moderate earnings increase, cash conversion rate
AMAG posts record shipments in 2013; dividend recommendation of 0.60 EUR per share
 Ranshofen, 28 February 2014 AMAG posts record shipments in 2013; dividend recommendation of 0.60 EUR per share Shipments at an all-time high of 351,700 tonnes (t) in 2013, compared with 344,200 t a year
Increase of the sales by 33% mainly due to the Safelite acquisition
 36 - Vehicle Glass Repair and Replacement Increase of the sales by 33% mainly due to the Safelite acquisition 37 Key events in Vehicle Glass Repair and Replacement January 2007 The launch in the UK of
Table 1 ANTIGUA AND BARBUDA: MAIN ECONOMIC INDICATORS
 Antigua Tables 2006 1 Main Indicators 03/11/2006 08:05 AM Table 1 ANTIGUA AND BARBUDA: MAIN ECONOMIC INDICATORS 1996 1997 1998 1999 2000 2001 2002 2003 2004 2005 a/ Annual growth rates b/ Gross domestic
Kongsberg Automotive ASA. Third quarter November 7, 2018
 Kongsberg Automotive ASA Third quarter - November 7, Q3 Highlights Continued improvements in turbulent times Revenues increased YoY by MEUR 18.3 (~8%) to MEUR 259 including negative FX effects of MEUR
FISCAL YEAR MARCH 2014 FINANCIAL RESULTS
 FISCAL YEAR MARCH 214 FINANCIAL RESULTS Mazda CX-5 Mazda Atenza Mazda Motor Corporation April 25, 214 New Mazda Axela 1 PRESENTATION OUTLINE Highlights Fiscal Year March 214 Results Fiscal Year March 215
Money and banking. Flow of funds for the third quarter
 Statistical tables Money and banking Page S South African Reserve Bank: Liabilities... 2 South African Reserve Bank: Assets... 3 Corporation for Public Deposits: Liabilities... 4 Corporation for Public
AMAG posts record shipments in 2013; dividend recommendation of 0.60 EUR per share unchanged on last year
 Ranshofen, 28 February 2014 AMAG posts record shipments in 2013; dividend recommendation of 0.60 EUR per share unchanged on last year Shipments at an all-time high of 351,700 tonnes (t) in 2013, compared
INCREASING SALES FOR MINING RELATED BUSINESS
 Investor Relations of PT UNITED TRACTORS Tbk INCREASING SALES FOR MINING RELATED BUSINESS In the first half 2001, the Company managed to record increase in net revenue from IDR 2.32 trillion to IDR 3.54
FISCAL YEAR END MARCH 2013 FIRST QUARTER FINANCIAL RESULTS
 FISCAL YEAR END MARCH 213 FIRST QUARTER FINANCIAL RESULTS New MAZDA CX-5 Mazda Motor Corporation July 31, 212 1 PRESENTATION OUTLINE Highlights Fiscal Year End March 213 Results Update of Structural Reform
Roadshow Presentation
 Roadshow Presentation June 2, Wilfried Trepels, CFO 1 SAF-HOLLAND - Components Fifth Wheels Kingpins Suspensions Landing Gear Axle Systems 2 SAF-HOLLAND - Business Units Trailer Systems Powered Vehicle
Travel and Tourism in Malaysia to 2017
 Published on Market Research Reports Inc. (https://www.marketresearchreports.com) Home > Travel and Tourism in Malaysia to 2017 Travel and Tourism in Malaysia to 2017 Publication ID: TMC0513014 Publication
3Q 2016 Analyst Presentation
 3Q 2016 Analyst Presentation November 18, 2016 This presentation includes forward-looking statements. Actual future conditions (including economic conditions, energy demand, and energy supply) could differ
Introducing Implats. Investor Presentation
 Investor Presentation Deutsche Bank s South Africa Conference London 20 21 June 2007 Introducing Implats Contribution to sales revenue by metal Implats is in the business of mining, refining and marketing
THREE MONTHS REPORT, JAN MARCH 2016
 THREE MONTHS REPORT, JAN MARCH 2016 TELEPHONE CONFERENCE 26 APRIL, 2016, AT 14:30 CET TOMMY ANDERSSON, PRESIDENT AND CEO HELENA WENNERSTRÖM, EVP AND CFO TO PARTICIPATE, PLEASE CALL 5 MINUTES BEFORE THE
ANALYST BRIEFING FOR THE THIRD QUARTER ENDED NOV 2016
 ANALYST BRIEFING FOR THE THIRD QUARTER ENDED 2016 21 NOV 2016 MSM Malaysia Holdings Berhad Analyst Briefing Q3 2016 21/11/2016 1 CONTENTS 01 02 03 04 05 Group Financial Highlights Performance Review Sugar
Welcome Welcome... 1
 Welcome Welcome... 1 Presentation Structure Our presentation is split into three sections going through the market, operations and financials 2 3 As it has been indicated previously, it is now much clear
Analyst Presentation Barloworld Automotive 29 February 2008
 Analyst Presentation Barloworld Automotive 29 February 2008 Automotive Division Automotive Division Overview Business Overview Motor Retail Car Rental Fleet Services Importation & Distribution Joint Ventures
Driving Value in an Inflated Market. June 24, 2015
 Driving Value in an Inflated Market June 24, 2015 Group 1 Automotive Ticker: GPI Stock Price: $82.53 * Group 1 owns and operates auto dealerships Third largest dealership group in the U.S. retailing 275,000
Earnings conference call. Q4 and Full year 2015
 Earnings conference call Q4 and Full year 2015 Bo Annvik, CEO / Åke Bengtsson, CFO 11 February 2016 1 Agenda Business Highlights Market Update Sales Financials Outlook 2 2015 in numbers Operating margin
Corporate Communications. Media Information 15 March 2011
 15 March 2011 BMW Group aims to further increase earnings in 2011 EBIT margin of over 8% expected in Automobiles segment Sales volume of well in excess of 1.5 million vehicles targeted Margin of 8% to
 Page 1 sur 5 17.03.2010 BMW Group plans sharp increase in group earnings Visible progress in 2010 towards profitability targets for 2012 Volume growth in solid single-digit percentage range targeted Munich.
Financial Summary for 2Q-FY2017 And Projections for FY2017
 Financial Summary for 2Q-FY2017 And Projections for FY2017 1 INDEX 01 Financial Summary for 2Q-FY2017 02 Performance Forecast for FY2017 03 Topics 2 01 Financial Summary for 2Q-FY2017 3 01 Financial Summary
Martin Laubscher Barloworld Automotive
 Barloworld Limited Investor Day Martin Laubscher Barloworld Automotive 2 February 2009 Business Overview Automotive Division Car Rental Fleet Services Motor Retail Joint Ventures Southern Africa Southern
Paris Tuesday, April 1, Europcar Groupe 2007 Annual Results
 Paris Tuesday, April 1, 2008 Europcar Groupe 2007 Annual Results Speakers Salvatore Catania Chief Executive Officer, Europcar Groupe Charles Desmartis Chief Financial Officer, Europcar Groupe 1 Europcar
282m 75% +575m. Net sales Operating income before non-recurring items. Operating margin before non-recurring items. Net Loss.
 First-Half 2009 Financial Highlights Net sales Operating income before non-recurring items Operating margin before non-recurring items Net Loss Net debt-to-equity ratio Free cash flow** 7,134m 282m 4.0%
Healthier Net Profit under Stronger IDR
 Investor Bulletin, First Half 2002 Healthier Net Profit under Stronger IDR As of June 2002, the consolidated revenue in USD increased by 32% y.o.y. Due to IDR strengthening against USD, in IDR revenue
SPAIN Valentin Huerta Industrias Huerta S.A., Madrid
 7th INTERNATIONAL CONGRESS FOR SPRINGMAKERS SUPPLIERS CUSTOMERS OF SPRING INDUSTRY, Sept. 20, 2013 Berlin SPAIN Valentin Huerta Industrias Huerta S.A., Madrid 71 The Spring Manufacturing Industry in Spain
2003 fourth quarter and full-year results
 Dinesh Paliwal Member of Group Executive Committee, Head of Automation Technologies Division 2003 fourth quarter and full-year results Automation Technologies Copyright 2003 ABB. All rights reserved. -
BlueScope Steel Limited Consolidated Financial Headlines
 BlueScope Steel Limited Consolidated Financial Headlines 2003 2004 2005 2006 2007 2008 2009 2010 2011 2012 2013 2013 2013 2014 2014 2014 2015 2015 2015 2016 2016 2016 2017 2017 2017 2018 2018 2018 Total
Factbook. Tokyo Electric Power Company Holdings, Inc. August Tokyo Electric Power Company Holdings, Inc. All Rights Reserved.
 Factbook Tokyo Electric Power Company Holdings, Inc. August 2018 (Note) Please note that the following to be an accurate and complete translation of the original Japanese version prepared for the convenience
Ricardo plc Ricardo plc Interims presentation 10/11 6 Months to 31 December 2010
 1 Ricardo plc Interims presentation 10/11 6 Months to 31 December 2010 2 H1 HIGHLIGHTS (six months to 31 December 2010) Order book up 16% to 117m, following strong intake (June 10: 101m) Multi-year engineering,
The Group is expected to continue benefiting from stable coal prices, but in the car market, competitive pressures are likely to intensify.
 PRESS RELEASE 24th April 2018 PT ASTRA INTERNATIONAL TBK 2018 FIRST QUARTER FINANCIAL STATEMENTS Highlights Net earnings per share down 2 at 123 Lower market share for cars and motorcycles Higher coal
NATIONAL ASSOCIATION OF AUTOMOBILE MANUFACTURERS OF SOUTH AFRICA
 NATIONAL ASSOCIATION OF AUTOMOBILE MANUFACTURERS OF SOUTH AFRICA GROUND FLOOR, BUILDING F ALENTI OFFICE PARK 457 WITHERITE ROAD, THE WILLOWS, X82 PRETORIA PO BOX 40611, ARCADIA 0007 TELEPHONE: (012) 807-0152
Fact Sheet for Q April 22, 2016
 Fact Sheet for Q1 2016 April 22, 2016 Contents Daimler Group Stock Market Information 3 Earnings and Financial Situation 4-13 Information for Divisions Mercedes-Benz Cars 14-17 Daimler Trucks 18-22 Mercedes-Benz
ADP!AALTO FULL SPEED AHEAD! A presentation to the CEO of Harley Davidson 1/10/2019. Matti Karjalainen Patrick Timmer Lauri Hanninen Tommi Bergstrom
 DISRUPTION ADP!AALTO PARTNERS FULL SPEED AHEAD! A presentation to the CEO of Harley Davidson 1/10/2019 Matti Karjalainen Patrick Timmer Lauri Hanninen Tommi Bergstrom Executive Summary How to Maintain
Q3 & 9M 2018 Results Presentation. October 24 th, 2018
 Q3 & 9M 2018 Results Presentation October 24 th, 2018 Q3 & 9M HIGHLIGHTS & CATEGORY SPOTLIGHTS Gonzalve BICH 3Q and 9M 2018 Results Presentation 2 9 Months 2018 Key Messages Continued challenging trading
1 st Half Joakim Olsson CEO and President July 17, Innovative Vehicle Technology
 1 st Half 2009 Joakim Olsson CEO and President July 17, 2009 Innovative Vehicle Technology 2009-07-17 Summary 1st half 2009 Sales of SEK 2,971m (4,473) Adjusted for currency exchange rates, sales declined
Consolidated Financial Results for 1Q FY2016 July 29, 2016 Fuji Electric Co., Ltd.
 Consolidated Financial Results for 1Q FY2016 July 29, 2016 Fuji Electric Co., Ltd. 2016Fuji Electric Co., Ltd. All rights reserved. 1 Summary of Consolidated Financial Results for 1Q FY2016 (YoY Comparison)
LOCK & LOCK. 2Q12 Earnings Release. July 30, 2012
 LOCK & LOCK 2Q12 Earnings Release July 30, 2012 Contents 1. 2Q12 Preliminary Earnings 2. Sales Breakdown by Region 3. Sales Breakdown by Channel 4. Sales Breakdown by Product Category 5. Summary Financials
Bangkok Expressway and Metro Public Company Limited Management Discussion and Analysis for the Quarter Ended on March 31, 2016
 Overall Operational Results In the first quarter of the year 2016, the Company had the net profit attributable to equity holders in the amount of Baht 702 Million, representing an increase from the same
QUARTERLY REVIEW OF BUSINESS CONDITIONS: NEW MOTOR VEHICLE MANUFACTURING INDUSTRY / AUTOMOTIVE SECTOR: 2 nd QUARTER 2018
 NATIONAL ASSOCIATION OF AUTOMOBILE MANUFACTURERS OF SOUTH AFRICA GROUND FLOOR, BUILDING F ALENTI OFFICE PARK 457 WITHERITE STREET, THE WILLOWS, X82 PO BOX 74166, LYNNWOOD RIDGE. 0040 TELEPHONE: (012) 807-0152
PT Astra International Tbk 2009 Full Year Financial Statements
 To: Business Editor For immediate release PT Astra International Tbk 2009 Full Year Financial Statements The following announcement was issued today by the Company s 69%-owned subsidiary, Jardine Cycle
Forecasting of Russian economy. Energy sector model
 Forecasting of Russian economy Energy sector model Alexandria September, 2014 Energy Sector in Russian Economy Energy sector of Russian economy Produces 14,2% of GDP Forms 66,5% of Russian exports (33%
Interim results June 30, 2003
 1 Interim results June 30, 2003 2 In units W orldwide sales at June 30 (cars and light commercial vehicles) > Worldwide sales at June 30, 2003: 1,689,200 cars and light commercial vehicles, versus 1,656,900
Disclaimer: Jardine Cycle & Carriage accepts no liability whatsoever with respect to the use of this document or its contents.
 Disclaimer: Jardine Cycle & Carriage accepts no liability whatsoever with respect to the use of this document or its contents. Highlights Underlying earnings per share 22% down Astra profit lower and contribution
Laboratory worker at Goedgevonden Coal Mine
 82 Laboratory worker at Goedgevonden Coal Mine Integrated Annual Report 2013 Operational review ARM Coal 83 ARM Coal F2013 F2012 % change ARM Coal attributable sales volumes (000t) Headline earnings Rm
Presentation to the Portfolio Committee on Transport Gautrain Update. Jack vd Merwe (Pr. Eng) CEO: Gautrain Management Agency 25 August 2009
 CEO: Gautrain Management Agency 25 August 2009") Presentation to the Portfolio Committee on Transport Gautrain Update Jack vd Merwe (Pr. Eng) CEO: Gautrain Management Agency 25 August 2009 Gautrain in a nutshell Scope Currently the largest Greenfields
Presentation to the Portfolio Committee on Transport Gautrain Update Jack vd Merwe (Pr. Eng) CEO: Gautrain Management Agency 25 August 2009 Gautrain in a nutshell Scope Currently the largest Greenfields
2015 Interim Results Announcement
 China Petroleum & Chemical Corporation 2015 Interim Results Announcement August 27, 2015 Hong Kong Cautionary Statement This presentation and the presentation materials distributed herein include forward-looking
RESULTS FOR Q ANALYST TELECONFERENCE
 RESULTS FOR Q4 216 ANALYST TELECONFERENCE Market 1 2 Operation Financials 3 Market 1 216 Fourth Quarter Market Conditions Product Market Crude Oil Postponed Maintenances Started to take place High Agricultural
BMW GROUP QUARTERLY REPORT. TO 30 SEPTEMBER 2014
 . BMW GROUP QUARTERLY REPORT. TO 30 SEPTEMBER 2014 THE BMW GROUP IS WELL ON TRACK AND PERFORMS IN LINE WITH THE GUIDANCE. The BMW Group is well on track to reach its targets for 2014. Full year guidance
Group Results 6 months ended 30th June. Net revenue 88,208 92,505 (5) Net income* 7,116 8,052 (12) Net earnings per share (12)
 Net income* 7,116 8,052 (12) Net earnings per share (12)") Page1 28th July 2016 PT ASTRA INTERNATIONAL TBK 2016 FIRST HALF FINANCIAL STATEMENTS PRESS RELEASE Highlights Net earnings per share down 12% at 176 Car unit sales up 4% and motorcycle unit sales up 1%
Page1 28th July 2016 PT ASTRA INTERNATIONAL TBK 2016 FIRST HALF FINANCIAL STATEMENTS PRESS RELEASE Highlights Net earnings per share down 12% at 176 Car unit sales up 4% and motorcycle unit sales up 1%
Preliminary Results 12 May 2009
 Preliminary Results 12 May 2009 Working together for Greener logistics solutions For period ended 28 February 2009 www.stobartgroup.com Highlights Year of growth, laying foundations for the multimodal
Third Quarter 2017 Performance and Business Update. October 26, 2017
 Third Quarter 2017 Performance and Business Update October 26, 2017 1 Important Notice Please read this management presentation together with the Company s press release issued earlier today announcing
Saft Groupe SA reports Quarterly Financial Information for the third quarter of 2007
 N 61-07 Saft Groupe SA reports Quarterly Financial Information for the third quarter of 2007 Paris, 9 th November 2007 - Saft, leader in the design, development and manufacture of high-end batteries for
KCB GROUP PLC INVESTOR PRESENTATION. Q FINANCIAL RESULTS
 KCB GROUP PLC INVESTOR PRESENTATION. Q3 2018 FINANCIAL RESULTS MACRO-ECONOMIC HIGHLIGHTS Macro-Economic Highlights: Kenya KENYA 4.9% 5.3% GDP Growth Rate (%) 5.6% 5.8% 4.9% 6.3% 6.2% KENYA 2013 2014 2015
Bus The Case for the Bus
 Bus 2020 The Case for the Bus Bus 2020 The Case for the Bus Introduction by Claire Haigh I am sure we are all pleased that the economy is on the mend. The challenge now is to make sure people, young and
IMPLATS/RBH transaction. 28 September The transaction
 IMPLATS/RBH transaction 28 September 2006 The transaction 1 Previous transaction Original transaction the IRS transaction was approved in July 2006 In essence RBN group were to acquire 49% of the business
Aegean Marine Petroleum Network Inc.
 Aegean Marine Petroleum Network Inc. First Quarter 2007 Conference Call May 24, 2007 Disclosure Today s s presentation and discussion will contain forward-looking statements within the meaning of the Private
BMW Group posts record earnings for 2010
 10.03.2011 BMW Group posts record earnings for 2010 Profit before tax rises to euro 4,836 million Profit before financial result climbs to euro 5,094 million Automobiles segment reports EBIT of euro 4,355
Natural and Economic Resources Appropriations Subcommittee 20 February W. Steven Burke President and CEO Biofuels Center of North Carolina
 Natural and Economic Resources Appropriations Subcommittee 20 February 2013 W. Steven Burke President and CEO Biofuels Center of North Carolina Three definitions: Biofuels Liquid transportation fuels.
Economic & Steel Market Development in Japan
 1 Economic & Steel Market Development in Japan 68 th OECD Steel Committee Paris May 6-7, 2010 The Japan Iron & Steel Federation 2 Macro-economic overview Steel Supply and Demand v v v Steel Production
GDP. Total Domestic demand External balance 1)
") 3.1 GDP and expenditure components (quarterly data seasonally adjusted; annual data unadjusted) GDP Total Domestic demand External balance 1) Total Private Government Gross fixed capital formation Changes
3.1 GDP and expenditure components (quarterly data seasonally adjusted; annual data unadjusted) GDP Total Domestic demand External balance 1) Total Private Government Gross fixed capital formation Changes
PT Astra International Tbk 2012 Half Year Financial Statements
 To: Business Editor For immediate release PT Astra International Tbk 2012 Half Year Financial Statements The following announcement was issued today by the Company s 72%-owned subsidiary, Jardine Cycle
FISCAL YEAR MARCH 2014 FIRST HALF FINANCIAL RESULTS. New Mazda Axela (Overseas name: New Mazda3)
") FISCAL YEAR MARCH 2014 FIRST HALF FINANCIAL RESULTS New Mazda Axela (Overseas name: New Mazda3) Mazda Motor Corporation October 31, 2013 1 PRESENTATION OUTLINE Highlights Fiscal Year March 2014 First Half
FISCAL YEAR MARCH 2014 FIRST HALF FINANCIAL RESULTS New Mazda Axela (Overseas name: New Mazda3) Mazda Motor Corporation October 31, 2013 1 PRESENTATION OUTLINE Highlights Fiscal Year March 2014 First Half
FISCAL YEAR MARCH 2015 FIRST HALF FINANCIAL RESULTS. New Mazda Demio
 FISCAL YEAR MARCH 2015 FIRST HALF FINANCIAL RESULTS New Mazda Demio Mazda Motor Corporation October 31, 2014 1 PRESENTATION OUTLINE Highlights Fiscal Year March 2015 First Half Results Fiscal Year March
A CO2-fund for the transport industry: The case of Norway
 Summary: A CO2-fund for the transport industry: The case of Norway TØI Report 1479/2016 Author(s): Inger Beate Hovi and Daniel Ruben Pinchasik Oslo 2016, 37 pages Norwegian language Heavy transport makes
FISCAL YEAR MARCH 2015 FIRST QUARTER FINANCIAL RESULTS. Mazda Roadster 25 th Anniversary Model
 FISCAL YEAR MARCH 2015 FIRST QUARTER FINANCIAL RESULTS Mazda Roadster 25 th Anniversary Model Mazda Motor Corporation July 31, 2014 1 PRESENTATION OUTLINE Highlights Fiscal Year March 2015 First Quarter
The Economic Impact of Franchised New Vehicle Dealers on the Colorado Economy
 The Economic Impact of Franchised New Vehicle Dealers on the Colorado Economy Sponsored by: Colorado Automobile Dealers Association Covering Economic Impacts for 2007 INTRODUCTION BACKGROUND This report
3QFY2018 Financial Results. Quarter Ended 31 December 2017
 3QFY2018 Financial Results Quarter Ended 31 December 2017 Disclaimer This presentation is not and does not constitute an offer, invitation, solicitation or recommendation to subscribe for, or purchase,
Future of Mobility and Role of E-mobility for Future Sustainable Transport. Petr Dolejší Director Mobility and Sustainable Transport
 Future of Mobility and Role of E-mobility for Future Sustainable Transport Petr Dolejší Director Mobility and Sustainable Transport ACEA MEMBERS 3 KEY FIGURES ABOUT THE INDUSTRY 12.1 million direct and
U.S. Rail Crude Oil Traffic
 U.S. Rail Crude Oil Traffic Association of American Railroads November 215 Summary U.S. crude oil production has risen sharply in recent years, with much of the increased output moving by rail. In 28,
Global Refining : Delivering Long-Term Value
 Taking on the world s toughest energy challenges. Global Refining : Delivering Long-Term Value J. Steve Simon Sr. Vice President, Exxon Mobil Corporation Goldman Sachs Global Energy Conference January
ANNUAL GENERAL MEETING. Cologne, 30 April 2009
 ANNUAL GENERAL MEETING Cologne, 30 April 2009 Review of 2008 2008 ended with the biggest financial and economic crisis seen for decades - Business performed well in the first half of 2008; order situation
FISCAL YEAR ENDING MARCH 2012 FIRST HALF FINANCIAL RESULTS
 FISCAL YEAR ENDING MARCH 2012 FIRST HALF FINANCIAL RESULTS Mazda Motor Corporation November 2, 2011 New Mazda CX-5 (European specifications) 1 PRESENTATION OUTLINE Highlights Fiscal Year Ending March 2012
Q3 report Joakim Olsson CEO and President October 24, Innovative Vehicle Technology
 Q3 report 2008 Joakim Olsson CEO and President October 24, 2008 Innovative Vehicle Technology 2008-10-24 Summary YTD 2008 Orders Received of 6 401 MSEK (6 077) Currency adjusted orders increased with 9
Sustainable transport better infrastructure - The Danish Government s vision for green infrastructure
 Sustainable transport better infrastructure - The Danish Government s vision for green infrastructure Maja Caroee Department of Civil and Environmental Engineering University of Hawaii at Manoa May 5th