A Salt Marsh Advancement Zone Assessment of Greenwich, Connecticut
|
|
|
- Brook Houston
- 6 years ago
- Views:
Transcription


1 A Salt Marsh Advancement Zone Assessment of Greenwich, Connecticut
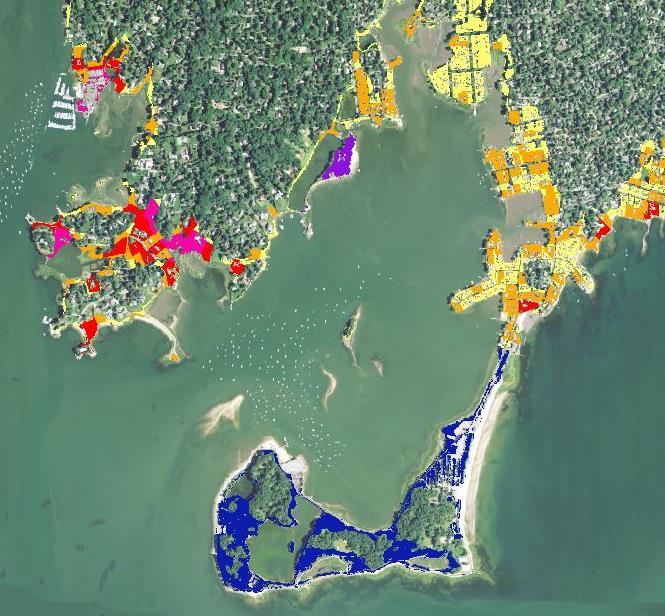
2 Front cover image: Open space and unprotected parcels critical to the conservation of marsh advancement corridors in Greenwich; from the accompanying Comprehensive Map Book of Greenwich, Connecticut.
3 Table of Contents Introduction... 2 Suitable vs. Unsuitable Advancement... 3 Marsh Advancement vs. Wetland Extent... 3 Planning for the Future... 3 Total Marsh Advancement... 4 Marsh Advancement in Open Space Parcels... 4 Total Advancement in Open Space Parcels... 4 Suitable Open Space Advancement by Owner... 5 Suitable Advancement by Open Space Parcel... 6 Marsh Advancement in All Parcels... 7 Total Advancement in All Parcels (OS vs. Non-OS)... 7 Suitable Advancement by All Parcels... 8 Appendix Map Book... 9 RECOMMENDED CITATION: Ryan, A. and A. W. Whelchel A Salt Marsh Advancement Zone Assessment of Greenwich, Connecticut. The Nature Conservancy, Coastal Resilience Program. Publication Series #1-J, New Haven, Connecticut. ACKNOWLEDGEMENTS: This effort was made possible through partial funding by the Horizon Foundation, Vervane Foundation, and the McCance Foundation Trust. Page 1
4 Introduction In 2006, The Nature Conservancy established the Coastal Resilience Program ( that provides tools and a solution framework to reduce the ecological and socio-economic risk of hazards and comprehensively improve community resilience. The Program focuses on helping decision-makers explore locally relevant, downscaled, flooding scenarios from sealevel rise and/or storm surge, analyze the potential ecological, social and economic impacts of each scenario at a local, regional, and state scale, and facilitate solutions to address these issues. Since 2006, The Nature Conservancy has assisted many coastal and inland communities in Connecticut by providing this critical information and a comprehensive, community-based process that improves overall resilience and sustainability. There is a universal recognition by coastal and inland communities in Connecticut and elsewhere that natural infrastructure wetlands and forests - is a cost effective, long-term part of the solution to help protect people, infrastructure and natural systems from extreme weather and climatic change. Fortunately, our state has a remarkable diversity and abundance of natural resources that provide habitat for wildlife and fisheries, enhance the aesthetics and quality of life for residents, and, of course, defend the shoreline and rivers against storm surge, inland flooding, and sea level rise. The presence of natural resources across the state in particular salt marsh, beaches/dunes, forested headwaters, and river floodplains is the result of previous recognition and commitment to long-term conservation and the requisite balance with socio-economic growth. In order to maintain these natural resources it will require 1) routine and on-going management activities as well as the restoration of degraded areas, 2) forward-looking planning to accommodate changes in habitat composition and location due to climatic change and 3) enforcement, modification and/or development of new land use policies and growth strategies. Opportunities also exist to account for and integrate the services or co-benefits provided by natural infrastructure via new development, redevelopment, or realignment activities. Economically important services/co-benefits from natural infrastructure include wave attenuation, improved water storage and filtering of pollutants from surface runoff, erosion control, and improved aesthetics and desirable public amenities. Taken in total, the immediate and longer-term management of natural infrastructure by the state, towns, private property owners, non-profit organizations, and others will help to reduce hazard risk and improve resilience across Connecticut. While longer-term changes in temperature and precipitation patterns will alter the species composition and type of habitats in a given location, the more immediate implication is the upslope advancement of habitats such as salt marsh in response to continued sea level rise. Sea level rise and the impacts of flooding have and will continue to alter the presence and abundance of natural resources in Connecticut. One of the most noticeable changes is occurring at the shoreline s edge where salt marsh is in the process of advancing upslope into areas now considered uplands. In order to clearly identify where this will occur along Greenwich s shoreline, The Nature Conservancy presents the following report to assist with future planning for natural resources in the context of overall risk reduction and resiliency improvement for the community. Ultimately, it is our hope that this report will serve to inform the community about Page 2
5 future marsh advancement locations, current land use of those locations and which parcels are critical to ensure the persistence of natural resources in Greenwich longer term. The Salt Marsh Advancement Model used in this analysis was co-developed by The Nature Conservancy and the University of Connecticut s Department of Natural Resources Management and Engineering. A full discussion of the Model and underlying methodology is beyond the scope of this report, but a few important details are needed to put the following analysis into context and define how to use the results for planning and implementation. Suitable vs. Unsuitable Advancement In the following figures and tables suitable advancement areas are abbreviated as Yes and unsuitable areas are abbreviated as No. Suitable areas are classified based on the current land cover type - forest or agrigrass - and as such are expected to convert to salt marsh as hydrologic conditions change due to sea level rise, in the absence of further land use conversion. Land cover types classified as urban (i.e. roads, buildings, runways, parking lots, etc ) are considered to be unsuitable for salt marsh advancement at this time. Though much of our analysis is grouped by parcel ID and associated characteristics, these classifications suitable and unsuitable exist independent of the parcel boundaries. In other words, a given residential parcel can have both suitable (lawn) and unsuitable (building footprint) advancement areas. Marsh Advancement vs. Wetland Extent There is a key distinction in this report between the current wetland extent in a municipality and the marsh advancement areas analyzed herein. Marsh advancement areas include only the future projected wetland extent clipped to current upland land cover. Therefore, no assumption should be made about net gain or loss of current wetland extent based on this advancement area analysis. Another key consideration is that in some cases the identified advancement area will include land that converts to wetlands and subsequently to open-water over time. This further demonstrates that net change in both existing and future wetland extent should not be inferred from our analysis. Planning for the Future The advancement and eventual establishment of coastal marshes will occur over the course of several decades and as such our analysis extends out to the 2080s. The rate of change is slow and decadal, yet inevitable. There is an abundance of existing property, infrastructure and natural infrastructure assets clustered along the Connecticut coast and communities will need to formulate growth and realignment plans well in advance of the 2080s scenario presented here. The following data analysis and associated map book (Appendix) can assist with a resilient transition through the presentation of marsh advancement areas and an accounting of the projected changes to coastal property. Page 3
6 Total Marsh Advancement The full extent of marsh advancement in Greenwich by the 2080s is projected to be acres, with acres (77.7%) having suitable (Yes) land cover for wetland advancement. The other acres (22.3%) are occupied by built structures and associated infrastructure and are unsuitable for marsh advancement (No), currently. Total Marsh Advancement by 2080s Percent Marsh Adv Acres (%) Yes No Total Marsh Advancement in Open Space Parcels Open space (OS) properties are a critical component of long-term community resilience because they currently have little to no development and are the most likely areas to remain undeveloped through the 2080s. The recognition of the role of these parcels in future wetland extent and improved resilience in Greenwich is vital for strategic land management, economic development, and planning. Total Advancement in Open Space Parcels The following three categories are considered in this section: Yes OS: Areas of open space suitable for marsh advancement No OS: Areas of open space unsuitable for marsh advancement Non-OS: Unprotected areas both suitable and unsuitable for marsh advancement Greenwich s open space parcels contain acres of total marsh advancement area with acres (28.3% of total) having a land cover suitable for future wetlands (Yes OS). Further analysis of the acres of unprotected parcels (Non-OS) can be found in the following Marsh Advancement in All Parcels section. Open Space Marsh Advancement Open Space Marsh Advancement 63.1% 28.3% 8.6% Yes OS No OS Non-OS OS type Acres Yes OS No OS 75.0 Non-OS Total Page 4
7 Suitable Open Space Advancement by Owner A closer look at Greenwich s protected open space properties reveals that the largest share are municipally-owned, accounting for acres (74.1%) of suitable open space. Private owners hold the next largest portion of open space advancement area, providing 61.2 acres (24.7%) of suitable marsh advancement area. A non-profit organization owns the remaining 3.1 acres of suitable marsh advancement area. Suitable Open Space Advancement Total "yes" OS Acres (%) Total "yes" adv (%) Owner type Municipal Private Non-Profit Total Suitable Open Space Advancement 24.7% Municipal 1.2% 74.1% Non-Profit Private Page 5
8 Suitable Advancement by Open Space Parcel Greenwich has 77 open space parcels that intersect the full extent of marsh advancement by the 2080s. There are 18 open space parcels that each provides more than 3 acres of suitable advancement area with a total aggregate of acres (88.3% of total). Greenwich Point Park provides the greatest area of marsh advancement zone with 71.0 acres, followed by Binney Park with 27.7 acres, which together represents 39.8% of total suitable open space advancement. 100 Open Space parcels with > 3 acres of Suitable Marsh Advancement (n = 18) Acres (log) 10 1 Parcel ID Open Space parcels with > 3 acres Suitable Marsh Advancement Parcel ID Acres Total "yes" OS (%) Owner Map Book Page # INT Municipal Municipal Private Municipal Municipal Municipal Private Municipal Private Municipal Municipal Municipal Private Municipal Municipal Private Municipal Municipal 6 Total Page 6
9 Marsh Advancement in All Parcels This section incorporates all parcels into the analysis of suitable marsh advancement. These results help put the open space analysis into perspective, as well as identify important unprotected parcels in Greenwich s marsh advancement landscape. Total Advancement in All Parcels (OS vs. Non-OS) Greenwich s existing open space parcels are made up of municipal parks and athletic fields, private recreation areas, private and municipal open space areas, residential properties greater than 10 acres, land trust properties, properties under conservation easement, Public Act 490 properties, schools, water company land, church properties, cemeteries, and golf courses. This section provides an analysis of suitable areas for marsh advancement on these open space parcels versus all other parcels. These two types of parcels are designated as: OS for open space parcels Non-OS for all other parcels Open space parcels contain acres of suitable marsh advancement (36.4% of total). The remaining acres of land suitable for marsh advancement (63.6% of total) are unprotected and generally occur on residential, commercial, or industrial properties. The unprotected suitable areas will receive nearly two-fold the marsh advancement by 2080s. This information has two important implications for future planning: 1) today s unprotected properties will play a vital role in maintaining Greenwich s wetland resources in the future, and 2) a large amount of current development (120.1 acres) will be in direct conflict with rising sea levels and advancing marshes. 600 Total Marsh Advancement in All Parcels 500 Total Marsh Advancement 400 Parcel type Yes No Total Acres No Yes OS Non-OS Total OS Non-OS Page 7
10 Suitable Advancement by All Parcels There are 1,462 parcels in Greenwich that provide areas of suitable marsh advancement, but only 21 parcels offer suitable areas greater than 3 acres. This small subset provides acres of marsh advancement; 34.2% of Greenwich s overall total. The specific parcels can be viewed via the corresponding Map Book pages (Appendix) indicated in the table below. 100 All Parcels with > 3 acres of Suitable Marsh Advancement (n=21) Acres (log) 10 1 Parcel ID Open Space parcels in dark green All Parcels with > 3 acres of Suitable Marsh Advancement Page 8 Total yes adv (%) Map Book Page # Parcel ID Acres INT ,7,14, ,7,14, ,6,16, Total
11 Appendix Map Book Please consult your Salt Marsh Advancement Resource Disc for the complete dataset of suitable and unsuitable advancement per parcel. Page 9
12
13 Comprehensive Map Book of Greenwich, Connecticut
14 This pag e intentionally left blank
15 -- Table of Contents -- Overview Maps Marsh Advancement Unprotected Parcels Critical Parcels Inset Maps Unprotected Parcels Advancement per Parcel Page 1
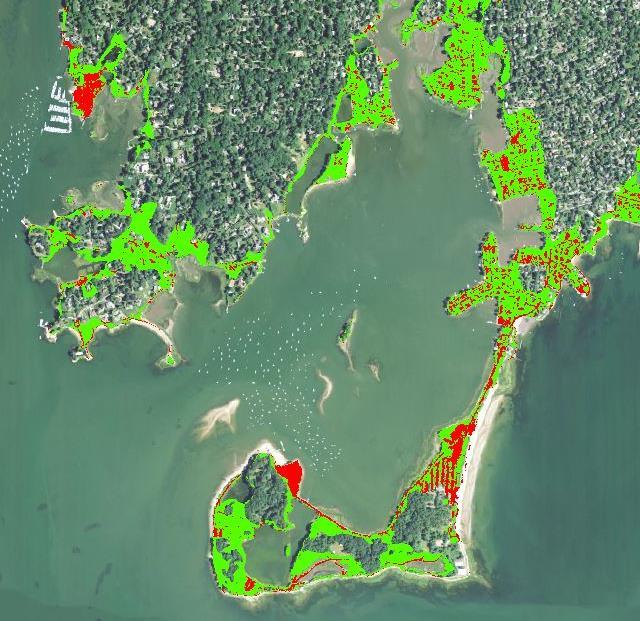
16 Marsh Advancement by the 2080s Marsh Advancement - West Mile ± Marsh Advancement by 2080s Developed Land Cover Forest, Grass, Ag Land Cover West East Page 2
17 Marsh Advancement by the 2080s Marsh Advancement - East Mile ± Marsh Advancement by 2080s Developed Land Cover Forest, Grass, Ag Land Cover West East Page 3
18 Marsh Advancement by the 2080s Unprotected Parcels - West Mile ± Parcels Marsh Advancement by 2080s Unprotected Non-OS Developed Land Cover Forest, Grass, Ag Land Cover Note: Only Non-OS parcels with > 3 acres of suitable advancement are shown. West East Page 4
19 Marsh Advancement by the 2080s Unprotected Parcels - East Mile ± Parcels Marsh Advancement by 2080s Unprotected Non-OS Developed Land Cover Forest, Grass, Ag Land Cover Note: Only Non-OS parcels with > 3 acres of suitable advancement are shown. West East Page 5
20 Marsh Advancement by the 2080s Critical Parcels - West Mile ± Note: Only Non-OS parcels and OS parcels with > 3 acres of suitable advancement are shown. Parcels Unprotected Non-OS Protected OS West East Page 6
21 Marsh Advancement by the 2080s Critical Parcels - East Mile ± Note: Only Non-OS parcels and OS parcels with > 3 acres of suitable advancement are shown. Parcels Unprotected Non-OS Protected OS West East INT Page 7
22 This pag e intentionally left blank Page 8
23 Marsh Advancement by the 2080s Map Index - Unprotected Parcels A2 A3 A4 B1 B2 B3 B4 C1 C2 C3 Page 9
24 see page 11 Feet ,000 2,000 3,000 see page 14 Marsh Advancement by the 2080s Unprotected Parcels - Map A2 A2 A3 A4 µ B1 B2 B3 B4 Parcels Unprotected Non-OS Marsh Advancement Developed Land Cover Forest, Grass, Ag Land Cover Note: Only Non-OS parcels with > 3 acres of suitable marsh advancement are shown. C1 C2 C3 Page 10
25 see page 10 see page 12 Feet ,000 2,000 3,000 see page 15 Marsh Advancement by the 2080s Unprotected Parcels - Map A3 A2 A3 A4 µ B1 B2 B3 B4 Parcels Unprotected Non-OS Marsh Advancement Developed Land Cover Forest, Grass, Ag Land Cover Note: Only Non-OS parcels with > 3 acres of suitable marsh advancement are shown. C1 C2 C3 Page 11
26 see page 11 Feet ,000 2,000 3,000 see page 16 Marsh Advancement by the 2080s Unprotected Parcels - Map A4 A2 A3 A4 µ B1 B2 B3 B4 Parcels Unprotected Non-OS Marsh Advancement Developed Land Cover Forest, Grass, Ag Land Cover Note: Only Non-OS parcels with > 3 acres of suitable marsh advancement are shown. C1 C2 C3 Page 12
27 see page 14 Feet ,000 2,000 3,000 see page 17 Marsh Advancement by the 2080s Unprotected Parcels - Map B1 A2 A3 A4 µ B1 B2 B3 B4 Parcels Unprotected Non-OS Marsh Advancement Developed Land Cover Forest, Grass, Ag Land Cover Note: Only Non-OS parcels with > 3 acres of suitable marsh advancement are shown. C1 C2 C3 Page 13
28 see page 10 see page 13 see page 15 Feet ,000 2,000 3,000 see page 18 Marsh Advancement by the 2080s Unprotected Parcels - Map B2 A2 A3 A4 µ B1 B2 B3 B4 Parcels Unprotected Non-OS Marsh Advancement Developed Land Cover Forest, Grass, Ag Land Cover Note: Only Non-OS parcels with > 3 acres of suitable marsh advancement are shown. C1 C2 C3 Page 14
29 see page see page see page 16 Feet ,000 2,000 3,000 see page 19 Marsh Advancement by the 2080s Unprotected Parcels - Map B3 A2 A3 A4 µ B1 B2 B3 B4 Parcels Unprotected Non-OS Marsh Advancement Developed Land Cover Forest, Grass, Ag Land Cover Note: Only Non-OS parcels with > 3 acres of suitable marsh advancement are shown. C1 C2 C3 Page 15
30 see page 12 see page 15 Feet ,000 2,000 3,000 Marsh Advancement by the 2080s Unprotected Parcels - Map B4 A2 A3 A4 µ B1 B2 B3 B4 Parcels Unprotected Non-OS Marsh Advancement Developed Land Cover Forest, Grass, Ag Land Cover Note: Only Non-OS parcels with > 3 acres of suitable marsh advancement are shown. C1 C2 C3 Page 16
31 see page see page 18 Feet ,000 2,000 3,000 Marsh Advancement by the 2080s Unprotected Parcels - Map C1 A2 A3 A4 µ B1 B2 B3 B4 Parcels Unprotected Non-OS Marsh Advancement Developed Land Cover Forest, Grass, Ag Land Cover Note: Only Non-OS parcels with > 3 acres of suitable marsh advancement are shown. C1 C2 C3 Page 17
32 see page 14 see page 17 see page 19 Feet ,000 2,000 3,000 Marsh Advancement by the 2080s Unprotected Parcels - Map C2 A2 A3 A4 µ B1 B2 B3 B4 Parcels Unprotected Non-OS Marsh Advancement Developed Land Cover Forest, Grass, Ag Land Cover Note: Only Non-OS parcels with > 3 acres of suitable marsh advancement are shown. C1 C2 C3 Page 18
33 see page 15 see page 18 Feet ,000 2,000 3,000 Marsh Advancement by the 2080s Unprotected Parcels - Map C3 A2 A3 A4 µ B1 B2 B3 B4 Parcels Unprotected Non-OS Marsh Advancement Developed Land Cover Forest, Grass, Ag Land Cover Note: Only Non-OS parcels with > 3 acres of suitable marsh advancement are shown. C1 C2 C3 Page 19
34 This pag e intentionally left blank Page 19
35 Marsh Advancement by the 2080s Map Index - Advancement per Parcel A2 A3 A4 B1 B2 B3 B4 C1 C2 C3 Page 20
36 see page 22 Feet ,000 2,000 3,000 see page 25 Marsh Advancement by the 2080s Advancement per Parcel - Map A2 A2 A3 A4 Area of Suitable Advancement < 0.5 acres > 20 acres µ Note: Only Non-OS parcels with > 3 acres of suitable marsh advancement are shown. B1 C1 B2 C2 B3 C3 B4 Page 21
37 see page 21 see page 23 Feet ,000 2,000 3,000 see page 26 Marsh Advancement by the 2080s Advancement per Parcel - Map A3 A2 A3 A4 Area of Suitable Advancement < 0.5 acres > 20 acres µ Note: Only Non-OS parcels with > 3 acres of suitable marsh advancement are shown. B1 C1 B2 C2 B3 C3 B4 Page 22
38 see page 22 Feet ,000 2,000 3,000 see page 27 Marsh Advancement by the 2080s Advancement per Parcel - Map A4 A2 A3 A4 Area of Suitable Advancement < 0.5 acres > 20 acres µ Note: Only Non-OS parcels with > 3 acres of suitable marsh advancement are shown. B1 C1 B2 C2 B3 C3 B4 Page 23
39 see page 25 Feet ,000 2,000 3,000 see page 28 Marsh Advancement by the 2080s Advancement per Parcel - Map B1 A2 A3 A4 Area of Suitable Advancement < 0.5 acres > 20 acres µ Note: Only Non-OS parcels with > 3 acres of suitable marsh advancement are shown. B1 C1 B2 C2 B3 C3 B4 Page 24
40 see page 21 see page 24 see page 26 Feet ,000 2,000 3,000 see page 29 Marsh Advancement by the 2080s Advancement per Parcel - Map B2 A2 A3 A4 Area of Suitable Advancement < 0.5 acres > 20 acres µ Note: Only Non-OS parcels with > 3 acres of suitable marsh advancement are shown. B1 C1 B2 C2 B3 C3 B4 Page 25
41 see page see page 25 see page 27 Feet ,000 2,000 3,000 see page 30 Marsh Advancement by the 2080s Advancement per Parcel - Map B3 A2 A3 A4 Area of Suitable Advancement < 0.5 acres > 20 acres µ Note: Only Non-OS parcels with > 3 acres of suitable marsh advancement are shown. B1 C1 B2 C2 B3 C3 B4 Page 26
42 see page 23 see page 26 Feet ,000 2,000 3,000 Marsh Advancement by the 2080s Advancement per Parcel - Map B4 A2 A3 A4 Area of Suitable Advancement < 0.5 acres > 20 acres µ Note: Only Non-OS parcels with > 3 acres of suitable marsh advancement are shown. B1 C1 B2 C2 B3 C3 B4 Page 27
43 see page see page 29 Feet ,000 2,000 3,000 Marsh Advancement by the 2080s Advancement per Parcel - Map C1 A2 A3 A4 Area of Suitable Advancement < 0.5 acres > 20 acres µ Note: Only Non-OS parcels with > 3 acres of suitable marsh advancement are shown. B1 C1 B2 C2 B3 C3 B4 Page 28
44 see page 25 see page 28 see page 30 Feet ,000 2,000 3,000 Marsh Advancement by the 2080s Advancement per Parcel - Map C2 A2 A3 A4 Area of Suitable Advancement < 0.5 acres > 20 acres µ Note: Only Non-OS parcels with > 3 acres of suitable marsh advancement are shown. B1 C1 B2 C2 B3 C3 B4 Page 29
45 see page 26 see page 29 Feet ,000 2,000 3,000 Marsh Advancement by the 2080s Advancement per Parcel - Map C3 A2 A3 A4 Area of Suitable Advancement < 0.5 acres > 20 acres µ Note: Only Non-OS parcels with > 3 acres of suitable marsh advancement are shown. B1 C1 B2 C2 B3 C3 B4 Page 30
46
APPENDIX VMT Evaluation
 APPENDIX 2.7-2 VMT Evaluation MEMORANDUM To: From: Mr. Jonathan Frankel New Urban West, Incorporated Chris Mendiara LLG, Engineers Date: May 19, 2017 LLG Ref: 3-16-2614 Subject: Villages VMT Evaluation
Topic Paper. Peri-Urban Open Space. how multi-functional land use can bring multiple benefits
 Topic Paper Peri-Urban Open Space how multi-functional land use can bring multiple benefits Introduction PURPLE s Topic Papers aim to raise and explore important issues for policy makers and politicians
The Preferred Alternative: a Vision for Growth on the Northeast Corridor
 A Long-Term Vision is Needed The Preferred Alternative: a Vision for Growth on the Northeast Corridor The Federal Railroad Administration (FRA) has released the Tier 1 Final Environmental Impact Statement
Comparison of Parcel Allocations by Alternative KENTUCKY RESERVOIR
 Comparison of Parcel s by Alternative KENTUCKY RESERVOIR Because of the differences with past and present land planning methodologies, to facilitate the comparison of Alternatives A and B, the existing
Car Sharing at a. with great results.
 Car Sharing at a Denver tweaks its parking system with great results. By Robert Ferrin L aunched earlier this year, Denver s car sharing program is a fee-based service that provides a shared vehicle fleet
Taylor s Falls Business Park
 Site Information Taylor s Falls Business Park County Road 37, Taylors Falls, MN Chisago County HRA-EDA 12/23/2014 Taylors Falls Business Park County Road 37 Taylors Falls, MN 55084 PROPERTY FEATURES: Zoned
GIBRALTAR ERDF OPERATIONAL PROGRAMME POST ADOPTION STATEMENT
 Intended for Government of Gibraltar Document type Report Date January 2015 GIBRALTAR ERDF OPERATIONAL PROGRAMME 2014-2020 POST ADOPTION STATEMENT GIBRALTAR ERDF OPERATIONAL PROGRAMME 2014-2020 POST ADOPTION
Corporate Engagement in Wetlands Restoration
 Corporate Engagement in Wetlands Restoration ConocoPhillips Coastal Wetlands A Model for Success Presentation Overview Property Overview CWPPRA Engagement ConocoPhillips/Ducks Unlimited Collaboration Restoration
Green Line LRT: Beltline Segment Update April 19, 2017
 Green Line LRT: Beltline Segment Update April 19, 2017 Quick Facts On April 11, 2017, City Council approved Administration s recommendation for the Green Line to be underground in the Beltline from 2 Street
Recommended Vision for the Downtown Rapid Transit Network
 Recommended Vision for the Downtown Rapid Transit Network April 2008 Presentation Overview Context Transit options Assessment of options Recommended network Building the network 2 1 Rapid Our Vision Reliable
City of Minnetonka Maximum Parking Regulations Urban GIS. Group Members Brad Johnston Mark Kelley Jonathan Winge
 City of Minnetonka Maximum Parking Regulations Urban GIS Group Members Brad Johnston Mark Kelley Jonathan Winge This project was supported by the Resilient Communities Project (RCP), a program at the University
Parking Management Element
 Parking Management Element The State Transportation Planning Rule, adopted in 1991, requires that the Metropolitan Planning Organization (MPO) area implement, through its member jurisdictions, a parking
Save-the-date: Workshop on batteries for electric mobility
 Joint workshop by the Clean Energy Ministerial, the International Energy Agency and the Electric Vehicle Initiative Save-the-date: Workshop on batteries for electric mobility Wednesday 7 March 2018 Centre
Green Line LRT: Beltline Recommendation Frequently Asked Questions
 Green Line LRT: Beltline Recommendation Frequently Asked Questions June 2017 Quick Facts Administration has evaluated several alignment options that would connect the Green Line in the Beltline to Victoria
How to Create Exponential Decline in Car Use in Australian Cities. By Peter Newman, Jeff Kenworthy and Gary Glazebrook.
 How to Create Exponential Decline in Car Use in Australian Cities By Peter Newman, Jeff Kenworthy and Gary Glazebrook. Curtin University and University of Technology Sydney. Car dependent cities like those
Sales and Use Transportation Tax Implementation Plan
 Sales and Use Transportation Tax Implementation Plan Transportation is more than just a way of getting from here to there. Reliable, safe transportation is necessary for commerce, economic development,
STRATEGIC PRIORITIES AND POLICY COMMITTEE MAY 5, 2016
 STRATEGIC PRIORITIES AND POLICY COMMITTEE MAY 5, 2016 Shift Rapid Transit Initiative Largest infrastructure project in the city s history. Rapid Transit initiative will transform London s public transit
RE: Comments on Proposed Mitigation Plan for the Volkswagen Environmental Mitigation Trust
 May 24, 2018 Oklahoma Department of Environmental Quality Air Quality Division P.O. Box 1677 Oklahoma City, OK 73101-1677 RE: Comments on Proposed Mitigation Plan for the Volkswagen Environmental Mitigation
Labelling Smart Roads DISCUSSION PAPER 4/2015
 DISCUSSION PAPER 4/2015 December 2015 TABLE OF CONTENTS 1. Introduction... 3 2. The Smart Roads of the Future... 3 3. : Sustainability of road infrastructure... 4 4. : Sustainability in mobility management
SOCIO-ECONOMIC and LAND USE DATA
 SOCIO-ECONOMIC and LAND USE DATA FUTURE CONDITIONS January CHATHAM URBAN TRANSPORTATION STUDY - 1 - Table of Contents Introduction 3 TAZ - Municipality - Map Index...8 2005 Socio-economic and Land Use
Study Report. McCredie-Overton Transmission Line Right-of-Way Analysis. City of Columbia, Missouri. prepared for the (S49)
") Study Report McCredie-Overton Transmission Line Right-of-Way Analysis prepared for the City of Columbia, Missouri (S49) May, 2017 S49 McCredie-Overton Transmission Line Right-of-Way Study Report Table
Study Report McCredie-Overton Transmission Line Right-of-Way Analysis prepared for the City of Columbia, Missouri (S49) May, 2017 S49 McCredie-Overton Transmission Line Right-of-Way Study Report Table
Sunnyside Yard Master Plan. RFQ Information Session September 13, 2017
 Sunnyside Yard Master Plan RFQ Information Session September 13, 2017 Agenda 1. Introduction by Tom McKnight 2. Context for the Sunnyside Yard Master Plan 3. RFQ Process 4. Questions Sunnyside Yard in
Public Information Workshop
 Public Information Workshop Charlotte County-Punta Gorda MPO - Meeting Rooms A and B March 29, 2018 Welcome to the Public Information Workshop for Harborview Road Project Development and Environment (PD&E)
TORONTO TRANSIT COMMISSION REPORT NO.
 Form Revised: February 2005 TORONTO TRANSIT COMMISSION REPORT NO. MEETING DATE: October 24, 2012 SUBJECT: DOWNTOWN RAPID TRANSIT EXPANSION STUDY (DRTES) PHASE 1 STRATEGIC PLAN ACTION ITEM RECOMMENDATIONS
IDA 54th Annual Conference, September 11-14, 2008 Calgary, Alberta. Salima Ebrahim, City of Calgary Maggie Schofield, Calgary Downtown Association
 Partnership Success Part Two Implementation and Success How the City of Calgary and the BRZ's created a successful working relationship to enhance the safety, vitality and appeal of the centre city IDA
Lower River Floodplain Restoration and Levee/Towne Road Re-Alignment Noise Analysis
 Lower River Floodplain Restoration and Levee/Towne Road Re-Alignment Noise Analysis This project is not anticipated to create additional noise beyond the current background levels. Although Towne Road
Executive Summary October 2013
 Executive Summary October 2013 Table of Contents Introduction... 1 Rider Transit and Regional Connectivity... 1 Plan Overview... 2 Network Overview... 2 Outreach... 3 Rider Performance... 4 Findings...
Funding Scenario Descriptions & Performance
 Funding Scenario Descriptions & Performance These scenarios were developed based on direction set by the Task Force at previous meetings. They represent approaches for funding to further Task Force discussion
Transitioning to Integrated Sustainable Multi-mobility. A Model Climate Action Strategy
 Transitioning to Integrated Sustainable Multi-mobility A Model Climate Action Strategy 8 03 2009 Timothy Papandreou Assistant Deputy Director Planning & Development SFMTA-Municipal Transportation Agency
Minimum parking requirements create more parking than is needed.
 Do Cities Have Too Much Parking? A N D R E W M. F R A S E R, M I K H A I L V. C H E S T E R, J U A N M. M AT U T E, A N D R A M P E N D YA L A Minimum parking requirements create more parking than is needed.
Transportation Electrification: Reducing Emissions, Driving Innovation. August 2017
 Transportation Electrification: Reducing Emissions, Driving Innovation August 2017 CA raising the bar in environmental policy and action Senate Bill 350 (DeLeon, 2015) established broad and ambitious clean
WOLVERINE TO BHP JANSEN NEW TRANSMISSION LINE PROJECT FALL 2017
 WOLVERINE TO BHP JANSEN NEW TRANSMISSION LINE PROJECT FALL 2017 TODAY WE LL TALK ABOUT Our challenges and how we re meeting them Why we re building this project Our planning process and considerations
REGIONAL GREENHOUSE GAS INVENTORY: TRANSPORTATION AND STATIONARY ENERGY
 SOUTHEAST FLORIDA REGIONAL COMPACT CLIMATE CHANGE REGIONAL GREENHOUSE GAS INVENTORY: TRANSPORTATION AND STATIONARY ENERGY METHODOLOGY REPORT Implementation support provided by: With funding support from:
Metro Reimagined. Project Overview October 2017
 Metro Reimagined Project Overview October 2017 Reimagining Metro Transit Continuing our Commitment to: Provide mobility based on existing and future needs Value the role of personal mobility in the quality
City of Lake Oswego Transportation System Plan Update PLAN AND POLICY REVIEW, PART 1
 City of Lake Oswego Transportation System Plan Update PLAN AND POLICY REVIEW, PART 1 Date: March 7, 2012 Project #: 11187 To: Cc: From: Project: Subject: Project Management Team Transportation System Plan
2013/2014 Strategic Priorities Fund Application Overview
 2013/2014 Strategic Priorities Fund Application Overview Bob Paddon, Executive Vice President Strategic Planning and Public Affairs TransLink 3 December 2013 Strategic Priorities Fund Application Context
Yukon Resource Gateway Project
 Yukon Resource Gateway Project Summary Application for National Infrastructure Component Funding January 2016 Introduction The Government of Yukon is seeking endorsement of the Yukon Resource Gateway
Kendall Drive Premium Transit PD&E Study Project Kick-Off Meeting SR 94/Kendall Drive/SW 88 Street Project Development and Environment (PD&E) Study
 Study") Florida Department of Transportation District Six Kendall Drive Premium Transit PD&E Study Project Kick-Off Meeting SR 94/Kendall Drive/SW 88 Street Project Development and Environment (PD&E) Study What
Florida Department of Transportation District Six Kendall Drive Premium Transit PD&E Study Project Kick-Off Meeting SR 94/Kendall Drive/SW 88 Street Project Development and Environment (PD&E) Study What
Minimization 36 CFR (b)
") Rico West Dolores Roads and Trails (Travel Management) Project Draft Record of Decision, Attachment 6 Travel Rule for Motor Vehicle designations of trails and areas (Minimization ) As described in the
Rico West Dolores Roads and Trails (Travel Management) Project Draft Record of Decision, Attachment 6 Travel Rule for Motor Vehicle designations of trails and areas (Minimization ) As described in the
NEW HAVEN HARTFORD SPRINGFIELD RAIL PROGRAM
 NEW HAVEN HARTFORD SPRINGFIELD RAIL PROGRAM Hartford Rail Alternatives Analysis www.nhhsrail.com What Is This Study About? The Connecticut Department of Transportation (CTDOT) conducted an Alternatives
Tehachapi Renewable Transmission Project. Chino Hills Proposed Alternative. for Segment 8A of the. Chino Hills - September 11, 2007
 Chino Hills Proposed Alternative for Segment 8A of the Tehachapi Renewable Transmission Project Chino Hills - September 11, 2007 1 Objective Start the dialogue on the attributes of the Chino Hills Proposed
Town of Londonderry, New Hampshire NH Route 28 Western Segment Traffic Impact Fee Methodology
 Town of Londonderry, New Hampshire NH Route 28 Western Segment Traffic Impact Fee Methodology Prepared by the Londonderry Community Development Department Planning & Economic Development Division Based
THE CORNERSTONE APARTMENTS TRAFFIC IMPACT STUDY R&M PROJECT NO
 THE CORNERSTONE APARTMENTS SITUATED AT N/E/C OF STAUDERMAN AVENUE AND FOREST AVENUE VILLAGE OF LYNBROOK NASSAU COUNTY, NEW YORK TRAFFIC IMPACT STUDY R&M PROJECT NO. 2018-089 September 2018 50 Elm Street,
Welcome to: PUBLIC OPEN HOUSES MARCH 22 AND 25, 2004 GENERAL LAND USE PLAN. Please take some time to read through this presentation.
 Welcome to: GENERAL LAND USE PLAN PUBLIC OPEN HOUSES MARCH 22 AND 25, 2004 Please take some time to read through this presentation. Feel free to ask questions and provide any ideas, opinions or comments
We Want Your Input! Review the design alternatives and tell us what s important to you in the design of these areas of the approved BRT Network:
 We Want Your Input! Review the design alternatives and tell us what s important to you in the design of these areas of the approved BRT Network: Richmond North of Oxford Street Richmond Row Dundas Street
Environmental Assessment Derry Road and Argentia Road Intersection
 Air and Noise Study Environmental Assessment Derry Road and Argentia Road Intersection Project 11-4295 City of Mississauga, Region of Peel October 17, 2014 1 Region of Peel Environmental Assessment for
Appendix C. Parking Strategies
 Appendix C. Parking Strategies Bremerton Parking Study Introduction & Project Scope Community concerns regarding parking impacts in Downtown Bremerton and the surrounding residential areas have existed
Appendix A. Community Workshop Results PUBLIC REVIEW DRAFT
 Appendix A Community Workshop Results This Page Left Blank Intentionally Comprehensive Planning Community Workshop Summary July 30, 2012 The City of Becker invited the Community to participate in a Comprehensive
PUBLIC INFRASTRUCTURE PROJECTS
 PUBLIC INFRASTRUCTURE PROJECTS FM 664 / OVILLA ROAD WIDENING & IMPROVEMENTS FM 664 / OVILLA ROAD CONNECTS US 287 WITH I-45 (SOURCE: TEXAS DEPARTMENT OF TRANSPORTATION. 2016 FM 664 / OVILLA ROAD WIDENING
BIRMINGHAM CONNECTED Anne Shaw Tuesday 20 January 2015
 BIRMINGHAM CONNECTED Anne Shaw Tuesday 20 January 2015 www.birmingham.gov.uk/connected Birmingham Connected Setting the context challenges in Birmingham The need for action The EU the SUMP process Strategy
EUGENE-SPRINGFIELD, OREGON EAST WEST PILOT BRT LANE TRANSIT DISTRICT
 EUGENE-SPRINGFIELD, OREGON EAST WEST PILOT BRT LANE TRANSIT DISTRICT (BRIEF) Table of Contents EUGENE-SPRINGFIELD, OREGON (USA)... 1 COUNTY CONTEXT AND SYSTEM DESCRIPTION... 1 SYSTEM OVERVIEW... 1 PLANNING
Focused acceleration: a strategic approach to climate action in cities FEBEG ENERGY EVENT, BRUSSELS, JUNE 27, 2018
 Focused acceleration: a strategic approach to climate action in cities FEBEG ENERGY EVENT, BRUSSELS, JUNE 27, 2018 The world s human activity is concentrated in cities 50+% of the global population 80%
Chapter 7: Corridor Visions
 Chapter 7: Corridor Visions (see also Appendix 7 for Details) January 24, 2008 NOTE: This document has been prepared using Federal funding from the United States Department of Transportation. The United
CITY OF OMAHA OMAHA, NEBRASKA
 DOWNTOWN PARKING NEEDS ASSESSMENT UPDATE CITY OF OMAHA OMAHA, NEBRASKA Prepared for: City of Omaha Parking Division October 15, 2014 FINAL REPORT TABLE OF CONTENTS EXECUTIVE SUMMARY... 1 Study Purpose...
Proposed Dounreay - Mybster 275 kv / 132 kv
 Background Scottish Hydro-Electric Transmission Ltd (SHETL) is proposing a new 275 kilovolt (kv) (1 kilovolt = 1000volts) double circuit overhead line (OHL) between the Dounreay sub station and the new
The purpose of this report is to respond to the Notice of Motion CS-16-51, Generators for Fire Halls and Recreation Facilities, including:
 Public Report To: From: Report Number: Community Services Committee Ron Diskey, Commissioner, Community Services Department CS-17-18 Date of Report: March 24, 2017 Date of Meeting: March 30, 2017 Subject:
We recommend you keep a copy of this ordinance with you while you are off-roading.
 ARTICLE IV. Operation of off-road vehicles, motorcycles and all-terrain vehicles We recommend you keep a copy of this ordinance with you while you are off-roading. DIVISION 1. - GENERALLY Sec. 70-85. -
City of Holland Summary of Sustainability Activities. Western Michigan Regional Green Communities Workshop February 17, 2012
 City of Holland Summary of Sustainability Activities Western Michigan Regional Green Communities Workshop February 17, 2012 March 2009 - Creation of the Holland Community Sustainability Committee (SusCom)
/ Planning and Zoning Staff Report Lonestar Land, LLC. - Rezone, RZ
 / Planning and Zoning Staff Report Lonestar Land, LLC. - Rezone, RZ2018-0019 Hearing Date: October 18, 2018 Development Services Department Applicant: Lonestar Land, LLC. Representative: Lance Warnick
Plattsburgh Downtown Parking Study
 Plattsburgh Downtown Parking Study Study Update October 2017 Powered by Purpose of Study Engage Community in Parking Discussion Assess Current Conditions Parking Demand Patron Service Levels Administration
Stakeholder Meeting #3. August 22, 2018
 Stakeholder Meeting #3 August 22, 2018 Good Afternoon Stakeholder Introductions Name and Affiliation Ground Rules Agenda Climate Action Plan Process Overview Vision Statements Overarching vision of what
Forecast Allocation Methodology. Kitsap 10-Year Update Kitsap County August 2006; Updated November 2006
 Appendix D Methods Forecast Allocation Methodology Kitsap 10-Year Update Kitsap County August 2006; Updated November 2006 Employment and Population Forecast Allocation Methodology Prepared for: Kitsap
BROWARD BOULEVARD CORRIDOR TRANSIT STUDY
 BROWARD BOULEVARD CORRIDOR TRANSIT STUDY FM # 42802411201 EXECUTIVE SUMMARY July 2012 GOBROWARD Broward Boulevard Corridor Transit Study FM # 42802411201 Executive Summary Prepared For: Ms. Khalilah Ffrench,
Technological Viability Evaluation. Results from the SWOT Analysis Diego Salzillo Arriaga, Siemens
 Technological Viability Evaluation Results from the SWOT Analysis Diego Salzillo Arriaga, Siemens 26.04.2018 Agenda Study Objectives and Scope SWOT Analysis Methodology Cluster 4 Results Cross-Cluster
Railyard Alternatives & I-280 Boulevard Feasibility Study 1 RAILYARD ALTERNATIVES & I-280 BOULEVARD (RAB) FEASIBILITY STUDY
 FEASIBILITY STUDY") Railyard Alternatives & I-280 Boulevard Feasibility Study 1 RAILYARD ALTERNATIVES & I-280 BOULEVARD (RAB) FEASIBILITY STUDY RAB Citizen Working Group Meeting, August 1 st 2016 CITIZEN WORKING GROUP (CWG)
Railyard Alternatives & I-280 Boulevard Feasibility Study 1 RAILYARD ALTERNATIVES & I-280 BOULEVARD (RAB) FEASIBILITY STUDY RAB Citizen Working Group Meeting, August 1 st 2016 CITIZEN WORKING GROUP (CWG)
A CO2-fund for the transport industry: The case of Norway
 Summary: A CO2-fund for the transport industry: The case of Norway TØI Report 1479/2016 Author(s): Inger Beate Hovi and Daniel Ruben Pinchasik Oslo 2016, 37 pages Norwegian language Heavy transport makes
New Haven Hartford Springfield Rail
 New Haven Hartford Springfield Rail Opportunities for Economic Growth NHHS Rail Conference, October 25, 2011 NHHSrail.com Tom Maziarz, CT DOT, Bureau of Policy & Planning Thomas.Maziarz@ct.gov New Haven
How to make urban mobility clean and green
 POLICY BRIEF Decarbonising Transport Initiative How to make urban mobility clean and green The most effective way to decarbonise urban passenger transport? Shared vehicles, powered by clean electricity,
Executive Summary EXECUTIVE SUMMARY Parking Issues Trenton Downtown Parking Policy and Sidewalk Design Standards E.S. Page 1 Final Report 2008
 EXECUTIVE SUMMARY A walkable environment that accommodates market demand while minimizing the negative impacts of growth is an important element in promoting the City s downtown revitalization. There are
Climate Change. November 29, 2018 Growth Management Policy Board
 Climate Change November 29, 2018 Growth Management Policy Board VISION 2050 and Climate Change 1. Climate Background Paper: Background information Regional inventory Emission reduction efforts Potential
Downtown Lee s Summit Parking Study
 Downtown Lee s Summit Parking Study As part of the Downtown Lee s Summit Master Plan, a downtown parking and traffic study was completed by TranSystems Corporation in November 2003. The parking analysis
Alternative Fuels Corridor Implementation. MARAMA Workshop Mark Hand, Pennsylvania Department of Environmental Protection March 20, 2019
 Alternative Fuels Corridor Implementation Tom Wolf, Governor MARAMA Workshop Mark Hand, Pennsylvania Department of Environmental Protection March 20, 2019 Patrick McDonnell, Secretary 1 Energy Programs
ENERGY STRATEGY FOR YUKON. Independent Power Production Policy
 ENERGY STRATEGY FOR YUKON Independent Power Production Policy May 20, 2014 Page 2 of 11 BACKGROUND The Government of Yukon released the Energy Strategy for Yukon in January 2009. The strategy sets out
Southern California Edison s Preferred Resources Pilot (PRP) Solar Siting Survey. Summary Document
 Solar Siting Survey. Summary Document") Southern California Edison s Preferred Resources Pilot (PRP) Solar Siting Survey Summary Document Introduction The Southern California Edison (SCE) Preferred Resources Pilot (PRP) Solar Siting Survey,
Southern California Edison s Preferred Resources Pilot (PRP) Solar Siting Survey Summary Document Introduction The Southern California Edison (SCE) Preferred Resources Pilot (PRP) Solar Siting Survey,
US 81 Bypass of Chickasha Environmental Assessment Public Meeting
 US 81 Bypass of Chickasha Environmental Assessment Public Meeting March 14, 2013 Introductions ODOT FHWA SAIC Meeting Purpose Present need for bypass Provide responses to 10/04/11 public meeting comments
To Our Business Partners
 CSR CSR > Social Performance > To Our Business Partners To Our Business Partners We build relationships of trust by engaging in open communication, with mutual prosperity as our goal. To Our Dealers Basic
L. A. Metro s Parking Management Program Principles Applied. October 17, 2011 Rail-Volution, Washington D.C.
 Los Angeles County Metropolitan Transportation Authority L. A. Metro s Parking Management Program Principles Applied October 17, 2011 Rail-Volution, Washington D.C. What is Parking Management? Various
DRAFT Evaluation Scores. Transit
 DRAFT Evaluation s The criteria for evaluating applications for new funding commitments are used to measure how well they advance the six goals identified for the MTP. Through transportation: Reduce per
Public and Fleet Electric Vehicle Charging Infrastructure Strategy
 CoQuitlam For Council Our File: 11-5210-01/000/2018-1 Doc#: 3187569.V3 To: From: Subject: For: City Manager General Manager, Engineering and Public Works Public and Fleet Electric Vehicle Charging Infrastructure
Agenda. Industry Rate Trends Summary of Financial Targets Cost of Service Information. Valuation of Solar
 Agenda Industry Rate Trends Summary of Financial Targets Cost of Service Information Customer charges Residential Demand Charges Time of Use Rates Valuation of Solar Industry Trends Increasing demand charges
New Haven-Hartford-Springfield Rail Project Gateway to New England. Public Hearing June
 New Haven-Hartford-Springfield Rail Project Gateway to New England Public Hearing June 2012 1 New Haven-Hartford-Springfield Rail Corridor Glory Days: 1925-1955 22 trains/day in 1947 Bankers Ltd 3-hour
Table Existing Traffic Conditions for Arterial Segments along Construction Access Route. Daily
 5.8 TRAFFIC, ACCESS, AND CIRCULATION This section describes existing traffic conditions in the project area; summarizes applicable regulations; and analyzes the potential traffic, access, and circulation
MUNICIPAL CLASS EA PROCESS 1
 PHASE 1 PROBLEM OR OPPORTUNITY PHASE 2 PHASE 3 PHASE 4 PHASE 5 ALTERNATIVE SOLUTIONS ALTERNATIVE DESIGN CONCEPTS FOR PREFERRED SOLUTION ENVIRONMENTAL STUDY REPORT IMPLEMENTATION 1. Identify problem or
Electric Vehicle Cost-Benefit Analyses
 Electric Vehicle Cost-Benefit Analyses Results of plug-in electric vehicle modeling in eight US states Quick Take M.J. Bradley & Associates (MJB&A) evaluated the costs and States Evaluated benefits of
Purpose: General Provisions:
 10-19-1 Purpose: The purpose of off-street parking requirements is to promote traffic/pedestrian safety and efficiency and to minimize hard surfaced areas to reduce storm water run-off and visual impacts
actsheet Car-Sharing
 actsheet Car-Sharing This paper was prepared by: SOLUTIONS project This project was funded by the Seventh Framework Programme (FP7) of the European Commission Solutions project www.uemi.net The graphic
Mercer Island Center for the Arts Parking Management Plan
 Parking Stalls Mercer Island Center for the Arts Parking Management Plan June 15, 2016 This Parking Management Plan (P) covers all tenants at the Mercer Island Center for the Arts (MICA) campus, including
17.8 acres site 4.6 acres in floodplain & wetlands 3.5 acres of surface parking 9 acres of open space
 Peter Allen Associates, Inc. Nederveld, Inc. Ann Arbor/Grand Rapids Riverfront Village LLC 17.8 acres site 4.6 acres in floodplain & wetlands 3.5 acres of surface parking 9 acres of open space 17,000 Hospital
GTA West Corridor Planning and EA Study Stage 1
 GTA West Corridor Planning and EA Study Stage 1 Draft Development Strategy Presentation to Peel Goods Movement Task Force April 8 2011 Study Areas 2 Unique Approach Unprecedented two-stage EA process:
Brainstormed Solutions - Passenger
 1-1a Air / Exand: Expand capacity (runway lengths) at BG airport (LOW) find solution! 1-1b Air / fuel: Improve fuel availabilty and reduce cost (LOW) Sound Walls X X X Reduce scatter lighting - more focused
Electric Vehicle Adoption in the South African Context
 Electric Vehicle Adoption in the South African Context Policy, Pilot Projects and Awareness Creation Challenges and Opportunities Sustainability Week CSIR ICC Transport Seminar 7 June 2018 Context 1. Transport
Study Results Review For BPU EV Working Group January 21, 2018
 New Jersey EV Market Study Study Results Review For BPU EV Working Group January 21, 2018 Mark Warner Vice President Advanced Energy Solutions Gabel Associates Electric Vehicles: Why Now? 1914 Detroit
Subarea Study. Manning Avenue (CSAH 15) Corridor Management and Safety Improvement Project. Final Version 1. Washington County.
 Corridor Management and Safety Improvement Project. Final Version 1. Washington County.") Subarea Study Manning Avenue (CSAH 15) Corridor Management and Safety Improvement Project Final Version 1 Washington County June 12, 214 SRF No. 138141 Table of Contents Introduction... 1 Forecast Methodology
Subarea Study Manning Avenue (CSAH 15) Corridor Management and Safety Improvement Project Final Version 1 Washington County June 12, 214 SRF No. 138141 Table of Contents Introduction... 1 Forecast Methodology
TIMBERVINE TRANSPORTATION IMPACT STUDY FORT COLLINS, COLORADO JANUARY Prepared for:
 TIMBERVINE TRANSPORTATION IMPACT STUDY FORT COLLINS, COLORADO JANUARY 2014 Prepared for: Hartford Companies 1218 W. Ash Street Suite A Windsor, Co 80550 Prepared by: DELICH ASSOCIATES 2272 Glen Haven Drive
PEACHTREE CORRIDOR PARTNERSHIP. Current Status & Next Steps
 PEACHTREE CORRIDOR PARTNERSHIP Current Status & Next Steps PEACHTREE CORRIDOR PARTNERSHIP Why Peachtree? Why Now? I. THE CONTEXT High Level View of Phasing Discussion Potential Ridership Segment 3 Ease
2 MAJOR MACKENZIE DRIVE WEST JOG ELIMINATION AT HUNTINGTON ROAD CITY OF VAUGHAN
 2 MAJOR MACKENZIE DRIVE WEST JOG ELIMINATION AT HUNTINGTON ROAD CITY OF VAUGHAN The Transportation Services Committee recommends the adoption of the recommendations contained in the following report dated
Re: Amend Sections and File No ZA Marcus Lotson, Development Services Planner
 Page 1 To: From: The Planning Commission MPC Staff Date: April 5, 2016 Subject: Re: Amend Sections 8-3082 and 8-3090 Marcus Lotson, Development Services Planner Issue: Proposed amendments to the zoning
Community Advisory Committee. October 5, 2015
 Community Advisory Committee October 5, 2015 1 Today s Topics Hennepin County Community Works Update Project Ridership Estimates Technical Issue #4:Golden Valley Rd and Plymouth Ave Stations Technical
AN ECONOMIC AND ENVIRONMENTAL ASSESSMENT OF EASTERN CANADIAN CRUDE OIL IMPORTS
 Study No. 167 CANADIAN ENERGY RESEARCH INSTITUTE AN ECONOMIC AND ENVIRONMENTAL ASSESSMENT OF EASTERN CANADIAN CRUDE OIL IMPORTS Canadian Energy Research Institute Relevant Independent Objective An Economic
5 RAPID TRANSIT NETWORK PLAN PRINCIPLES, METROLINX BUSINESS CASE, AND ALTERNATIVE FINANCE AND PROCUREMENT ANALYSIS UPDATE
 5 RAPID TRANSIT NETWORK PLAN PRINCIPLES, METROLINX BUSINESS CASE, AND ALTERNATIVE FINANCE AND PROCUREMENT ANALYSIS UPDATE The Rapid Transit Public/Private Partnership Steering Committee recommends the