Welcome Welcome... 1
|
|
|
- Scott Russell
- 6 years ago
- Views:
Transcription

1 Welcome Welcome... 1

2 Presentation Structure Our presentation is split into three sections going through the market, operations and financials 2
3 3

4 As it has been indicated previously, it is now much clear that majority of the one off factors weakening the crack margins in 2016 are no longer relevant and we have seen healthier margins in the second quarter of Refinery maintenances, which had already started in the first quarter, proceeded in the second quarter. Along with these extended maintenances of some Russian and European Refineries till the mid of the second quarter, ongoing refinery problems and shutdown in Middle East tightened supply between April and May. On the other hand, especially with the effect of historical high fuel oil cracks, global capacity utilization rates increased significantly in the second half of Q2. Consequently, while the demand for crude oil was less than last year in the first half of Q2, the situation reversed in the second half when the refineries reached almost full capacity level. If we look into the demand side, second quarter was again considerably stronger than last year. In particular, the increase in diesel consumption was remarkable. For example, added with the strong demand in USA, while the diesel demand in India was weaker than expected in the first quarter of 2017 due to the monetarization effect, with the normalization of the economy, Indian middle distillate demand started to recover in Q2. Moreover, due to the continuing low price environment, the consumption in Europe in the first 5 months surpassed last year by about 5 %. The increase in European industrial activities was especially a supportive factor with respect to this improvement. Besides this better performance of diesel, 7 % increase in the revenue per passenger kms of airliners shows that the jet demand has also picked up. The economic crisis and infrastructure problems in Latin America started in 2016 have not been resolved so far, and this situation has now started affecting the performance of the refineries in that region. Consequently, lower domestic production coupled with restricted capacity utilizations forced them to import their petroleum product requirements. West Africa and North Africa also imported significant volumes of product from Europe due to new specification requirements. On the other hand, if we look into the crude oil prices, extra production coming from Libya, Nigeria and USA prevented the expected inventory drawbacks and thus continued to put pressure on prices. In Q2, especially the supply of light and sweet crudes increased dramatically with Libya production exceeding the expectations and Nigeria and USA increasing their productions by approximately 250 thousand barrel per day each. Since much of the extra production came from light crude oil types, white production yields increased globally, restricting the Fuel Oil production. Although demand for middle distillates was much better in Q2 and cracks improved accordingly, historical levels have not been reached yet mainly due to the high inventory levels. The political and economical events that effected the demand such as French presidential election, 4
5 Qatar crisis, FED interest rate hikes have also affected the FX rates and margins throughout Q2. 4

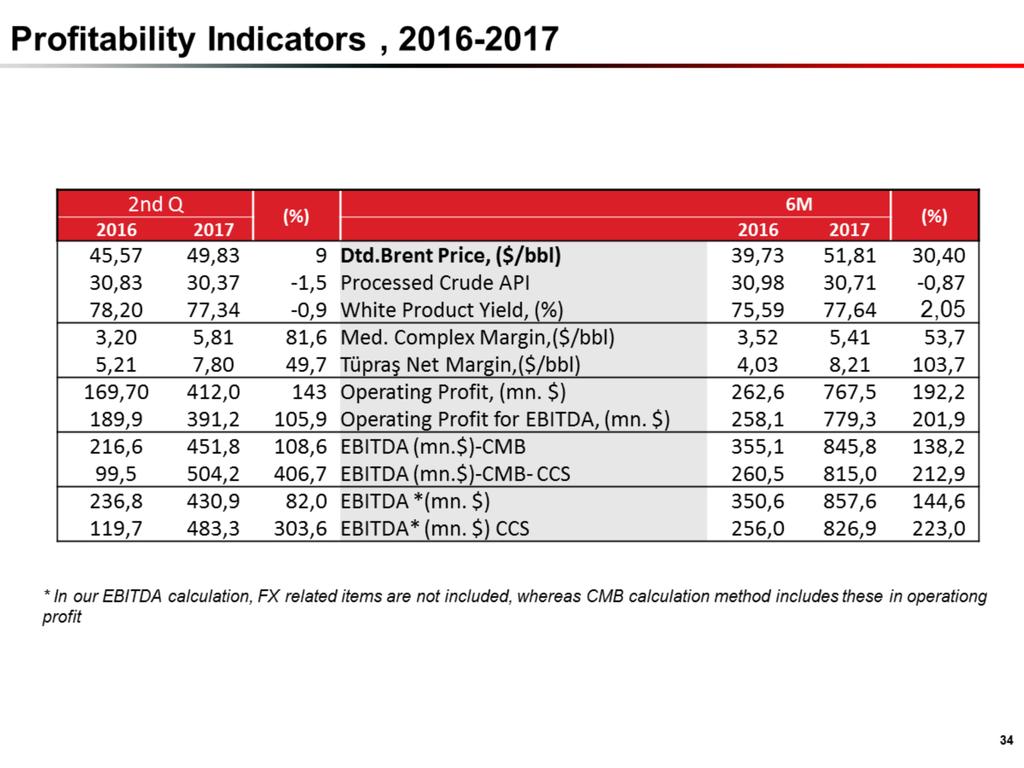
6 Tüpraş has surpassed two main targets namely the Net Refining Margin and full capacity in Q2. While the expectation for net refining margin was indicated to be $/bbl for 2017, higher crack spreads and full capacity utilization brought Tüpraş a net margin of 8.2 $/bbl in the first half. Thanks to the favorable market conditions and operational strength, capacity utilization reached to 116.5% as per nameplate capacities. In line with the operational performance and healthier cracks, Tüpraş increased its EBITDA by 1,8 times compared to 2016 Q2, generating 431 mil. dollars. 5

7 According to the available data from EMRA for the first 5 months of 2017, demand for the Turkish petroleum products continue to grow in line with the Turkish economy. Despite the stagnating effect of the referendum in April, ongoing infrastructure investments and seasonal increase in consumption during spring helped Turkish diesel demand grow by 5.4 % as of May 2017 and the consumption rose to 8.9 million tons in the first five months. After being affected by the harsh winter conditions at the beginning of the year, gasoline consumption increased as weather started warming up. Accordingly, starting March, growth in gasoline demand reached back to its normals and the Turkish gasoline market grew by 2,1 % in With the help of summer, tourism is getting better and Jet Fuel consumption is in the verge of normalization. Considering especially the base effect of 2016, Jet demand is expected to increase after July. However due to the harsh weather conditions and geopolitical concerns in the first five months, the available data still shows a decline of 7,5% yoy in the first five months of The decline trend in Fuel Oil demand has been supported by the high prices and the consumption in the first five months decreased by 18,3% 6

8 Along with the increase in bitumen demand, heavy crude demand increased in Q2. Ural differentials started to narrow. As it can be seen from the historic numbers, such a trend is in line with the seasonality effect. However relatively high heavy-brent differentials are still continuing to support the complex refineries like Tüpraş. Although still being comfortably within the historic averages, Ural spread showed a narrowing pattern in Q2, the first time in the last 1,5 years. Stronger than usual Fuel Oil crack margins, bitumen demand and decrease in heavy barrel s supply narrowed the Ural differentials to -0,96 $/bbl in June. Iranian and Iraqi heavy crude production have not been affected by the OPEC cuts: However, since some of the production cuts in other OPEC countries are diverted to heavier barrels, a small rebound was visible in heavy crude differentials. On the other hand, change in main crudes processed in Tupras was minimal and the average differentials of Tüpraş were around 5,0 USD/bbl. The crude diet of Tüpraş is determined via a through optimization process and our refineries geographical advantageous position enables us to make the optimum selection out of two thirds of the world s proven oil reserves, helping Tüpraş to reach the most profitable crudes available in the market at any given time. 7
9 Normalization trend in the middle distillate crack margins started in Q1 continued and the profitability of both diesel and Jet Fuel improved slightly in Q2. Gasoline continued to be strong in Q2 in line with the increase in tourism. Average cracks were realized as 14,3 dollar/bbl. However Fuel Oil was the main story of the second quarter with a remarkable 2 dollars increase in the crack margin which rose up to -7,0 dollar per barrel levels. This strength in the Fuel Oil cracks was mainly due to the decline in Russian Fuel Oil cargoes and lower production globally as refineries processed lighter crudes. 8
10 9

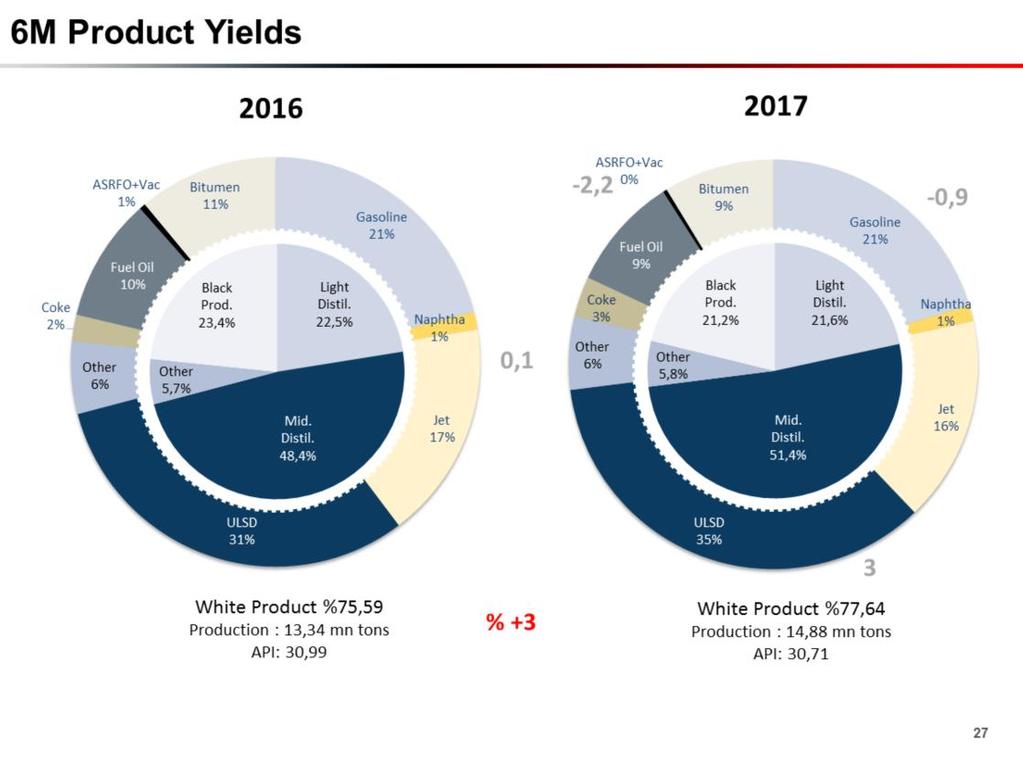
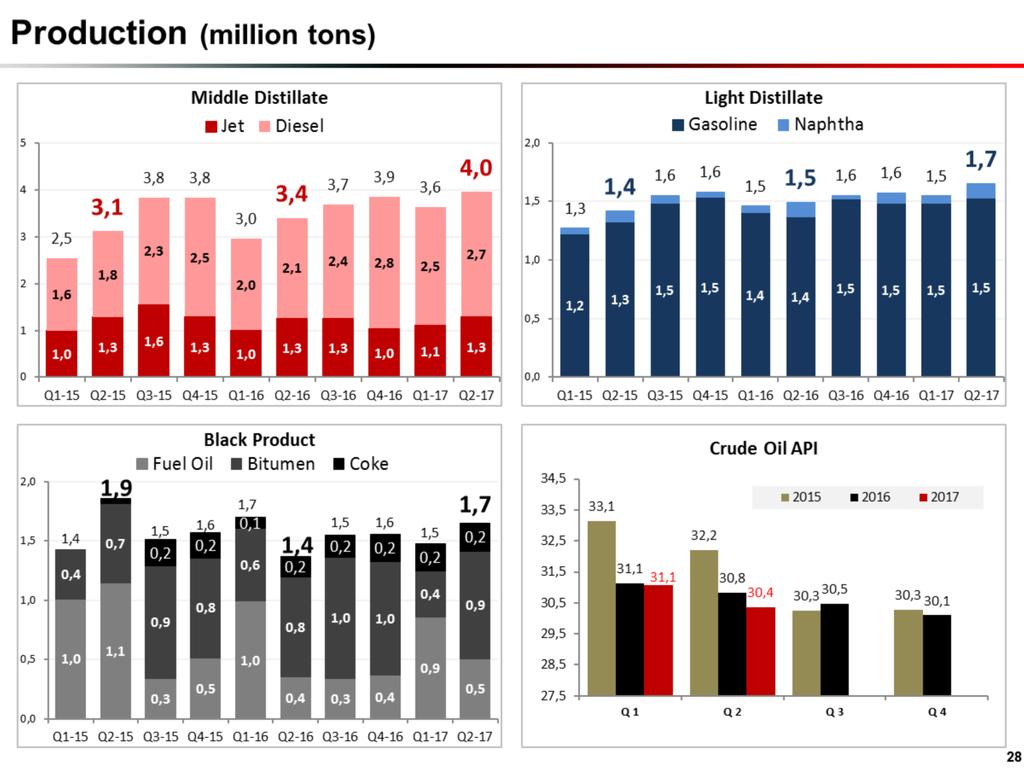
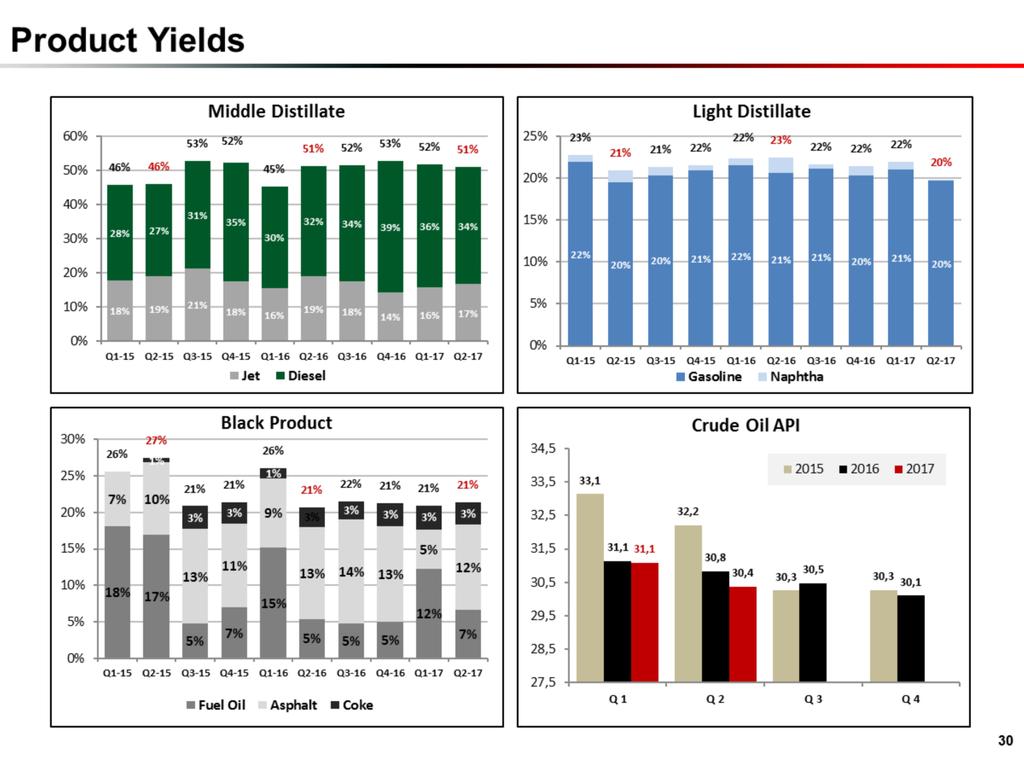
11 High F. Oil and light distillate cracks along with healthy Turkish demand and the positive effect of RUP led the refineries to process more crudes in Q2, boosting the capacity utilizations. Therefore, we managed to increase the amount of crude processed by 12,1%, yoy and reached up to 108,9 % crude oil capacity utilization. If feedstock processing is taken into consideration, our capacity utilization increased even up to 116,5%,, exceeding full capacity utilization target. As a result, highest production in the history of Tüpraş was achieved with 7,8 million tons, capitalizing on gasoline and fuel oil cracks. 10

12 Favorable market conditions and with strong demand in Turkey total sales of Tüpraş increased by 5%, reaching to 8,1 million tons. Domestic diesel, bitumen and gasoline sales were higher than last year. However, due to the reasons explained in the Turkish market slide, Jet Fuel sales declined in Q2. Moreover, since the crack margins helped us with excess production, our exports in Q2 were again higher than last year, reaching to 1,4 million tons. All in all, in the first half of the year Tüpraş increased its domestic sales by 1% and exports by 19%. 11

13 Opet Opet continues to be the 2nd largest fuel-oil distribution company in Turkey, with 18.1% market share in white products. As of June 30th 2017, the number of stations under OPET & SUNPET brands was stations. 12
14 13

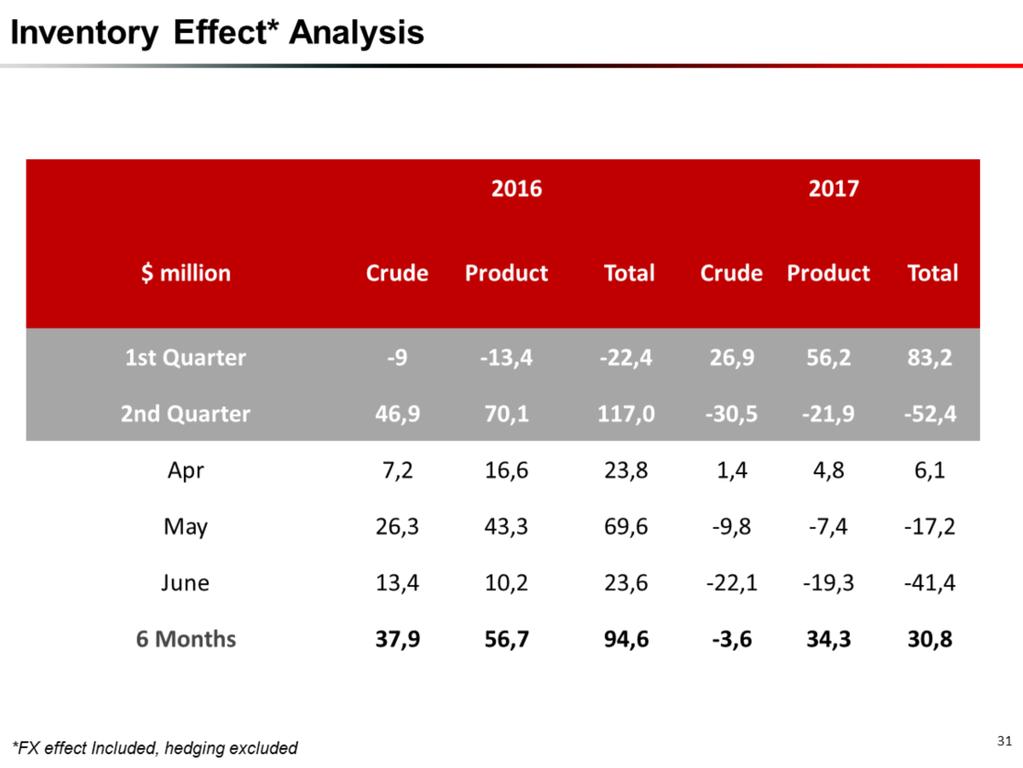
15 Despite the narrowing of heavy crude differentials, with the help of middle distillates and especially Fuel Oil cracks, in Q2, we have seen an improvement of 2,6 $/bbl in the Med margins reaching to 5,8 dollars per barrel level. Extra production because of RUP enabled us to enjoy high differentials of heavy crudes, improved middle distillate cracks and increased bitumen sales and affected Tüpraş Net margin positively. Consequently, Tüpraş average net margins both in Q2 and H1 outperformed in 2017 with 7,8 $/bbl and 8,2 $/bbl, respectively. While the inventory effect was 0,52 $/bbl negative in Q2 if we take the positive effect of Q1 into consideration, Tüpraş Clean Gross margin of 12,71 $/bbl in H1 was in line with its gross margin generating Clean Net margin of 8,24 $/bbl, 2,8 $/bbl higher than Med margin. 14

16 As explained in our previous telcon and investor meetings, the product cracks specifically middle distillates have the most important impact on our financial performance. Additionally, since the pricing mechanism of bitumen is linked to the Fuel Oil prices, Tüpraş has also benefitted from the unusually high Fuel Oil cracks. Given strong refining environment total crack margin of Q2 was 2,36 $/bbl higher than the same quarter of 2016, reaching to 5,67 $/bbl and the total impact of positive Med FOB Prices on Tüpraş Operations was million TL 15
17 Improvements in both the market conditions and the operational parameters supported the second quarter results. On the other hand especially the depreciation in TL resulted in a significant increase in the figures. While the net sales improved by 50% in Q2 over the last year, gross profit is more than doubled reaching to 1,6 billion TL. In Q2, 13 % increase in our operating expenses was in line with the 13 % increase in the crude oil processed. Therefore, if we take the inflation into consideration, there was even a decline in operating expenses in real terms. Consequently EBITDA more than doubled reaching to approx. 1,6 billion TL, and operating profit tripled reaching approx. 1,5 billion TL where net profit of 2017 Q2 was approx.1,5 million TL. 16

18 Since there was considerable FX rate changes at the beginning of 2017, the analysis of income statement in USD is a better indicator of Tüpraş s financial and operational results. Compared with 2016 Q2, in 2017 Q2 our Net Sales increased by 21% in dollar terms and the gross profit nearly doubled reaching to 446 million dollars. Although the amount of Crude oil processed has increased by nearly 13%, our operating expenses increased by only 9%, impacting our profitability positively. Consequently, operating profit in 2017 Q2 increased by 143% and with the addition of the effects from financial items, our Net profit in the second quarter of 2017 was 405 million dollars, a 257% increase over second quarter of last year. 17

19 Given the improvements in cracks and better operational performance Tüpraş generated 431 mil. dollars of EBITDA in Q2 which is in line with the first quarter. With relatively stable FX rates and successful financial risk management and working capital management, net income was 405 million dollars, in line with EBITDA. Although the turnover improved significantly with increasing sales and the inventory values and volumes have increased with seasonality, our Net Debt position in Q2 was 1,680 billion dollars with an improvement of 711 million dollars yoy. As a result we reached to the highest return on equity of 0,55 in 2017 Q2. 18

20 The company continues to be liquid. With RUP related and other credit loan installments there has been a decrease in the financial loans amounting around 250 million dollars and some portion of the long term loans related with 700 million dollar Eurobond are transferred to short term accounts. Although the payable days is in line with Q1, since the crude oil prices declined around 5 $/bbl and our discounted heavy crude oil purchases increased in Q2, payable amount is now 400 million dollars less than Q1. Although the product prices have also declined parallel to the crude oil prices, since the sales amount has increased in Q2, receivable amount slightly increased. Factoring operations are at the same level with Q1 but the credit payments mentioned above and the inventory increases for being prepared for the high season reduced the cash 19
21 amount. 19

22 When we look into the details of balance sheet difference yoy; Parallel to the sales volume receivables increased. Additionally with the effect of the high season and crude oil procurement terms, inventory values and volumes have increased. We can see the effect of the transition of Eurobond from Long term loans to short term loans. 20

23 FX Risk Exposure As you have already known, we successfully manage our FX risk exposure. Therefore the discipline is continuing and as of June 30th, 2017 our foreign exchange exposure stood at 34 million dollars long, within the limits of our FX risk parameters. 21

24 As you can see we are comfortably meeting all of the targets set at the beginning of the year. 22

25 We have revised our crude oil price estimations. Additionally the strong performance of the crack margins and recent upsets in some refineries made us revise our net margin outlook as dollars per barrel. All the other expectations are still the same with the ones set at the beginning of the year. 23
26 24
27 25
28 26
29 27
30 28
31 29
32 30
33 31
34 32
35 33
36 34
37 35
Q Analyst Teleconference. 9 August 2018
 9 August 218 Disclaimer This presentation contains forward-looking statements that reflect the Company management s current views with respect to certain future events. Although it is believed that the
RESULTS FOR Q ANALYST TELECONFERENCE
 RESULTS FOR Q4 216 ANALYST TELECONFERENCE Market 1 2 Operation Financials 3 Market 1 216 Fourth Quarter Market Conditions Product Market Crude Oil Postponed Maintenances Started to take place High Agricultural
I remind you that our presentation is available on our website. We can start from the first 2 slides that show Piaggio Group First
 CONFERENCE CALL 2009 1 st HALF RESULTS Good afternoon and welcome to everybody. I remind you that our presentation is available on our website. We can start from the first 2 slides that show Piaggio Group
Continued strong performance in key businesses
 Continued strong performance in key businesses SECOND QUARTER PRELIMINARY RESULTS August 9, Disclaimer "This presentation and the associated slides and discussion contain forward-looking statements. These
INVESTOR PRESENTATION
 INVESTOR PRESENTATION CONTENTS 1 REFINING INDUSTRY 2 COMPANY OVERVIEW 3 KEY FINANCIALS 4 INVESTMENTS 1 Refining Industry Brent Crude Oil Prices ($/bbl) 55 5 PROS OPEC & Non OPEC Supply Cut Healthy PMI
INVESTOR PRESENTATION
 INVESTOR PRESENTATION 1 CONTENTS 1 REFINING INDUSTRY 2 COMPANY OVERVIEW 3 KEY FINANCIALS 4 INVESTMENTS 2 1 REFINING INDUSTRY 3 4 Brent Crude Oil Prices ($/bbl) 55 5 PROS OPEC & Non OPEC Supply Cut Healthy
3Q 2016 Analyst Presentation
 3Q 2016 Analyst Presentation November 18, 2016 This presentation includes forward-looking statements. Actual future conditions (including economic conditions, energy demand, and energy supply) could differ
Third quarter results Matti Lievonen, President & CEO 26 October 2017
 Third quarter results 2017 Matti Lievonen, President & CEO 26 October 2017 Agenda 1. Q3/17 Group financials 2. January-September 2017 review 3. Q3/17 Segment reviews 4. Current topics 5. Appendix 2 Disclaimer
GOOD OPERATIONAL RESULTS IN H1 2011
 GOOD OPERATIONAL RESULTS IN H1 2011 Rompetrol Rafinare S.A. (symbols, Bucharest Stock Exchange: RRC, Reuters: ROMP.BX, Bloomberg: RRC RO) has released today its Second Quarter and First Semester 2011 financial
Fuel Focus. Understanding Gasoline Markets in Canada and Economic Drivers Influencing Prices. Issue 20, Volume 8
 Fuel Focus Understanding Gasoline Markets in Canada and Economic Drivers Influencing Prices Issue 20, Volume 8 October 18, 2013 Copies of this publication may be obtained free of charge from: Natural Resources
Q3 and Q1-Q3Q preliminary results
 MOL Hungarian Oil and Gas Company Q3 and Q1-Q3Q3 2005 preliminary results November 11,, 2005 Disclaimer "This presentation and the associated slides and discussion contain forward-looking statements. These
Q Matti Lievonen President and CEO
 Q1 2018 Matti Lievonen President and CEO CONTENTS 1. Q1 2018 review 2. Group financials 3. Segment reviews 4. Current topics 5. Appendix 2 Disclaimer The following information contains, or may be deemed
BAZAN Group Oil Refineries Ltd. First Quarter 2014 Results. May 2014
 BAZAN Group Oil Refineries Ltd. First Quarter 2014 Results May 2014 1 Disclaimer This presentation has been prepared by Oil Refineries Ltd. (the "Company") as a general presentation of the Company and
Financial Statements Matti Lievonen, President & CEO 7 February 2017
 Financial Statements 2016 Matti Lievonen, President & CEO Agenda 1 2 3 4 Year 2016 Financials 2016 Segment reviews Current topics 5 Appendix 2 Disclaimer The following information contains, or may be deemed
FISCAL YEAR MARCH 2014 FINANCIAL RESULTS
 FISCAL YEAR MARCH 214 FINANCIAL RESULTS Mazda CX-5 Mazda Atenza Mazda Motor Corporation April 25, 214 New Mazda Axela 1 PRESENTATION OUTLINE Highlights Fiscal Year March 214 Results Fiscal Year March 215
Positive and increasing results in 2016
 Positive and increasing results in 2016 Rompetrol Rafinare S.A. (symbols, Bucharest Stock Exchange: RRC, Reuters: ROMP.BX, Bloomberg: RRC RO) has released today its fourth quarter 2016 and 2016 financial
Focus on Refinery Product Flows
 December 14, 2016 Focus on Refinery Product Flows Stratas Advisors Gasoline Imports in 2014 CIS and the Middle East are the largest gasoline exporters to Asia. While China and India do not import gasoline
2015 Interim Results Announcement
 China Petroleum & Chemical Corporation 2015 Interim Results Announcement August 27, 2015 Hong Kong Cautionary Statement This presentation and the presentation materials distributed herein include forward-looking
Performing In A Volatile Oil Market
 Performing In A Volatile Oil Market Matti Lehmus Executive Vice President, Oil Products Capital Markets Day Key Trends Impacting Refining Margins Demand growth to resume after steep drop Supply growth
Earnings conference call. Q4 and Full year 2015
 Earnings conference call Q4 and Full year 2015 Bo Annvik, CEO / Åke Bengtsson, CFO 11 February 2016 1 Agenda Business Highlights Market Update Sales Financials Outlook 2 2015 in numbers Operating margin
third QUARTER 2012 October 26, 2012
 third QUARTER 212 October 26, 212 Helena norrman Senior Vice President Communications third QUARTER 212 October 26, 212 This presentation contains forward-looking statements. Such statements are based
TOFAŞ Q ANALYST PRESENTATION
 TOFAŞ Q1 2016 ANALYST PRESENTATION 03.05.2016 1 2016 Q1 AGENDA Highlights Turkish Automotive Industry Production & Capacity Utilization Domestic Market Developments Tofaş Domestic Market Performance Export
RESULTS OF THE FIRST QUARTER OF 2012 AND OUTLOOK. 15 May 2012
 RESULTS OF THE FIRST QUARTER OF 212 AND OUTLOOK 15 May 212 DISCLAIMER "This presentation and the associated slides and discussion contain forward-looking statements. These statements are naturally subject
Earnings conference call Q3 2016
 Earnings conference call Q3 2016 Bo Annvik, CEO / Åke Bengtsson, CFO October 25, 2016 1 Agenda Business Highlights Market Update Sales Financials Outlook Public offer 2 Business Highlights Q3 2016 Solid
FISCAL YEAR MARCH 2014 FIRST HALF FINANCIAL RESULTS. New Mazda Axela (Overseas name: New Mazda3)
") FISCAL YEAR MARCH 2014 FIRST HALF FINANCIAL RESULTS New Mazda Axela (Overseas name: New Mazda3) Mazda Motor Corporation October 31, 2013 1 PRESENTATION OUTLINE Highlights Fiscal Year March 2014 First Half
FISCAL YEAR MARCH 2014 FIRST HALF FINANCIAL RESULTS New Mazda Axela (Overseas name: New Mazda3) Mazda Motor Corporation October 31, 2013 1 PRESENTATION OUTLINE Highlights Fiscal Year March 2014 First Half
FISCAL YEAR MARCH 2015 FIRST QUARTER FINANCIAL RESULTS. Mazda Roadster 25 th Anniversary Model
 FISCAL YEAR MARCH 2015 FIRST QUARTER FINANCIAL RESULTS Mazda Roadster 25 th Anniversary Model Mazda Motor Corporation July 31, 2014 1 PRESENTATION OUTLINE Highlights Fiscal Year March 2015 First Quarter
Monthly bulletin. November Monthly bulletin VDMA. Economic and Statistic Affairs
 November 2017 Economic and Statistic Affairs Incoming orders in Germany Mechanical engineering Volume index 2015 = 100 140 130 120 110 100 90 80 70 60 Domestic Foreign 2008 2009 2010 2011 2012 2013 2014
Cosmo Oil Co., Ltd. Presentation on Results for First Quarter of Fiscal 2012 August 2, 2012 Director: Satoshi Miyamoto
 Cosmo Oil Co., Ltd. Presentation on Results for First Quarter of Fiscal 2012 August 2, 2012 Director: Satoshi Miyamoto Copyright 2012 COSMO OIL CO.,LTD. All Rights Reserved. Key Points of Financial Results
DOWNSTREAM PETROLEUM 2017 DOWNSTREAM PETROLEUM
 DOWNSTREAM PETROLEUM International and Asian Refining The global refining industry is fundamentally changing as emerging and maturing trends re-shape the global supply and demand patterns for crude oil
The Changing Face of Global Refining
 The Changing Face of Global Refining OPIS National Supply Summit Las Vegas, Nevada October 24-26, 2010 John B. O Brien, Executive Chairman Baker & O Brien, Inc. All rights reserved. The Changing Face of
Hindalco. Investor Presentation Q3 FY17 February 13, 2017
 Hindalco Investor Presentation Q3 FY17 February 13, 2017 Forward Looking & Cautionary Statement Certain statements in this report may be forward looking statements within the meaning of applicable securities
Earnings conference call Q4 & FY 2016
 Earnings conference call Q4 & FY 2016 Bo Annvik, CEO / Åke Bengtsson, CFO February 10, 2016 1 Agenda Business Highlights Market Update Sales Financials Way forward 2 Business Summary FY 2016 A year with
Presentation to Investors Q results ROYAL DSM HEALTH NUTRITION MATERIALS
 Presentation to Investors Q3 2016 results ROYAL DSM HEALTH NUTRITION MATERIALS Safe harbor statement This presentation may contain forward-looking statements with respect to DSM s future (financial) performance
Business Opportunities downstream. Hellenic Petroleum s perspective
 Business Opportunities downstream Hellenic Petroleum s perspective 9 th SE Europe Energy Dialogue Thessaloniki, Greece 29-30 June 2016 Daniil Antonopoulos Thessaloniki Refinery Operations Manager Hellenic
282m 75% +575m. Net sales Operating income before non-recurring items. Operating margin before non-recurring items. Net Loss.
 First-Half 2009 Financial Highlights Net sales Operating income before non-recurring items Operating margin before non-recurring items Net Loss Net debt-to-equity ratio Free cash flow** 7,134m 282m 4.0%
AN ECONOMIC ASSESSMENT OF THE INTERNATIONAL MARITIME ORGANIZATION SULPHUR REGULATIONS
 Study No. 175 CANADIAN ENERGY RESEARCH INSTITUTE AN ECONOMIC ASSESSMENT OF THE INTERNATIONAL MARITIME ORGANIZATION SULPHUR REGULATIONS ON MARKETS FOR CANADIAN CRUDE OIL Canadian Energy Research Institute
FISCAL YEAR MARCH 2015 FIRST HALF FINANCIAL RESULTS. New Mazda Demio
 FISCAL YEAR MARCH 2015 FIRST HALF FINANCIAL RESULTS New Mazda Demio Mazda Motor Corporation October 31, 2014 1 PRESENTATION OUTLINE Highlights Fiscal Year March 2015 First Half Results Fiscal Year March
Kongsberg Automotive ASA. Third quarter November 7, 2018
 Kongsberg Automotive ASA Third quarter - November 7, Q3 Highlights Continued improvements in turbulent times Revenues increased YoY by MEUR 18.3 (~8%) to MEUR 259 including negative FX effects of MEUR
April Título da apresentação DD.MM.AAAA
 Aquisition of Shell Argentina downstream assets April 2018 Título da apresentação DD.MM.AAAA DISCLAIMER This presentation contains estimates and forward-looking statements regarding our strategy and opportunities
Stronger Fundamental and Excellent Growth
 Investor Bulletin, First Half 2004 Stronger Fundamental and Excellent Growth For the first six months of 2004, PT United Tractors Tbk (UT/Company) recorded consolidated net revenue of IDR 4.29 trillion,
Sinopec Corp. Q Results Announcement. 29 October 2010
 Sinopec Corp. Q3 2010 Results Announcement 29 October 2010 Disclaimer i As required by the CSRC, financial statements of the third quarter of Sinopec Corp. (the Company ) were prepared under PRC Accounting
Valvoline Fourth-Quarter Fiscal 2016 Earnings Conference Call. November 9, 2016
 Valvoline Fourth-Quarter Fiscal 2016 Earnings Conference Call November 9, 2016 Forward-Looking Statements This presentation contains forward-looking statements within the meaning of Section 27A of the
ASPHALT SUPPLY IN A VOLATILE OIL WORLD. Bill Haverland ConocoPhillips Company
 ASPHALT SUPPLY IN A VOLATILE OIL WORLD Bill Haverland ConocoPhillips Company Issues to be Discussed Crude Oil Supply Crude Oil Pricing Refining Capacity Products Supply Products Pricing Future of the Industry
Fuel Focus. Understanding Gasoline Markets in Canada and Economic Drivers Influencing Prices. Issue 24, Volume 8
 Fuel Focus Understanding Gasoline Markets in Canada and Economic Drivers Influencing Prices Issue 24, Volume 8 December, Copies of this publication may be obtained free of charge from: Natural Resources
FISCAL YEAR MARCH 2018 FIRST HALF FINANCIAL RESULTS
 FISCAL YEAR MARCH 2018 FIRST HALF FINANCIAL RESULTS PRESENTATION OUTLINE Highlights Fiscal Year March 2018 First Half Results Fiscal Year March 2018 Full Year Forecast Progress of Key Initiatives/ Business
9M 2003 Financial Results (US GAAP)
") 9M Financial Results (US GAAP) January 2004 LUKOIL Group Crude Oil Production* mln tonnes 82 80 78 76 74 72 70 68 66 64 Crude oil production 3.2 5.5 3.9 76.8 70.3 71.3 2001 Production by subsidiaries Share
9M Financial Results (US GAAP) January 2004 LUKOIL Group Crude Oil Production* mln tonnes 82 80 78 76 74 72 70 68 66 64 Crude oil production 3.2 5.5 3.9 76.8 70.3 71.3 2001 Production by subsidiaries Share
2010 Interim Results Presentation. August 23, 2010 Hong Kong
 Sinopec Corp. 21 Interim Results Presentation August 23, 21 Hong Kong Disclaimer i This presentation and the presentation materials distributed herein include forwardlooking statements. All statements,
FISCAL YEAR MARCH 2015 THIRD QUARTER FINANCIAL RESULTS. Updated Mazda CX-5 (Japanese specification model)
") FISCAL YEAR MARCH 2015 THIRD QUARTER FINANCIAL RESULTS Updated Mazda CX-5 (Japanese specification model) Mazda Motor Corporation February 4, 2015 1 PRESENTATION OUTLINE Highlights Fiscal Year March 2015
FISCAL YEAR MARCH 2015 THIRD QUARTER FINANCIAL RESULTS Updated Mazda CX-5 (Japanese specification model) Mazda Motor Corporation February 4, 2015 1 PRESENTATION OUTLINE Highlights Fiscal Year March 2015
Russia's downstream: Old Problems and New Reality
 Russia's downstream: Old Problems and New Reality The CIS Downstream Summit Yakov Ruderman Director General Baku, Azerbaijan December 3, 215 Table of Contents Effects of low crude prices and tax reforms
ASPHALT SUPPLY IN A VOLATILE OIL WORLD. Bill Haverland ConocoPhillips Company
 ASPHALT SUPPLY IN A VOLATILE OIL WORLD Bill Haverland ConocoPhillips Company Issues to be Discussed Crude Oil Supply Crude Oil Pricing Refining Capacity Products Supply Products Pricing Future of the Industry
Recent Developments in EU Refining and in the Supply and Trade of Petroleum Products
 Recent Developments in EU Refining and in the Supply and Trade of Petroleum Products Second Meeting of the EU Refining Forum Brussels, 27 November 2013 Toril Bosoni, International Energy Agency OECD/IEA
Kongsberg Automotive ASA. Fourth quarter February 28, 2019
 Kongsberg Automotive ASA Fourth quarter - February 28, 2019 Highlights Q4 Sales Revenues grew by 21 (7.3%) YoY to 288 including negative FX effects of 1. We booked new business with 77 in expected annual
2010 1Q Investor Meeting. May 2010
 2010 1Q Investor Meeting May 2010 This presentation contains preliminary figures which may be materially different from the final figures. While the statements in this presentation represent our current
Roadshow Presentation
 Roadshow Presentation June 2, Wilfried Trepels, CFO 1 SAF-HOLLAND - Components Fifth Wheels Kingpins Suspensions Landing Gear Axle Systems 2 SAF-HOLLAND - Business Units Trailer Systems Powered Vehicle
1H 2003 Financial Results (US GAAP)
") 1H 2003 Financial Results (US GAAP) October 2003 Crude Oil Production Growth bpd 1.52 1.50 1.48 1.46 1.44 1.42 1.40 Jan- 03 Daily crude production Feb- 03 Mar- 03 Apr- 03 May- 03 Jun- 03 Crude oil production*
1H 2003 Financial Results (US GAAP) October 2003 Crude Oil Production Growth bpd 1.52 1.50 1.48 1.46 1.44 1.42 1.40 Jan- 03 Daily crude production Feb- 03 Mar- 03 Apr- 03 May- 03 Jun- 03 Crude oil production*
A perspective on the refining industry. Platts European Refining Summit Brussels, 29 September2016 Kristine Petrosyan, International Energy Agency
 A perspective on the refining industry Platts European Refining Summit Brussels, 29 September2016 Kristine Petrosyan, International Energy Agency OECD/IEA 2016 mb/d European refiners: busy 2015 OECD Europe
The Oil and Gas Sector
 Yuriy Bobylev The Oil and Gas Sector The world market in was characterized by the persistence of high global oil and natural gas prices. The average price of Russian Urals crude oil on the European market,
2Q06 Results. Investor Relations
 2Q06 Results Investor Relations Content 1. 2Q06 Key Results 2. Summarized Income Statement 3. Balance Sheet as of Jun. 2006 4. Outlook for 2006 5. Result & Outlook By Division Appendix : 2Q06 Results Breakdown
Volvo Group THIRD QUARTER 2015 JAN GURANDER. Volvo Group Headquarters Third quarter
 Volvo Group THIRD QUARTER 2015 JAN GURANDER 1 VOLVO GROUP Third quarter highlights NET SALES SEK bn 12 months 310 bn IMPROVED PROFITABILITY ON FLAT VOLUMES UNDERLYING OPERATING MARGIN 6.9% 67 73 OPERATING
Oil Refineries Ltd. Fourth Quarter and Full Year 2011 Results. March 2012
 Oil Refineries Ltd. Fourth Quarter and Full Year 21 Results March 22 1 Disclaimer This presentation has been prepared by Oil Refineries Ltd. (the "Company") as a general presentation of the Company and
NET SALES at September 30, 2014
 NET SALES at September 30, 2014 October 22, 2014 1 Net sales at September 30, 2014 October 22, 2014 Net sales of 14,558m in a still slowing global market The market slowdown observed since the second quarter
New York Energy Forum
 Presentation at the New York Energy Forum 30 June 2014 Antoine Halff The oil market at a junction Balances loosen up on paper but must be seen in perspective The unconventional supply revolution enters
OPEC PRIMARY ENERGY CONSUMPTION IN 2005 (1)
") CHAPTER 4 I n 1384, political tensions in the Middle East and some oil-producing countries, sabotage in Iraq s oil industry and speculation in the market raised oil prices incrementally. As of the beginning
CHAPTER 4 I n 1384, political tensions in the Middle East and some oil-producing countries, sabotage in Iraq s oil industry and speculation in the market raised oil prices incrementally. As of the beginning
H1 2018: Strong organic order growth and profitability increase
 Sulzer Management Ltd Neuwiesenstrasse 15 8401 Winterthur Switzerland Phone +41 52 262 30 00 Fax +41 52 262 31 00 In the first half of 2018, Sulzer s rebound continued. Order intake increased by 11.6%
TOFAŞ RESULTS WEBCAST PRESENTATION
 TOFAŞ 31.12.2017 RESULTS WEBCAST PRESENTATION 02.02.2018 AGENDA Highlights Turkish Automotive Industry Production Domestic Market Developments Tofaş Domestic Market Performance Export Markets & Tofaş Performance
PETROBRAS ARGENTINA S.A.
 PETROBRAS ARGENTINA S.A. Second Quarter 2015 Results Buenos Aires, July 30, 2015 Petrobras Argentina S.A. (Buenos Aires: PESA NYSE: PZE) announces the results for the second quarter ended June 30, 2015.
FISCAL YEAR MARCH 2018 FIRST QUARTER FINANCIAL RESULTS
 FISCAL YEAR MARCH 2018 FIRST QUARTER FINANCIAL RESULTS PRESENTATION OUTLINE Highlights Fiscal Year March 2018 First Quarter Results Fiscal Year March 2018 Full Year Forecast Structural Reform Stage 2 Progress
Third Quarter 2017 Performance and Business Update. October 26, 2017
 Third Quarter 2017 Performance and Business Update October 26, 2017 1 Important Notice Please read this management presentation together with the Company s press release issued earlier today announcing
Earnings conference call
 Earnings conference call Full year 2017 Åke Bengtsson, President & CEO Andreas Ekberg, Acting CFO February 14, 2018 1 Agenda Business Summary Market Update Sales Financials Way forward 2 Business Summary
Record CY 2016 EPS-diluted-adjusted of $6.12, an increase of $1.10 Y-O-Y. Q EPS-diluted-adjusted of $1.28, a decrease of $0.11 Y-O-Y.
 1 2 3 Q4 2016 global deliveries up 0.1 million units year-over-year (Y-O-Y), a 3.3% increase. Volume gains primarily in North America and China, offset by reductions in International Operations (excluding
2007 3Q Investor Meeting. November 2007
 2007 3Q Investor Meeting November 2007 Company Overview Cumulative 3Q 2007 Results Result By Division Appendix Company Overview Overview Doosan Infracore is the largest machinery company in Korea and also
Mazda Motor Corporation FISCAL YEAR MARCH 2016 FIRST HALF FINANCIAL RESULTS (Speech Outline)
") (For your information) November 5, 2015 Mazda Motor Corporation FISCAL YEAR MARCH 2016 FIRST HALF FINANCIAL RESULTS (Speech Outline) Representative Director Executive Vice President Akira Marumoto 1. HIGHLIGHTS
(For your information) November 5, 2015 Mazda Motor Corporation FISCAL YEAR MARCH 2016 FIRST HALF FINANCIAL RESULTS (Speech Outline) Representative Director Executive Vice President Akira Marumoto 1. HIGHLIGHTS
Abstract Process Economics Program Report 222 PETROLEUM INDUSTRY OUTLOOK (July 1999)
") Abstract Process Economics Program Report 222 PETROLEUM INDUSTRY OUTLOOK (July 1999) Global energy demand is rising, with fossil fuels oil, natural gas, and coal continuing to provide more than 90% of
Abstract Process Economics Program Report 222 PETROLEUM INDUSTRY OUTLOOK (July 1999) Global energy demand is rising, with fossil fuels oil, natural gas, and coal continuing to provide more than 90% of
Healthier Net Profit under Stronger IDR
 Investor Bulletin, First Half 2002 Healthier Net Profit under Stronger IDR As of June 2002, the consolidated revenue in USD increased by 32% y.o.y. Due to IDR strengthening against USD, in IDR revenue
Third Quarter Results (ended December 31, 2013)
") Fiscal Year 213 (ending March 31, 214) Third Quarter Results (ended December 31, 213) Brother Industries, Ltd. February 4, 214 Information on this report, other than historical facts, refers to future
Fiscal Year 213 (ending March 31, 214) Third Quarter Results (ended December 31, 213) Brother Industries, Ltd. February 4, 214 Information on this report, other than historical facts, refers to future
Fuel Focus. Understanding Gasoline Markets in Canada and Economic Drivers Influencing Prices. Volume 10, Issue 4
 Fuel Focus Understanding Gasoline Markets in Canada and Economic Drivers Influencing Prices Volume 1, Issue 4 March, Copies of this publication may be obtained free of charge from: Natural Resources Canada
FISCAL YEAR END MARCH 2013 FIRST HALF FINANCIAL RESULTS. New Mazda6 (Atenza)
") FISCAL YEAR END MARCH 2013 FIRST HALF FINANCIAL RESULTS New Mazda6 (Atenza) Mazda Motor Corporation October 31, 2012 1 PRESENTATION OUTLINE Highlights Fiscal Year March 2013 First Half Results Fiscal Year
FISCAL YEAR END MARCH 2013 FIRST HALF FINANCIAL RESULTS New Mazda6 (Atenza) Mazda Motor Corporation October 31, 2012 1 PRESENTATION OUTLINE Highlights Fiscal Year March 2013 First Half Results Fiscal Year
Jordan Petroleum Refinery Company Equity Report. Jordan Petroleum Refinery Company June June 14, 2009
 Jordan Petroleum Refinery Company Equity Report June 14, 2009 Serene Zawaydeh Head of Research Awraq Investments szawaydeh@awraq.com P a g e 1 Table of Contents Executive Summary... 1 Financial Highlights...
Management s Discussion and Analysis (MD&A) Thai Oil Public Company Limited and subsidiaries For the Second Quarter and the First Half of 2011
 Thai Oil Public Company Limited and subsidiaries For the Second Quarter and the First Half of 2011") Management s Discussion and Analysis (MD&A) Thai Oil Public Company Limited and subsidiaries For the Second Quarter and the First Half of 2011 1. Company and its subsidiaries Operating Results Table 1:
Management s Discussion and Analysis (MD&A) Thai Oil Public Company Limited and subsidiaries For the Second Quarter and the First Half of 2011 1. Company and its subsidiaries Operating Results Table 1:
Issues to be Discussed ASPHALT SUPPLY IN A VOLATILE OIL WORLD. Crude Oil Supply (2006) CRUDE OIL SUPPLY. Crude Oil Demand CRUDE OIL PRICING
 CRUDE OIL SUPPLY. Crude Oil Demand CRUDE OIL PRICING") 6 SEAUPG CONFERENCE - WILMINGN, NORTH CAROLINA Issues to be Discussed ASPHALT SUPPLY IN A VOLATILE OIL WORLD Bill Haverland ConocoPhillips Company Crude Oil Supply Crude Oil Pricing Refining Capacity Products
6 SEAUPG CONFERENCE - WILMINGN, NORTH CAROLINA Issues to be Discussed ASPHALT SUPPLY IN A VOLATILE OIL WORLD Bill Haverland ConocoPhillips Company Crude Oil Supply Crude Oil Pricing Refining Capacity Products
On track. Investor and Analyst Presentation On the Occasion of the Release of the Preliminary Figures for FY 2011 Hanover, 19 January 2012
 On track. Investor and Analyst Presentation On the Occasion of the Release of the Preliminary Figures for FY 2011 Agenda Delticom at a Glance Business Model Profit & Loss Balance Sheet Outlook 2 Agenda
European Energy Union Impact on the Refining & Petrochemical Business. John Cooper, Director General Budapest, 13th October 2015
 European Energy Union Impact on the Refining & Petrochemical Business John Cooper, Director General Budapest, 13th October 2015 FuelsEurope represents 42 Member Companies 100% of EU Refining Page 2 AGENDA
STATUS OF THE U.S. REFINING INDUSTRY
 STATUS OF THE U.S. REFINING INDUSTRY October 2005 BAKER & O BRIEN Incorporated, All Rights Reserved REFINING VITAL LINK IN THE OIL SUPPLY CHAIN Crude Oil Supply & Logistics Products Distribution & Marketing
Months Investor Presentation
 2018 9 Months Investor Presentation 25.10.2018 Disclaimer Ereğli Demir Çelik Fabrikaları T.A.Ş. (Erdemir) may, when necessary, make written or verbal announcements about forward-looking information, expectations,
FISCAL YEAR ENDING MARCH 2012 FIRST HALF FINANCIAL RESULTS
 FISCAL YEAR ENDING MARCH 2012 FIRST HALF FINANCIAL RESULTS Mazda Motor Corporation November 2, 2011 New Mazda CX-5 (European specifications) 1 PRESENTATION OUTLINE Highlights Fiscal Year Ending March 2012
Recent Developments in EU Refining and in the Supply and Trade of Petroleum Products
 Recent Developments in EU Refining and in the Supply and Trade of Petroleum Products Third Meeting of the EU Refining Forum Brussels, 22 May 2014 Toril Bosoni, International Energy Agency OECD/IEA 2014
FISCAL YEAR MARCH 2018 THIRD QUARTER FINANCIAL RESULTS
 FISCAL YEAR MARCH 2018 THIRD QUARTER FINANCIAL RESULTS PRESENTATION OUTLINE Highlights Fiscal Year March 2018 Nine Month Results Fiscal Year March 2018 Full Year Forecast Progress of Key Initiatives 1
ABB delivers strong order growth and cash in Q2
 ABB delivers strong order growth and cash in Orders up 13% 1 ; book-to-bill ratio of 1.04x 2 Group operational EBITDA 3 impacted by loss in Power Systems (PS) Decisive step change actions implemented in
Fiscal Year 2012: Year of record operational performance
 Ranshofen, March 1, 2013 Fiscal Year 2012: Year of record operational performance Year of record operational performance: - 327,800 tons of external shipments - 266,900 tons of scrap charged in Ranshofen
Analyst Presentation 1Q 2008 Results
 Analyst Presentation 1Q 2008 Results 0 Contents Section 1: Section 2: Section 3: Section 4: Section 5: Company Overview IPO Update Operating Performance Consolidated Financial Performance Dividend Update
Alfa Laval Slide 3.
 Report for Q1 2010 - Orders received and margins - Highlights - Development per segment -Geographical development - Financials - Outlook Mr. Lars Renström President and CEO Alfa Laval Group Key figures
Financial Summary for 2Q-FY2017 And Projections for FY2017
 Financial Summary for 2Q-FY2017 And Projections for FY2017 1 INDEX 01 Financial Summary for 2Q-FY2017 02 Performance Forecast for FY2017 03 Topics 2 01 Financial Summary for 2Q-FY2017 3 01 Financial Summary
Energy Outlook. U.S. Energy Information Administration. For EnerCom Dallas February 22, 2018 Dallas, TX
 Energy Outlook For EnerCom Dallas Dallas, TX Jeff Barron Industry Economist, U.S. Energy Information Administration U.S. Energy Information Administration Independent Statistics & Analysis www.eia.gov
Financial Results for First Quarter of FY2015
 Financial Results for First Quarter of FY2015 (From April 1, 2014 to June 30, 2014) July 29, 2014 Hino Motors, Ltd. 1. Sales Turnover 2/15 Global Unit Sales (Retail Sales) 3/15 Sales Sales decreased decreased
Nove b m er 21, Yun K Kan g Jessie i Y Yoh
 Energy for tomorrow November 21, 2008 Yun Kang Jessie Yoh Industry Overview Company Overview Thesis Analysis Risks Q & A AGENDA WHY CONOCO? Leader in refining process provides natural hedge against falling
A summary of national and global energy indicators. FEDERAL RESERVE BANK of KANSAS CITY
 THE U.S. Energy DATABOOK A summary of national and global energy indicators JULY 1, 17 FEDERAL RESERVE BANK of KANSAS CITY SUMMARY OF CURRENT ENERGY CONDITIONS The number of total active drilling rigs
Macroeconomic Assumptions
 Macroeconomic Assumptions A major factor affecting the global economy this year continues to be weakness in Chinese financial markets and the resulting fallout affecting trading partners dependent on the
B A K E R & O B R I E N
 B A K E R & O B R I E N I N C O R P O R A T E D Q3 : U. S. Refining Margins Remain Robust Special Topic: Domestic Light Oil Processing in the U.S. Gulf Coast Have We Hit the Limit? Houston, October 30,
KIRBY CORPORATION ANNOUNCES 2017 FIRST QUARTER RESULTS first quarter earnings per share of $0.51 compared with $0.71 in the 2016 first quarter
 KIRBY CORPORATION FOR IMMEDIATE RELEASE Contact: Brian Carey 713-435-1413 KIRBY CORPORATION ANNOUNCES 2017 FIRST QUARTER RESULTS 2017 first quarter earnings per share of $0.51 compared with $0.71 in the
1 st Half 2018 Results. August 1 st, 2018
 1 st Half 2018 Results August 1 st, 2018 H1 HIGHLIGHTS & CATEGORY SPOTLIGHTS Gonzalve BICH 2 First Half 2018 Key Messages Challenging market and business environment Continued investment in targeted Brand