Focused on oil and gas, power, and water. The Company 2013
|
|
|
- George Williams
- 5 years ago
- Views:
Transcription

1 Focused on oil and gas, power, and water The Company 2013


2 Who we are and how we are doing Sulzer is a global partner with reliable and sustainable solutions for performance-critical applications. We specialize in pumping solutions, rotating equipment maintenance and services as well as separation, reaction, and mixing technology. Combining engineering and application expertise, our innovative solutions add value and strengthen the competitive position of our customers. Sulzer is a leading provider in its key markets: oil and gas, power, and water. We serve clients worldwide through a network of over 150 locations. Our key markets Oil and gas Power Water
3 Highlights in Sales 1) CHF 3 264m (2012: CHF 3 341m) Operating income 1) CHF 264m (2012: CHF 329m) Net income 2) CHF 234m (2012: CHF 303m) Dividend CHF 3.20 (proposed) (2012: CHF 3.20) 1) From continuing operations. 2) Attributable to shareholders of Sulzer Ltd, includes the results from continuing and discontinued operations. In total, Sulzer (including Sulzer Metco) achieved an order intake and sales of CHF 4.0 billion and profitability of 9.2% of sales before and 8.7% after restructuring expenses For continuing operations (excluding Sulzer Metco), order intake was CHF 3.2 billion and sales were CHF 3.3 billion. Profitability was at 8.6% of sales before and 8.1% after restructuring expenses, impacted by low capacity utilization in the wastewater and the electromechanical businesses and the costs for operational measures The free cash flow was on a healthy level of CHF 219 million Sulzer initiated significant changes in 2013 with the goal of becoming one integrated and more customer-focused company Focusing on oil and gas, power, and water, and with an adapted operational structure, the company is geared for profitable growth For 2014, good activity levels for parts in the oil and gas industry are expected. Some recovery is anticipated for selected regions in the water market. Activities in the power and in the general industries are forecast to continue at similar levels Sulzer anticipates slight growth for order intake and sales in 2014 compared with Return on sales before restructuring is expected to improve slightly, supported by the measures taken in Depending on market developments and capacity utilization, restructuring measures will continue in 2014 The Board of Directors proposes an unchanged dividend of CHF 3.20

4 02 The company at a glance Focused on creating value and growing profitably Sulzer holds leading positions in its key markets: oil and gas, power, and water. The company is dedicated to creating long-term value and growing profitably. With its focused portfolio, Sulzer offers both performance-critical equipment and related services to its customers. Divisions 1) Sulzer Pumps Pump technology and solutions Profile We offer pumping solutions, related equipment, and services. Customers benefit from extensive research and development in fluid dynamics, process-oriented products, and reliable services. Our global manufacturing and service network ensures high customer proximity. Order intake CHF 2 031m (2012: CHF 2 094m) Sales CHF 2 051m (2012: CHF 2 098m) 63% of total sales Operating income Return on sales CHF 169m 8.2% (2012: CHF 191m) (2012: 9.1%) Market Leadership Oil and gas (upstream, midstream, and downstream) Water (production and transport, wastewater) Power 1) Structure as of December 31, 2013.


5 03 Sulzer Turbo Services Service solutions for rotating equipment Sulzer Chemtech Separation, mixing and service solutions We offer repair and maintenance services for turbomachinery, generators, and motors. Customers benefit from reliable and efficient repair and maintenance services for gas and steam turbines, compressors, motors, and generators of any brand. Our global network ensures high-quality local service. We offer products and services for separation, reaction, and mixing technology. Customers benefit from advanced solutions in the fields of process technology and separation equipment, as well as two-component mixing and dispensing systems. Our global footprint ensures local knowledge and competence. CHF 472m (2012: CHF 535m) CHF 750m (2012: CHF 705m) CHF 472m (2012: CHF 511m) 14% of total sales CHF 744m (2012: CHF 725m) 23% of total sales CHF 39m 8.3% CHF 81m 11.0% (2012: CHF 55m) (2012: 10.8%) (2012: CHF 71m) (2012: 9.8%) Industrial gas and steam turbines Turbocompressors Generators and motors Separation solutions Tower field services Two-component mixing and dispensing systems
6 04 The markets we serve A truly global presence to increase customer proximity A truly global presence with a strong footprint in emerging markets is vital for Sulzer s sustainable success. With over 150 production and service sites worldwide and more than 40% of sales in emerging markets, we are close to our customers and help them overcome their challenges. Sulzer s production and service network Sales by region 2013 Europe, Middle East, Africa 43% Americas 35% Asia-Pacific 22% Major production and service locations Market segments Oil and gas Power Water Other industrial markets Share of sales % 15% 13% 21% Sulzer Pumps Sulzer Turbo Services Sulzer Chemtech Greater than 10% of divisional sales. Less than 10% of divisional sales.


 Population, industrial growth and wealth development Global power capacity additions New regulatory frameworks and environmental standards Population and")
7 05 How we serve our key markets Market segment Oil and gas Sulzer helps cover the global demand for oil and gas and the respective derivatives. Our solutions benefit customers in the up-, mid-, and downstream segments. Power Sulzer helps satisfy the global demand for energy. Our solutions add value in fossil-fired, nuclear, and renewable power generation. Water Sulzer helps meet the global demand for clean water. Our solutions are essential for water transport and use, as well as wastewater treatment and desalination. Market drivers Global supply and demand of oil and gas Exploration and production investments Global refinery capacity, utilization, refining margins Growing need for pipelines, floating production, storage, and off-loading units (FPSOs) Population, industrial growth and wealth development Global power capacity additions New regulatory frameworks and environmental standards Population and economic growth Upgrades and modernizations of existing plants and new investments Our solutions Pump systems both onshore and offshore (including subsea) for the production and transportation of oil and liquefied natural gas Process components such as fractionation trays, structured and random packings, liquid and gas distributors, gas-liquid separators, and internals for separation columns Service of mechanical and electromechanical rotating equipment Tray and packing installation, welding services, tower maintenance and plant turnaround projects Polymerization technology for the production of PLA (polylactic acid) and EPS (expandable polystyrene) Pumps for fossil-fired and nuclear power plants as well as renewable power generation Advanced solutions for carbon capture and storage Repair and maintenance services for turbines, generators, and motors Pumps and related equipment (such as lifters, mixers, aerators, compressors, control and monitoring equipment, as well as services) Pumps for water transport and use Pumping solutions in wastewater treatment and desalination Service for electromechanical equipment, e.g. motors Our customers Oil and gas majors, national oil companies, refineries, and contractors. Also local customers Utility providers, contractors, end users and local customers Municipalities, contractors, and private water companies, customers in the agriculture
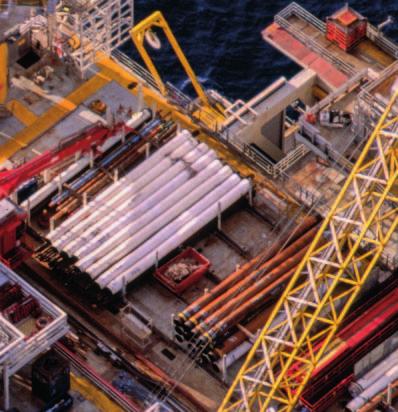
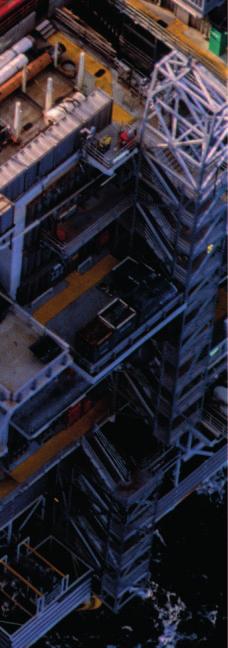
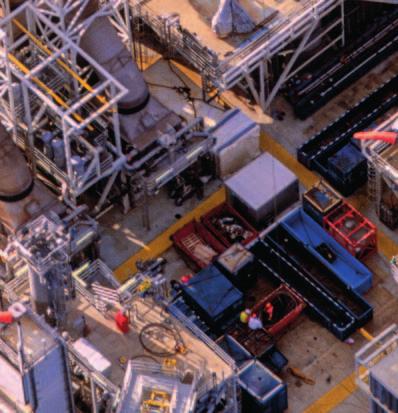
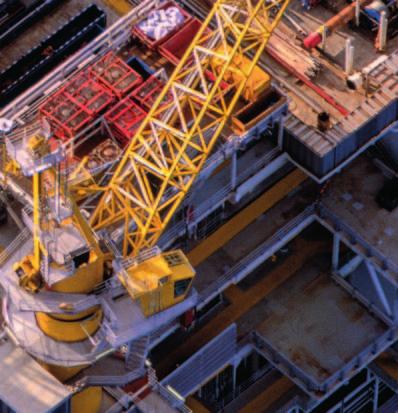
8 06 Focus Focused on oil and gas, power, and water Global megatrends influence our lives and our well-being. Population growth, urbanization, increasing energy demand, and scarcity of water create important development needs in Sulzer s three key markets oil and gas, power, and water. For Sulzer, this offers attractive growth potential.


9 07 Fueling the future Meeting power needs Processing water for life Oil and gas will remain essential for global growth in the near future. The industry faces a wide range of challenges and opportunities in the production, transport, and processing of oil and gas. Modern societies use large amounts of energy. The demand for energy efficiency and lower carbon dioxide emissions is steadily growing and requires improved solutions for the future. Water is our most precious natural resource. With growth in the emerging markets, the need for clean water is increasing quickly.


10 08 Focus Fueling the future Sulzer s solutions for the oil and gas market enable customers to prepare for the future. We provide services and solutions for onshore, offshore, and subsea oil production, for the transport of oil and gas in pipelines, and for the processing of crude oil and gas in refi neries.

11 09

12 10 Focus Meeting the power needs Sulzer ensures that its customers have energy-efficient and sustainable operations and helps satisfy the global demand for energy. We provide high-performance pumps for fossil-fired, nuclear, or renewable power generation, advanced solutions for carbon capture and storage, and maintenance and repair services for rotating equipment.

13 11


14 12 Focus Processing water for life The scarcity of water presents the opportunity for Sulzer to create new, more effi cient solutions. Sulzer s comprehensive product portfolio for the supply and treatment of water and for industrial and municipal wastewater collection supports the demand for clean water and constitutes sustainable business opportunities.


15 13

16 14 Letter to the shareholders Significant changes for better market orientation The year 2013 was a year of change for Sulzer. The company adapted its operational structure to better serve its three key markets oil and gas, power, and water. Order intake and sales reached levels close to those of 2012, while profitability decreased. Net income 1) CHF 234m (2012: CHF 303m) Dividend CHF 3.20 (proposed) (2012: CHF 3.20) 1) Attributable to shareholders of Sulzer Ltd, includes the results from continuing and discontinued operations. Dear shareholder Sulzer initiated significant changes in 2013 with the goal of becoming one integrated and more customer-focused company. The strategic decision to focus on three key markets and the adaptation of the company s operational structure provide the basis for profitable growth in the future. The adapted operational structure, effective since January 1, 2014, consists of the Pumps Equipment division comprising pumps and spares including an integrated Water business unit. The division Rotating Equipment Services integrates maintenance and repair services for turbines, compressors, generators, motors, and pumps. The Chemtech division remains unchanged, consisting of separation, mixing, and service solutions. As one integrated company, we can now offer one access point for customers and focus on value creation and profitable growth. Key markets offering attractive prospects With its new market strategy, Sulzer focuses on three key markets oil and gas, power, and water. This strategic step is based on our leading positions in these markets and global megatrends such as population growth, urbanization, increasing energy demand, and scarcity of water. Oil and gas remain essential for global economic growth. With our broad portfolio, we are well positioned to provide solutions for the upstream, midstream and downstream market segments. Sulzer s high-performance pumps are leading solutions for the production and transportation of oil. Our technologies enable efficient separation processes for liquids and gas. We provide reliable services for compressors, turbines, motors, and generators. Sulzer sees various growth opportunities in the oil and gas market: the floating production, storage and off-loading units (FPSOs) for oil sources in deep water far off the coastline; new pipelines driven by new oil sources; refineries and petrochemical markets driven by the shale gas boom in the US. Energy consumption is growing in modern societies. Sulzer helps satisfy this global demand across different markets, from fossil-fired and nuclear to renewable power. Main growth drivers are
17 15 Acting as one company in three key markets 1) Oil and gas Power Water 51% 15% 13% Equipment Services 1) Share of sales by market segment. The remaining 21% refers to the general industries. geographical expansion in the coal and gas sector and the development of solar power, wind and geothermal power generation. Water is our most precious natural resource and the need for clean water is increasing fast. Sulzer covers the whole water cycle from fresh water (production and transport) to wastewater (municipal and industrial) with a comprehensive pumps offering. Factors like population growth, water scarcity, and environmental protection drive market growth. Divestiture of Sulzer Metco As a consequence of a more focused key market strategy, a divestiture process was initiated to sell the Sulzer Metco division, which is mainly active in the transportation market. At the end of January 2014, Sulzer signed an agreement with Oerlikon for the divestment of its Sulzer Metco division. Sulzer Metco is reported as discontinued operations throughout this Annual Report. One focused and market-orientated company with adapted operational structure Sulzer wants to serve customers in its key markets as one focused company, achieving collaborative advantages and synergies across its businesses by leveraging its product portfolio, capabilities and expertise with its over 150 production and service sites all over the world. The company continues to build on its four strategic priorities: technology leadership, outstanding services, continuous operational improvements, and collaborative advantage. Together with the one company approach, we are even more orientated toward our customers and focused on value creation and profitable growth. This is supported by a new operational structure, effective since January 1, A leading supplier of services for rotating equipment The Rotating Equipment Services division is a combination of our Turbo Services businesses and the service activities for pumps (excluding spares). Integrating services for rotating equipment into one division creates a leading provider of services for rotating equipment from turbines and compressors to generators and motors as well as pumps. With a combined global service network of 100 locations in over 25 countries, Sulzer is Sulzer s operational structure in 2014 Pumps Equipment Pump technology and solutions 60% 1) employees 2) Rotating Equipment Services Repair and maintenance services for rotating equipment 20% 1) employees 2) Chemtech Separation, mixing and service solutions 20% 1) employees 2) 1) Share of sales, pro-forma estimate based on full-year figures ) Estimated number of full-time equivalents.
18 16 Letter to the shareholders Performance ) Sales CHF 3 264m (2012: CHF 3 341m) Return on sales 8.1% (2012: 9.8%) Return on capital employed 12.6% (2012: 14.7%) 1) From continuing operations. closer to its customers. We have the highest levels of competence and expertise as well as first-class engineering facilities. We can offer comprehensive solutions from emergency repair to long-term service agreements with one access point for customers. Sulzer will grow its service business by leveraging its expanded geographical footprint and combined sales force using cross-selling opportunities for rotating equipment. Furthermore, Sulzer will be able to actively bundle service offerings, for instance for combinations of pumps and connected motors. Pumps Equipment leverages global sales channels and manufacturing network The Pumps Equipment division comprises the new engineered pumps business and spares for the oil and gas and the power markets in three regional business units. Furthermore, an integrated Water business unit combines all products and services for water and wastewater. The engineered pumps business leverages the specific growth opportunities in the oil and gas and the power market as well as the global manufacturing network. Customer benefits are reliability in demanding applications, reduced energy consumption through high efficiency, and a global footprint supporting efficient manufacturing. With the formation of the new Water business unit, all of Sulzer s pumps activities in this huge market will be bundled in one organization. This will allow us to focus on the most attractive market segments, selling individual product ranges into other segments and using strong customer relationships to cross-sell complementary products and services. Chemtech with strong market positions With a distinctive, strong product portfolio based on separation and static mixing technologies, the Chemtech division remains well positioned in attractive markets worldwide. Further profitable growth will build on an innovation pipeline with strong growth potential, a global footprint to benefit from local market demand and to improve the cost base, and the successful integration of acquisitions. Integration of group functions Sulzer is also aligning its staff functions with its adapted strategy. The streamlining and integration of central group functions aims to realize synergies by sharing services and pooling expertise. This provides a regional leverage of functions and scalable setup for future growth. Moreover, collaborative advantages and synergies across the company can be better leveraged and enable the group functions to operate more efficiently and effectively. Building on strategic priorities and one company for profitable growth Technology leadership Outstanding services Continuous operational improvements one company Leverage existing capabilities and assets Customer orientation Profitable growth Efficient and effective group functions Collaborative advantage
19 17 Performance in 2013 Market activities in the oil and gas industry showed growth in some areas while the power market remained at low level. The water market decreased slightly with some signs of picking-up trends in the wastewater segment by the end of the year Demand in Asia-Pacific was strong, while Europe continued to be comparably weak. To mitigate the impact of lower sales, capacities were reduced in the wastewater pumps business and electromechanical services. Together with the integration of group functions this correlates with a reduction of over 300 full-time equivalents and restructuring expenses of almost CHF 17 million in For total Sulzer, including discontinued operations, order intake and sales reached CHF 4.0 billion (2012: CHF 4.0 billion). Return on sales was at 9.2% before and at 8.7% after restructuring charges (2012: ROSR: 10.3%; ROS: 10.2%). For continued operations, excluding Sulzer Metco, order intake decreased slightly compared with the previous year to CHF 3.2 billion in Sales also decreased slightly to CHF 3.3 billion. Return on sales was influenced by lower capacity utilization, especially for wastewater pumps and for electromechanical services, by the operational measures in the respective businesses, and by the integration of central group functions. It decreased to 8.6% of sales before and 8.1% after restructuring expenses. Profitability increased in the second part of 2013 compared with the first half year. Return on capital employed remained at a value creating level with 12.6%. Net income attributable to shareholders, as a result of the lower operating income, decreased to CHF 234 million, resulting in basic earnings per share of CHF Changes in the board and the management Manfred Wennemer was elected to the Board of Directors at the Annual General Meeting in March 2013 and was appointed as new Chairman, succeeding Jürgen Dormann, who followed internal age limitation rules. Manfred Wennemer resigned as per end of Vice Chairman Vladimir Kuznetsov acts as Chairman of the Board ad interim until the Annual General Meeting Scot Smith became Member of the Executive Committee and Division President of Sulzer Pumps in May, replacing Kim Jackson. In October, Urs Fankhauser had to step down due to serious illness, and Oliver Bailer was appointed Division President of Sulzer Chemtech and member of the Executive Committee. General Counsel Alfred Gerber left the company in April; his successor is not a member of the Executive Committee. Outlook for 2014 Based on present knowledge and excluding major changes in the general economic conditions, good activity levels for parts of the oil and gas industry are expected, in particular in the Americas. Based on positive developments in selected regions, especially the Americas and China, some recovery is expected for the water market. Activities in the power and in the general industries are forecast to continue at similar levels. Sulzer anticipates slight growth for order intake and sales in 2014 compared with Return on sales before restructuring is expected to improve slightly, supported by the measures taken in Depending on market developments and capacity utilization, restructuring measures will continue in We thank you, our shareholders, for your continued trust and support. We thank our employees for their commitment and excellent collaboration and we thank our customers and partners for their trustful and long-term cooperation. Yours sincerely, Our vision Our customers recognize us for our leading technologies and services, delivering innovative and sustainable solutions. Our values Customer partnership We exceed the expectations of our customers with innovative and competitive solutions. Operational excellence We perform on the basis of structured work processes and lean principles. Committed people We are committed to high standards and show respect for people. The Board of Directors will propose an unchanged dividend of CHF 3.20 per share at the Annual General Meeting on March 20, Vladimir Kuznetsov, Vice Chairman of the Board Klaus Stahlmann, CEO
20 18 Financial highlights 2013 Good level of order intake and sales Order intake and sales were close to the levels of Profitability decreased, impacted by low capacity utilization in certain businesses and costs for operational measures. The free cash flow was on a healthy level. Sales millions of CHF Operating income millions of CHF From continuing operations. Key figures 1) millions of CHF Change in +/ % +/ % 2) Order intake Order backlog Sales Operating income before depreciation/amortization EBITDA Operating income before restructuring EBITR Operating income EBIT Return on sales before restructuring ROSR 8.6% 10.1% Return on sales ROS 8.1% 9.8% Return on capital employed ROCE 12.6% 14.7% Net income attributable to shareholders of Sulzer Ltd 3) Capital expenditure Equity attributable to shareholders of Sulzer Ltd Free cash flow 3) Net liquidity 3) Employees (number of full-time equivalents) as of December ) Key figures from continuing operations. 2) Adjusted for currency effects as well as acquisitions and divestitures. 3) Includes continuing and discontinued operations. Data per share CHF Change in +/ % Closing price of the registered share as of December Net income attributable to a shareholder of Sulzer Ltd 1) EPS Equity attributable to a shareholder of Sulzer Ltd Dividend ) ) Includes the results from continuing and discontinued operations. 2) Proposal to the general meeting of shareholders.
21 19 Sales by division Sales by region 2013 Sulzer Pumps 63% Sulzer Turbo Services 14% Sulzer Chemtech 23% 2013 Europe, Middle East, Africa 43% Americas 35% Asia-Pacific 22% By division Order intake millions of CHF Sales Change in +/ % +/ % 1) Change in +/ % +/ % 1) Divisions Sulzer Pumps Sulzer Turbo Services Sulzer Chemtech Others Total ) Adjusted for currency effects as well as acquisitions and divestitures. Operating income Return on sales millions of CHF Change in +/ % Divisions % 9.5% Sulzer Pumps % 9.1% Sulzer Turbo Services % 10.8% Sulzer Chemtech % 9.8% Others Total % 9.8% Share price development % (three-year performance ) /2011 1/2012 1/2013 1/2014
22 20 Financial review Healthy levels of order intake and sales For continuing operations, order intake and sales were at healthy levels compared with the previous year. The operating income was CHF 264 million. Return on sales before restructuring decreased to 8.6% from 10.1% in the prior year. The free cash flow was on a healthy level of CHF 219 million. Order intake: Negative currency translation effects influence order intake In 2013, Sulzer received orders of CHF 3.2 billion. The order intake decreased nominally by 2.8%; adjusted for currency translation effects as well as acquisition effects, the order intake was only 1.1% below that of previous year. The currency translation effect amounted to negative CHF 63.5 million. The effect from acquisitions and divestitures amounted to CHF 8.1 million. The strong double-digit order intake growth in Asia-Pacific in 2013 was offset by a comparably weak order intake in Europe and the Americas. The share of order intake in the emerging markets increased from 43% to 44%. The oil and gas market was strong, while less activity was recorded in the power and water markets than in the previous year. The divisions reported the following growth rates: Sulzer Pumps: 3.0% ( 1.1% adjusted) Sulzer Turbo Services: 11.9% ( 9.5% adjusted) Sulzer Chemtech: +6.4% (+4.9% adjusted) Orders millions of CHF Order intake Order backlog as of December The order backlog decreased slightly to CHF million (2012: CHF million). Sales: Impacted by currency translation effects Sales of CHF 3.3 billion were recorded in 2013, which is a nominal decrease of 2.3% (adjusted 0.7%) compared to the previous year. The growth rates of the divisions were as follows: Sulzer Pumps: 2.2% ( 0.4% adjusted) Sulzer Turbo Services: 7.6% ( 5.2% adjusted) Sulzer Chemtech: +2.6% (+1.3% adjusted) Sales were negatively influenced by the weaker Brazilian Real and South African Rand in particular. The negative currency translation effect amounted to CHF 60.6 million, while acquisition and divestiture Consolidated income statement (condensed) millions of CHF Sales Cost of goods sold Gross profit Selling, administrative and development expenses Operating income before restructuring Restructuring expenses Operating income Financial income, net Income tax expenses Net income from continuing operations Net income from discontinued operations, net of income taxes Net income
23 21 effects added some CHF 8.2 million. The regions of North America and Eastern Europe were able to increase sales from the previous year, whereas the other regions reported stable or decreasing sales. The share of sales from services was at a healthy level of 44%. Gross profit: Slight reduction Gross profit amounts to CHF million, which is a CHF 46.1 million decrease from the financial year 2012 (CHF million). The reduction can be explained by the lower sales volume and the slightly lower gross margin of 30.7% in 2013, down from 31.4% during the previous year. Operating income: Higher operating expenses including costs for restructuring Operating expenses increased by CHF 18.6 million (+2.6%) to CHF million despite slightly lower sales. Included in the operating expenses are restructuring expenses of CHF 16.8 million for costsaving measures in operational entities, particularly at Sulzer Pumps in Europe and the integration of central group functions. Corporate headquarter costs increased because of investments to strengthen the IT infrastructure and the relocation in Winterthur into one office building, which will support the new setup of the central group functions. Research and development (R&D) activities were further expanded to invest in the future of the businesses. R&D expenses increased from CHF 66.9 million in 2012 to CHF 70.6 million in 2013, which corresponds to 2.2% of sales (2012: 2.0%). This increased investment underscores Sulzer s strategic prioritization of technology leadership. It is a key factor in achieving leading positions in Sulzer s key markets oil and gas, power, and water. Operating income (EBIT) decreased by 19.7% from CHF million in 2012 to CHF million in This decline was caused by the lower gross profit (minus CHF 46.1 million) and by higher operating expenses (plus CHF 18.6 million) from restructuring costs. Return on sales (ROS) was at 8.1% (2012: 9.8%). Return on sales before restructuring expenses (ROSR) was at 8.6% (2012: 10.1%). The divisions achieved the following return on sales (ROS) figures: Sulzer Pumps: 8.2% (2012: 9.1%). A slightly lower gross margin and reduced sales volume plus restructuring expenses of CHF 9.5 million could not be fully offset by the adaptation of operating expenses. Sulzer Turbo Services: 8.3% (2012: 10.8%). Lower sales and reduced gross margins decreased profitability despite reductions in operating expenses. Sulzer Chemtech: 11.0% (2012: 9.8%). Excellent profitability increase due to higher margins. EBIT before depreciation and amortization (EBITDA) was CHF million (11.6% of sales) compared with CHF million in 2012 (13.1% of sales). Depreciation and amortization totaled CHF million in Compared with the previous year, this represents an increase of CHF 6.2 million, which includes the higher depreciations from the IT infrastructure. With a return on capital employed (ROCE) of 12.6% (2012: 14.7%), Sulzer exceeded its internal value-creating threshold (pretax weighted average cost of capital) and created financial value despite the restructuring expenses. Financial income: Lower interest expenses for unfunded pension plans Net financial income in 2013 was negative at CHF 21.8 million (2012: CHF 1.2 million). Interest income increased slightly to CHF 5.0 million (2012: CHF 4.6 million) driven by higher cash balances. Interest expenses of CHF 16.8 million were lower than last year (2012: CHF 18.4 million) due to lower borrowings. The interest expenses for employee benefit plans were CHF 6.4 million (2012: CHF 7.4 million). In 2012 the financial income benefited from the sale of third-party shares, which contributed CHF 31.0 million. Lower pretax income taxed at higher income tax rate of 27.2% Lower pretax income reduced the tax expenses by 18.2% to CHF 65.9 million in Based on the worldwide distribution of the profit including the profit at the headquarters in Switzerland, which is taxed at a low rate, the structural tax rate increased from 25.9% in 2012 to 26.7% in The effective tax rate of 27.2% in 2013 is slightly above the structural tax rate. No positive one-time effects such as the gain from sale of the third-party shares booked in 2012 could be reported in 2013 to reduce Sulzer s effective tax rate. Equity ratio 51.4% Solid balance sheet Return on capital employed 12.6% Above value-creating threshold
24 22 Financial review Divestiture of Sulzer Metco Sulzer Metco is reported as discontinued operations throughout this Annual Report. By the end of January 2014, Sulzer signed an agreement with Oerlikon for the divestment of its Sulzer Metco division. Net income: Lower net income of CHF 236 million Based on the lower operating income and the lower financial income, the net income of CHF million in 2013 was 23.3% below that of 2012 (CHF million). Net income attributable to Sulzer shareholders amounted to CHF million (7.2% of sales) compared to CHF million (9.1% of sales) in Basic earnings per share (EPS) decreased by 22.7% to CHF 6.89 (2012: CHF 8.91). Balance sheet: Increase of equity ratio to 51.4% Total assets on December 31, 2013, amounted to CHF million, which is a slight decrease of CHF 65.6 million over the figure from Additions to assets totaled to CHF 80.5 million, mainly related to property, plant, and equipment (2012: CHF 93.0 million). With depreciation and amortization of CHF million, fixed assets were reduced in The major additions to assets were investments for expansion (CHF 21.2 million, or 26% of total investments), replacements (CHF 30.6 million, or 38% of total investments), and IT investments (CHF 12.1 million, or 15% of total investments). The liabilities decreased by CHF million to CHF million on December 31, Beside a substantial reduction in non-current provisions, the borrowings were reduced by CHF 36.5 million. In connection with the intended divestiture of Sulzer Metco, all balance sheet items are shown on the lines assets and liabilities held for sale on December 31, 2013, which reduces all other balance sheet positions accordingly. With the reclassification of all Sulzer Metco balance sheet positions to assets held for sale, there is a general shift from non-current assets to current assets. Non-current assets decreased from CHF million in 2012 to CHF million at the end of The current assets, on the other hand, increased from CHF million to CHF million on December 31, A similar but smaller effect could be seen within the liabilities, where the non-current liabilities decreased by CHF million due to the Sulzer Metco reclassification and the decrease of provisions related to defined benefit plans. Equity increased by CHF million to CHF million. This was impacted by the net income of CHF million and by the dividend payment of CHF million. The equity ratio (equity/total assets) increased from 48.1% in 2012 to 51.4% in The gearing (borrowings/equity) decreased to 25% (from 27% in 2012). Consolidated cash flow statement (condensed) millions of CHF Cash flow from operating activities Purchase of intangible assets and property, plant and equipment Sale of property, plant and equipment, and intangible assets Free cash flow Acquisitions/divestitures Purchase/sale of financial assets and marketable securities Cash flow from operating and investing activities Cash flow from financing activities Exchange losses on cash and cash equivalents Net change in cash and cash equivalents Cash and cash equivalents as of December thereof classified as assets held for sale 21.2
25 23 Cash flow: Improving net liquidity by CHF 59.7 million Change in net cash was positive at CHF 42.6 million in The main impacts on cash flow were as follows: Cash flow from operating activities totaled CHF million in 2013, a decrease of CHF million from The main impacts were the lower net income (CHF 71.6 million) and the lower reduction in net working capital in 2012 (CHF 12.0 million) compared to 2013 (CHF million). Taxes paid in 2013 (CHF million) were at a similar level to that of 2012 (CHF million). A total cash outflow of CHF million resulted from investing activities. Capital expenditures of CHF million were recorded in 2013, which is CHF 20.6 million below the figure from the previous year. Cash flow for acquisitions amounted to CHF 26.7 million, mainly related to the acquisition of Krøger A/S, Denmark. The cash flow from financing was negative at CHF million. It included the cash paid out for dividend payments, which totaled CHF million, and a reduction in borrowings of CHF 21.7 million. Exchange losses on cash were CHF 20.6 million, mainly related to the cash balance held in Brazilian Real (2012: CHF 7.6 million). Changes in accounting policies Sulzer introduced the revised IFRS accounting standard IAS 19 Employee Benefits, on January 1, As required by the new standard, Sulzer s consolidated financial statements 2012 have been restated retrospectively to reflect these changes. Outlook 2014 Based on present knowledge and excluding major changes in the general economic conditions, good activity levels for parts of the oil and gas industry are expected, in particular in the Americas. Based on positive developments in selected regions, especially the Americas and China, some recovery is expected for the water market. Activities in the power and in the general industries are forecast to continue at similar levels. Sulzer anticipates slight growth for order intake and sales in 2014 compared with Return on sales before restructuring is expected to improve slightly, supported by the measures taken in Depending on market developments and capacity utilization, restructuring measures will continue in Net liquidity improved by CHF 59.7 million compared to 2012, mainly because of a healthy contribution from the operating activities and despite some smaller acquisitions and the increase in dividend payment over 2012.
26 24 Consolidated financial statements Consolidated income statement January December millions of CHF Notes ) Continuing operations Sales Cost of goods sold Gross profit Selling and distribution expenses General and administrative expenses Research and development expenses Other operating income Other operating expenses Operating income before restructuring Restructuring expenses Operating income Interest and securities income Interest expenses Other financial income/(expenses) Income before income tax expenses Income tax expenses Net income from continuing operations Discontinued operations Net income from discontinued operations, net of income taxes Net income Attributable to shareholders of Sulzer Ltd Attributable to non-controlling interests Earnings per share, attributable to a shareholder of Sulzer Ltd (in CHF) Basic earnings per share 2) Diluted earnings per share 2) Continuing operations Basic earnings per share continuing operations Diluted earnings per share continuing operations Discontinued operations Basic earnings per share discontinued operations Diluted earnings per share discontinued operations ) Restatement of prior year figures, see corporate accounting policies 2.2 and note 02 in the Sulzer Annual Report ) Restatement of prior year figures, decrease of CHF 0.12 due to the restated net income related to IAS 19R.
27 25 Consolidated statement of comprehensive income January December millions of CHF Notes ) Net income Items that may be reclassified subsequently to the income statement Fair value changes on available-for-sale financial assets, net of tax 24.4 Cash flow hedges, net of tax Currency translation differences Total of items that may be reclassified subsequently to the income statement Items that will not be reclassified to the income statement Defined benefit cost recognized in other comprehensive income, net of tax Total of items that will not be reclassified to the income statement Total other comprehensive income Total comprehensive income for the year Attributable to shareholders of Sulzer Ltd Attributable to non-controlling interests ) Restatement of prior year figures, see corporate accounting policies 2.2 in the Sulzer Annual Report 2013.
28 26 Consolidated financial statements Consolidated balance sheet December 31 millions of CHF Notes Non-current assets Goodwill Other intangible assets Property, plant, and equipment Other financial assets Non-current receivables Deferred income tax assets 1) Total non-current assets Current assets Inventories Advance payments to suppliers Trade accounts receivable Other accounts receivable and prepaid expenses 1) Assets held for sale Marketable securities Cash and cash equivalents Total current assets Total assets Equity Share capital Reserves 1) Equity attributable to shareholders of Sulzer Ltd Non-controlling interest Total equity Non-current liabilities Long-term borrowings Deferred income tax liabilities 1) Non-current income tax liabilities Non-current provisions 1) Other non-current liabilities Total non-current liabilities Current liabilities Short-term borrowings Current income tax liabilities Current provisions Trade accounts payable Advance payments from customers Liabilities held for sale Other current and accrued liabilities Total current liabilities Total liabilities Total equity and liabilities ) Restatement of prior year figures, see corporate accounting policies 2.2 in the Sulzer Annual Report 2013.
29 27 Consolidated statement of changes in equity January December Attributable to shareholders of Sulzer Ltd millions of CHF Notes Share capital Retained earnings Treasury stock Cash flow hedge reserve Availablefor-sale financial assets Currency translation adjustment Total Noncontrolling interests Total equity Equity as of January 1, 2012 (as previously reported) Restatement due to IAS 19 revised 1) Equity as of January 1, 2012 (restated) Comprehensive income for the year: Net income Cash flow hedges, net of tax Fair value changes on available-forsale financial assets, net of tax Defined benefit cost recognized in other comprehensive income, net of tax Currency translation differences Total comprehensive income for the year Changes in ownership in subsidiaries without loss of control Transactions in treasury shares Share-based payments Dividend Equity as of December 31, 2012 (restated) Comprehensive income for the year: Net income Cash flow hedges, net of tax Defined benefit cost recognized in other comprehensive income, net of tax Currency translation differences Total comprehensive income for the year Addition of non-controlling interests Transactions in treasury shares Share-based payments Dividend Equity as of December 31, ) See corporate accounting policies 2.2 in the Sulzer Annual Report 2013.
30 28 Consolidated financial statements Consolidated statement of cash flows January December millions of CHF Notes Cash and cash equivalents as of January Cash flow from operating activities Net income 1) Interest and securities income Interest expenses 1) Income tax expenses 1) Depreciation/amortization Income from disposals of subsidiaries; property, plant, and equipment; and financial instruments Changes in inventories Changes in advance payments to suppliers Changes in trade accounts receivable Changes in advance payments from customers Changes in trade accounts payable Changes in provisions 1) Changes in other net current assets Other non-cash items 1) Interest received Interest paid Income tax paid Total cash flow from operating activities Cash flow from investing activities Purchase of intangible assets Sale of intangible assets Purchase of property, plant, and equipment Sale of property, plant, and equipment Acquisitions of subsidiaries, net of cash acquired Acquisitions of associates 2.9 Divestitures of subsidiaries Purchase of financial assets Sale of financial assets 32.0 Purchase of marketable securities Sale of marketable securities Total cash flow from investing activities Cash flow from financing activities Dividend Purchase/sale of treasury stock Dividend to non-controlling interests Additions in long-term borrowings Repayment of long-term borrowings Additions in short-term borrowings Repayment of short-term borrowings Total cash flow from financing activities Exchange losses on cash and cash equivalents Net change in cash and cash equivalents Cash and cash equivalents as of December thereof classified as assets held for sale ) Restatement of prior year figures, see corporate accounting policies 2.2 and note 02 in the Sulzer Annual Report 2013.
31 29 Imprint This document may contain forward-looking statements, including, but not limited to, projections of financial developments and future performance of materials and products, containing risks and uncertainties. These statements are subject to change based on known and unknown risks and various other factors that could cause the actual results or performance to differ materially from the statements made herein. The complete Sulzer Annual Report 2013 is available at Published by: Sulzer Ltd, Winterthur, Switzerland, 2014 Concept/Layout: Addison Group, London, UK Photographs: Andy Wilson, London, UK Getty (cover, pages 6/7/12); Comstock/Jumper/Andreea Manciu/Fotosearch, Getty (internal front cover, pages 5/15); Jason Hawkes, Getty (pages 7/8/10); Printing: Mattenbach AG, Winterthur, Switzerland This report is printed in a climate-neutral process on Forest Stewardship Council (FSC) certified paper. PERFORMANCE neutral Printed Matter No myclimate The Climate Protection Partnership

32 Sulzer Ltd 8401 Winterthur Switzerland Phone Fax Group Communications Phone Fax Investor Relations Phone Fax
Solutions for global energy and water needs. The Company 2011
 Solutions for global energy and water needs The Company 2011 Who we are and how we are doing Sulzer is a global partner with reliable and sustainable solutions for performance-critical applications. We
Strong performance by the Bolloré Group s operating activities in 2018 Mr Cyrille Bolloré unanimously appointed Chairman and Chief Executive Officer
 PRESS RELEASE 2018 results (1) March 14, 2019 Strong performance by the Bolloré Group s operating activities in 2018 Mr Cyrille Bolloré unanimously appointed Chairman and Chief Executive Officer Revenue:
Return to organic order growth, start of profitability rebound
 Sulzer Management Ltd Neuwiesenstrasse 15 8401 Winterthur Switzerland Phone +41 52 262 30 00 Fax +41 52 262 31 00 Return to organic order growth, start of profitability rebound In 2017, order intake grew
H1 2018: Strong organic order growth and profitability increase
 Sulzer Management Ltd Neuwiesenstrasse 15 8401 Winterthur Switzerland Phone +41 52 262 30 00 Fax +41 52 262 31 00 In the first half of 2018, Sulzer s rebound continued. Order intake increased by 11.6%
Long-Term Corporate Resilience
 Presentation to Swiss-American Chamber of Commerce Long-Term Corporate Resilience Ton Büchner, CEO of Sulzer Ltd March 23, 2009 Long Term Corporate Resilience It s all common sense living it is the hard
2003 fourth quarter and full-year results
 Dinesh Paliwal Member of Group Executive Committee, Head of Automation Technologies Division 2003 fourth quarter and full-year results Automation Technologies Copyright 2003 ABB. All rights reserved. -
Annual Press Conference
 Annual Press Conference Stuttgart, 16 December 2016 Prof. Dr. Michael Kaschke President & Chief Executive Officer Thomas Spitzenpfeil Chief Financial Officer ZEISS Group, 2015/16 Annual Press Conference
Respect for customers, partners and staff. Service: another name for the respect that a company owes its customers, partners and staff.
 Respect for customers, partners and staff Service: another name for the respect that a company owes its customers, partners and staff. Vehicle glass KEY FIGURES (in EUR million) 2004 2003 % change Total
ABB delivers strong order growth and cash in Q2
 ABB delivers strong order growth and cash in Orders up 13% 1 ; book-to-bill ratio of 1.04x 2 Group operational EBITDA 3 impacted by loss in Power Systems (PS) Decisive step change actions implemented in
Jointly towards a long term sustainable energy supply
 Jointly towards a long term sustainable energy supply Lars G. Josefsson, CEO Vattenfall, CEO Nuon 23 February 2009 Agenda Nuon & Vattenfall: a great partnership Rationale for Nuon Rationale for Vattenfall
First in Mind First in Choice. Capital Markets Day 2006 Gunnar Brock, President and CEO
 First in Mind First in Choice Capital Markets Day 26 Gunnar Brock, President and CEO 1 December 4, 26 www.atlascopco.com Atlas Copco in a Snapshot Continuing operations A world leading provider of industrial
Investor Relations News
 Investor Relations News Financial year 2017: MTU Aero Engines AG once again posts record figures Earnings forecast for 2017 fully met Outlook for 2018: Moderate earnings increase, cash conversion rate
High profitability in challenging markets
 Annual Report 2009 Key Figures 2009 High profitability in challenging markets Sulzer achieved double-digit return-on-sales levels, both before restructuring (12.4%) and after restructuring expenses (11.0%).
Consolidated Financial Results for 1Q FY2016 July 29, 2016 Fuji Electric Co., Ltd.
 Consolidated Financial Results for 1Q FY2016 July 29, 2016 Fuji Electric Co., Ltd. 2016Fuji Electric Co., Ltd. All rights reserved. 1 Summary of Consolidated Financial Results for 1Q FY2016 (YoY Comparison)
ZF posts record sales in 2017; announces increased research and development activities
 Page 1/5, March 22, 2018 ZF posts record sales in 2017; announces increased research and development activities ZF chief executive officer announces further expansion of research and development activities
Orders received grew in all business areas
 26 October 2018 Orders received grew in all business areas Cargotec s January September 2018 interim report Mika Vehviläinen, CEO Mikko Puolakka, CFO Cargotec s January September 2018 interim report 26/10/2018
MONRO MUFFLER BRAKE, INC. PROVIDES FOURTH QUARTER AND FISCAL 2017 FINANCIAL RESULTS
 CONTACT: John Van Heel Chief Executive Officer (585) 647-6400 Robert Gross Executive Chairman (585) 647-6400 FOR IMMEDIATE RELEASE Brian D Ambrosia Senior Vice President Finance Chief Financial Officer
Volvo Group THIRD QUARTER 2015 JAN GURANDER. Volvo Group Headquarters Third quarter
 Volvo Group THIRD QUARTER 2015 JAN GURANDER 1 VOLVO GROUP Third quarter highlights NET SALES SEK bn 12 months 310 bn IMPROVED PROFITABILITY ON FLAT VOLUMES UNDERLYING OPERATING MARGIN 6.9% 67 73 OPERATING
Fiscal Year 2012: Year of record operational performance
 Ranshofen, March 1, 2013 Fiscal Year 2012: Year of record operational performance Year of record operational performance: - 327,800 tons of external shipments - 266,900 tons of scrap charged in Ranshofen
Proposed acquisition of Areva Distribution. December 2, 2009
 Proposed acquisition of Areva Distribution December 2, 2009 Disclaimer All forward-looking statements are Schneider Electric management s present expectations of future events and are subject to a number
Lazydays Holdings, Inc. Reports Second Quarter 2018 Financial Results
 News Contact: +1 (813) 204-4099 investors@lazydays.com Lazydays Holdings, Inc. Reports Second Quarter 2018 Financial Results Tampa, FL (August 9, 2018) Lazydays Holdings, Inc. ( Lazydays )(NasdaqCM: LAZY)
Alfa Laval Slide 3.
 Report for Q3 2009 - Orders received and margins - Highlights - Development per segment - Geographical development - Financials - Outlook Mr. Lars Renström President and CEO Alfa Laval Group Key figures
Increase of the sales by 33% mainly due to the Safelite acquisition
 36 - Vehicle Glass Repair and Replacement Increase of the sales by 33% mainly due to the Safelite acquisition 37 Key events in Vehicle Glass Repair and Replacement January 2007 The launch in the UK of
Growing order intake but challenging market environment impacting H results
 Midyear Presentation 2015 Growing order intake but challenging market environment impacting H1 2015 results Winterthur July 28, 2015 THE SAFE HARBOR STATEMENT UNDER THE US PRIVATE SECURITIES LITIGATION
Lazydays Holdings, Inc. Reports Third Quarter 2018 Financial Results
 News Contact: +1 (813) 204-4099 investors@lazydays.com Lazydays Holdings, Inc. Reports Third Quarter 2018 Financial Results Tampa, FL (November 8, 2018) Lazydays Holdings, Inc. ( Lazydays ) (NasdaqCM:
I remind you that our presentation is available on our website. We can start from the first 2 slides that show Piaggio Group First
 CONFERENCE CALL 2009 1 st HALF RESULTS Good afternoon and welcome to everybody. I remind you that our presentation is available on our website. We can start from the first 2 slides that show Piaggio Group
Alfa Laval Slide 3.
 Report for Q1 2010 - Orders received and margins - Highlights - Development per segment -Geographical development - Financials - Outlook Mr. Lars Renström President and CEO Alfa Laval Group Key figures
Earnings conference call
 Earnings conference call Full year 2017 Åke Bengtsson, President & CEO Andreas Ekberg, Acting CFO February 14, 2018 1 Agenda Business Summary Market Update Sales Financials Way forward 2 Business Summary
Embargoed until: March 5, 2019, 7 a.m. CET. Key Financial Data: January 1 to December 31, Evonik more robust as strategy takes effect
 Embargoed until: March 5, 2019, 7 a.m. CET Key Financial Data: January 1 to December 31, Evonik more robust as strategy takes effect Promised and delivered: adjusted EBITDA climbs to 2.6 billion rise 4
BlueScope Steel Limited Consolidated Financial Headlines
 BlueScope Steel Limited Consolidated Financial Headlines 2003 2004 2005 2006 2007 2008 2009 2010 2011 2012 2013 2013 2013 2014 2014 2014 2015 2015 2015 2016 2016 2016 2017 2017 2017 2018 2018 2018 Total
Interim Review Q1 2007
 Interim Review Q1 2007 25 April 2007 25 April 2007 www.ruukki.com Ruukki today Net sales in 2006: 3.7 billion 13,000 employees in 23 countries Supplies metal-based components, systems and integrated systems
First half 2017 Results September 1, 2017
 PRESS RELEASE First half 2017 Results September 1, 2017 Full consolidation of Vivendi Group from April 26, 2017 and Sale to Vivendi of the Bolloré Group s 59.2% stake in Havas for 2,317 million euros completed
BERNSTEIN STRATEGIC DECISIONS CONFERENCE 2018
 ABB LTD, NEW YORK CITY, USA, 31 MAY 2018 Positioned for profitable growth BERNSTEIN STRATEGIC DECISIONS CONFERENCE 2018 Ulrich Spiesshofer, CEO Important notice This presentation includes forward-looking
third QUARTER 2012 October 26, 2012
 third QUARTER 212 October 26, 212 Helena norrman Senior Vice President Communications third QUARTER 212 October 26, 212 This presentation contains forward-looking statements. Such statements are based
Interim results June 30, 2003
 1 Interim results June 30, 2003 2 In units W orldwide sales at June 30 (cars and light commercial vehicles) > Worldwide sales at June 30, 2003: 1,689,200 cars and light commercial vehicles, versus 1,656,900
Third quarter AB Volvo
 Third quarter 2013 Third quarter 2013 TRUCKS EUROPE Excellent reception of the new products decision to optimize manufacturing Highlights in Commercial launch of the new product ranges Strong order situation
Evonik Corporate Venturing. Dr. Jürgen Finke Ecosummit 2012, Neuss November 14, 2012
 Evonik Corporate Venturing Dr. Jürgen Finke Ecosummit 2012, Neuss November 14, 2012 Focus on specialty chemicals Evonik is one of the global leaders in specialty chemicals Strong integrated technology
1 st Half 2018 Results. August 1 st, 2018
 1 st Half 2018 Results August 1 st, 2018 H1 HIGHLIGHTS & CATEGORY SPOTLIGHTS Gonzalve BICH 2 First Half 2018 Key Messages Challenging market and business environment Continued investment in targeted Brand
Bernstein Strategic Decisions Conference 2018
 Bernstein Strategic Decisions Conference 2018 Forward-Looking Statements Certain statements in this presentation, other than statements of historical fact, including estimates, projections, statements
Roadshow Presentation
 Roadshow Presentation June 2, Wilfried Trepels, CFO 1 SAF-HOLLAND - Components Fifth Wheels Kingpins Suspensions Landing Gear Axle Systems 2 SAF-HOLLAND - Business Units Trailer Systems Powered Vehicle
Manz Automation AG. Conference Call, Full Year Results 2009 March 30, 2010, Reutlingen Dieter Manz/CEO, Martin Hipp/CFO
 Manz Automation AG Conference Call, Full Year Results 2009 March 30, 2010, Reutlingen Dieter Manz/CEO, Martin Hipp/CFO Manz Automation is a high-tech equipment supplier for high growth industries is an
FISCAL YEAR END MARCH 2013 FIRST HALF FINANCIAL RESULTS. New Mazda6 (Atenza)
") FISCAL YEAR END MARCH 2013 FIRST HALF FINANCIAL RESULTS New Mazda6 (Atenza) Mazda Motor Corporation October 31, 2012 1 PRESENTATION OUTLINE Highlights Fiscal Year March 2013 First Half Results Fiscal Year
FISCAL YEAR END MARCH 2013 FIRST HALF FINANCIAL RESULTS New Mazda6 (Atenza) Mazda Motor Corporation October 31, 2012 1 PRESENTATION OUTLINE Highlights Fiscal Year March 2013 First Half Results Fiscal Year
Valvoline Fourth-Quarter Fiscal 2016 Earnings Conference Call. November 9, 2016
 Valvoline Fourth-Quarter Fiscal 2016 Earnings Conference Call November 9, 2016 Forward-Looking Statements This presentation contains forward-looking statements within the meaning of Section 27A of the
Record CY 2016 EPS-diluted-adjusted of $6.12, an increase of $1.10 Y-O-Y. Q EPS-diluted-adjusted of $1.28, a decrease of $0.11 Y-O-Y.
 1 2 3 Q4 2016 global deliveries up 0.1 million units year-over-year (Y-O-Y), a 3.3% increase. Volume gains primarily in North America and China, offset by reductions in International Operations (excluding
MAHLE positions itself for the future
 MAHLE positions itself for the future Sales rise to EUR 12.3 billion in 2016 Significant increase in organic growth 2016 business year characterized by strategic decision-making Stuttgart, April 26, 2017
CONFERENCE CALL RESULTS Q1 2017
 CONFERENCE CALL RESULTS Q1 2017 May 5, 2017 Marc Bunz (CFO) Nicolas-Fabian Schweizer (CTO) AGENDA Market & Strategy Update Financials 2016 Financials Q1 2017 Outlook SCHWEIZER Share Schweizer Electronic
Voith Group On a good footing for future growth
 Voith Group On a good footing for future growth Stuttgart, December 7, 2017 Annual press conference Stuttgart December 7, 2017 Public 1 Contents 1. Where we now stand 1.1 Highlights in the 2016/17 fiscal
WÄRTSILÄ CORPORATION SEB FINNISH BLUE CHIP SEMINAR 28 AUGUST Marco Wirén, CFO. Wärtsilä
 WÄRTSILÄ CORPORATION SEB FINNISH BLUE CHIP SEMINAR 28 AUGUST 2015 Marco Wirén, CFO 1 This is Wärtsilä Energy Solutions, 23% Marine Solutions, 30% Services, 47% 2 Net sales and profitability MEUR 6000 14%
2013 Final Results. 19 March 2014
 2013 Final Results 19 March 2014 Important Notice The information contained herein is meant for presentation purposes only and may not be used and relied upon by any other party. It is not to be taken
Q3 & 9M 2018 Results Presentation. October 24 th, 2018
 Q3 & 9M 2018 Results Presentation October 24 th, 2018 Q3 & 9M HIGHLIGHTS & CATEGORY SPOTLIGHTS Gonzalve BICH 3Q and 9M 2018 Results Presentation 2 9 Months 2018 Key Messages Continued challenging trading
Financial Results for First Half of FY2014 (April 1- September 30) Investor meeting. October 31, 2014
 Investor meeting. October 31, 2014") Financial Results for First Half of FY2014 (April 1- September 30) Investor meeting October 31, 2014 1 CONTENTS 1. Financial Results for First Half of FY2014 2. Forecast for FY2014 3. Cash Flow and Debt
Financial Results for First Half of FY2014 (April 1- September 30) Investor meeting October 31, 2014 1 CONTENTS 1. Financial Results for First Half of FY2014 2. Forecast for FY2014 3. Cash Flow and Debt
Fiscal Year 2012: Year of record operational performance
 Ranshofen, February 28, 2013 Fiscal Year 2012: Year of record operational performance Year of record operational performance: - 327,800 tons of external shipments - 266,900 tons of scrap charged in Ranshofen
1. Isuzu Motors Limited 1999 Annual Report
 1. Isuzu Motors Limited 1999 Annual Report F INANCIAL H IGHLIGHTS Millions of Yen Thousands of U.S. Dollars 1999 1998 1997 1999 Net Sales 934,865 1,128,68 1,194,835 $7,754,999 Net Income (Loss) (4,566)
MONRO MUFFLER BRAKE, INC. ANNOUNCES FOURTH QUARTER AND FISCAL 2015 FINANCIAL RESULTS
 CONTACT: John Van Heel Chief Executive Officer (585) 647-6400 Robert Gross Executive Chairman (585) 647-6400 Catherine D Amico Executive Vice President Finance Chief Financial Officer (585) 647-6400 Investors:
BMW Group posts record earnings for 2010
 10.03.2011 BMW Group posts record earnings for 2010 Profit before tax rises to euro 4,836 million Profit before financial result climbs to euro 5,094 million Automobiles segment reports EBIT of euro 4,355
Fact Sheet for Q April 22, 2016
 Fact Sheet for Q1 2016 April 22, 2016 Contents Daimler Group Stock Market Information 3 Earnings and Financial Situation 4-13 Information for Divisions Mercedes-Benz Cars 14-17 Daimler Trucks 18-22 Mercedes-Benz
EXANE BNP PARIBAS 13th European Seminar June 8, 2011
 EXANE BNP PARIBAS 13th European Seminar June 8, 2011 This presentation may contain forward-looking statements. Such forward-looking statements do not constitute forecasts regarding the Company s results
FISCAL YEAR MARCH 2018 FIRST QUARTER FINANCIAL RESULTS
 FISCAL YEAR MARCH 2018 FIRST QUARTER FINANCIAL RESULTS PRESENTATION OUTLINE Highlights Fiscal Year March 2018 First Quarter Results Fiscal Year March 2018 Full Year Forecast Structural Reform Stage 2 Progress
Analysis of Operating Results and Financial Status
 Analysis of Operating Results and Financial Status 1. Analysis of Operating Results of EGAT and its Subsidiaries Operating results of EGAT and its subsidiaries including associated company and jointly
Analysis of Operating Results and Financial Status
 29 Analysis of Operating Results and Financial Status 1. Analysis of Operating Results of EGAT and Its Subsidiaries Operating results of EGAT and its subsidiaries including associated company and joint
FISCAL YEAR MARCH 2015 FIRST HALF FINANCIAL RESULTS. New Mazda Demio
 FISCAL YEAR MARCH 2015 FIRST HALF FINANCIAL RESULTS New Mazda Demio Mazda Motor Corporation October 31, 2014 1 PRESENTATION OUTLINE Highlights Fiscal Year March 2015 First Half Results Fiscal Year March
PRO-FORMA FIGURES OF THE A2A GROUP
 PRO-FORMA FIGURES OF THE A2A GROUP restated at December 31, 2007 published on March 25, 2009 Contents 3 0.1 Summary of pro-forma figures restated at December 31, 2007 7 0.2 Presentation of the pro-forma
FISCAL YEAR MARCH 2015 FIRST QUARTER FINANCIAL RESULTS. Mazda Roadster 25 th Anniversary Model
 FISCAL YEAR MARCH 2015 FIRST QUARTER FINANCIAL RESULTS Mazda Roadster 25 th Anniversary Model Mazda Motor Corporation July 31, 2014 1 PRESENTATION OUTLINE Highlights Fiscal Year March 2015 First Quarter
Good demand in Hiab continued
 24 April 218 Good demand in Hiab continued Cargotec s January March 218 interim report Mika Vehviläinen, CEO Mikko Puolakka, CFO Cargotec s January-March 218 interim report 24/4/218 1 Contents 1. Group
Agenda. Review. Strategy. Outlook
 1 Agenda Review 2006 Strategy Outlook 2007 2 Highlights 2006 Focus on Transport-Related Engineering Strong operational performance in all business areas Strong market environment Initiative taken for truck
Paris Tuesday, April 1, Europcar Groupe 2007 Annual Results
 Paris Tuesday, April 1, 2008 Europcar Groupe 2007 Annual Results Speakers Salvatore Catania Chief Executive Officer, Europcar Groupe Charles Desmartis Chief Financial Officer, Europcar Groupe 1 Europcar
Q1/2008 operating profit: up 43 percent from 318 million a year ago to 455 million Q1 sales increase of 16 percent to 3.8 billion
 MAN AG The MAN Group in Q1/2008 Solid start in anniversary year Munich, April 25, 2008 Q1/2008 operating profit: up 43 percent from 318 million a year ago to 455 million Q1 sales increase of 16 percent
3 rd Quarter 2017 Results
 Inside your life! 3 rd Quarter 2017 Results October 25, 2017 Mobile Automotive Display Semiconductor IoT LED Contents Ⅰ. Q3 2017 Earnings Summary Ⅱ. Earnings Highlight & Outlook Ⅲ. Results & Outlook by
DEUTZ Investor Presentation August 2016
 DEUTZ Investor Presentation August 2016 Agenda DEUTZ strategy & positioning Financials Outlook 2 DEUTZ at a glance World s first engine factory founded in 1864 by N.A. Otto, the developer of the four the
Investor presentation May The Origin of HighTech.
 Investor presentation May 2014 The Origin of HighTech. Agenda DEUTZ strategy & positioning Financials Outlook 2 DEUTZ at a glance 150 years DEUTZ a tradition of achievement Independent manufacturer of
FISCAL YEAR MARCH 2014 FINANCIAL RESULTS
 FISCAL YEAR MARCH 214 FINANCIAL RESULTS Mazda CX-5 Mazda Atenza Mazda Motor Corporation April 25, 214 New Mazda Axela 1 PRESENTATION OUTLINE Highlights Fiscal Year March 214 Results Fiscal Year March 215
Financial Data Supplement Q4 2017
 Bank Financial Data Supplement Q4 2017 2 February 2018 Due to rounding, numbers presented throughout this document may not sum precisely to the totals we provide and percentages may not precisely reflect
Facts and Figures 2017 Edition
 Facts and Figures 2017 Edition The Voith Group in Figures in millions 2014/15 2015/16 Orders received 1) 4,389 4,108 Sales 1) 4,302 4,252 Profit from operations 1) 270 275 Return on sales in % 1) 6.3 6.5
Financial Summary for 2Q-FY2017 And Projections for FY2017
 Financial Summary for 2Q-FY2017 And Projections for FY2017 1 INDEX 01 Financial Summary for 2Q-FY2017 02 Performance Forecast for FY2017 03 Topics 2 01 Financial Summary for 2Q-FY2017 3 01 Financial Summary
Full-year Report 2009
 Full-year Report 2009 Joakim Olsson CEO and President February 12, 2009 Innovative Vehicle Technology 2010-02-12 Summary 2009 Sales of SEK 5,622m (8,403) Adjusted for currency effects sales decreased by
STAR CONFERENCE PRESENTATION
 STAR CONFERENCE PRESENTATION 1 London October 9 th, 2008 A worldwide technological and market leader on vehicles two key system components SUSPENSION FLEXIBLE COMPONENTS ENGINE AND CABIN FILTRATION coil
2015 Interim Results Announcement
 China Petroleum & Chemical Corporation 2015 Interim Results Announcement August 27, 2015 Hong Kong Cautionary Statement This presentation and the presentation materials distributed herein include forward-looking
Presentation to Investors Q results ROYAL DSM HEALTH NUTRITION MATERIALS
 Presentation to Investors Q3 2016 results ROYAL DSM HEALTH NUTRITION MATERIALS Safe harbor statement This presentation may contain forward-looking statements with respect to DSM s future (financial) performance
Press release on the business development of the MAHLE Group in 2013
 Press release on the business development of the MAHLE Group in 2013 Stuttgart, April 17, 2014 2013 business year dominated by the ongoing strategic development of the product portfolio Sales Total sales
MONRO, INC. ANNOUNCES SECOND QUARTER FISCAL 2018 FINANCIAL RESULTS
 CONTACT: Brett Ponton Chief Executive Officer (585) 647-6400 FOR IMMEDIATE RELEASE Brian D Ambrosia Senior Vice President Finance Chief Financial Officer (585) 647-6400 Investors and Media: Effie Veres
Kongsberg Automotive ASA. Fourth quarter February 28, 2019
 Kongsberg Automotive ASA Fourth quarter - February 28, 2019 Highlights Q4 Sales Revenues grew by 21 (7.3%) YoY to 288 including negative FX effects of 1. We booked new business with 77 in expected annual
Third Quarter 2017 Performance and Business Update. October 26, 2017
 Third Quarter 2017 Performance and Business Update October 26, 2017 1 Important Notice Please read this management presentation together with the Company s press release issued earlier today announcing
WÄRTSILÄ CORPORATION JP MORGAN CAZENOVE EUROPEAN CAPITAL GOODS CEO CONFERENCE
 WÄRTSILÄ CORPORATION JP MORGAN CAZENOVE EUROPEAN CAPITAL GOODS CEO CONFERENCE Jaakko Eskola President & CEO 1 Wärtsilä PUBLIC 9.6.2016 Jaakko Eskola Wärtsilä s net sales by business Q1/2016 SERVICES, 52%
Earnings conference call Q4 & FY 2016
 Earnings conference call Q4 & FY 2016 Bo Annvik, CEO / Åke Bengtsson, CFO February 10, 2016 1 Agenda Business Highlights Market Update Sales Financials Way forward 2 Business Summary FY 2016 A year with
Interim statement as of 30 September 2017 Conference call
 Interim statement as of 30 September 2017 Conference call Dr. Volker Hues Member of the Board of Management, Finance Hamburg, 7 November 2017 Jungheinrich highlights Q1 Q3 2017 Forecast for the whole of
FISCAL YEAR ENDED MARCH 2011 FINANCIAL RESULTS
 FISCAL YEAR ENDED MARCH 211 FINANCIAL RESULTS Mazda Motor Corporation April 28, 211 Mazda MINAGI 1 PRESENTATION OUTLINE Highlights Fiscal Year Ended March 211 Results In Summary Question & Answer Session
Investor Relations News
 Investor Relations News MTU Aero Engines AG posts new record revenues and earnings for 2016 2017: End of investment phase with further increase in revenues, earnings and free cash flow Outlook for 2017:
Mazda Motor Corporation FISCAL YEAR MARCH 2016 FIRST HALF FINANCIAL RESULTS (Speech Outline)
") (For your information) November 5, 2015 Mazda Motor Corporation FISCAL YEAR MARCH 2016 FIRST HALF FINANCIAL RESULTS (Speech Outline) Representative Director Executive Vice President Akira Marumoto 1. HIGHLIGHTS
(For your information) November 5, 2015 Mazda Motor Corporation FISCAL YEAR MARCH 2016 FIRST HALF FINANCIAL RESULTS (Speech Outline) Representative Director Executive Vice President Akira Marumoto 1. HIGHLIGHTS
Report for Q Mr. Tom Erixon President and CEO Alfa Laval Group.
 Report for Q3 2018 Mr. Tom Erixon President and CEO Alfa Laval Group Key figures July September 2018 Orders received grew 35% to SEK 11,357 million. Net sales increased 24% to SEK 10,131 million. Adjusted
Volkswagen Group Capital Markets Day 2017 Volkswagen Truck & Bus
 Volkswagen Group Capital Markets Day 2017 Volkswagen Truck & Bus Andreas Renschler Board of Management, Commercial Vehicles Capital Markets Day, 14 th of March 2017 Disclaimer The following presentations
FISCAL YEAR MARCH 2018 FIRST HALF FINANCIAL RESULTS
 FISCAL YEAR MARCH 2018 FIRST HALF FINANCIAL RESULTS PRESENTATION OUTLINE Highlights Fiscal Year March 2018 First Half Results Fiscal Year March 2018 Full Year Forecast Progress of Key Initiatives/ Business
Joint Press Release of BASF, Arsenal and Foosung. BASF acquires Novolyte Technologies. April 26, 2012
 Joint Press Release of BASF, Arsenal and Foosung April 26, 2012 BASF acquires Novolyte Technologies BASF becomes global supplier of Lithium Battery Electrolyte formulations Further step to becoming leading
ABB accelerates transformation Stage 2 of Next Level Strategy
 ABB accelerates transformation Stage 2 of Next Level Strategy London, United Kingdom, September 9, 2015: Capital Markets Day Unlocking additional value through realignment of unique power & automation
Unaudited Financial Statements for the Third Quarter ( 3Q ) and Nine Months ( 9M ) Ended 30 September 2017
 and Nine Months ( 9M ) Ended 30 September 2017") BUMITAMA AGRI LTD. Unaudited Financial Statements for the Third Quarter ( 3Q ) and Nine Months ( 9M ) Ended 30 September 2017 1(a)(i) Income statement (for the group) together with a comparative statement
BUMITAMA AGRI LTD. Unaudited Financial Statements for the Third Quarter ( 3Q ) and Nine Months ( 9M ) Ended 30 September 2017 1(a)(i) Income statement (for the group) together with a comparative statement
Healthier Net Profit under Stronger IDR
 Investor Bulletin, First Half 2002 Healthier Net Profit under Stronger IDR As of June 2002, the consolidated revenue in USD increased by 32% y.o.y. Due to IDR strengthening against USD, in IDR revenue
FISCAL YEAR MARCH 2015 THIRD QUARTER FINANCIAL RESULTS. Updated Mazda CX-5 (Japanese specification model)
") FISCAL YEAR MARCH 2015 THIRD QUARTER FINANCIAL RESULTS Updated Mazda CX-5 (Japanese specification model) Mazda Motor Corporation February 4, 2015 1 PRESENTATION OUTLINE Highlights Fiscal Year March 2015
FISCAL YEAR MARCH 2015 THIRD QUARTER FINANCIAL RESULTS Updated Mazda CX-5 (Japanese specification model) Mazda Motor Corporation February 4, 2015 1 PRESENTATION OUTLINE Highlights Fiscal Year March 2015
2002/03 Interim Announcement 11 November
 2002/03 Interim Announcement 11 November 2002 www.renold.com Financial Summary First Half First Half 2002/03 2001/02 m m Turnover 91.3 97.6 Trading profit before exceptional items 4.7 3.8 Profit before
THREE MONTHS REPORT, JAN MARCH 2016
 THREE MONTHS REPORT, JAN MARCH 2016 TELEPHONE CONFERENCE 26 APRIL, 2016, AT 14:30 CET TOMMY ANDERSSON, PRESIDENT AND CEO HELENA WENNERSTRÖM, EVP AND CFO TO PARTICIPATE, PLEASE CALL 5 MINUTES BEFORE THE
Intention to split NKT Holding into two listed companies Acquisition of ABB s high-voltage cables business
 NKT I Intention to split NKT Holding - Acquisition of ABB HV Cables I Webcast 21 September 2016 I 1 6 Intention to split NKT Holding into two listed companies Acquisition of ABB s high-voltage cables business
National Treasury Presentation to the Standing Committee on Finance: South African Airways SOC Ltd ( SAA )
") National Treasury Presentation to the Standing Committee on Finance: South African Airways SOC Ltd ( SAA ) Presenter: National Treasury 18 November 2015 90 day Action Plan In November 2014, the Ministers
National Treasury Presentation to the Standing Committee on Finance: South African Airways SOC Ltd ( SAA ) Presenter: National Treasury 18 November 2015 90 day Action Plan In November 2014, the Ministers