Driving Value in an Inflated Market. June 24, 2015
|
|
|
- Anastasia Barnett
- 5 years ago
- Views:
Transcription


1 Driving Value in an Inflated Market June 24, 2015
2 Group 1 Automotive Ticker: GPI Stock Price: $82.53 * Group 1 owns and operates auto dealerships Third largest dealership group in the U.S. retailing 275,000 new and used vehicles annually 104 US dealerships, 17 UK dealerships, 17 Brazil dealerships Market capitalization of $2.0 billion Recent valuation multiples 15e P/E: 11.5x * All financials assume June 1, 2015 share price of $82.53

3 Local Monopolies Dealers provided a great deal of protection in different states (receive long-term operating agreements because they are independently owned and capitalized) Franchise agreements provide geographic exclusivity in densely populated areas Law requires that the sales channel for new cars must be directed through the dealer network Manufacture paid maintenance service required to be completed at dealership Expensive OEM specific tools and diagnostics provide barriers to entry for service techs at independent shops
4 Economic Moat

5 Economic Moat
6 Deceptively High-Quality Business Inventory is financed through vehicle floorplan notes payable from various OEMs Notes accrue like other types of borrowing, but OEMs extend floorplan assistance to offset the expense Little inventory risk as the OEMs provide retailers with significant incentives to move inventory and dealers are often paid to carry Dealership decline has improved the competitive environment Dealers down 20% over the past seven years GM allowed to rationalize its dealer network during bankruptcy (cut network by 30%)

7 Strong National Footprint
8 Business Mix New Vehicle- 54% of sales, 20% of gross profit Roughly $1,850 in gross profit per vehicle, with certain luxury vehicles bringing in more than twice this amount. These per car margins are lower than historical norms Used Vehicle- 30% of sales, 13% of gross profit Roughly $1,600 in gross profit per vehicle Unwanted cars sold at breakeven into the wholesale market Finance & Insurance- 4% of sales, 26% of gross profit Fees and spreads on car loans and leases Purely a fee-based earnings stream for arranging third-party financing, insurance, etc. Parts & Service- 12% of sales, 41% of gross profit The real profit center of the dealership
9 Finance & Insurance Pure margin business GPI receives roughly $1,350 per unit for arranging financing, service, and insurance contracts Financing: 1/3 of F&I ($450) comes in the form of flat fees or financing spreads paid to arrange a loan Vehicle Warranty and Protection: 2/3 of F&I comes from fees earned from selling third-party extended warranty, vehicle service, and insurance products


10 Financing Buyer qualifies for a lender offered 3.5% 60-month amortizing loan Dealership tells the buyer that 5.5% is the best available rate The difference between the buy rate and the dealer rate known as the yield spread premium is calculated and capitalized The dealer receives the majority of this markup as a kick-back from the lender $450


11 CFPB- Headline Risk The Consumer Financial Protection Bureau believes dealer discretion in setting interest rates can potentially lead to discrimination in the form of higher prices for certain groups Implication: The extremely profitable F&I segment for auto dealers is set to be impacted.
 to flat fees Certain lenders including")
12 CFPB- Headline Risk The CFPB s intent is to monitor discrimination practices not set pricing the CFPB agrees that dealers should be compensated for processing financing Any impact is limited to financing dealer markups represent 1/3 or less of F&I income The expectation is that lenders will be forced to move from dealer reserves (interest rate markups) to flat fees Certain lenders including BMO Harris Bank in Chicago have moved to flat fees (3% of finance amount) with no change of consequence to dealer economics Dealer economics are unlikely to change as they will continue to choose which lenders get the financing business

")


 20% Revenue")
13 Parts & Service (The Real Profit Driver) New Used F&I P&S 12% 4% 41% 30% 26% 54% 13% Gross margins run at 52% (half is service at 70-80% margin, half is parts at 35% margin) Trends in manufacture-paid maintenance have improved economics for dealers since service is free to customers, the dealer retains the entire service stream Customers may look outside hometown for a new car purchase, but they are a captive customer for car servicing Price & Servicing is driven by the servicing base (0-5 year fleet) 20% Revenue Gross Profit

14 Near-Term Catalysts: SAAR Rebound

15 Auto Recovery Tailwind
16 Auto Lending Is there a Bubble?

17 Auto Lending Is there a Bubble?
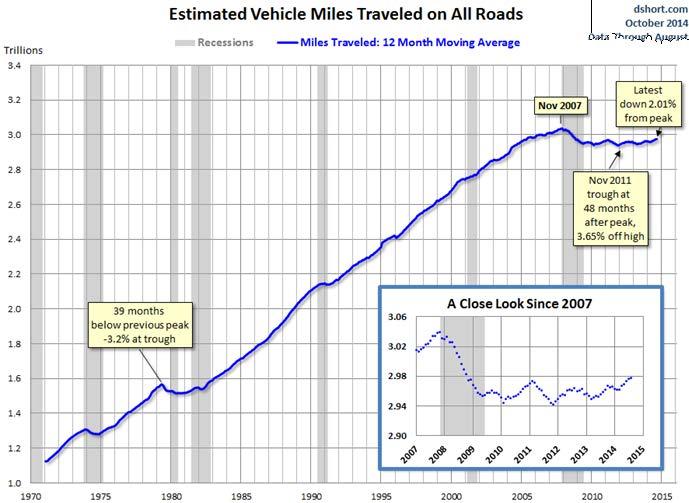
18 Normalized SAAR
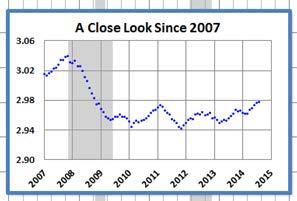
19 Normalized SAAR
 14.4 years 16.7 million cars Current fleet size Mileage consumption Average fleet age 250 million cars 12,500 yearly miles per car 11.")
20 Normalized SAAR Replacement SAAR Annual miles driven (in millions) Average vehicle scrap mileage Implied average life Normalized replacement demand 3,000,000 (3 trillion) 180,000 (includes totalled vehicles) 14.4 years 16.7 million cars Current fleet size Mileage consumption Average fleet age 250 million cars 12,500 yearly miles per car 11.4 years


21 The Automotive Gap Then (2008) Now (2015) Total Dealerships 20,000+ Total Dealerships 16,400 New Vehicle Sales 16,000,000 New Vehicle Sales 16,000,000 Units Per Dealer 800 Units Per Dealer 976
 Increase operating")

22 GPI Acquisition Strategy Over the past five years, GPI has purchased 89 franchises with expected annual revenues of $3.6 billion Purchase dealerships at 15-20% of revenues (excluding real estate and floorplan liabilities) Increase operating efficiency in areas such as used vehicle sourcing, advertising, purchasing, data processing, personnel utilization, and cost of floorplan financing Improving pre-tax margins to 2.5% results in an unlevered return of 10% Target 15% returns on acquisitions
23 Comparables Comparables Company Name Enterprise Value To EBITDA EBITDA Margin (3-Year Average) EBITDA Growth Price/ Earnings Total Debt to EBITDA Group 1 Automotive % 22.5% AutoNation % 11.1% Carmax % 19.9% Asbury Automotive Group % 17.7% Pensky Automotive Group % 16.7% Sonic Automotive % 1.3%
24 Valuation Revenue $ 7,476,100 $ 8,918,581 $ 9,937,889 $ 10,387,363 $ 10,857,889 $ 11,267,050 Cost of Sales $ 6,358,848 $ 7,626,035 $ 8,489,951 $ 8,871,099 $ 9,271,204 $ 9,619,675 Gross Margin $ 1,117,252 $ 1,292,546 $ 1,447,938 $ 1,516,265 $ 1,586,685 $ 1,647, % 14.49% 14.57% 14.60% 14.61% 14.62% Same Store Sales Growth 13.7% 6.2% 5.6% 4.5% 4.5% 3.8% Total Expenses 879,980 1,012,752 1,104,308 1,167,524 1,221,747 1,268,479 Tax % 25.5% 27.8% 23.6% 25.0% 25.0% 25.0% EPS $ 4.53 $ 4.96 $ 5.87 $ 7.05 $ 7.48 $ 7.85 (+) Improved of Brazilian Ops (+) Addt. Acquisition Accetion PF Cash EPS $ 7.52 $ 8.57 $ 9.61 P/E Multiple 15.0x 15.0x 15.0x Value Per Share $ $ $ (+) Cumulative Dividend Adj. Value Per Share $ $ $ % Premium to Current 37% 58% 77%

25 Conclusion Competition for Existing Units Barriers to Entry Maintenance CAPEX Returns on Capital Local Monopoly High.2% of Revenue High
26 Registered Investment Advisors 2103 Riverview Tower 900 South Gay Street Knoxville, Tennessee phone: (865)
Automotive Holdings Group Limited. Euroz Securities Rottnest Island Conference Bronte Howson Managing Director March 2008
 Automotive Holdings Group Limited Euroz Securities Rottnest Island Conference 008 Bronte Howson Managing Director March 008 Group Snapshot Largest Automotive Retailing & Logistics Group in Australia 0
Investor Presentation. May 16, 2017
 Investor Presentation May 16, 2017 FORWARD-LOOKING STATEMENTS 2 Certain information contained in this presentation looks forward in time and deals with other than historical or current facts for AutoCanada
Lazydays Holdings, Inc. Reports Third Quarter 2018 Financial Results
 News Contact: +1 (813) 204-4099 investors@lazydays.com Lazydays Holdings, Inc. Reports Third Quarter 2018 Financial Results Tampa, FL (November 8, 2018) Lazydays Holdings, Inc. ( Lazydays ) (NasdaqCM:
Record CY 2016 EPS-diluted-adjusted of $6.12, an increase of $1.10 Y-O-Y. Q EPS-diluted-adjusted of $1.28, a decrease of $0.11 Y-O-Y.
 1 2 3 Q4 2016 global deliveries up 0.1 million units year-over-year (Y-O-Y), a 3.3% increase. Volume gains primarily in North America and China, offset by reductions in International Operations (excluding
Lazydays Holdings, Inc. Reports Second Quarter 2018 Financial Results
 News Contact: +1 (813) 204-4099 investors@lazydays.com Lazydays Holdings, Inc. Reports Second Quarter 2018 Financial Results Tampa, FL (August 9, 2018) Lazydays Holdings, Inc. ( Lazydays )(NasdaqCM: LAZY)
ANNUAL FINANCIAL PROFILE OF AMERICA S FRANCHISED NEW-CAR DEALERSHIPS
 M I D Y E A R 2016 ANNUAL FINANCIAL PROFILE OF AMERICA S FRANCHISED NEW-CAR DEALERSHIPS NATIONAL AUTOMOBILE DEALERS ASSOCIATION Overview NADA Data now provides a biannual financial profile of new-car dealerships.
Valvoline Fourth-Quarter Fiscal 2016 Earnings Conference Call. November 9, 2016
 Valvoline Fourth-Quarter Fiscal 2016 Earnings Conference Call November 9, 2016 Forward-Looking Statements This presentation contains forward-looking statements within the meaning of Section 27A of the
Automotive Holdings Group Limited Macquarie Connections Conference
 Automotive Holdings Group Limited Macquarie Connections Conference Presented by: Bronte Howson Managing Director May 8 Group Snapshot Largest automotive retailing & logistics group in Australia Automotive
Preface Who Should Read This Book 3 Organization and Content 4 Acknowledgments 5 Contacting the Author 5 About the Author 5
 Preface.................................................................... 3 Who Should Read This Book 3 Organization and Content 4 Acknowledgments 5 Contacting the Author 5 About the Author 5 Table of
International Research Journal of Applied Finance ISSN Audit Practices for Automobile Dealerships
 Audit Practices for Automobile Dealerships Paul C. Schauer Abstract One of the most important factors in a successful audit is a well-designed audit plan. The audit plan is a comprehensive process determining
ANNUAL FINANCIAL PROFILE OF AMERICA S FRANCHISED NEW-CAR DEALERSHIPS
 2015 ANNUAL FINANCIAL PROFILE OF AMERICA S FRANCHISED NEW-CAR DEALERSHIPS NATIONAL AUTOMOBILE DEALERS ASSOCIATION Overview Steven Szakaly Chief Economist, NADA Patrick Manzi Senior Economist, NADA NADA
Gabelli & Company, Inc.
 One Corporate Center Rye, NY 10580-1422 Tel (914) 921-5216 Fax (914) 921-5098 www.gabelli.com March 1, 2004 Gabelli & Company, Inc. AutoNation (AN - $16.68 - NYSE) Earnings Dynamics FYE PMV EPS P/E 2006P
The US Auto Dealership Market: Size, Trends &Forecasts ( ) September 2018
 September 2018") The US Auto Dealership Market: Size, Trends &Forecasts (2018-2022) September 2018 The US Auto Dealership Market: Coverage Executive Summary and Scope Introduction/Market Overview The US Market Analysis
The US Auto Dealership Market: Size, Trends &Forecasts (2018-2022) September 2018 The US Auto Dealership Market: Coverage Executive Summary and Scope Introduction/Market Overview The US Market Analysis
Copyright 2016 Used Car University, all rights reserved
 Sourcing Winning SF Inventory 5 Keys to Success Shawn Foster 5 Keys to Success 1. Understand your data 2. Determine your needs 3. Know your lenders 4. Develop a strategy 5. Use discipline Copyright 2016
Powertrain. Aftermarket Support. Commercial Vehicles. Financial Services. Information Technology. July 2018 Page 4
 Page 2 This presentation may contain statements that are forward looking. These statements are based on current expectations and assumptions that are subject to risks and uncertainties, which may cause
Automotive Holdings Group Limited. Presentation May 2009
 Automotive Holdings Group Limited Presentation May 2009 Contents About AHG Third Quarter 2009 Performance AHG s strategic response to current economic climate Net Debt Position Automotive Logistics Outlook
General Overview of the Company April 2010
 General Overview of the Company April 2010 Forward-Looking Statements Certain of the information presented looks forward in time and deals with other than historical or current facts for AutoCanada Inc.
February Annual Results February 13, 2008
 February 2008 1 Annual Results February 13, 2008 AGENDA AGENDA 2007 Highlights 2007 Financial Results x Competitiveness Sales and products dynamic International 2008 Outlook February 2008 2 2007: performance
Monro, Inc. Second Quarter Fiscal 2019 Earnings Call. October 25, 2018
 Monro, Inc. Second Quarter Fiscal 2019 Earnings Call October 25, 2018 Safe Harbor Statement and Non-GAAP Measures Certain statements in this presentation, other than statements of historical fact, including
Bernstein Strategic Decisions Conference 2018
 Bernstein Strategic Decisions Conference 2018 Forward-Looking Statements Certain statements in this presentation, other than statements of historical fact, including estimates, projections, statements
FISCAL YEAR MARCH 2015 FIRST QUARTER FINANCIAL RESULTS. Mazda Roadster 25 th Anniversary Model
 FISCAL YEAR MARCH 2015 FIRST QUARTER FINANCIAL RESULTS Mazda Roadster 25 th Anniversary Model Mazda Motor Corporation July 31, 2014 1 PRESENTATION OUTLINE Highlights Fiscal Year March 2015 First Quarter
This presentation may contain statements that are forward looking. These statements are based on current expectations and assumptions that are
 This presentation may contain statements that are forward looking. These statements are based on current expectations and assumptions that are subject to risks and uncertainties, which may cause actual
MONRO MUFFLER BRAKE, INC. PROVIDES FOURTH QUARTER AND FISCAL 2017 FINANCIAL RESULTS
 CONTACT: John Van Heel Chief Executive Officer (585) 647-6400 Robert Gross Executive Chairman (585) 647-6400 FOR IMMEDIATE RELEASE Brian D Ambrosia Senior Vice President Finance Chief Financial Officer
Yixin Group Limited (2858.HK)
") Yixin Group Limited (2858.HK) Yixin Group (2858.HK) Auto dealers Rating NA Industry View NA Issue date 6 Nov 2017 Close app 9 Nov 2017 Listing date 16 Nov 2017 Offer price HKD6.60-7.70 Source: Company
Yixin Group Limited (2858.HK) Yixin Group (2858.HK) Auto dealers Rating NA Industry View NA Issue date 6 Nov 2017 Close app 9 Nov 2017 Listing date 16 Nov 2017 Offer price HKD6.60-7.70 Source: Company
Contents. Automotive Holdings Group Limited
 Automotive Holdings Group Limited Institutional Briefings Year End Results June Contents FY Highlights Corporate Statistics Group Performance Floorplan Financing Automotive Logistics Outlook Appendices
Company Overview and 2013 Second Quarter Highlights. September 2013
 Company Overview and 2013 Second Quarter Highlights September 2013 Presentation Agenda 1 COMPANY OVERVIEW 2 3 4 INDUSTRY OVERVIEW FINANCIAL REVIEW CAPITAL DEPLOYMENT 5 GROWTH OPPORTUNITIES 2 Forward-Looking
ANNUAL FINANCIAL PROFILE OF AMERICA S FRANCHISED NEW-CAR DEALERSHIPS
 2017 ANNUAL FINANCIAL PROFILE OF AMERICA S FRANCHISED NEW-CAR DEALERSHIPS NATIONAL AUTOMOBILE DEALERS ASSOCIATION Overview This latest NADA Data, our comprehensive financial profile of new-car dealerships,
FISCAL YEAR MARCH 2014 FINANCIAL RESULTS
 FISCAL YEAR MARCH 214 FINANCIAL RESULTS Mazda CX-5 Mazda Atenza Mazda Motor Corporation April 25, 214 New Mazda Axela 1 PRESENTATION OUTLINE Highlights Fiscal Year March 214 Results Fiscal Year March 215
Healthier Net Profit under Stronger IDR
 Investor Bulletin, First Half 2002 Healthier Net Profit under Stronger IDR As of June 2002, the consolidated revenue in USD increased by 32% y.o.y. Due to IDR strengthening against USD, in IDR revenue
CHUCK STEVENS. CFO, GM North America
 CHUCK STEVENS CFO, GM North America FORWARD LOOKING STATEMENTS In this presentation and in related comments by our management, our use of the words expect, anticipate, possible, potential, target, believe,
Pune Analyst Meet 2 nd August, Kirloskar Oil Engines Limited
 Kirloskar Oil Engines Ltd Pune Analyst Meet 2 nd August, 2008 Analyst Meet 02-08-08 Kirloskar Oil Engines Limited 1 Sl Contents Particulars Slide Number A FY 2007-08 Financial Results 3-18 B Business review
I remind you that our presentation is available on our website. We can start from the first 2 slides that show Piaggio Group First
 CONFERENCE CALL 2009 1 st HALF RESULTS Good afternoon and welcome to everybody. I remind you that our presentation is available on our website. We can start from the first 2 slides that show Piaggio Group
3Q 2016 Analyst Presentation
 3Q 2016 Analyst Presentation November 18, 2016 This presentation includes forward-looking statements. Actual future conditions (including economic conditions, energy demand, and energy supply) could differ
TABLE OF CONTENTS 0.0 EXECUTIVE SUMMARY INTRODUCTION... 3 What is this report about?... 3
 TABLE OF CONTENTS 0.0 EXECUTIVE SUMMARY... 1 1.0 INTRODUCTION... 3 What is this report about?... 3 The focus of the report is on financial services related to the sale of passenger cars to individuals......
Ford s E-Business Strategy
 Ford s E-Business Strategy May 10, 2000 Ed Davis Brandt Allen 1 Why would anyone buy a car on the web? What sort of person? What sort of car? What are the risks? What s Ford s E-Business Strategy? 2 What
JM FAMILY OVERVIEW. JM Family Enterprises. Southeast Toyota Distributors Established: World Omni Financial Corp.
 COMPANY OVERVIEW JM FAMILY OVERVIEW JM Family Enterprises JM Family Enterprises, Inc. is a leader in the automotive industry. JM Family s primary focus includes vehicle distribution and retail vehicle
GMP CEO Day Presentation October 2013
 GMP CEO Day Presentation October 2013 Presentation Agenda 1 COMPANY OVERVIEW 2 3 4 INDUSTRY OVERVIEW FINANCIAL REVIEW CAPITAL DEPLOYMENT 5 GROWTH OPPORTUNITIES 2 Forward-Looking Statements Certain of the
Interim results June 30, 2003
 1 Interim results June 30, 2003 2 In units W orldwide sales at June 30 (cars and light commercial vehicles) > Worldwide sales at June 30, 2003: 1,689,200 cars and light commercial vehicles, versus 1,656,900
EXANE BNP PARIBAS 13th European Seminar June 8, 2011
 EXANE BNP PARIBAS 13th European Seminar June 8, 2011 This presentation may contain forward-looking statements. Such forward-looking statements do not constitute forecasts regarding the Company s results
Conférence d Automne - Cheuvreux. Paris, September 26 th, 2011
 Conférence d Automne - Cheuvreux Paris, September 26 th, 2011 This presentation may contain forward-looking statements. Such forward-looking statements do not constitute forecasts regarding the Company
2018 Q3 results. Millicom International Cellular S.A. Cable expansion accelerating. Mauricio Ramos, CEO Tim Pennington, CFO October 24 th, 2018
 2018 Q3 results Cable expansion accelerating Mauricio Ramos, CEO Tim Pennington, CFO October 24 th, 2018 Millicom International Cellular S.A. Disclaimer This presentation may contain certain forward-looking
Stronger Fundamental and Excellent Growth
 Investor Bulletin, First Half 2004 Stronger Fundamental and Excellent Growth For the first six months of 2004, PT United Tractors Tbk (UT/Company) recorded consolidated net revenue of IDR 4.29 trillion,
282m 75% +575m. Net sales Operating income before non-recurring items. Operating margin before non-recurring items. Net Loss.
 First-Half 2009 Financial Highlights Net sales Operating income before non-recurring items Operating margin before non-recurring items Net Loss Net debt-to-equity ratio Free cash flow** 7,134m 282m 4.0%
Automotive Retail Industry Update March 2012
 Integrity Expertise Results John Hill hill@hydeparkcapital.com (813) 383-0205 John McDonald mcdonald@hydeparkcapital.com (813) 383-0206 Automotive Retail Industry Update March 2012 Keith Hodgdon Senior
MARKET UPDATE & ECONOMIC OUTLOOK
 MARKET UPDATE & ECONOMIC OUTLOOK Economic Expansion Accelerates For the Moment Growth surged in Q2 from average 2.1% pace over prior 14 quarters; best quarter since 2014 10.0 Real Gross Domestic Product
Company Overview and Q Quarterly Highlights November 2012
 Company Overview and Q3 2012 Quarterly Highlights November 2012 Senior Management Team Pat Priestner Chief Executive Officer Tom Orysiuk President Steve Rose Executive Vice President, Corporate Services
INCREASING SALES FOR MINING RELATED BUSINESS
 Investor Relations of PT UNITED TRACTORS Tbk INCREASING SALES FOR MINING RELATED BUSINESS In the first half 2001, the Company managed to record increase in net revenue from IDR 2.32 trillion to IDR 3.54
Driven NADA MANAGEMENT SERIES. ATD Performance Measurement 2017
 Driven NADA MANAGEMENT SERIES TD08 ATD Performance Measurement 2017 The National Automobile Dealers Association (NADA) has prepared this management guide to assist its dealer members in being as efficient
Gabelli & Company, Inc. 32 nd Automotive Aftermarket Symposium November 4, Page 1
 Gabelli & Company, Inc. 32 nd Automotive Aftermarket Symposium November 4, 2008 Page 1 Forward Looking Statements The Company claims the protection of the safe-harbor for forward-looking statements contained
MONRO MUFFLER BRAKE, INC. ANNOUNCES FOURTH QUARTER AND FISCAL 2015 FINANCIAL RESULTS
 CONTACT: John Van Heel Chief Executive Officer (585) 647-6400 Robert Gross Executive Chairman (585) 647-6400 Catherine D Amico Executive Vice President Finance Chief Financial Officer (585) 647-6400 Investors:
FISCAL YEAR MARCH 2015 FIRST HALF FINANCIAL RESULTS. New Mazda Demio
 FISCAL YEAR MARCH 2015 FIRST HALF FINANCIAL RESULTS New Mazda Demio Mazda Motor Corporation October 31, 2014 1 PRESENTATION OUTLINE Highlights Fiscal Year March 2015 First Half Results Fiscal Year March
SOLLERS IFRS RESULTS
 SOLLERS IFRS RESULTS 2017 03.05.2018 2 1. 2017 SOLLERS STRATEGIC DEVELOPMENTS 2. RUSSIAN AUTOMOTIVE MARKET OVERVIEW 3. SOLLERS OPERATING AND FINANCIAL PERFORMANCE IN 2017 4. SOLLERS JOINT VENTURES RESULTS
Stephens Inc. Conference
 Stephens Inc. Conference November 2007 Safe Harbor Statement This presentation includes forward-looking statements within the meaning of Section 27A of the Securities Act and Section 21E of the Exchange
1 st Half 2018 Results. August 1 st, 2018
 1 st Half 2018 Results August 1 st, 2018 H1 HIGHLIGHTS & CATEGORY SPOTLIGHTS Gonzalve BICH 2 First Half 2018 Key Messages Challenging market and business environment Continued investment in targeted Brand
PETROBRAS ARGENTINA S.A.
 PETROBRAS ARGENTINA S.A. Fiscal Year 2014 Results Buenos Aires, February 4, 2015 Petrobras Argentina S.A. (Buenos Aires: PESA NYSE: PZE) announces the results for fiscal year ended December 31, 2014. Petrobras
Volvo Group THIRD QUARTER 2015 JAN GURANDER. Volvo Group Headquarters Third quarter
 Volvo Group THIRD QUARTER 2015 JAN GURANDER 1 VOLVO GROUP Third quarter highlights NET SALES SEK bn 12 months 310 bn IMPROVED PROFITABILITY ON FLAT VOLUMES UNDERLYING OPERATING MARGIN 6.9% 67 73 OPERATING
Corporate Communications. Media Information 15 March 2011
 15 March 2011 BMW Group aims to further increase earnings in 2011 EBIT margin of over 8% expected in Automobiles segment Sales volume of well in excess of 1.5 million vehicles targeted Margin of 8% to
Performance Indicators - Q3 2005/6 - Restatements in red
 Performance Indicators - Q3 2005/6 - Restatements in red Description Page Profit & Loss 1 External Revenue by Segment 2 External Revenue Analysis / Sales Order Value 3 External Revenue Analysis - BT Retail
Federated States of Micronesia
 IMF Country Report No. 13/17 Federated States of Micronesia 2012 ARTICLE IV CONSULTATION 2012 Statistical Appendix January 29, 2001 January 29, 2001 This Statistical Appendix paper for the Federated States
NYSE: CGI
 NYSE: CGI www.celadongroup.com Forward-Looking Statement Disclaimer This presentation, including documents incorporated herein by reference, will contain forward-looking statements within the meaning of
The Economic Impact of Franchised New Vehicle Dealers on the Colorado Economy
 The Economic Impact of Franchised New Vehicle Dealers on the Colorado Economy Sponsored by: Colorado Automobile Dealers Association Covering Economic Impacts for 2007 INTRODUCTION BACKGROUND This report
Strong performance by the Bolloré Group s operating activities in 2018 Mr Cyrille Bolloré unanimously appointed Chairman and Chief Executive Officer
 PRESS RELEASE 2018 results (1) March 14, 2019 Strong performance by the Bolloré Group s operating activities in 2018 Mr Cyrille Bolloré unanimously appointed Chairman and Chief Executive Officer Revenue:
Outlook for Franchised New Car Dealers
 1 Outlook for Franchised New Car Dealers Fourteenth Annual Automotive Outlook Symposium June 1, 2007 Paul Taylor, Ph.D., Chief Economist National Automobile Dealers Association, McLean, VA www.nada.org
AUTUMN CONFERENCE CHEUVREUX Paris. Cheuvreux Conference - Paris
 AUTUMN CONFERENCE CHEUVREUX Paris September 25 juillet 20 th, 2012 1 This presentation does not constitute an offer to sell, or a solicitation of an offer to buy, PEUGEOT SA ( Company ) shares. This presentation
Aftermarket Trends: What will Drive Future Aftermarket Repair Opportunities in North America?
 Aftermarket Trends: What will Drive Future Aftermarket Repair Opportunities in North America? Mark Seng Global Aftermarket Practice Leader July 29, 2014 - Vehicles - Powertrains - Technology & How the
2003 fourth quarter and full-year results
 Dinesh Paliwal Member of Group Executive Committee, Head of Automation Technologies Division 2003 fourth quarter and full-year results Automation Technologies Copyright 2003 ABB. All rights reserved. -
BlueScope Steel Limited Consolidated Financial Headlines
 BlueScope Steel Limited Consolidated Financial Headlines 2003 2004 2005 2006 2007 2008 2009 2010 2011 2012 2013 2013 2013 2014 2014 2014 2015 2015 2015 2016 2016 2016 2017 2017 2017 2018 2018 2018 Total
MONRO, INC. ANNOUNCES SECOND QUARTER FISCAL 2018 FINANCIAL RESULTS
 CONTACT: Brett Ponton Chief Executive Officer (585) 647-6400 FOR IMMEDIATE RELEASE Brian D Ambrosia Senior Vice President Finance Chief Financial Officer (585) 647-6400 Investors and Media: Effie Veres
Statistical tables S 0. Money and banking. Capital market. National financial account. Public finance
 Statistical tables Money and banking Page S South African Reserve Bank: Liabilities... 2 South African Reserve Bank: Assets... 3 Corporation for Public Deposits: Liabilities... 4 Corporation for Public
Fact Sheet for Q April 22, 2016
 Fact Sheet for Q1 2016 April 22, 2016 Contents Daimler Group Stock Market Information 3 Earnings and Financial Situation 4-13 Information for Divisions Mercedes-Benz Cars 14-17 Daimler Trucks 18-22 Mercedes-Benz
PT Astra International Tbk 2012 Half Year Financial Statements
 To: Business Editor For immediate release PT Astra International Tbk 2012 Half Year Financial Statements The following announcement was issued today by the Company s 72%-owned subsidiary, Jardine Cycle
FY 2017 Results. Disclaimer: Jardine Cycle & Carriage accepts no liability whatsoever with respect to the use of this document or its contents.
 FY 2017 Results Disclaimer: Jardine Cycle & Carriage accepts no liability whatsoever with respect to the use of this document or its contents. FINANCIAL HIGHLIGHTS Financial Highlights Underlying earnings
National Alliance of Buy Here, Pay Here Dealers (NABD) 2180 North Loop West, Suite 270 Houston, Texas
 2180 North Loop West, Suite 270 Houston, Texas") BUY HERE, PAY HERE INDUSTRY BENCHMARKS/TRENDS - 2011 - CONTRIBUTORS: www.bhphinfo.com www.sgcaccounting.com www.ncm20.com www.subanalytics.com www.subanalytics.com National Alliance of Buy Here, Pay Here
BUY HERE, PAY HERE INDUSTRY BENCHMARKS/TRENDS - 2011 - CONTRIBUTORS: www.bhphinfo.com www.sgcaccounting.com www.ncm20.com www.subanalytics.com www.subanalytics.com National Alliance of Buy Here, Pay Here
Q3 & 9M 2018 Results Presentation. October 24 th, 2018
 Q3 & 9M 2018 Results Presentation October 24 th, 2018 Q3 & 9M HIGHLIGHTS & CATEGORY SPOTLIGHTS Gonzalve BICH 3Q and 9M 2018 Results Presentation 2 9 Months 2018 Key Messages Continued challenging trading
Q3 and Q1-Q3Q preliminary results
 MOL Hungarian Oil and Gas Company Q3 and Q1-Q3Q3 2005 preliminary results November 11,, 2005 Disclaimer "This presentation and the associated slides and discussion contain forward-looking statements. These
Proposed acquisition of Areva Distribution. December 2, 2009
 Proposed acquisition of Areva Distribution December 2, 2009 Disclaimer All forward-looking statements are Schneider Electric management s present expectations of future events and are subject to a number
2016 Annual Results Presentation. March 15, 2017
 2016 Annual Results Presentation March 15, 2017 Frank Chan 2 2016 Full Year Results (US$ m) 2015 2016 Change Local Curr Sales $5,038 $5,480 +8.8% +9.8% Gross Profit $1,798 $1,985 +10.4% Gross Margin %
MBM Resources Berhad. 17 th Annual General Meeting 14 June 2011 The Learning Academy, Federal Auto Holdings Berhad, Glenmarie
 MBM Resources Berhad 17 th Annual General Meeting 14 June 2011 The Learning Academy, Federal Auto Holdings Berhad, Glenmarie 1 Agenda 1) Corporate Structure 2) 2010 Performance 3) Group Corporate Developments
ANNUAL FINANCIAL PROFILE OF AMERICA S FRANCHISED NEW-CAR DEALERSHIPS
 ANNUAL FINANCIAL PROFILE OF AMERICA S FRANCHISED NEW-CAR DEALERSHIPS 2014 www./nadadata Overview NADA Data 2014 the annual financial profile of America s franchised new-car dealerships shows a robust and
Performance Indicators - Q4 2005/6
 Performance Indicators - Q4 2005/6 Description Page Profit & Loss 1 External Revenue by Segment 2 External Revenue Analysis / Sales Order Value 3 External Revenue Analysis - BT Retail External Revenue
Morgans Queensland Conference 2014
 Morgans Queensland Conference 2014 Financial Trends North American : Australian Automotive Retail Ticker Company Market Cap P/E Ratio AN Auto Nation US $6.3bn 16 PAG Penske Automotive Group US $3.8bn
FISCAL YEAR MARCH 2018 FIRST QUARTER FINANCIAL RESULTS
 FISCAL YEAR MARCH 2018 FIRST QUARTER FINANCIAL RESULTS PRESENTATION OUTLINE Highlights Fiscal Year March 2018 First Quarter Results Fiscal Year March 2018 Full Year Forecast Structural Reform Stage 2 Progress
Jaguar Land Rover Results For the quarter ended 30 June August 2015
 Jaguar Land Rover Results For the quarter ended 30 June 2015 7 August 2015 1 Disclaimer Statements in this presentation describing the objectives, projections, estimates and expectations of Jaguar Land
FRANCHISES MASTER-SHEET INDICATION OF THE ADDED 40% ANNUAL ROYALTIES TAX ASSOCIATION. INCOME
 FRANCHISES MASTER-SHEET INDICATION OF THE ADDED 40% ANNUAL ROYALTIES TAX ASSOCIATION. INCOME YEAR 1 YEAR 2 YEAR 3 YEAR 4 YEAR 5 SALES 50955844 53503636 56178817 58987757 LESS: COST OF GOODS SOLD (52%)
TOFAŞ RESULTS WEBCAST PRESENTATION
 TOFAŞ 31.12.2017 RESULTS WEBCAST PRESENTATION 02.02.2018 AGENDA Highlights Turkish Automotive Industry Production Domestic Market Developments Tofaş Domestic Market Performance Export Markets & Tofaş Performance
JAGUAR LAND ROVER RESULTS FOR THE THREE MONTHS ENDED 31 DECEMBER th FEBRUARY 2017
 JAGUAR LAND ROVER RESULTS FOR THE THREE MONTHS ENDED 31 DECEMBER 2016 14 th FEBRUARY 2017 DISCLAIMER Statements in this presentation describing the objectives, projections, estimates and expectations of
Investor Presentation. March 2017
 Investor Presentation March 2017 Disclaimer During this presentation management may discuss certain forwardlooking statements concerning Nemak s future performance that should be considered as good faith
Annual Report on National Accounts for 2015 (Benchmark Year Revision of 2011) Summary (Flow Accounts)
 Summary (Flow Accounts)") Annual Report on National Accounts for 2015 (Benchmark Year Revision of 2011) Summary (Flow Accounts) I. Overview of Benchmark Year Revision of 2011 P 2 II. Expenditure Series P 3 III. Income Series P
Annual Report on National Accounts for 2015 (Benchmark Year Revision of 2011) Summary (Flow Accounts) I. Overview of Benchmark Year Revision of 2011 P 2 II. Expenditure Series P 3 III. Income Series P
BMW Group posts record earnings for 2010
 10.03.2011 BMW Group posts record earnings for 2010 Profit before tax rises to euro 4,836 million Profit before financial result climbs to euro 5,094 million Automobiles segment reports EBIT of euro 4,355
Months Investor Presentation
 2018 9 Months Investor Presentation 25.10.2018 Disclaimer Ereğli Demir Çelik Fabrikaları T.A.Ş. (Erdemir) may, when necessary, make written or verbal announcements about forward-looking information, expectations,
Results for the Three Months ended June 30, 2018
 Reference Translation Results for the Three Months ended June 30, 2018 July 31, 2018 AUTOBACS SEVEN CO., LTD. FY March 2019 Consolidated P/L Profit Loss/Gain: Net sales and gross profit decreased, and
SAA Financial Results 2008/09. Building on Restructuring
 SAA Financial Results 2008/09 Building on Restructuring 1 Content 1. Industry, Strategic and Operational Overview 2. Financial Overview 3. Conclusion and Way Forward 2 Industry Overview The airline industry
The Growth of UK Motor Finance. Richard Jones Managing Director Black Horse, Lloyds Banking Group. 8 April 2016
 The Growth of UK Motor Finance Richard Jones Managing Director Black Horse, Lloyds Banking Group 8 April 2016 ABOUT BLACK HORSE Introduction Overview Market Position Key Partners UK market leading non-captive
FISCAL YEAR MARCH 2014 FIRST HALF FINANCIAL RESULTS. New Mazda Axela (Overseas name: New Mazda3)
") FISCAL YEAR MARCH 2014 FIRST HALF FINANCIAL RESULTS New Mazda Axela (Overseas name: New Mazda3) Mazda Motor Corporation October 31, 2013 1 PRESENTATION OUTLINE Highlights Fiscal Year March 2014 First Half
FISCAL YEAR MARCH 2014 FIRST HALF FINANCIAL RESULTS New Mazda Axela (Overseas name: New Mazda3) Mazda Motor Corporation October 31, 2013 1 PRESENTATION OUTLINE Highlights Fiscal Year March 2014 First Half
PETROBRAS ARGENTINA S.A.
 PETROBRAS ARGENTINA S.A. Second Quarter 2015 Results Buenos Aires, July 30, 2015 Petrobras Argentina S.A. (Buenos Aires: PESA NYSE: PZE) announces the results for the second quarter ended June 30, 2015.
American Railcar Industries, Inc.
 American Railcar Industries, Inc. Exhibit 99.2 Q3 2017 Supplemental Information Investor Contact: 636.940.6000 Website: americanrailcar.com Forward Looking Disclaimer Safe Harbor Statement This presentation
A2A-LGH Partnership. Milan, September 8 th, Borsa Italiana Italian Infrastructure Day
 A2A-LGH Partnership Milan, September 8 th, 2016 Borsa Italiana Italian Infrastructure Day Partnership Rationale PARTNERSHIP CRITERIA PARTNERSHIP OPPORTUNITIES Territorial leadership Territorial investments
Money and banking. Flow of funds for the third quarter
 Statistical tables Money and banking Page S South African Reserve Bank: Liabilities... 2 South African Reserve Bank: Assets... 3 Corporation for Public Deposits: Liabilities... 4 Corporation for Public