LARGE TRUCK ORIGIN/DESTINATION SURVEY
|
|
|
- Amie Cannon
- 6 years ago
- Views:
Transcription


1 NEW JERSEY DEPARTMENT OF TRANSPORTATION New Jersey Department of Transportation LARGE TRUCK ORIGIN/DESTINATION SURVEY NJ Department of Transportation Bureau of Trucking Services
2 NEW JERSEY DEPARTMENT OF TRANSPORTATION BUREAU OF FREIGHT SERVICES US ROUTE 206 AND US ROUTE 202/NJ ROUTE 31 LARGE TRUCK ORIGIN/DESTINATION SURVEY I. INTRODUCTION STUDY PURPOSE AND NEED Located within one of the most densely populated, richest consumer markets in the world, and home to the largest maritime port on the east coast (the Newark/Elizabeth Seaport complex), New Jersey represents a key region in the national goods movement logistics chain. The goods movement industry represents a major component of the regional and statewide economy, providing hundreds of thousands of jobs for New Jersey residents. However, the economic vitality that goods movement represents comes at a price. At some point in their travels between production centers and points of consumption, virtually all goods are transported by truck. The truck transport component may be lengthy (crosscountry) or short (local distribution between a warehouse and a retail outlet). However necessary, whether long distance of local distribution, trucks moving along local and regional roadways have an impact of transportation network operations, mobility, and the quality of life throughout New Jersey. This condition remains even after the goods have been consumed. One often overlooked component of the goods movement logistics chain is the need to dispose of the residual waste that is created by each and every resident and business. Not every roadway or community is affected to the same extent. Areas that are primarily residential in character typically experience lesser truck activity levels than areas characterized by dense industrial, commercial or retail development. Further, neighborhoods along or adjacent to local and regional arterial roadways are typically affected to a greater extent that rural, more secluded locations. It is certainly understandable when specific communities express concerns related to the nature and extent of trucking activity on the local roadways that affect their daily lives. The key question to be asked may be paraphrased as: Is it really necessary for the trucks traveling along a particular roadway to be there, or are there reasonable alternative travel paths available for use by these trucks. In preparation for the adoption of new regulations governing the movement of 102-inch wide trucks in New Jersey, NJDOT has launched an initiative that will closely monitor the volume and patterns of large truck movements throughout the state over the next 5 years. The new regulations have been designed to require 102-inch wide trucks to utilize the National Network to the greatest extent possible when making their trip. This 5 year program will provide NJDOT with much needed data on the volume and patterns of trucks along key freight corridors. Page 1
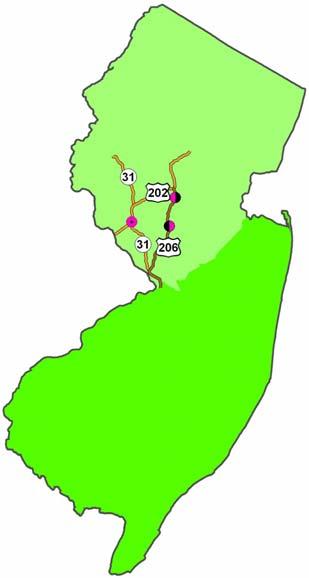
3 As a mechanism for addressing the key question above, as well as provide additional data to inform the decision making process, the New Jersey Department of Transportation commissioned a face-to-face interview survey of large trucks traveling along US Route 206 in Hillsborough, Somerset County, New Jersey, and along US Route 202/NJ Route 31 in West Amwell, Hunterdon County, New Jersey. These two roadway corridors are locations where concerns about large trucks have historically been raised. The primary purposes of this survey effort were to: Establish a baseline of truck volumes and origin/destination patterns in advance of the adoption of the new statewide regulation governing operations of 102-inch wide trucks. Identify how many of the trucks traveling along these roadways would be affected by the pending regulations. Quantify the proportion of large trucks that have a legitimate local business need to utilize these roadways versus how many are utilizing these roadways for through trips. Determine the potential for diverting longer-distance through trips away from these local arterials onto the national highway network. It is anticipated that additional surveys will be conducted at these and other locations in the future to assess the effectiveness of these new regulations. Page 2
4 II. LARGE TRUCK REGULATORY CONTEXT Regulations which were enacted in 1999 and were in effect at the time of the survey (Fall of 2007) restricted 102-inch wide standard trucks and double trailer truck combinations from making through trips (trips that do not have an origin or destination within New Jersey) to specific roadways. This regulation was codified in the New Jersey Administrative Code, 16: CHAPTER 32 TRUCK ACCESS SUBCHAPTER 1 DESIGNATED ROUTES FOR DOUBLE-TRAILER TRUCK COMBINATIONS AND 102-INCH WIDE STANDARD TRUCKS 16: Purpose: This chapter outlines the standards and procedures applicable to double-trailer truck combinations and 102-inch wide standard truck operations within the State of New Jersey with regard to permitted routes, width restrictions, length requirements, access to terminals and other facilities, and appeal procedures. The purpose of this chapter is to protect the public interest by assuring that specified vehicles are operated on suitable roadways. The 1999 regulations generally restricted 102-inch wide and double-trailer trucks from using state highways that have physical characteristics that detract from suitability to be included in the truck network. When making a trip that does not include a local delivery of pick-up, these trucks are generally permitted to travel up to two miles from the national network to facilities providing food, fuel, rest and repairs. However, they were restricted from doing so using highways, roads, streets, public alleys or other thoroughfares that cannot safely accommodate a truck wider than 96 inches as designated by the NJDOT. The 1999 truck regulations were challenged, with a lower court ruling that New Jersey's truck routing rules violated the provisions of the Commerce Clause of the U.S. Constitution. This decision was subsequently upheld by the U.S. Third Circuit Court of Appeal. Under the direction of Governor Jon S. Corzine, this decision was raised to the U.S. Supreme Court, which declined to hear the appeal on October 2, Current New Jersey Department of Transportation rules apply the routing requirements equally to both interstate and intrastate 102-inch wide standard trucks and double-trailer truck combinations. These rules were developed through consultation with a truck task force, chaired by the Commissioner of Transportation, consisting of affected constituency groups, including the League of Municipalities, the North Jersey Transportation Planning Authority, the New Jersey State Police and the New Jersey Motor Truck Association. These rules, as adopted, appeared in the January 22, 2008 New Jersey Register, where they were effective upon publication. In summary, these rules state that large trucks are permitted to use the New Jersey Network as well as the National Network regardless of their origin and destination, with a provision that they utilize the most direct route between their origin and destination. The New Jersey Network consists of roadways secondary to the National Network. These roadways often traverse populated areas (both residential and commercial), and include such key roadways as US Route 9, NJ Route 31, US Route 130, US Route 206 and US Route 202. While trucks traveling through New Jersey are generally required to utilize the national network and designated roadways, the new regulations focus on allowing reasonable access to Page 3
5 terminals and other facilities. This extends to the consideration of a route s reasonableness for use even if the origin or destination of the trip is outside of New Jersey in nearby portions of Pennsylvania and New York State. Currently, there is no mechanism in place by which the effects of the revised truck regulations may be quantified and assessed. To address this shortcoming, a face-to-face truck interview survey program was developed to clarify the travel patterns of large trucks along key roadways, and to quantify the number of large trucks that may be affected by the new regulations. Page 4
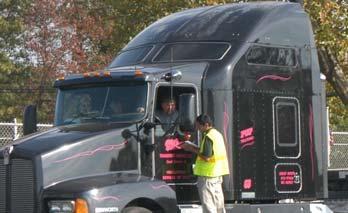
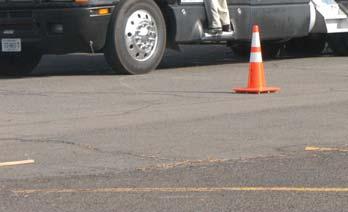
6 III. SURVEY METHODOLOGY A strict, detailed survey methodology was developed for implementation to ensure: Delays to the truck drivers was minimized. The highest proportion of trucks possible was captured. Collected data was consistent and reproducible. Traffic control plans compliant with the Manual on Uniform Traffic Control Devices (MUTCD) were developed for each survey location to ensure the safety of the survey personnel and the motoring public. These plans incorporated advanced signage directing tractor trailers to exit the roadway and enter a channelized lane within the survey area. The approach to the survey area will be limited to a single travel lane. A traffic director (state police) will direct large trucks (96 or wider) to enter the work area. The work areas have been configured to provide space for a minimum of four trucks with trailers. Surveyors will conduct the face-to-face interviews within a designated zone which will be protected by impact attenuation vehicles and cones. Within the lane, the trucks were brought to a stop, where survey technicians measured the truck and posed a list of pre-prepared questions to the driver. In addition to the formal questions, the surveyors took photographs of each truck and recorded additional information obtainable from the truck via brief visual inspection. The process was designed to be completed in approximately 60 seconds per interviewed vehicle. The survey form utilized in the survey process is depicted on Figure 1. Driver interviews were conducted from the driver s side of the vehicle. Each surveyor was provided with a binder of survey forms and instructions. Following is a summary of the process followed for each interview: 1. Approach the truck only after it has come to a complete stop. 2. Offer a friendly greeting. 3. Brief explanation of the survey. For example, We are conducting a brief survey to identify the travel patterns of large trucks in New Jersey in an effort to better understand the needs of the trucking industry and concerns of the public. The survey is only a few questions and should take about 1 minute. 4. Ask the listed questions in order. 5. Do not engage in excess discussion. If the driver has difficulty understanding or answering a question, skip to the next question and leave the previous response blank. 6. If the driver behaves or speaks in an inappropriate manner, simply say Thank you for your time and step away from the truck. Notify the State Police Trooper on site of the incident. 7. Upon completion of the interview, offer a closing Thank You for your help with the survey and step away from the truck. 8. Resume your assigned position and await the next vehicle. Page 5
7 NEW JERSEY DEPARTMENT OF TRANSPORTATION TRUCK ORIGIN / DESTINATION SURVEY 9. The State Troopers on the site assumed exclusive control in directing trucks into and out of the survey area. While a wide array of data were collected, emphasis was placed upon obtaining detailed information related to the drivers trip origin(s) and destination(s). As a mechanism for reducing and analyzing the survey responses, each survey form was coded and entered into a MSAccess Database. This database allowed tabulation of a wide array of statistics, and extraction of key patterns and trends exhibited by the surveyed truck drivers. Figure 1 Sample Survey Form Page 6
8 IV. SURVEY LOCATION US ROUTE 206 Survey Site Description The first roadway identified for observations through the survey was US Route 206 in Montgomery Township and Hillsborough Township. Due to limitations presented by the physical space needed to conduct the surveys, the survey of trucks traveling along northbound and southbound US Route 206 was conducted in two separate locations. On October 23, 2007, from 7:00 AM to 5:00 PM, the northbound trucks diverted from the highway onto Bridgepoint Road in Belle Mead, while the southbound trucks were diverted into the former Veterans Administration Supply Depot property located south of Brown Avenue in Hillsborough. These locations are depicted on Figures 2 through 4 below. Figure 2 US Route 206 Survey Locations Northbound: MP 59.0 Montgomery Twp Southbound: MP 68.3 Hillsborough Southbound Survey Site Northbound Survey Site Page 7
9 Figure 3 US Route 206 Northbound Survey Detour MP 59.0 Survey Site Figure 4 US Route 206 Southbound Survey Detour MP 68.3 Survey Site Page 8
10 Pre-Survey Traffic Volumes Data US Route 206 As a preliminary assessment prior to conducting the actual survey of large trucks, existing and available data were assembled and reviewed to determine: the overall magnitude of traffic volumes on the survey corridors; percentage of large trucks in the traffic stream; and hourly distribution patterns of the large truck flows. These data were applied in identifying the survey location, designing a survey staging area with adequate space for queuing of trucks, and determining the appropriate staffing level for each survey location. Table 1 summarizes the assembled traffic count and vehicle classification data at various locations along the US Route 206 corridor near the northbound survey location. As shown in the table, large truck volumes are substantially lower along the Route 206 corridor than along the Route 31 corridor. On average, large trucks comprised approximately 2 percent of the total traffic volumes. During the survey period, approximately 10 large trucks travel in each direction during each hour. Table 1 Vehicle Classification Count Summary US Route 206 Timeframe 6-7 years prior to O/D survey MP/ Source Township / Location Date(s) Direction Weekday Averages TOTAL Cars and Lt Trucks Large Trucks * Lg Trk %age MP 59.5 Montgomery Twp. Apr NB 8,311 7, % Automatic Vehicle (just south to SB 8,919 8, % Class. of Opussum Rd) Sep TOTAL 17,230 16, % 2 Years Prior to O/D survey 9 Months Prior to O/D survey Fall time of O/D survey 1 Year after O/D survey MP 56.6 Princeton Twp. Nov. 11, 2005 NB 11,682 9, % Class. By Tubes Arreton Rd. SB 11,360 9, % (east of Ewing St.) TOTAL 23,042 19, % MP 55.8 Princeton Twp. Jan. 30, 2007 NB 11,210 10, % Class. By Hilltop Dr to SB 10,416 9, % (near Ewing St.) Feb. 1, 2007 TOTAL 21,626 20, % MP 59.5 Montgomery Twp. Oct. 19, 2007 NB 8,960 8, % Portable (just south to SB 8,572 8, % Weigh-in-Motion of Opussum Rd) Dec. 12, 2007 TOTAL 17,532 16, % MP 59.5 Montgomery Twp. Oct. 1, 2008 NB 9,469 9, % Weigh-in-Motion (just south to SB 9,175 8, % of Opussum Rd) Oct. 23, 2008 TOTAL 18,644 17, % * Large Trucks = Class 8 and larger Survey Day Traffic Volumes In addition to the historic count information, traffic volume and classification data was collected during the week of the actual survey effort. These data were reviewed to ensure that the survey was conducted on a day when total travel demand and the proportion of trucks were consistent with typical operations. Page 9
11 During the survey period, a total of 93 northbound US Route 206 tractor-trailer trucks were stopped and surveyed. Due to safety considerations and space limitations within the survey area, 4 Trucks bypassed the site and were not surveyed. The total volume of traffic, including trucks, was heavier in the southbound direction than in the northbound direction. During the survey period, 193 southbound US Route 206 tractor-trailer trucks were stopped and surveyed. A total of 22 trucks were allowed to bypass the site and were not surveyed. Figures 5 and 6 depict the hourly proportion of trucks surveyed. Page 10
12 40 35 Figure 5 Proportion of Trucks Surveyed US-206 Northbound Northbound Survey Count Trucks Not Surveyed Trucks Surveyed AM 8-9 AM 9-10 AM AM PM 12-1 PM 1-2 PM 2-3 PM 3-4 PM 4-5 PM 5-5:30 PM Figure 6 Proportion of Trucks Surveyed US-206 Southbound Southbound Survey Count Trucks Not Surveyed Trucks Surveyed AM 8-9 AM 9-10 AM AM PM 12-1 PM 1-2 PM 2-3 PM 3-4 PM 4-5 PM 5-5:30 PM Page 11
13 V. SURVEY FINDINGS - US ROUTE 206 The survey of tractor trailers was conducted along US Route 206 described above on October 23, The survey period encompassed daylight hours only, with interviews being conducted from approximately 7:30 AM to 5:00 PM. The surveys were conducted in the two locations described above. Northbound traffic was surveyed in Montgomery Township at the intersection of US Route 206 and Bridge Point Road. Southbound traffic was surveyed in Hillsborough Township at the Veterans Industrial Park (formerly the Veterans Administration Supply Depot). The primary purpose of this survey was two fold: To understand the large truck traffic on the US Route 206 corridor and estimate the proportion of the truck traffic that has a purpose being on 206 (i.e.: What proportion of the truck traffic along this roadway would be affected by the pending large truck regulations). Weigh in Motion ( WIM ) traffic volume and vehicle classification data was extracted and reviewed for the week covering the survey day. The daily traffic volumes and proportion of trucks in the traffic stream were compared on a day to day basis to ensure that the survey day traffic flows were typical. The WIM data were further utilized to quantify the total volume of trucks along the surveyed roadway, and the proportion of trucks captured in the interviews. Key findings in the comparison of typical daily traffic patterns along US Route 206 northbound between 7:00 AM and 5:00 PM are summarized in Table 2. Table 2 Daily Weekday Volume from WIM Station US Route 206 MP 59.0 (Northbound Survey Location) Large Trucks Average Daily Truck Volume: 106 (1.7% of total traffic) Daily Truck Volume Standard Deviation: ± 16 (15.1%) Range in Daily Truck Volume: ± 26-51% Peak Truck Volume period: 9:00 Am through 1:00 PM Cars Average Daily Automobile Volume: 5,811 Daily Automobile Volume Standard Deviation: ± 321 (5.5%) Range in Daily Automobile Volume: 4,508 6,408 ± 10-22% Peak Automobile Volume Period: NB (7:00-8:00AM), SB (5:00-6:00PM) In addition to validating the survey day as being typical, the assembled data were analyzed to determine the hourly volume of trucks captured in the survey versus the typical hourly volumes. Key comparisons on an hourly basis are depicted on Figures 7 and 8 for the northbound and southbound survey locations, respectively. Page 12
14 Figure 7 Average Hourly Weekday Large Truck Volume Compared to Survey Day with one standard deviation vertical bars US Route 206 Northbound 20 Note the high degree of variation Northbound Average Hourly Weekday Volume Survey Time Wkdy Avg Survey Day Oct Page 13
15 Figure 8 Average Hourly Weekday Large Truck Volume Compared to Survey Day with one standard deviation vertical bars US Route 206 Southbound 20 Note the high degree of variation Southbound Average Hourly Weekday Volume Survey Time Wkdy Avg Survey Day Oct Survey Findings Once it was determined that the total traffic volumes, hourly distribution and proportion of trucks in the traffic stream during the survey day were reflective of typical conditions, the responses to the survey questions were entered into a MS-Access database for statistical analysis. The primary focus of the analysis was placed upon the responses to survey questions 5 through 8 relating to the trip origin, destination and interim stops/activity. The truck trip origin/destination analysis focused primarily upon the responses to the questions regarding the trucks previous and next stops. Prior to discussing these key findings, a number of additional findings from the analysis of the survey responses were found to be pertinent to the understanding of truck activity along the surveyed roadways. One of the key statistics extracted from the survey responses and was the distribution of truck types and dimensions (primarily width) of the trucks traveling through the survey area. During Page 14
16 the survey process, the type of truck was noted along with a measurement of the width of the truck itself. Truck types were aggregated into six (6) categories, with the distribution of truck types at the US Route 206 survey locations summarized in Figure 9. Also included in Figure 13 is a summary of the width of the trucks surveyed. Figure 9 Distribution of Truck Types and Dimensions US Route 206 Northbound and Southbound >=102 < Includes 6 repeats ~ 2/3rds are >= Container Van Flatbed Tanker Dump Other The width of the truck is a key consideration in whether or not the pending large truck regulations would be applicable to a particular vehicle. The regulations will only apply to trucks in excess of 96-inches in width. During the survey process, each truck was physically measured to determine its width. As summarized in Figure 13, of the total trucks surveyed, 199 of the 292 trucks, or approximately 68 percent, would potentially be governed by the pending regulations. The nature of the individual trips, most notably their points of origin and/or destination, would determine just how many of these 199 trucks (6 of them were repeat local trips) would be regulatable, and could be diverted onto an alternative travel route utilizing the Interstate system. Page 15

17 While not directly applicable to the regulation of trucks and the roadways they travel upon, drivers were queried as to whether or not they were currently loaded, partially loaded or empty. The proportion of loaded vs. non-or partially loaded trucks are summarized on Figure 10. Figure 10 Proportion of Loaded vs. Empty trucks US Route 206 Queries were also posed as to the type of commodity they were currently (or if empty, were previously) carrying. Figure 11 summarizes the distribution of commodity types being transported by truck along US Route 206. Page 16
18 Figure 11 Distribution of Commodity Types 20.7% 6.5% 0.4% 2.0% 17.9% Petrochemical Trash/Solid waste Scrap Metal/Recycling Retail Goods Food Stuffs Industrial Products Construction Material 13.0% 39.0% As detailed previously, the pending truck regulations will only be applicable to trucks 102- inches in width or double-trailer trucks. Along the US Route 206 corridor, approximately 63 percent of the large trucks fall into this category and would be potentially regulatable. Key to the determination of the applicability of the regulations comes down to the individual truck trip origins and destinations, and whether there is a direct need for the trucks to utilize the US Route 206 corridor. The responses to survey questions 5 through 8 were tabulated and analyzed to determine just how many of the trucks would potentially be affected by the regulations. Table 3 summarizes the origin/destination patterns of the surveyed trucks, with the patterns summarized graphically on Figure 12. Page 17
19 Table 3 Truck Trip Origin/Destination Patterns US Route 206 Local: NJ North: NJ South: Phila Metro: External North: External South: Mercer and Somerset Counties Middlesex, Hunterdon and all counties north thereof Monmouth and all counties south thereof Philadelphia, Bucks, Montgomery and Delaware Counties New York, New England, Eastern Canada rest of Pennsylvania, Delaware and all other states west and south Color coding to match Figures 12 through 15 Greens NJ (shades distinguish Local, North and South, Phila Metro) Orange Trips with one end in NJ or Phila Metro, but NOT in Local area Red External-External trips: those potentially subject to regulation Total Trucks NB Local NJ North NJ South Phila Metro External North Exteral South Total Local NJ North NJ South Phila Metro External North Exteral South Total SB Local NJ North NJ South Phila Metro External North Exteral South Total Local NJ North NJ South Phila Metro External North Exteral South Total s: Subject to Regulation NB Local NJ North NJ South Phila Metro External North Exteral South Total Local NJ North NJ South Phila Metro External North Exteral South Total SB Local NJ North NJ South Phila Metro External North Exteral South Total Local NJ North NJ South Phila Metro External North Exteral South Total Several key findings emerged from the tabulation and analysis of the survey responses. A total of 180 (62.9 percent) of the 286 trucks surveyed were 102-inch wide trailers. Regulations apply to 102-inch wide trailer and tandem trucks, and do not affect 96-inch wide single trailer trucks. Page 18
20 Of the inch wide trucks surveyed, 128 (71.1 percent) had either an origin or a destination (or both) within the local area. These trucks are serving local businesses and industries and are therefore not subject to regulation. The regulations include a reasonableness test that is particularly applicable when addressing trips that have an origin or a destination just outside of the New Jersey state border. A total of inch wide trucks (23.3 percent) had origins and/or destinations outside of the immediate local area, but within New Jersey or the Philadelphia metropolitan area. These trucks are also not subject to regulation. Of the inch wide trailer trucks surveyed, 10 (5.6 percent) did not have an origin or a destination in the local, New Jersey or nearby Pennsylvania area. These 10 trucks, or approximately 3.5-percent of the total trucks surveyed along the US Route 206 corridor, are affected by the new regulations. This equates to less than 1 truck per hour being subject to the current regulations during the typical day. Figure 12 Northbound and Southbound Origins / Destinations NB 4.3% 1.1% Trips with Origin or Destination in the Local Area 102s & 96s SB 3.1% 0.5% Trips with Origin or Destination in the Local Area 102s & 96s Through trips to/from other NJ &PhilaMetro102s Through trips to/from other NJ &PhilaMetro102s 6.5% Through trips to/from other NJ &PhilaMetro96s External 102s 5.7% 11.4% Through trips to/from other NJ &PhilaMetro96s External 102s 21.5% External 96s External 96s 66.7% 79.3% NB + SB 14.7% 3.5% 0.7% 5.9% Trips with Origin or Destination in the Local Area 102s & 96s Through trips to/from other NJ &PhilaMetro102s Through trips to/from other NJ &PhilaMetro96s External 102s External 96s 75.2% Page 19
21 Drivers were queried regarding their choice of travel routes. As borne out by the data, and verified by the drivers, a majority of the trucks had little or no choice in the route driven due to their trip origins and/or destinations. The truly external through trips being made by the 102- inch trailers (those that did not have an origin or a destination along the corridor, or in nearby areas), provided several different responses as to why they were raveling along the US Route 206 corridor. Typically, these drivers were not driving a regular route, and had picked up a contract load for transport, and had only been provided with information related to the pick-up and a drop-off point. Most indicated that they were utilizing portable GPS systems for navigation and that the identified routing was the most direct and reasonable route. These systems were typically purchased in a retail outlet, and were not tailored to identify designated truck routes. Following is a series of maps (Figures 13 through 16) depicting the observed and recorded origin/destination patterns of the trucks along the US Route 206 corridor in the survey area. Page 20
22 Figure 13 Local Origin/Destination to/from all (Trips with at least one trip end in Mercer or Somerset County) To the north 36% 29% 7% 14% local 8% 9% 8% To the south 17% Page 21
23 Figure 14 Through Local Area to/from elsewhere in the Region (Trips with one or both trip ends in NJ or Philly Metro area) Under 1% not shown 4% 5% 4% 2% 1% 2% Page 22
24 Figure 15 External to the Region Origin/Destination (Trips traversing through NJ and Philly Metro region) 4% Page 23
25 Figure 16 Number of 102 Truck Trips Potentially subject to regulation (23 trips with one trip end non-local & the other External to the Region And 10 trips traversing through NJ and Philly Metro region) trips of 1 truck not shown Page 24
26 Figure 17 Distribution of Northbound Origins and Destinations By Municipalities Page 25
27 Figure 18 Distribution of Southbound Origins and Destinations By Municipalities Page 26
28 Summary of Key Findings US Route 206 Truck Patterns Subsequent to coding and entering the survey responses into the database, a number of key findings emerged. 1. Total of 312 trucks observed, of which 286 trucks were surveyed: (93 NB and 193 SB) NB Figure 19 SB NB surveyed >= 102 NB surveyed < 102 NB not surveyed SB surveyed >= 102 SB surveyed < 102 SB not surveyed Page 27
29 2.a. 2.b. 215 trucks, or 75%, had either an origin or a destination in the local area: Mercer or Somerset County. an additional 26 trucks had an origin or destination in Hunterdon; for a total of 241 or 84%. 3.a 59 (21%) of the trucks had a stop elsewhere in New Jersey or the Philadelphia Metro area, of these 42 (14.7%) were 102s 3b. of those 102s 23 (8%) had one trip end outside the region. 3c. of the remaining 102s 10 (3.5%) had no stop in NJ or the Phila Metro area. 3c. Therefore the total potential regulated trips accounted for only 33 (11.5%) of the total of 286. Fig 20 NB + SB 3.5% 0.7% Trips with Origin or Destination in the Local Area 102s & 96s Through trips to/from other NJ &PhilaMetro102s 5.9% Through trips to/from other NJ &PhilaMetro96s 14.7% External 102s External 96s 75.2% Page 28
30 4. Only 9 Trucks reported an origin or destination in Eastern Canada (Ontario or Quebec) Of those, 5 (1.7%) were 102s. 2 had local destinations. 3 (1%) were through moves (item 3 c above) of 193 (63%) of Southbound Trucks surveyed reported a destination in Hillsborough or Belle Meade NJ, therefore only 71 had destinations further south. The number observed by video travelling southbound at the northbound survey location was 119. This shows some trucks (approximately 50) originated south of the southbound survey location. The count is verified by the match to the WIM count located nearby. Table 4 Top Destinations Southbound Hillsborough, NJ 102 Belle Meade, NJ 20 Trenton, NJ 9 Philadelphia, PA 7 Baltimore, MD 5 Morrisville, PA 3 Princeton, NJ 3 Burlington, NJ 2 Fairless Hills, PA 2 Somerville, NJ 2 Top Destinations Northbound Hillsborough, NJ 25 Belle Meade, NJ 15 Bridgewater, NJ 4 Of the 5 trucks destined for Baltimore, MD, only 3 were 102s; 1 originated in Bridgewater, NJ, 2 were through moves. Page 29
31 VI. SURVEY LOCATION US ROUTE 202/NJ ROUTE 31 Survey Site Description The survey of trucks traveling along both the northbound and southbound directions of US Route 202/NJ Route 31 was conducted on November 8 th,2007from6:45amto4:45pm.the specific location of the survey was within the town of West Amwell, Hunterdon County, approximately midway between the intersections of CR 602 (Wertsville Road) and CR 514 (Old York Road). This location is depicted on Figures 19 and 20 below. Figure 21 US-202/NJ-31 Survey Locations: US-202: MP 6.4 East Amwell Township Survey Site Figure 22 US-202/NJ-31 Survey Detours Southbound Site Northbound Site Page 30
32 Pre Survey Data- Traffic Counts As part of the overall truck data collection program, existing and available data were assembled and reviewed to determine: the overall magnitude of traffic volumes on the survey corridors; percentage of large trucks in the traffic stream; and hourly distribution patterns of the large truck flows. These data were applied in identifying the survey location, designing a survey staging area with adequate space for queuing of trucks, and determining the appropriate staffing level for each survey location. Table 5 AM Peak Hour NB Large Truck Survey Period PM Peak Hour NB AM Peak Hour SB Large Truck Survey Period PM Peak Hour SB Route 31/202 Northbound; MP March 2007 Weekday Average Cars + Lt. Trucks Heavy Trucks TOTAL Rte Rte 31 Rte 202 Rte Rte 31 Rte 202 Rte Rte 31 Rte :00-1:00 am :00-2: :00-3: :00-4: :00-5: :00-6: :00-7: , :00-8:00 1, , :00-9:00 1, , :00-10: :00-11: :00-12: :00-1:00 pm :00-2: :00-3: :00-4: :00-5: :00-6: , :00-7: :00-8: :00-9: :00-10: :00-11: :00-12: Hr TOTAL 12,751 6,268 6, ,098 7,276 6,822 Survey Period 9,974 4,711 5, ,004 5,477 5,527 Route 31/202 Southbound; MP March 2007 Weekday Average Cars + Lt. Trucks Heavy Trucks TOTAL SB Rte Rte 31 Rte 202 Rte Rte 31 Rte 202 Rte Rte 31 Rte :00-1:00 am :00-2: :00-3: :00-4: :00-5: :00-6: :00-7: :00-8: :00-9: , :00-10: :00-11: :00-12: :00-1:00 pm :00-2: :00-3: :00-4: :00-5:00 1, , :00-6:00 1, , :00-7:00 1, , :00-8: :00-9: :00-10: :00-11: :00-12: Hr TOTAL 12,048 6,240 5, ,698 7,393 6,305 Survey Period 8,849 4,954 3, ,029 5,795 4,234 Page 31
33 In July of 2007 an average of 723 large trucks (Vehicle Classifications 8 thru 13) traveled southbound along NJ Route 31 (at MP 13.0) on a typical weekday. This volume represents an average of 8.9% large trucks in the total traffic stream. Of the 723 large trucks, 478 were recorded between the hours of 6:00 AM and 6:00 PM. Truck volumes remained relatively stable throughout the survey period, with approximately 40 large trucks each hour, or one truck every 90 seconds. Similar patterns were observed on the northbound side of the roadway. Survey Day Traffic Volumes In addition to the historic count information, traffic volume and classification data was collected during the week of the actual survey effort. These data were reviewed to ensure that the survey was conducted on a day when total travel demand and the proportion of trucks were consistent with typical operations. During the survey period, a total of 514 tractor-trailer trucks were stopped and surveyed. Due to safety considerations and limited space within the survey area, a total of 440 trucks bypassed the site and were not surveyed. The percentage of hourly truck volumes captured in the survey ranged from 37% to 82%, as depicted on Figures 21 and 22 below. Figure 23 Proportion of Trucks Surveyed US Route 202/NJ Route 31 Northbound Northbound Surveys Trucks Not Surveyed Trucks Surveyed AM 7-8 AM 8-9 AM 9-10 AM AM PM 12-1 PM 1-2PM 2-3PM 3-4PM 4-5PM Page 32
34 Figure 24 Proportion of Trucks Surveyed US Route 202/NJ Route 31 Southbound Southbound Surveys Trucks Not Surveyed Trucks Surveyed AM 7-8 AM 8-9 AM 9-10 AM AM PM 12-1 PM 1-2 PM 2-3 PM 3-4 PM 4-5 PM Page 33
35 VII. SURVEY FINDINGS US ROUTE 202 / NJ ROUTE 31 The survey of tractor trailers was conducted along US Route 202/NJ Route 31 described above on November 8, The survey period encompassed daylight hours only, with interviews being conducted from approximately 6:45 AM to 4:45 PM. The surveys were conducted in the two locations described above. Both directions were surveyed in West Amwell Township midway between the intersections of CR 602 (Wertsville Road) and CR 514 (Old York Road). The primary purpose of this survey was two fold: To understand the large truck traffic on the US Route 202/NJ Route 31 corridor and estimate the proportion of the truck traffic that has a purpose being on the corridor (i.e.: What proportion of the truck traffic along this roadway would be affected by the pending large truck regulations). Weigh in Motion ( WIM ) traffic volume and vehicle classification data was extracted and reviewed for the week covering the survey day at nearby locations along US Route 202/NJ Route 31. The daily traffic volumes and proportion of trucks in the traffic stream were compared on a day to day basis to ensure that the survey day traffic flows were typical. The WIM data were further utilized to quantify the total volume of trucks along the surveyed roadway, and the proportion of trucks captured in the interviews. Key findings in the comparison of typical daily traffic patterns are summarized in Table 4. Table 6 Weekday Volume from WIM Stations 7:00 AM to 5:00 PM NJ Route 31 MP 13.0 and US Route 202 MP 3.5 Large Trucks NJ Route 31 - Average: 1, % of total traffic 14,424 US Route202 - Average: % of total traffic 13,159 Combined - Average: 1, % of total traffic 27,583 Cars Average: 24,703 Total: 27,853 (included light-medium trucks and buses) Directional split of total traffic South of survey NJ-31 / US % / 48% North of survey NJ-31 / US % / 65% In addition to validating the survey day as being typical, the assembled data were analyzed to determine the hourly volume of trucks captured in the survey versus the typical hourly volumes. Key comparisons on an hourly basis are depicted on Figures 23 and 24 for the northbound and southbound survey locations, respectively. Page 34
36 Figure 25 Average Hourly Weekday Large Truck Volume Compared to Survey Day with one standard deviation vertical bars NJ ROUTE 31 / US ROUTE 202 Northbound Survey Time Lg Trucks Avg Total Nov 8 Surveyed Northbound Note the high degree of variation Page 35
37 Figure 26 Average Hourly Weekday Large Truck Volume Compared to Survey Day with one standard deviation vertical bars NJ ROUTE 31 / US ROUTE 202 Southbound Survey Time Lg Trucks Avg Total Nov 8 Surveyed Southbound Note the high degree of variation Page 36
38 Survey Findings Once it was determined that the total traffic volumes, hourly distribution and proportion of trucks in the traffic stream during the survey day were reflective of typical conditions, the responses to the survey questions were entered into a MS-Access database for statistical analysis. The primary focus of the analysis was placed upon the responses to survey questions 5 through 8 relating to the trip origin, destination and interim stops/activity. The truck trip origin/destination analysis focused primarily upon the responses to the questions regarding the trucks previous and next stops. Prior to discussing these key findings, a number of additional findings from the analysis of the survey responses were found to be pertinent to the understanding of truck activity along the surveyed roadways. One of the key statistics extracted from the survey responses and was the distribution of truck types and dimensions (primarily width) of the trucks traveling through the survey area. During the survey process, the type of truck was noted along with a measurement of the width of the truck itself. Truck types were aggregated into six (6) categories, with the distribution of truck types at the US Route 202/NJ Route 31 survey locations summarized in Figure 25. Also included in Figure 25 is a summary of the width of the trucks surveyed. Figure 27 Distribution of Truck Types and Dimensions US ROUTE 202 / NJ ROUTE 31 Northbound and Southbound >=102 <102 Just under 58% are >= Container Van Platform Tanker Dump Other The width of the truck is a key consideration in whether or not the pending large truck regulations would be applicable to a particular vehicle. The regulations will only apply to trucks in excess of 96-inches in width. During the survey process, each truck was physically Page 37

39 measured to determine its width. As summarized in Figure 25, of the total trucks surveyed, 297 of the 514 trucks, or approximately 58 percent, would potentially be governed by the pending regulations. The nature of the individual trips, most notably their points of origin and/or destination, would determine just how many of these 297 truck would be regulatable, and could be diverted onto an alternative travel route utilizing the Interstate system. While not directly applicable to the regulation of trucks and the roadways they travel upon, drivers were queried as to whether or not they were currently loaded, partially loaded or empty. The proportion of loaded vs. non-or partially loaded trucks are summarized on Figure 26. Figure 28 Proportion of Loaded vs. Empty trucks NJ ROUTE 31 / US ROUTE 202 Queries were also posed as to the type of commodity they were currently (or if empty, were previously) carrying. Figure 27 summarizes the distribution of commodity types being transported by truck along US Route 202 / NJ Route 31. Page 38
40 Figure 29 Distribution of Commodity Types 16.6% 4.3% 5.5% 1.8% 8.2% Petrochemical Trash/Solid waste Scrap Metal/Recycling Retail Goods Food Stuffs Industrial Products Construction Material 24.0% 19.1% As detailed previously, the pending truck regulations will only be applicable to trucks 102- inches in width or double-trailer trucks. Along the US Route 202 / NJ Route 31 corridor, approximately 58 percent of the large trucks fall into this category and would be potentially regulatable. Key to the determination of the applicability of the regulations comes down to the individual truck trip origins and destinations, and whether there is a direct need for the trucks to utilize the US Route 202 / NJ Route 31 corridor. The responses to survey questions 5 through 8 were tabulated and analyzed to determine just how many of the trucks would potentially be affected by the regulations. Table 5 summarizes the origin/destination patterns of the surveyed trucks. Page 39
41 Table 7 Truck Trip Origin/Destination Patterns US Route 202 / NJ Route 31 Local: NJ North: NJ South: PA Southeast: External North: External South: Mercer, Somerset, Hunterdon and Bucks Counties Middlesex, Warren and all counties north thereof Monmouth and all counties south thereof Philadelphia, Montgomery, Delaware & Lehigh, Northampton Counties New York, New England, Eastern Canada rest of Pennsylvania, Delaware and all other states west and south Color coding to match Figures 30 through 34 Greens NJ (shades distinguish Local, North and South, PA Southeast) Orange Trips with one end in NJ or PA Southeast, but NOT in Local area Red External-External trips: those potentially subject to regulation Total Trucks NB Local NJ North NJ South PA Southeast External North Exteral South Total Local NJ North NJ South PA Southeast External North Exteral South Total SB Local NJ North NJ South PA Southeast External North Exteral South Total Local NJ North NJ South 0 PA Southeast 0 External North Exteral South Total s: Subject to Regulation NB Local NJ North NJ South PA Southeast External North Exteral South Total Local NJ North NJ South PA Southeast External North Exteral South Total SB Local NJ North NJ South PA Southeast External North Exteral South Total Local NJ North NJ South 0 PA Southeast 0 External North Exteral South Total Several key findings emerged from the tabulation and analysis of the survey responses. A total of 297 (57.8 percent) of the 514 trucks surveyed were 102-inch wide trailers. Regulations apply to 102-inch wide trailer and tandem trucks, and do not affect 96-inch wide single trailer trucks. Of the inch wide trucks surveyed, 177 (59.6 percent) had either an origin or a destination (or both) within the local area. These trucks are serving local businesses and Page 40
42 industries and are therefore not subject to regulation. The regulations include a reasonableness test that is particularly applicable when addressing trips that have an origin or a destination just outside of the New Jersey state border. A total of inch wide trucks (34.3 percent) had origins and/or destinations outside of the immediate local area, but within New Jersey or the nearby southeastern Pennsylvania area. These trucks are also not subject to regulation. Of the inch wide trailer trucks surveyed, 18 (6.1 percent) did not have an origin or a destination in the local, New Jersey or nearby southeastern Pennsylvania area. These 18 trucks, or approximately 3.5-percent of the total trucks surveyed along the US Route 202 / NJ Route 31 corridor, are affected by the new regulations. This equates to approximately 1.5 trucks per hour being subject to the current regulations during the typical day. Figure 30 Northbound and Southbound Origins / Destinations NB 4.0% 0.4% Trips with Origin or Destination in the Local Area 102s & 96s SB 3.1% 0.8% Trips with Origin or Destination in the Local Area 102s & 96s Through trips to/from other NJ & Southeast PA 102s Through trips to/from other NJ & Southeast PA 102s 17.9% Through trips to/from other NJ & Southeast PA 96s External 102s 10.3% Through trips to/from other NJ & Southeast PA 96s External 102s 15.6% External 96s External 96s 24.2% 53.6% 70.2% NB + SB 3.5% 0.6% Trips with Origin or Destination in the Local Area 102s & 96s Through trips to/from other NJ & Southeast PA 102s 14.0% Through trips to/from other NJ & Southeast PA 96s External 102s 19.8% External 96s 62.1% Page 41
43 Drivers were queried regarding their choice of travel routes. As borne out by the data, and verified by the drivers, a majority of the trucks had little or no choice in the route driven due to their trip origins and/or destinations. Those that did not have an origin or a destination along the corridor, or in nearby areas, provided several different responses as to why they were on the roadway. Typically, these drivers were not driving a regular route, and had picked up a contract load for transport, and had only been provided with information related to the pick-up and a drop-off point. Most indicated that they were utilizing portable GPS systems for navigation. These systems were typically purchased in a retail outlet, and were not tailored to identify designated truck routes. Therefore, the drivers utilized the US Route 202 / NJ Route 31 corridor for through trips, even though sections of their travel placed them on roadways not necessarily suitable for large trucks. Following is a series of maps (Figures 31 through 34) depicting the observed and recorded origin/destination patterns of the trucks along the US Route 202 / NJ Route 31 corridor in the survey area. Page 42
44 Figure 31 Local Origin/Destination to/from all (Trips with at least one trip end in Mercer, Somerset, Hunterdon, Bucks Counties) To the north 22% 16% 6% 18% local 8% 8% 6% To the south 14% Page 43
45 Figure 32 Through Local Area to/from elsewhere in the Region (Trips with one or both trip ends in NJ or PA bordering NJ area) Under 1% not shown 2% 4% 3% 2% 7% 3% 4% 6% Page 44
46 Figure 33 External to the Region Origin/Destination (Trips traversing through NJ or PA bordering NJ area) 4% Page 45
47 Figure 34 Number of 102 Truck Trips Potentially subject to regulation (53 trips with one trip end non-local & the other External to the Region And 18 trips traversing through NJ or PA bordering region) trips of 1 truck not shown Page 46
48 Figure 35 Distribution of Northbound Origins and Destinations By Municipalities Page 47

49 Figure 36 Distribution of Southbound Origins and Destinations By Municipalities Page 48
50 Summary of Key Findings US Route 202 / NJ Route 31 Truck Patterns Subsequent to coding and entering the survey responses into the database, a number of key findings emerged. 1. Total of 514 trucks surveyed (252 NB and 262 SB) 297 (146 NB and 151 SB) were102s (about 58%) Figure 37 NB SB NB surveyed >= 102 NB surveyed < 102 NB not surveyed SB surveyed >= 102 SB surveyed < 102 SB not surveyed Page 49
51 2.a 245 (48%) trucks had BOTH an origin or destination in the local area (Mercer, Hunterdon, Somerset, Bucks Co, PA). 2.b 319 (62%) trucks had on origin or destination in the local area (Mercer, Hunterdon, Somerset, Bucks Co, PA). 3.a an additional 174 trucks (33.8%) had either an origin or a destination elsewhere in New Jersey or Southeastern Pennsylvania for a total of 495 trucks, or 96%. Of the 495, 328 were 102s Of the 174, 101 (19.6% of the total of 514) were 102s 3.b 21 Trucks (4%) had no stop in New Jersey or nearby Pennsylvania counties Of those, only 18 (3.5%) were 102s NB + SB 3.5% 0.6% Figure 38 Trips with Origin or Destination in the Local Area 102s & 96s 14.0% Through trips to/from other NJ & Southeast PA with BOTH tripsendsinregion102s 10.3% Through trips to/from other NJ & Southeast PA with ONE trip end in region 102s Through trips to/from other NJ & Southeast PA 96s 9.5% 62.1% External 102s External 96s Page 50
52 4. Northbound 5 (2%) Trucks were headed to Eastern Canada (Ontario or Quebec) Of those, 3 (1.2%) were 102s 2 were coming from nearby PA 1 was a through move from MD Southbound 3 Trucks originated in Eastern Canada (Quebec) Of those, all 3 (1.1%) were 102s 2 were headed to Bucks Co, PA 1wasathroughmovetoMD 5. Trucks utilizing the US Route 202 / NJ Route 31 corridor have origins and destinations farther afield from the local area than those on US-206. The top origins and destinations in each direction are: Table 8 Origins NB Philadelphia, PA 29 Trenton, NJ 12 Morrisville, PA 11 SB Flemington, NJ 39 Clinton, NJ 9 Phillipsburg, NJ 7 North Branch, NJ 6 Parsippany, NJ 6 Destinations Flemington, NJ 35 Parsippany, NJ 10 Phillipsburg, NJ 9 Bethlehem, PA 7 Newark, NJ 6 Whitehouse, NJ 6 Philadelphia, PA 23 Bensalem, PA 17 Morrisville, PA 13 Trenton, NJ 13 Fairless Hills, PA 12 Lambertville, NJ 11 Bristol, PA 6 Lawrenceville, NJ 6 Tullytown, PA 6 Warminster, PA 6 Burlington, NJ 5 Langhorne, PA 5 Pennington, NJ 5 Doylestown, PA 4 Hatfield, PA 4 Page 51


53 VIII. SUMMARY AND CONCLUSIONS While extensive and detailed data were assembled through the conduct of the truck origin/destination survey, a key finding is that only a relatively small proportion of the trucks utilizing the local highways will be affected by the pending regulations. The new regulations incorporate consideration of the reasonableness of the route for use by trucks dependent upon the origin and/or destination of the trip. While the specific language of the regulations requires truck to enter and exit the state utilizing the US Interstate system, the reasonableness test may easily be applied to those trips that have origins and/or destinations in areas immediately adjacent to New Jersey (ex: Bucks County, PA). While technically having out-ofstate origins and destinations, these trips would be considered approved for the use of roadways such as the US Route 202 corridor. As identified through the survey findings, a significant percentage of the existing truck trips along both US Route 206 and US Route 202 / NJ Route 31 have a local origin and/or destination, and would not be affected by the truck Route regulations, regardless of the width of the specific truck in question. On casual observation, recognizing whether a truck is a 96 or 102 is not immediately obvious. Which of these is a 96 and which is a 102? Although not obvious, the Shop Rite truck is 102 wide and the Coca-Cola truck is 96 wide. Of the 514 trucks surveyed along the US Route 202 / NJ Route 31 corridor, 272 were cargo vans of the type shown in the pictures above. Of these 272, 202 (74% of the vans, but only 39% of the total large trucks) were pulling 102 wide trailers, thus subject to the Large Truck regulations. Of the 514 total trucks surveyed, only 45 (9%) would be considered as external NJ through trips (with no local business in NJ). If we break down these truck trips even further, we find that only 35 trucks surveyed were 102 wide and were traversing through NJ. This represents only 7% of the total number of trucks surveyed along the US Route 202 / NJ Route 31 corridor. Only this small subset of trucks would be affected by the Large Truck regulations. If nearby PA is included as part of our local NJ region, these numbers drop even further. Only 20 (4%) trucks would be considered external NJ trips, of which 18 (or less than 3.5%) were 102 wide trailers. NOTE: Bucks County was considered local as per the recent court decision that required New Jersey to revise its Large Truck regulations. Page 52
54 Subsequent to implementation of the new regulations, conduct of a follow-up origin/destination survey would allow quantification of the exact effect of the regulations, and would provide the foundation for a focused consideration of additional steps that may be taken to facilitate goods movement and truck mobility while remaining sensitive to the concerns of the communities through which these trucks travel. Additional technologies and methods for collecting truck origin/destination data, and tracking compliance with the New jersey truck regulations are available and should be considered for application in the future. Weigh-in-Motion stations have been installed at numerous locations throughout New Jersey. Data obtained from these permanent count stations may be readily applied to track trends in the volume of large truck traffic along key highway corridors. As a supplement to this data collection system, portable EZ-Pass readers could be located at key locations throughout the state to record the passage of trucks, and allow determination of the vehicle s extent of travel along the corridor. With this (or a similar) process in place, compliance with the Statewide truck regulations would be readily monitored, with enforcement measures implemented as required. Page 53
55 APPENDIX A ORIGIN/DESTINATION TRENDS OF TRUCKS TRAVELING ALONG US-206 PageA-1

56 Figure A-1 US-206 Southbound Truck Origins and Destinations PageA-2

57 Figure A-2 US-206 Northbound Truck Origins and Destinations PageA-3
58 APPENDIX B ORIGIN/DESTINATION TRENDS OF TRUCKS TRAVELING ALONG US ROUTE 202 / NJ ROUTE 31 PageB-1


59 Figure B-1 US ROUTE 202 / NJ ROUTE 31 Southbound Truck Origins and Destinations PageB-2


60 Figure B-2 US ROUTE 202 / NJ ROUTE 31 Northbound Truck Origins and Destinations PageB-3
Southern Windsor County 2016 Traffic Count Program Summary April 2017
 Southern Windsor County 2016 Traffic Count Program Summary April 2017 The Southern Windsor County Regional Planning Commission (the RPC ) has been monitoring traffic at 19 locations throughout the southern
Alpine Highway to North County Boulevard Connector Study
 Alpine Highway to North County Boulevard Connector Study prepared by Avenue Consultants March 16, 2017 North County Boulevard Connector Study March 16, 2017 Table of Contents 1 Summary of Findings... 1
WIM #41 CSAH 14, MP 14.9 CROOKSTON, MINNESOTA APRIL 2014 MONTHLY REPORT
 WIM #41 CSAH 14, MP 14.9 CROOKSTON, MINNESOTA APRIL 2014 MONTHLY REPORT In order to understand the vehicle classes and groupings, the MnDOT Vehicle Classification Scheme and the Vehicle Classification
LARGE TRUCK MONITORING PROGRAM
 LARGE TRUCK MONITORING PROGRAM WIM Station Annual Report for 2008 Prepared for: NEW JERSEY DEPARTMENT OF TRANSPORTATION Bureau of Freight Services Prepared by: LARGE TRUCK MONITORING PROGRAM WIM Station
New Jersey Turnpike Authority Interchange 6 to 9 Widening Program
 New Jersey Turnpike Authority Interchange 6 to 9 Widening Program Tuesday, September 18, 2007 Public Hearings: Time: 5:00 PM - 8:00 PM Wednesday, September 19, 2007 Senior Center 3 Municipal Drive Bordentown,
Introduction and Background Study Purpose
 Introduction and Background The Brent Spence Bridge on I-71/75 across the Ohio River is arguably the single most important piece of transportation infrastructure the Ohio-Kentucky-Indiana (OKI) region.
The major roadways in the study area are State Route 166 and State Route 33, which are shown on Figure 1-1 and described below:
 3.5 TRAFFIC AND CIRCULATION 3.5.1 Existing Conditions 3.5.1.1 Street Network DRAFT ENVIRONMENTAL IMPACT REPORT The major roadways in the study area are State Route 166 and State Route 33, which are shown
WIM #31 US 2, MP 8.0 EAST GRAND FORKS, MN JANUARY 2015 MONTHLY REPORT
 WIM #31 US 2, MP 8.0 EAST GRAND FORKS, MN JANUARY 2015 MONTHLY REPORT WIM #31 EAST GRAND FORKS MONTHLY REPORT - JANUARY 2015 WIM Site Location WIM #31 is located on US 2 at mile post 8.0, southeast of
TRAFFIC IMPACT ANALYSIS
 TRAFFIC IMPACT ANALYSIS Emerald Isle Commercial Development Prepared by SEPI Engineering & Construction Prepared for Ark Consulting Group, PLLC March 2016 I. Executive Summary A. Site Location The Emerald
Transit City Etobicoke - Finch West LRT
 Delcan Corporation Transit City Etobicoke - Finch West LRT APPENDIX D Microsimulation Traffic Modeling Report March 2010 March 2010 Appendix D CONTENTS 1.0 STUDY CONTEXT... 2 Figure 1 Study Limits... 2
Transportation & Traffic Engineering
 Transportation & Traffic Engineering 1) Project Description This report presents a summary of findings for a Traffic Impact Analysis (TIA) performed by A+ Engineering, Inc. for the Hill Country Family
Truck Axle Weight Distributions
 Truck Axle Weight Distributions Implementation Report IR-16-02 Prepared for Texas Department of Transportation Maintenance Division Prepared by Texas A&M Transportation Institute Cesar Quiroga Jing Li
WIM #41 CSAH 14, MP 14.9 CROOKSTON, MINNESOTA MAY 2013 MONTHLY REPORT
 WIM #41 CSAH 14, MP 14.9 CROOKSTON, MINNESOTA MAY 2013 MONTHLY REPORT In order to understand the vehicle classes and groupings the Mn/DOT Vehicle Classification Scheme and the Vehicle Classification Groupings
RTID Travel Demand Modeling: Assumptions and Method of Analysis
 RTID Travel Demand Modeling: Assumptions and Method of Analysis Overall Model and Scenario Assumptions The Puget Sound Regional Council s (PSRC) regional travel demand model was used to forecast travel
Clean Harbors Canada, Inc.
 Clean Harbors Canada, Inc. Proposed Lambton Landfill Expansion Environmental Assessment Terms of Reference Transportation Assessment St. Clair Township, Ontario September 2009 itrans Consulting Inc. 260
Proposed location of Camp Parkway Commerce Center. Vicinity map of Camp Parkway Commerce Center Southampton County, VA
 Proposed location of Camp Parkway Commerce Center Vicinity map of Camp Parkway Commerce Center Southampton County, VA Camp Parkway Commerce Center is a proposed distribution and industrial center to be
WIM #37 was operational for the entire month of September Volume was computed using all monthly data.
 SEPTEMBER 2016 WIM Site Location WIM #37 is located on I-94 near Otsego in Wright county. The WIM is located only on the westbound (WB) side of I-94, meaning that all data mentioned in this report pertains
WIM #29 was operational for the entire month of October Volume was computed using all monthly data.
 OCTOBER 2015 WIM Site Location WIM #29 is located on US 53 near Cotton in St Louis county. System Operation WIM #29 was operational for the entire month of October 2015. Volume was computed using all monthly
APPENDIX C1 TRAFFIC ANALYSIS DESIGN YEAR TRAFFIC ANALYSIS
 APPENDIX C1 TRAFFIC ANALYSIS DESIGN YEAR TRAFFIC ANALYSIS DESIGN YEAR TRAFFIC ANALYSIS February 2018 Highway & Bridge Project PIN 6754.12 Route 13 Connector Road Chemung County February 2018 Appendix
1 On Time Performance
 MEMORANDUM: US 29 Travel Time & OTP To: From: Joana Conklin, Montgomery County DOT James A. Bunch, SWAI Subject: US 29 Travel Time and On Time Performance Analysis Date: This memorandum documents the US
Project Title: Using Truck GPS Data for Freight Performance Analysis in the Twin Cities Metro Area Prepared by: Chen-Fu Liao (PI) Task Due: 9/30/2013
 Task Due: 9/30/2013") MnDOT Contract No. 998 Work Order No.47 213 Project Title: Using Truck GPS Data for Freight Performance Analysis in the Twin Cities Metro Area Prepared by: Chen-Fu Liao (PI) Task Due: 9/3/213 TASK #4:
MnDOT Contract No. 998 Work Order No.47 213 Project Title: Using Truck GPS Data for Freight Performance Analysis in the Twin Cities Metro Area Prepared by: Chen-Fu Liao (PI) Task Due: 9/3/213 TASK #4:
EXECUTIVE SUMMARY. The following is an outline of the traffic analysis performed by Hales Engineering for the traffic conditions of this project.
 EXECUTIVE SUMMARY This study addresses the traffic impacts associated with the proposed Shopko redevelopment located in Sugarhouse, Utah. The Shopko redevelopment project is located between 1300 East and
King Soopers #116 Thornton, Colorado
 Traffic Impact Study King Soopers #116 Thornton, Colorado Prepared for: Galloway & Company, Inc. T R A F F I C I M P A C T S T U D Y King Soopers #116 Thornton, Colorado Prepared for Galloway & Company
WIM #40 is located on US 52 near South St. Paul in Dakota county.
 WIM Site Location WIM #40 is located on US 52 near South St. Paul in Dakota county. System Operation WIM #40 was operational for the entire month of November 2017. Volume was computed using all monthly
Interstate Operations Study: Fargo-Moorhead Metropolitan Area Simulation Output
 NDSU Dept #2880 PO Box 6050 Fargo, ND 58108-6050 Tel 701-231-8058 Fax 701-231-6265 www.ugpti.org www.atacenter.org Interstate Operations Study: Fargo-Moorhead Metropolitan Area 2015 Simulation Output Technical
Table of Contents INTRODUCTION... 3 PROJECT STUDY AREA Figure 1 Vicinity Map Study Area... 4 EXISTING CONDITIONS... 5 TRAFFIC OPERATIONS...
 Crosshaven Drive Corridor Study City of Vestavia Hills, Alabama Table of Contents INTRODUCTION... 3 PROJECT STUDY AREA... 3 Figure 1 Vicinity Map Study Area... 4 EXISTING CONDITIONS... 5 TRAFFIC OPERATIONS...
Interstate Operations Study: Fargo-Moorhead Metropolitan Area Simulation Results
 NDSU Dept #2880 PO Box 6050 Fargo, ND 58108-6050 Tel 701-231-8058 Fax 701-231-6265 www.ugpti.org www.atacenter.org Interstate Operations Study: Fargo-Moorhead Metropolitan Area 2025 Simulation Results
TITLE 16. TRANSPORTATION CHAPTER 27. TRAFFIC REGULATIONS AND TRAFFIC CONTROL DEVICES
 NOTE: This is a courtesy copy of this rule. The official version can be found in the New Jersey Administrative Code. Should there be any discrepancies between this text and the official version, the official
2012 Air Emissions Inventory
 SECTION 6 HEAVY-DUTY VEHICLES This section presents emissions estimates for the heavy-duty vehicles (HDV) source category, including source description (6.1), geographical delineation (6.2), data and information
Appendix B CTA Transit Data Supporting Documentation
 RED ED-PURPLE BYPASS PROJECT ENVIRONMENTAL ASSESSMENT AND SECTION 4(F) EVALUATION Appendix B CTA Transit Data Supporting Documentation 4( Memorandum Date: May 14, 2015 Subject: Chicago Transit Authority
LAWRENCE TRANSIT CENTER LOCATION ANALYSIS 9 TH STREET & ROCKLEDGE ROAD / 21 ST STREET & IOWA STREET LAWRENCE, KANSAS
 LAWRENCE TRANSIT CENTER LOCATION ANALYSIS 9 TH STREET & ROCKLEDGE ROAD / 21 ST STREET & IOWA STREET LAWRENCE, KANSAS TRAFFIC IMPACT STUDY FEBRUARY 214 OA Project No. 213-542 TABLE OF CONTENTS 1. INTRODUCTION...
Subarea Study. Manning Avenue (CSAH 15) Corridor Management and Safety Improvement Project. Final Version 1. Washington County.
 Corridor Management and Safety Improvement Project. Final Version 1. Washington County.") Subarea Study Manning Avenue (CSAH 15) Corridor Management and Safety Improvement Project Final Version 1 Washington County June 12, 214 SRF No. 138141 Table of Contents Introduction... 1 Forecast Methodology
Subarea Study Manning Avenue (CSAH 15) Corridor Management and Safety Improvement Project Final Version 1 Washington County June 12, 214 SRF No. 138141 Table of Contents Introduction... 1 Forecast Methodology
INDUSTRIAL DEVELOPMENT
 INDUSTRIAL DEVELOPMENT Traffic Impact Study Plainfield, Illinois August 2018 Prepared for: Seefried Industrial Properties, Inc. TABLE OF CONTENTS Executive Summary 2 Introduction 3 Existing Conditions
Appendix J Traffic Impact Study
 MRI May 2012 Appendix J Traffic Impact Study Level 2 Traffic Assessment Limited Impact Review Appendix J [This page was left blank intentionally.] www.sgm-inc.com Figure 1. Site Driveway and Trail Crossing
Traffic Impact Study Speedway Gas Station Redevelopment
 Traffic Impact Study Speedway Gas Station Redevelopment Warrenville, Illinois Prepared For: Prepared By: April 11, 2018 Table of Contents 1. Introduction... 1 2. Existing Conditions... 4 Site Location...
Using Weigh-in-Motion Data to Calibrate Trade-Derived Estimates of Mexican Trade Truck Volumes in Texas
 Transportation Research Record 1719 129 Paper No. 00-1353 Using Weigh-in-Motion Data to Calibrate Trade-Derived Estimates of Mexican Trade Truck Volumes in Texas Miguel A. Figliozzi, Robert Harrison, and
TAP PHASE 3.2 EXECUTIVE SUMMARY
 TAP PHASE 3.2 EXECUTIVE SUMMARY Introduction In 2002 the North Central Texas Council of Governments (NCTCOG) launched the Thoroughfare Assessment Program (TAP), the goal of which has been to reduce vehicular
Traffic Impact Analysis West Street Garden Plots Improvements and DuPage River Park Garden Plots Development Naperville, Illinois
 Traffic Impact Analysis West Street Garden Plots Improvements and DuPage River Park Garden Plots Development Naperville, Illinois Submitted by April 9, 2009 Introduction Kenig, Lindgren, O Hara, Aboona,
STH 60 Northern Reliever Route Feasibility Study Report
 #233087 v3 STH 60 Northern Reliever Route Feasibility Study Report Washington County Public Works Committee Meeting September 28, 2016 1 STH 60 Northern Reliever Route Feasibility Study Hartford Area Development
CHARACTERIZATION AND DEVELOPMENT OF TRUCK LOAD SPECTRA FOR CURRENT AND FUTURE PAVEMENT DESIGN PRACTICES IN LOUISIANA
 CHARACTERIZATION AND DEVELOPMENT OF TRUCK LOAD SPECTRA FOR CURRENT AND FUTURE PAVEMENT DESIGN PRACTICES IN LOUISIANA LSU Research Team Sherif Ishak Hak-Chul Shin Bharath K Sridhar OUTLINE BACKGROUND AND
TRAFFIC SIGNAL DESIGN REPORT KING OF PRUSSIA ROAD & RAIDER ROAD RADNOR TOWNSHIP PENNSYLVANIA
 TRAFFIC SIGNAL DESIGN REPORT KING OF PRUSSIA ROAD & RAIDER ROAD RADNOR TOWNSHIP PENNSYLVANIA PREPARED FOR: UNIVERSITY OF PENNSYLVANIA HEALTH SYSTEM 34 CIVIC CENTER BOULEVARD PHILADELPHIA, PA 1987 (61)
WIM #39 MN 43, MP 45.2 WINONA, MN APRIL 2010 MONTHLY REPORT
 WIM #39 MN 43, MP 45.2 WINONA, MN APRIL 2010 MONTHLY REPORT In order to understand the vehicle classes and groupings the Mn/DOT Vehicle Classification Scheme and the Vehicle Class Groupings for Forecasting
TRAVEL DEMAND FORECASTS
 Jiangxi Ji an Sustainable Urban Transport Project (RRP PRC 45022) TRAVEL DEMAND FORECASTS A. Introduction 1. The purpose of the travel demand forecasts is to assess the impact of the project components
Per Revised Concept Plan Residential Condo/Townhouse. Proposed Land Use per TIS
 January 2, 2018 Mr. Paul DeBotton Marple Associates, L.P. 1604 Walnut Street, 4 th Floor Philadelphia, PA 19103 RE: Langford Run Road Traffic Analysis Proposed Mid County Shopping Center Marple Township,
Missouri Seat Belt Usage Survey for 2017
 Missouri Seat Belt Usage Survey for 2017 Conducted for the Highway Safety & Traffic Division of the Missouri Department of Transportation by The Missouri Safety Center University of Central Missouri Final
Traffic Impact Statement (TIS)
") Traffic Impact Statement (TIS) Vincentian PUDA Collier County, FL 10/18/2013 Prepared for: Global Properties of Naples Prepared by: Trebilcock Consulting Solutions, PA 2614 Tamiami Trail N, Suite 615 1205
Traffic Impact Statement (TIS) Vincentian PUDA Collier County, FL 10/18/2013 Prepared for: Global Properties of Naples Prepared by: Trebilcock Consulting Solutions, PA 2614 Tamiami Trail N, Suite 615 1205
2.0 Development Driveways. Movin Out June 2017
 Movin Out June 2017 1.0 Introduction The proposed Movin Out development is a mixed use development in the northeast quadrant of the intersection of West Broadway and Fayette Avenue in the City of Madison.
WIM #48 is located on CSAH 5 near Storden in Cottonwood county.
 WIM Site Location WIM #48 is located on CSAH 5 near Storden in Cottonwood county. System Operation WIM #48 was operational for the entire month of August 2017. Volume was computed using all monthly data.
Speed Evaluation Saw Mill Drive
 Speed Evaluation Saw Mill Drive Prepared for: Mount Laurel Township Burlington County, New Jersey Prepared by: Dana Litwornia Litwornia & Associates, Inc. Transportation, Traffic & Environmental Engineering
Post Opening Project Evaluation. M6 Toll
 M6 Toll Five Post Years Opening After Study: Project Summary Evaluation Report Post Opening Project Evaluation M6 Toll Five Years After Study Summary Report October 2009 Document History JOB NUMBER: 5081587/905
MERIVALE PRIORITY SQUARE 2852 MERIVALE ROAD CITY OF OTTAWA TRANSPORTATION BRIEF. Prepared for: ONT Inc. 25 Winding Way Nepean, Ontario K2C 3H1
 MERIVALE PRIORITY SQUARE 2852 MERIVALE ROAD CITY OF OTTAWA TRANSPORTATION BRIEF Prepared for: 2190986ONT Inc. 25 Winding Way Nepean, Ontario K2C 3H1 October 6, 2010 110-502 Report_1.doc D. J. Halpenny
INTERSECTION ANALYSIS PARK AVENUE AND BRADDOCK ROAD (FROSTBURG, MD) FOR LENHART TRAFFIC CONSULTING, INC.
 FOR LENHART TRAFFIC CONSULTING, INC.") INTERSECTION ANALYSIS FOR PARK AVENUE AND BRADDOCK ROAD (FROSTBURG, MD) Prepared for: City of Frostburg, Maryland & Allegany County Commissioners Prepared by: LENHART TRAFFIC CONSULTING, INC. TRAFFIC ENGINEERING
INTERSECTION ANALYSIS FOR PARK AVENUE AND BRADDOCK ROAD (FROSTBURG, MD) Prepared for: City of Frostburg, Maryland & Allegany County Commissioners Prepared by: LENHART TRAFFIC CONSULTING, INC. TRAFFIC ENGINEERING
Alfred & Plantagenet Multi-Residential Cart Recycling Program CIF Project Number # Final Report October 1, 2016
 Alfred & Plantagenet Multi-Residential Cart Recycling Program CIF Project Number #545.3 Final Report October 1, 2016 Prepared for: Waste Diversion Ontario Continuous Improvement Fund Office Barrie, Ontario
Act 229 Evaluation Report
 R22-1 W21-19 W21-20 Act 229 Evaluation Report Prepared for Prepared by Table of Contents 1. Documentation Page 3 2. Executive Summary 4 2.1. Purpose 4 2.2. Evaluation Results 4 3. Background 4 4. Approach
Energy Technical Memorandum
 Southeast Extension Project Lincoln Station to RidgeGate Parkway Prepared for: Federal Transit Administration Prepared by: Denver Regional Transportation District May 2014 Table of Contents Page No. Chapter
Project Advisory Committee
 Meredith US 3/NH 25 Improvements Transportation Planning Study Project Advisory Committee March 18, 2008 Meredith US 3/NH 25 Improvements Transportation Planning Study Meeting Agenda Welcome Traffic Model
PROJECT: Wilkinson Road Corridor Improvement Traffic Management Planning Project SUBJECT: Traffic Analysis
 TECHNICAL MEMORANDUM DATE: September 10, 2014 PROJECT 5861.03 NO: PROJECT: Wilkinson Road Corridor Improvement Traffic Management Planning Project SUBJECT: Traffic Analysis TO: Steve Holroyd - District
TRAFFIC IMPACT STUDY. USD #497 Warehouse and Bus Site
 TRAFFIC IMPACT STUDY for USD #497 Warehouse and Bus Site Prepared by: Jason Hoskinson, PE, PTOE BG Project No. 16-12L July 8, 216 145 Wakarusa Drive Lawrence, Kansas 6649 T: 785.749.4474 F: 785.749.734
King County Metro. Columbia Street Transit Priority Improvements Alternative Analysis. Downtown Southend Transit Study. May 2014.
 King County Metro Columbia Street Transit Priority Improvements Alternative Analysis Downtown Southend Transit Study May 2014 Parametrix Table of Contents Introduction... 1 Methodology... 1 Study Area...
Traffic Feasibility Study
 Traffic Feasibility Study Town Center South Robbinsville Township, Mercer County, New Jersey December 19, 2017 Prepared For Robbinsville Township Department of Community Development 2298 Route 33 Robbinsville,
Section 5. Traffic Monitoring Guide May 1, Truck Weight Monitoring
 Section 5 Traffic Monitoring Guide May 1, 2001 Section 5 Truck Weight Monitoring Section 5 Traffic Monitoring Guide May 1, 2001 SECTION 5 CONTENTS Section Page CHAPTER 1 INTRODUCTION TO TRUCK WEIGHT DATA
PRESENTATION Metro s Streets & Freeways Subcommittee
 PRESENTATION Metro s Streets & Freeways Subcommittee Los Angeles County Metro s 2011 Interstate 210 Truck Origin & Destination (O D) Study Presented by: Fred Minagar MINAGAR & ASSOCIATES, INC. October
MEMO VIA . Ms. Amy Roth DPS Director, City of Three Rivers. To:
 MEMO To: Ms. Amy Roth DPS Director, City of Three Rivers VIA EMAIL From: Michael J. Labadie, PE Julie M. Kroll, PE, PTOE Brandon Hayes, PE, P.Eng. Fleis & VandenBrink Date: January 5, 2017 Re: Proposed
Traffic Engineering Study
 Traffic Engineering Study Bellaire Boulevard Prepared For: International Management District Technical Services, Inc. Texas Registered Engineering Firm F-3580 November 2009 Executive Summary has been requested
MILLERSVILLE PARK TRAFFIC IMPACT ANALYSIS ANNE ARUNDEL COUNTY, MARYLAND
 MILLERSVILLE PARK TRAFFIC IMPACT ANALYSIS ANNE ARUNDEL COUNTY, MARYLAND Prepared for: Department of Public Works Anne Arundel County Prepared by: URS Corporation 4 North Park Drive, Suite 3 Hunt Valley,
TRAFFIC SIMULATION IN REGIONAL MODELING: APPLICATION TO THE INTERSTATEE INFRASTRUCTURE NEAR THE TOLEDO SEA PORT
 MICHIGAN OHIO UNIVERSITY TRANSPORTATION CENTER Alternate energy and system mobility to stimulate economic development. Report No: MIOH UTC TS41p1-2 2012-Final TRAFFIC SIMULATION IN REGIONAL MODELING: APPLICATION
2 EXISTING ROUTE STRUCTURE AND SERVICE LEVELS
 2 EXISTING ROUTE STRUCTURE AND SERVICE LEVELS In the Study Area, as in most of the Metro Transit network, there are two distinct route structures. The base service structure operates all day and the peak
Traffic Impact Study for the proposed. Town of Allegany, New York. August Project No Prepared For:
 Appendix B SRF Traffic Study (Revised November 2005) Draft Environmental Impact Statement University Commons Town of Allegany, Cattaraugus County, NY December 2005 Traffic Impact Study for the proposed
CITY OF VANCOUVER ADMINISTRATIVE REPORT
 Supports Item No. 1 T&T Committee Agenda May 13, 2008 CITY OF VANCOUVER ADMINISTRATIVE REPORT Report Date: April 29, 2008 Author: Don Klimchuk Phone No.: 604.873.7345 RTS No.: 07283 VanRIMS No.: 13-1400-10
WIM #40 US 52, MP S. ST. PAUL, MN APRIL 2010 MONTHLY REPORT
 WIM #40 US 52, MP 126.8 S. ST. PAUL, MN APRIL 2010 MONTHLY REPORT In order to understand the vehicle classes and groupings the Mn/DOT Vehicle Classification Scheme and the Vehicle Class Groupings for Forecasting
RE: A Traffic Impact Statement for a proposed development on Quinpool Road
 James J. Copeland, P.Eng. GRIFFIN transportation group inc. 30 Bonny View Drive Fall River, NS B2T 1R2 May 31, 2018 Ellen O Hara, P.Eng. Project Engineer DesignPoint Engineering & Surveying Ltd. 200 Waterfront
West Hills Shopping Centre Lowe s Expansion Traffic Impact Study
 West Hills Shopping Centre Lowe s Expansion Traffic Impact Study Prepared for: Armel Corporation January 2015 Paradigm Transportation Solutions Ltd. 22 King Street South, Suite 300 Waterloo ON N2J 1N8
TRAFFIC PARKING ANALYSIS
 TRAFFIC PARKING ANALYSIS NAPA FLEA MARKET COUNTY OF NAPA Prepared for: Tom Harding Napa-Vallejo Flea Market 33 Kelly Road American Canyon, CA 9453 Prepared by: 166 Olympic Boulevard, Suite 21 Walnut Creek,
TRAFFIC DATA. Existing Derousse Ave./River Rd. AM LOS Analysis Existing Derousse Ave./River Rd. PM LOS Analysis
 Appendix E NJ TRANSIT Pennsauken Junction Transit Center and Park & Ride RiverLINE and Atlantic City Line Pennsauken Township, Camden County, New Jersey TRAFFIC DATA Background Traffic Information for
Costco Gasoline Fuel Station Transportation Characteristics
 Exhibit A MEMORANDUM Date: May 23, 2013 Project #: I-10 To: Jennifer Murillo, Costco Wholesale Terry Odle, Mulvanny G2 Architecture From: Sonia Hennum, PTOE Project: Subject: Signal Hill Costco Gasoline
Open House. Highway212. Meetings. Corridor Access Management, Safety & Phasing Plan. 5:30 to 6:30 p.m. - Southwest Corridor Transportation Coalition
 Welcome Meetings 5:30 to 6:30 p.m. - Southwest Corridor Transportation Coalition 6:30 to 8:00 p.m. - Open House Why is Highway 212 Project Important? Important Arterial Route Local Support Highway 212
Right-of-Way Obstruction Permit Fee Structure Minneapolis Department of Public Works May 10, 2001
 Right-of-Way Obstruction Permit Fee Structure Minneapolis Department of Public Works May 10, 2001 Revised April 5, 2005 Revised January 27, 2006 Prepared by: Steve Collin, Engineer 2.5 Revised by Douglas
Traffic, Transportation & Civil Engineering Ali R. Khorasani, P.E. P.O. Box 804, Spencer, MA 01562, Tel: (508)
") Associates Traffic, Transportation & Civil Engineering Ali R. Khorasani, P.E. P.O. Box 804, Spencer, MA 01562, Tel: (508) 885-5121 Ms. Teri Ford, Associate 800 Boylston Street, Suite 1570 Boston, MA July
Associates Traffic, Transportation & Civil Engineering Ali R. Khorasani, P.E. P.O. Box 804, Spencer, MA 01562, Tel: (508) 885-5121 Ms. Teri Ford, Associate 800 Boylston Street, Suite 1570 Boston, MA July
RICHMOND OAKS HEALTH CENTRE 6265 PERTH STREET OTTAWA, ONTARIO TRANSPORTATION BRIEF. Prepared for: Guycoki (Eastern) Limited.
 Limited.") RICHMOND OAKS HEALTH CENTRE 6265 PERTH STREET OTTAWA, ONTARIO TRANSPORTATION BRIEF Prepared for: Guycoki (Eastern) Limited June 16, 2016 116-638 Brief_1.doc D. J. Halpenny & Associates Ltd. Consulting
RICHMOND OAKS HEALTH CENTRE 6265 PERTH STREET OTTAWA, ONTARIO TRANSPORTATION BRIEF Prepared for: Guycoki (Eastern) Limited June 16, 2016 116-638 Brief_1.doc D. J. Halpenny & Associates Ltd. Consulting
Spatial and Temporal Analysis of Real-World Empirical Fuel Use and Emissions
 Spatial and Temporal Analysis of Real-World Empirical Fuel Use and Emissions Extended Abstract 27-A-285-AWMA H. Christopher Frey, Kaishan Zhang Department of Civil, Construction and Environmental Engineering,
Automated Occupancy Detection October 2015 (Phase I) Demonstration Results Presented by Kathy McCune
 Demonstration Results Presented by Kathy McCune") Automated Occupancy Detection October 2015 (Phase I) Demonstration Results Presented by Kathy McCune 2016 TRB Managed Lanes Conference May 5th, Session 6 Presentation Background Outline Metro ExpressLanes
Automated Occupancy Detection October 2015 (Phase I) Demonstration Results Presented by Kathy McCune 2016 TRB Managed Lanes Conference May 5th, Session 6 Presentation Background Outline Metro ExpressLanes
TRAFFIC IMPACT DATA. Dillons #98 On-Site Relocation
 TRAFFIC IMPACT DATA For Dillons #98 On-Site Relocation COMMERCIAL DEVELOPMENT 1740 Massachusetts Street Lawrence, KS Revised April 6, 2011 Prepared by: Pickering Firm, Inc. Introduction The project site
"Semitrailer." A trailer so constructed that some part of its weight rests upon or is carried by the towing vehicle.
 Pennsylvania: 102. Definitions. Subject to additional definitions contained in subsequent provisions of this title which are applicable to specific provisions of this title, the following words and phrases
Project Title: Using Truck GPS Data for Freight Performance Analysis in the Twin Cities Metro Area Prepared by: Chen-Fu Liao (PI) Task Due: 7/31/2013
 Task Due: 7/31/2013") Project Title: Using Truck GPS Data for Freight Performance Analysis in the Twin Cities Metro Area Prepared by: Chen-Fu Liao (PI) Task Due: 7/31/2013 TASK #3 PROCESS TRUCK GPS DATA AND DERIVE PERFORMANCE
Project Title: Using Truck GPS Data for Freight Performance Analysis in the Twin Cities Metro Area Prepared by: Chen-Fu Liao (PI) Task Due: 7/31/2013 TASK #3 PROCESS TRUCK GPS DATA AND DERIVE PERFORMANCE
FREQUENTLY ASKED QUESTIONS
 THE PROJECT Last updated on 9/8/16 FREQUENTLY ASKED QUESTIONS What s happening on Highway 169? The Minnesota Department of Transportation (MnDOT) is planning to rebuild and repair the infrastructure on
KANSAS Occupant Protection Observational Survey Supplementary Analyses Summer Study
 KANSAS Occupant Protection Observational Survey Supplementary Analyses 2018 Summer Study Submitted To: Kansas Department of Transportation Bureau of Transportation Safety and Technology Prepared by: DCCCA
The Eastern Connector Study November, 2007 planning for the future
 The Eastern Connector Study November, 2007 planning for the future In late 2006, Albemarle County and the City of Charlottesville jointly initiated the Eastern Connector Corridor Study. The Project Team
New Buck O Neil (U. S. 169) Crossing Benefit-Cost Analysis. Kansas City, Missouri
 Crossing Benefit-Cost Analysis. Kansas City, Missouri") New Buck O Neil (U. S. 169) Crossing Benefit-Cost Analysis Kansas City, Missouri New Buck O Neil (U. S. 169) Crossing Benefit-Cost Analysis prepared for Kansas City, Missouri prepared by Burns & McDonnell
New Buck O Neil (U. S. 169) Crossing Benefit-Cost Analysis Kansas City, Missouri New Buck O Neil (U. S. 169) Crossing Benefit-Cost Analysis prepared for Kansas City, Missouri prepared by Burns & McDonnell
Simulating Trucks in CORSIM
 Simulating Trucks in CORSIM Minnesota Department of Transportation September 13, 2004 Simulating Trucks in CORSIM. Table of Contents 1.0 Overview... 3 2.0 Acquiring Truck Count Information... 5 3.0 Data
PARKING OCCUPANCY IN WINDSOR CENTER
 PARKING OCCUPANCY IN WINDSOR CENTER TOWN OF WINDSOR, CONNECTICUT REPORT JUNE 2017 CONTENTS Background... 3 Other Relevant Data... 3 Parking Survey Design... 6 Parking Supply Inventory... 6 Parking Demand
Expansion Projects Description
 Expansion Projects Description The Turnpike expansion program was authorized by the Florida Legislature in 1990 to meet the State s backlog of needed highway facilities. The Legislature set environmental
BARRHAVEN FELLOWSHIP CRC 3058 JOCKVALE ROAD OTTAWA, ONTARIO TRANSPORTATION BRIEF. Prepared for:
 BARRHAVEN FELLOWSHIP CRC 3058 JOCKVALE ROAD OTTAWA, ONTARIO TRANSPORTATION BRIEF Prepared for: Barrhaven Fellowship CRC 3058 Jockvale Road Ottawa, ON K2J 2W7 December 7, 2016 116-649 Report_1.doc D. J.
Rocky Mount. Transportation Plan. Transportation Planning Division. Virginia Department of Transportation
 2020 Transportation Plan Developed by the Transportation Planning Division of the Virginia Department of Transportation in cooperation with the U.S. Department of Transportation, Federal Highway Administration
AECOM 30 Leek Cres., 4 th Floor Richmond Hill, ON L4B 4N4 Canada
 \ AECOM 30 Leek Cres., 4 th Floor Richmond Hill, ON L4B 4N4 Canada www.aecom.com 905-882-4401 tel 905-882-4399 fax Memorandum To CC Subject Peter Dorton (MTO), Eric Terro (MTO) Olga Garces (MTO) Page 1
APPENDIX B. Origin Destination Study Data
 APPENDIX B Origin Destination Study Data - TABLE OF CONTENTS - Page No. EXECUTIVE SUMMARY... 1 Map of the Study area with Site Locations... 2 Summary Table of Results for the TH 14 Corridor Study... 3
Section 5.0 Traffic Information
 Section 5.0 Traffic Information 10.0 TRANSPORTATION MDM Transportation Consultants, Inc. (MDM) has prepared an evaluation of transportation impacts for the proposed evaluation for the expansion of the
Parks and Transportation System Development Charge Methodology
 City of Sandy Parks and Transportation System Development Charge Methodology March, 2016 Background In order to implement a City Council goal the City of Sandy engaged FCS Group in January of 2015 to update
Mercer Island Center for the Arts Parking Management Plan
 Parking Stalls Mercer Island Center for the Arts Parking Management Plan June 15, 2016 This Parking Management Plan (P) covers all tenants at the Mercer Island Center for the Arts (MICA) campus, including
Chapter 17 TRAFFIC AND VEHICLES. Adoption of Uniform Rules of the Road. Temporary Traffic Regulations.
 Chapter 17 TRAFFIC AND VEHICLES Article I. Article II. Article III. In General. Section 17.1 Adoption of Uniform Rules of the Road. Section 17.2 Temporary Traffic Regulations. Section 17.3 Traffic Speed,
Proposed CVS/pharmacy
 Traffic Impact and Access Study Proposed CVS/pharmacy West Main Street (Route 1) at Hull Street Clinton, Connecticut PREPARED FOR Arista Development LLC 520 Providence Highway, Suite 9 Norwood, Massachusetts