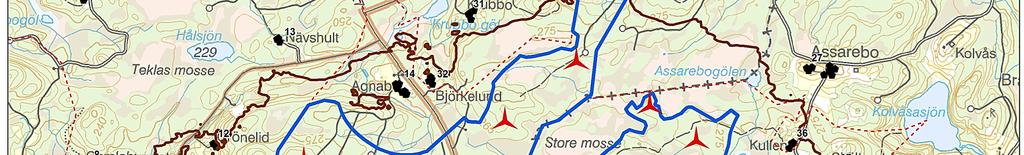
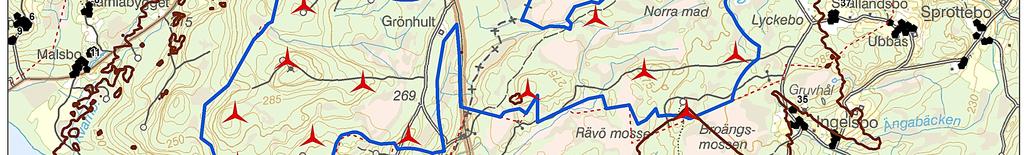
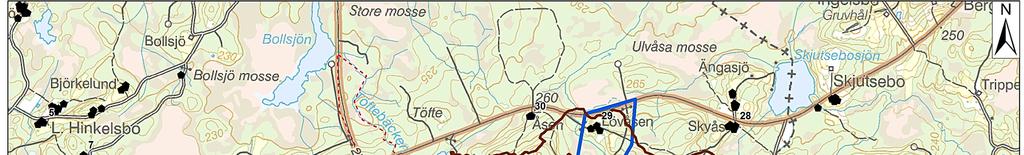
Bilaga 3B - Skuggor. Layout B. 16 st Gamesa G128, 4,5 MW Totalhöjd 150 meter
|
|
|
- Beatrice McCarthy
- 5 years ago
- Views:
Transcription
1 Bilaga 3B_Skuggberäkning och skuggkalender_layout B_150 m Kompletteringar Bilaga 3B - Skuggor Layout B 16 st Gamesa G128, 4,5 MW Totalhöjd 150 meter
2 Bilaga 3B_Skuggberäkning och skuggkalender_layout B_150 m :16 / 1 Calculation: _G128_16vkv_86HH Assumptions for shadow calculations Maximum distance for influence Calculate only when more than 20 % of sun is covered by the blade Please look in WTG table :16/ Minimum sun height over horizon for influence 3 Day step for calculation 1 days Time step for calculation 1 minutes Sunshine probability S (Average daily sunshine hours) [VAXJO /KRONOBER G] Jan Feb Mar Apr May Jun Jul Aug Sep Oct Nov Dec Operational hours are calculated from WTGs in calculation and wind distribution: _MKBKompl Operational time N NNE ENE E ESE SSE S SSW WSW W WNW NNW Sum ,286 1, ,502 Idle start wind speed: Cut in wind speed from power curve A ZVI (Zones of Visual Influence) calculation is performed before flicker calculation so non visible WTG do not contribute to calculated flicker values. A WTG will be visible if it is visible from any part of the receiver window. The ZVI calculation is based on the following assumptions: Height contours used: Height Contours: _GH2mCont_2mScan_5mTopo2_WPO.map (2) Obstacles not used in calculation Eye height: 1.5 m Grid resolution: 10.0 m WTGs Swedish RT90 2.5gonV 0:-15-RT90 (SE) WTG type Shadow data East North Z Row data/description Valid Manufact. Type-generator Power, Rotor Hub Calculation RPM rated diameter height distance [m] [kw] [m] [m] [m] [RPM] 1 1,357,844 6,363, GAMESA G !O!... Yes GAMESA G128-4,500 4, , ,358,458 6,364, GAMESA G !O!... Yes GAMESA G128-4,500 4, , ,361,178 6,364, GAMESA G !O!... Yes GAMESA G128-4,500 4, , ,360,224 6,364, GAMESA G !O!... Yes GAMESA G128-4,500 4, , ,361,225 6,365, GAMESA G !O!... Yes GAMESA G128-4,500 4, , ,360,781 6,365, GAMESA G !O!... Yes GAMESA G128-4,500 4, , ,357,824 6,364, GAMESA G !O!... Yes GAMESA G128-4,500 4, , ,360,623 6,366, GAMESA G !O!... Yes GAMESA G128-4,500 4, , ,358,252 6,364, GAMESA G !O!... Yes GAMESA G128-4,500 4, , ,361,528 6,364, GAMESA G !O!... Yes GAMESA G128-4,500 4, , ,358,871 6,364, GAMESA G !O!... Yes GAMESA G128-4,500 4, , ,360,036 6,365, GAMESA G !O!... Yes GAMESA G128-4,500 4, , ,361,929 6,364, GAMESA G !O!... Yes GAMESA G128-4,500 4, , ,361,607 6,365, GAMESA G !O!... Yes GAMESA G128-4,500 4, , ,358,386 6,365, GAMESA G !O!... Yes GAMESA G128-4,500 4, , ,359,246 6,364, GAMESA G !O!... Yes GAMESA G128-4,500 4, , Shadow receptor-input Swedish RT90 2.5gonV 0:-15-RT90 (SE) No. Name East North Z Width Height Height Degrees from Slope of Direction mode a.g.l. south cw window [m] [m] [m] [m] [ ] [ ] A 1 1,354,439 6,365, "Green house mode" B 2 1,354,303 6,365, "Green house mode" C 3 1,355,719 6,366, "Green house mode" D 4 1,355,823 6,366, "Green house mode" E 5 1,356,247 6,366, "Green house mode" F 6 1,356,082 6,365, "Green house mode" To be continued on next page...
3 Bilaga 3B_Skuggberäkning och skuggkalender_layout B_150 m :16 / 2 Calculation: _G128_16vkv_86HH...continued from previous page Swedish RT90 2.5gonV 0:-15-RT90 (SE) No. Name East North Z Width Height Height Degrees from Slope of Direction mode a.g.l. south cw window [m] [m] [m] [m] [ ] [ ] G 7 1,356,579 6,366, "Green house mode" H 8 1,356,602 6,365, "Green house mode" I 9 1,355,989 6,364, "Green house mode" J 10 1,355,455 6,364, "Green house mode" K 11 1,356,610 6,364, "Green house mode" L 12 1,357,661 6,365, "Green house mode" M 13 1,358,186 6,366, "Green house mode" N 14 1,359,151 6,365, "Green house mode" O 18 1,358,766 6,363, "Green house mode" P 19 1,358,001 6,363, "Green house mode" Q 20 1,357,381 6,363, "Green house mode" R 21 1,357,226 6,363, "Green house mode" S 23 1,360,701 6,363, "Green house mode" T 24 1,361,391 6,363, "Green house mode" U 26 1,362,356 6,365, "Green house mode" V 27 1,362,521 6,365, "Green house mode" W 28 1,361,906 6,366, "Green house mode" X 29 1,360,812 6,366, "Green house mode" Y 30 1,360,247 6,366, "Green house mode" Z 31 1,359,762 6,366, "Green house mode" AA 32 1,359,427 6,365, "Green house mode" AB 33 1,353,748 6,365, "Green house mode" AC 35 1,362,402 6,364, "Green house mode" AD 38 1,358,924 6,363, "Green house mode" AE 37 1,362,749 6,365, "Green house mode" AF 36 1,362,389 6,365, "Green house mode" AG 17 1,355,333 6,364, "Green house mode" AH 15 1,359,233 6,363, "Green house mode" :16/ Calculation Results Shadow receptor Shadow, worst case Shadow, expected values No. Name Shadow hours Shadow days Max shadow Shadow hours per year per year hours per day per year [h/year] [days/year] [h/day] [h/year] A 1 0:00 0 0:00 0:00 B 2 0:00 0 0:00 0:00 C 3 0:00 0 0:00 0:00 D 4 0:00 0 0:00 0:00 E 5 0:00 0 0:00 0:00 F 6 10: :16 1:43 G 7 5: :14 0:36 H 8 27: :34 3:59 I 9 11: :16 1:54 J 10 1: :09 0:10 K 11 34: :24 6:25 L 12 81: :41 11:24 M 13 39: :53 3:24 N 14 72: :46 10:28 O 18 41: :33 11:16 P 19 6: :16 1:58 Q 20 5: :16 1:45 R 21 29: :35 8:34 S 23 2: :08 0:36 T 24 10: :22 2:43 U 26 91: :50 14:51 V 27 29: :30 3:43 W 28 29: :32 3:06 To be continued on next page...
4 Bilaga 3B_Skuggberäkning och skuggkalender_layout B_150 m :16 / 3 Calculation: _G128_16vkv_86HH...continued from previous page Shadow, worst case Shadow, expected values No. Name Shadow hours Shadow days Max shadow Shadow hours per year per year hours per day per year [h/year] [days/year] [h/day] [h/year] X 29 80: :53 7:04 Y 30 49: :46 4:26 Z 31 59: :44 6:14 AA 32 86: :45 11:58 AB 33 0:00 0 0:00 0:00 AC 35 35: :43 7:53 AD 38 27: :27 7:03 AE 37 31: :43 5:40 AF 36 77: :46 12:03 AG 17 0:00 0 0:00 0:00 AH 15 40: :32 10: :16/ Total amount of flickering on the shadow receptors caused by each WTG No. Name Worst case Expected [h/year] [h/year] 1 GAMESA G !O! hub: 86.0 m (TOT: m) (517) 47:01 9:40 2 GAMESA G !O! hub: 86.0 m (TOT: m) (518) 46:05 11:28 3 GAMESA G !O! hub: 86.0 m (TOT: m) (519) 24:13 4:33 4 GAMESA G !O! hub: 86.0 m (TOT: m) (520) 48:40 8:53 5 GAMESA G !O! hub: 86.0 m (TOT: m) (521) 62:18 8:07 6 GAMESA G !O! hub: 86.0 m (TOT: m) (522) 27:05 3:38 7 GAMESA G !O! hub: 86.0 m (TOT: m) (523) 83:22 12:46 8 GAMESA G !O! hub: 86.0 m (TOT: m) (524) 114:03 13:17 9 GAMESA G !O! hub: 86.0 m (TOT: m) (525) 68:53 9:15 10 GAMESA G !O! hub: 86.0 m (TOT: m) (526) 40:54 7:05 11 GAMESA G !O! hub: 86.0 m (TOT: m) (527) 18:02 3:15 12 GAMESA G !O! hub: 86.0 m (TOT: m) (528) 94:31 11:24 13 GAMESA G !O! hub: 86.0 m (TOT: m) (529) 89:14 11:17 14 GAMESA G !O! hub: 86.0 m (TOT: m) (530) 62:57 11:22 15 GAMESA G !O! hub: 86.0 m (TOT: m) (531) 110:10 17:25 16 GAMESA G !O! hub: 86.0 m (TOT: m) (532) 17:51 5:08
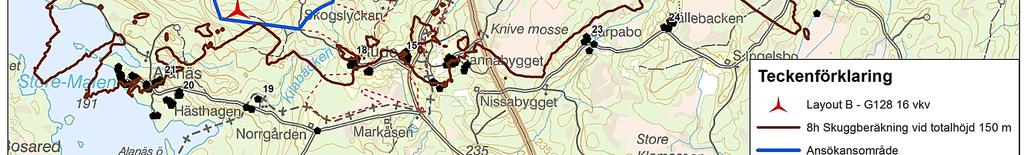
5 Bilaga 3B_Skuggkarta_Layout B_150 m
6 Bilaga 3B_Skuggberäkning och skuggkalender_layout B_200 m Kompletteringar Bilaga 3B - Skuggor Layout B 16 st Gamesa G128, 4,5 MW Totalhöjd 200 meter
7 Bilaga 3B_Skuggberäkning och skuggkalender_layout B_200 m :27 / 1 Calculation: _G128_16vkv_136HH Assumptions for shadow calculations Maximum distance for influence Calculate only when more than 20 % of sun is covered by the blade Please look in WTG table :55/ Minimum sun height over horizon for influence 3 Day step for calculation 1 days Time step for calculation 1 minutes Sunshine probability S (Average daily sunshine hours) [VAXJO /KRONOBER G] Jan Feb Mar Apr May Jun Jul Aug Sep Oct Nov Dec Operational hours are calculated from WTGs in calculation and wind distribution: _Mast_LT_7.14_ERA Operational time N NNE ENE E ESE SSE S SSW WSW W WNW NNW Sum ,309 1, ,656 Idle start wind speed: Cut in wind speed from power curve A ZVI (Zones of Visual Influence) calculation is performed before flicker calculation so non visible WTG do not contribute to calculated flicker values. A WTG will be visible if it is visible from any part of the receiver window. The ZVI calculation is based on the following assumptions: Height contours used: Height Contours: _GH2mCont_2mScan_5mTopo2_WPO.map (2) Obstacles not used in calculation Eye height: 1.5 m Grid resolution: 10.0 m WTGs Swedish RT90 2.5gonV 0:-15-RT90 (SE) WTG type Shadow data East North Z Row data/description Valid Manufact. Type-generator Power, Rotor Hub Calculation RPM rated diameter height distance [m] [kw] [m] [m] [m] [RPM] 1 1,357,844 6,363, GAMESA G !O!... Yes GAMESA G128-4,500 4, , ,358,458 6,364, GAMESA G !O!... Yes GAMESA G128-4,500 4, , ,361,178 6,364, GAMESA G !O!... Yes GAMESA G128-4,500 4, , ,360,224 6,364, GAMESA G !O!... Yes GAMESA G128-4,500 4, , ,361,225 6,365, GAMESA G !O!... Yes GAMESA G128-4,500 4, , ,360,781 6,365, GAMESA G !O!... Yes GAMESA G128-4,500 4, , ,357,824 6,364, GAMESA G !O!... Yes GAMESA G128-4,500 4, , ,360,623 6,366, GAMESA G !O!... Yes GAMESA G128-4,500 4, , ,358,252 6,364, GAMESA G !O!... Yes GAMESA G128-4,500 4, , ,361,528 6,364, GAMESA G !O!... Yes GAMESA G128-4,500 4, , ,358,871 6,364, GAMESA G !O!... Yes GAMESA G128-4,500 4, , ,360,036 6,365, GAMESA G !O!... Yes GAMESA G128-4,500 4, , ,361,929 6,364, GAMESA G !O!... Yes GAMESA G128-4,500 4, , ,361,607 6,365, GAMESA G !O!... Yes GAMESA G128-4,500 4, , ,358,386 6,365, GAMESA G !O!... Yes GAMESA G128-4,500 4, , ,359,246 6,364, GAMESA G !O!... Yes GAMESA G128-4,500 4, , Shadow receptor-input Swedish RT90 2.5gonV 0:-15-RT90 (SE) No. Name East North Z Width Height Height Degrees from Slope of Direction mode a.g.l. south cw window [m] [m] [m] [m] [ ] [ ] A 1 1,354,439 6,365, "Green house mode" B 2 1,354,303 6,365, "Green house mode" C 3 1,355,719 6,366, "Green house mode" D 4 1,355,823 6,366, "Green house mode" E 5 1,356,247 6,366, "Green house mode" F 6 1,356,082 6,365, "Green house mode" To be continued on next page...
8 Bilaga 3B_Skuggberäkning och skuggkalender_layout B_200 m :27 / 2 Calculation: _G128_16vkv_136HH...continued from previous page Swedish RT90 2.5gonV 0:-15-RT90 (SE) No. Name East North Z Width Height Height Degrees from Slope of Direction mode a.g.l. south cw window [m] [m] [m] [m] [ ] [ ] G 7 1,356,579 6,366, "Green house mode" H 8 1,356,602 6,365, "Green house mode" I 9 1,355,989 6,364, "Green house mode" J 10 1,355,455 6,364, "Green house mode" K 11 1,356,610 6,364, "Green house mode" L 12 1,357,661 6,365, "Green house mode" M 13 1,358,186 6,366, "Green house mode" N 14 1,359,151 6,365, "Green house mode" O 18 1,358,766 6,363, "Green house mode" P 19 1,358,001 6,363, "Green house mode" Q 20 1,357,381 6,363, "Green house mode" R 21 1,357,226 6,363, "Green house mode" S 23 1,360,701 6,363, "Green house mode" T 24 1,361,391 6,363, "Green house mode" U 26 1,362,356 6,365, "Green house mode" V 27 1,362,521 6,365, "Green house mode" W 28 1,361,906 6,366, "Green house mode" X 29 1,360,812 6,366, "Green house mode" Y 30 1,360,247 6,366, "Green house mode" Z 31 1,359,762 6,366, "Green house mode" AA 32 1,359,427 6,365, "Green house mode" AB 33 1,353,748 6,365, "Green house mode" AC 35 1,362,402 6,364, "Green house mode" AD 38 1,358,924 6,363, "Green house mode" AE 37 1,362,749 6,365, "Green house mode" AF 36 1,362,389 6,365, "Green house mode" AG 17 1,355,333 6,364, "Green house mode" AH 15 1,359,233 6,363, "Green house mode" :55/ Calculation Results Shadow receptor Shadow, worst case Shadow, expected values No. Name Shadow hours Shadow days Max shadow Shadow hours per year per year hours per day per year [h/year] [days/year] [h/day] [h/year] A 1 0:00 0 0:00 0:00 B 2 0:00 0 0:00 0:00 C 3 0:00 0 0:00 0:00 D 4 0:00 0 0:00 0:00 E 5 0:00 0 0:00 0:00 F 6 14: :16 2:22 G 7 7: :14 0:49 H 8 30: :36 4:30 I 9 13: :16 2:28 J 10 2: :13 0:21 K 11 35: :27 7:06 L : :55 14:43 M 13 78: :20 7:07 N : :45 14:46 O 18 42: :34 11:48 P 19 0:00 0 0:00 0:00 Q 20 6: :16 2:12 R 21 14: :19 4:21 S 23 8: :21 2:03 T 24 20: :24 5:33 U : :06 21:43 V 27 65: :44 8:24 W 28 44: :35 5:03 To be continued on next page...
9 Bilaga 3B_Skuggberäkning och skuggkalender_layout B_200 m :27 / 3 Calculation: _G128_16vkv_136HH...continued from previous page Shadow, worst case Shadow, expected values No. Name Shadow hours Shadow days Max shadow Shadow hours per year per year hours per day per year [h/year] [days/year] [h/day] [h/year] X : :00 12:34 Y 30 62: :18 5:57 Z 31 89: :12 9:40 AA : :57 17:29 AB 33 0:00 0 0:00 0:00 AC 35 41: :46 10:05 AD 38 19: :27 5:30 AE 37 54: :51 10:33 AF : :57 18:29 AG 17 0:00 0 0:00 0:00 AH 15 36: :35 9: :55/ Total amount of flickering on the shadow receptors caused by each WTG No. Name Worst case Expected [h/year] [h/year] 1 GAMESA G !O! hub: m (TOT: m) (400) 80:48 15:44 2 GAMESA G !O! hub: m (TOT: m) (401) 40:44 6:54 3 GAMESA G !O! hub: m (TOT: m) (403) 50:38 9:05 4 GAMESA G !O! hub: m (TOT: m) (404) 61:51 11:46 5 GAMESA G !O! hub: m (TOT: m) (405) 105:28 14:54 6 GAMESA G !O! hub: m (TOT: m) (406) 52:08 7:38 7 GAMESA G !O! hub: m (TOT: m) (407) 89:37 12:45 8 GAMESA G !O! hub: m (TOT: m) (408) 155:44 20:07 9 GAMESA G !O! hub: m (TOT: m) (410) 82:17 10:44 10 GAMESA G !O! hub: m (TOT: m) (411) 59:51 9:57 11 GAMESA G !O! hub: m (TOT: m) (412) 52:01 5:10 12 GAMESA G !O! hub: m (TOT: m) (512) 124:03 15:32 13 GAMESA G !O! hub: m (TOT: m) (513) 101:35 12:47 14 GAMESA G !O! hub: m (TOT: m) (514) 100:05 18:42 15 GAMESA G !O! hub: m (TOT: m) (515) 122:24 20:26 16 GAMESA G !O! hub: m (TOT: m) (516) 29:28 6:55
10 Bilaga 3B_Skuggkarta_Layout B_200 m
Shadow Flicker Briefing
 Wind Farm Measurements and Modeling Shadow Flicker Briefing Subject: Customer: Project type: Prepared by: Distribution: Shadow-Flicker Modeling Clayton, NY. PPM Atlantic Renewable 330 Province Line Road
Marble River Wind Farm Wind Turbine Generator Shadow Flicker Analysis
 Wind Turbine Generator Flicker Analysis Executive Summary This report summarizes the assessment of potential shadow flicker effects on residents (i.e. receptors) within the vicinity the proposed in Clinton
Commercial-in-Confidence Ashton Old Baths Financial Model - Detailed Cashflow
 Year 0 1 2 3 4 5 6 7 8 9 10 11 12 13 Oct-16 Nov-16 Dec-16 Jan-17 Feb-17 Mar-17 Apr-17 May-17 Jun-17 Jul-17 Aug-17 Sep-17 Oct-17 2,038 2,922 4,089 4,349 6,256 7,124 8,885 8,885 8,885 8,885 8,885 8,885 9,107
COMPARISON OF FIXED & VARIABLE RATES (25 YEARS) CHARTERED BANK ADMINISTERED INTEREST RATES - PRIME BUSINESS*
 CHARTERED BANK ADMINISTERED INTEREST RATES - PRIME BUSINESS*") COMPARISON OF FIXED & VARIABLE RATES (25 YEARS) 2 Fixed Rates Variable Rates For Internal Use Only. FIXED RATES OF THE PAST 25 YEARS AVERAGE RESIDENTIAL MORTGAGE LENDING RATE - 5 YEAR* (Per cent) Year
COMPARISON OF FIXED & VARIABLE RATES (25 YEARS) 2 Fixed Rates Variable Rates For Internal Use Only. FIXED RATES OF THE PAST 25 YEARS AVERAGE RESIDENTIAL MORTGAGE LENDING RATE - 5 YEAR* (Per cent) Year
COMPARISON OF FIXED & VARIABLE RATES (25 YEARS) CHARTERED BANK ADMINISTERED INTEREST RATES - PRIME BUSINESS*
 CHARTERED BANK ADMINISTERED INTEREST RATES - PRIME BUSINESS*") COMPARISON OF FIXED & VARIABLE RATES (25 YEARS) 2 Fixed Rates Variable Rates FIXED RATES OF THE PAST 25 YEARS AVERAGE RESIDENTIAL MORTGAGE LENDING RATE - 5 YEAR* (Per cent) Year Jan Feb Mar Apr May Jun
COMPARISON OF FIXED & VARIABLE RATES (25 YEARS) 2 Fixed Rates Variable Rates FIXED RATES OF THE PAST 25 YEARS AVERAGE RESIDENTIAL MORTGAGE LENDING RATE - 5 YEAR* (Per cent) Year Jan Feb Mar Apr May Jun
MONTHLY CLIMATOLOGICAL SUMMARY for JAN NAME: WMREC CITY: STATE: ELEV: 600 ft LAT: 39 38' 31" N LONG: 77 44' 00" W
 MONTHLY CLIMATOLOGICAL SUMMARY for JAN. 2015 1 34.8 45.2 3:30p 22.1 5:30a 30.2 0.0 0.00 4.8 24.0 4:00p WSW 2 34.9 44.3 3:00p 24.0 12:00m 30.1 0.0 0.00 2.4 17.0 10:30a W 3 33.0 37.8 12:00m 23.3 1:00a 32.0
SASKATOON STATION
 SRC CLIMATE REFERENCE STATION DAILY DATA REPORT SASKATOON STATION 45718 Saskatchewan 52 9' N 6 36' W 497 m asl Estab. 1963 JULY Preliminary 16 Day Temperature Degree-days Precipitation Relative Humidity
Design Criteria Data
 MEDFORD/JACKSON CO. OR Latitude = 42.37 N WMO No. 72597 Longitude =122.8 W Elevation = 1329 feet Period of Record = 1973 to 1996 Average Pressure = 28.61 inches Hg Design Criteria Data Mean Coincident
Design Criteria Data
 OKLAHOMA CITY OK Latitude = 35.4 N WMO No. 72353 Longitude = 97.6 W Elevation = 133 feet Period of Record = 1973 to 1996 Average Pressure = 28.62 inches Hg Design Criteria Data Mean Coincident (Average)
Design Criteria Data
 DES MOINES IA Latitude = 41.53 N WMO No. 72546 Longitude = 93.65 W Elevation = 965 feet Period of Record = 1973 to 1996 Average Pressure = 28.96 inches Hg Design Criteria Data Mean Coincident (Average)
Design Criteria Data
 LAS VEGAS/MCCARRAN NV Latitude = 36.8 N WMO No. 72386 Longitude =115.1 W Elevation = 2179 feet Period of Record = 1973 to 1996 Average Pressure = 27.67 inches Hg Design Criteria Data Mean Coincident (Average)
Design Criteria Data
 PHOENIX/SKY HARBOR AZ Latitude = 33.43 N WMO No. 72278 Longitude =112. W Elevation = 116 feet Period of Record = 1973 to 1996 Average Pressure = 28.72 inches Hg Design Criteria Data Mean Coincident (Average)
Design Criteria Data
 ANCHORAGE AK Latitude = 61.17 N WMO No. 7273 Longitude =15. W Elevation = 131 feet Period of Record = 1973 to 1996 Average Pressure = 29.6 inches Hg Design Criteria Data Mean Coincident (Average) Values
Design Criteria Data
 RAPID CITY SD Latitude = 44.5 N WMO No. 72662 Longitude =3. W Elevation = 3169 feet Period of Record = 1973 to 1996 Average Pressure = 26.67 inches Hg Design Criteria Data Mean Coincident (Average) Values
Design Criteria Data
 BURLINGTON VT Latitude = 44.47 N WMO No. 72617 Longitude = 73.15 W Elevation = 341 feet Period of Record = 1973 to 1996 Average Pressure = 29.61 inches Hg Design Criteria Data Mean Coincident (Average)
Design Criteria Data
 MACON/LEWIS WILSON GA Latitude = 32.7 N WMO No. 72217 Longitude = 83.65 W Elevation = 361 feet Period of Record = 1973 to 1996 Average Pressure = 29.66 inches Hg Design Criteria Data Mean Coincident (Average)
Design Criteria Data
 PIERRE SD Latitude = 44.38 N WMO No. 726686 Longitude =1.2 W Elevation = 1742 feet Period of Record = 1973 to 1996 Average Pressure = 28.1 inches Hg Design Criteria Data Mean Coincident (Average) Values
Design Criteria Data
 COLUMBIA SC Latitude = 33.95 N WMO No. 7231 Longitude = 81.12 W Elevation = 226 feet Period of Record = 1973 to 1996 Average Pressure = 29.8 inches Hg Design Criteria Data Mean Coincident (Average) Values
Design Criteria Data
 PHILADELPHIA PA Latitude = 39.88 N WMO No. 7248 Longitude = 75.25 W Elevation = 3 feet Period of Record = 1973 to 1996 Average Pressure = 29.98 inches Hg Design Criteria Data Mean Coincident (Average)
Design Criteria Data
 HONOLULU/OAHU HI Latitude = 21.35 N WMO No. 91182 Longitude =157.9 W Elevation = 16 feet Period of Record = 1967 to 1996 Average Pressure = 29.96 inches Hg Design Criteria Data Mean Coincident (Average)
Design Criteria Data
 INDIANAPOLIS IN Latitude = 39.73 N WMO No. 72438 Longitude = 86.27 W Elevation = 87 feet Period of Record = 1973 to 1996 Average Pressure = 29.15 inches Hg Design Criteria Data Mean Coincident (Average)
Design Criteria Data
 DENVER/STAPLETON CO Latitude = 39.75 N WMO No. 72469 Longitude =14.8 W Elevation = 5332 feet Period of Record = 1973 to 1995 Average Pressure = 24.66 inches Hg Design Criteria Data Mean Coincident (Average)
Design Criteria Data
 LOUISVILLE/STANDIFORD KY Latitude = 38.18 N WMO No. 72423 Longitude = 85.73 W Elevation = 489 feet Period of Record = 1973 to 1996 Average Pressure = 29.49 inches Hg Design Criteria Data Mean Coincident
Design Criteria Data
 SPOKANE WA Latitude = 47.63 N WMO No. 72785 Longitude =117.5 W Elevation = 2366 feet Period of Record = 1973 to 1996 Average Pressure = 27.5 inches Hg Design Criteria Data Mean Coincident (Average) Values
Design Criteria Data
 JACKSONVILLE FL Latitude = 3.5 N WMO No. 7226 Longitude = 81.7 W Elevation = 3 feet Period of Record = 1973 to 1996 Average Pressure = 3.1 inches Hg Design Criteria Data Mean Coincident (Average) Values
Design Criteria Data
 DAYTON/JAMES M COX OH Latitude = 39.9 N WMO No. 72429 Longitude = 84.2 W Elevation = 14 feet Period of Record = 1973 to 1996 Average Pressure = 28.95 inches Hg Design Criteria Data Mean Coincident (Average)
Design Criteria Data
 BOSTON/LOGAN MA Latitude = 42.37 N WMO No. 7259 Longitude = 71.3 W Elevation = 3 feet Period of Record = 1967 to 1996 Average Pressure = 29.95 inches Hg Design Criteria Data Mean Coincident (Average) Values
Design Criteria Data
 SPRINGFLD MO Latitude = 37.23 N WMO No. 7244 Longitude = 93.38 W Elevation = 127 feet Period of Record = 1973 to 1996 Average Pressure = 28.66 inches Hg Design Criteria Data Mean Coincident (Average) Values
Design Criteria Data
 BIRMINGHAM AL Latitude = 33.57 N WMO No. 72228 Longitude = 86.75 W Elevation = 63 feet Period of Record = 1973 to 1996 Average Pressure = 29.36 inches Hg Design Criteria Data Mean Coincident (Average)
Design Criteria Data
 MINNEAPOLIS-ST PAUL MN Latitude = 44.88 N WMO No. 72658 Longitude = 93.22 W Elevation = 837 feet Period of Record = 1973 to 1996 Average Pressure = 29.7 inches Hg Design Criteria Data Mean Coincident (Average)
Design Criteria Data
 WASHINGTON/DULLES VA Latitude = 38.95 N WMO No. 7243 Longitude = 77.45 W Elevation = 322 feet Period of Record = 1973 to 1996 Average Pressure = 29.68 inches Hg Design Criteria Data Mean Coincident (Average)
Design Criteria Data
 MIDLAND TX Latitude = 31.95 N WMO No. 72265 Longitude =2. W Elevation = 2861 feet Period of Record = 1973 to 1996 Average Pressure = 27.3 inches Hg Design Criteria Data Mean Coincident (Average) Values
Design Criteria Data
 NEW YORK/JOHN F KENNEDY NY Latitude = 4.65 N WMO No. 74486 Longitude = 73.78 W Elevation = 23 feet Period of Record = 1973 to 1996 Average Pressure = 29.98 inches Hg Design Criteria Data Mean Coincident
Design Criteria Data
 LANDER/HUNT WY Latitude = 42.82 N WMO No. 72576 Longitude =18.7 W Elevation = 5558 feet Period of Record = 1973 to 1996 Average Pressure = 24.44 inches Hg Design Criteria Data Mean Coincident (Average)
Design Criteria Data
 MINOT AFB ND Latitude = 48.42 N WMO No. 727675 Longitude =11.3 W Elevation = 1667 feet Period of Record = 1967 to 1996 Average Pressure = 28.16 inches Hg Design Criteria Data Mean Coincident (Average)
Design Criteria Data
 CHARLESTON/KANAWHA WV Latitude = 38.37 N WMO No. 72414 Longitude = 81.6 W Elevation = 981 feet Period of Record = 1973 to 1996 Average Pressure = 29. inches Hg Design Criteria Data Mean Coincident (Average)
Design Criteria Data
 ALBUQUERQUE NM Latitude = 35.5 N WMO No. 72365 Longitude =16.6 W Elevation = 5315 feet Period of Record = 1967 to 1996 Average Pressure = 24.72 inches Hg Design Criteria Data Mean Coincident (Average)
Design Criteria Data
 DULUTH MN Latitude = 46.83 N WMO No. 72745 Longitude = 92.18 W Elevation = 1417 feet Period of Record = 1973 to 1996 Average Pressure = 28.43 inches Hg Design Criteria Data Mean Coincident (Average) Values
Design Criteria Data
 MADISON/DANE CO. RGNL WI Latitude = 43.13 N WMO No. 72641 Longitude = 89.33 W Elevation = 866 feet Period of Record = 1973 to 1996 Average Pressure = 29.5 inches Hg Design Criteria Data Mean Coincident
Design Criteria Data
 CHICAGO/O HARE IL Latitude = 41.98 N WMO No. 7253 Longitude = 87.9 W Elevation = 673 feet Period of Record = 1967 to 1996 Average Pressure = 29.27 inches Hg Design Criteria Data Mean Coincident (Average)
Design Criteria Data
 RENO/CANNON INTL NV Latitude = 39.5 N WMO No. 72488 Longitude =119.7 W Elevation = 44 feet Period of Record = 1973 to 1996 Average Pressure = 25.57 inches Hg Design Criteria Data Mean Coincident (Average)
Graph #1. Micro-Generation Generating Units in Alberta 20
 2, Graph #1. Micro-Generation Generating Units in Alberta 2 Cumulative # of Generating Units 1,9 1,8 1,7 1,6 1,5 1,4 1,3 1,2 1,1 1, 9 8 7 6 5 4 3 2 Number of MGG Units as of 216 Mar 31 Number of Solar
Appendix F. Ship Drift Analysis West Coast of North America: Alaska to Southern California HAZMAT Report ; April 2000
 Appendix F Ship Drift Analysis West Coast of North America: Alaska to Southern California HAZMAT Report 2000-2; April 2000 2.2 Drift Factors When its propulsion or steering device fails, a ship will drift
Up and Down Months of the Stock Market
 Up and Down Months of the Stock Market 1926-2017 Positive years (66) in the stock market were not good all year long and losing years (24) were not losers throughout the year. Winning years produce losing
DRAFT. Total Month Average Point (MAP) A Massage 4/30/2014 8/1/2015 A CENTER E
 A Massage 4/30/2014 8/1/2015 A CENTER E") Total Month Average Point (MAP) A Massage 4/30/2014 8/1/2015 A CENTER E 2.25 2.00 2.00 2.25 2.00 2.00 1.00 2.25 2.00 2.25 2.00 A Massage 10/31/2017 9/1/2015 B MEZZANINE 2.25 2.00 2.00 2.25 2.25 2.25 2.25
Total Month Average Point (MAP) A Massage 4/30/2014 8/1/2015 A CENTER E 2.25 2.00 2.00 2.25 2.00 2.00 1.00 2.25 2.00 2.25 2.00 A Massage 10/31/2017 9/1/2015 B MEZZANINE 2.25 2.00 2.00 2.25 2.25 2.25 2.25
NE (SE) Beam
 Beam") Predicted clear day beam and diffuse irradiances (/ W m 2 ) on vertical and horizontal surfaces on specified days in northern (N) and southern (S) hemispheres (see notes at foot of table): LATITUDE 60
Predicted clear day beam and diffuse irradiances (/ W m 2 ) on vertical and horizontal surfaces on specified days in northern (N) and southern (S) hemispheres (see notes at foot of table): LATITUDE 60
Sunrise: 05:48 N (S) Beam
 Beam") Predicted clear day beam and diffuse irradiances (/ W m 2 ) on vertical and horizontal surfaces on specified days in northern (N) and southern (S) hemispheres (see notes at foot of table): LATITUDE 40
Predicted clear day beam and diffuse irradiances (/ W m 2 ) on vertical and horizontal surfaces on specified days in northern (N) and southern (S) hemispheres (see notes at foot of table): LATITUDE 40
Yield Reduction Due to Shading:
 x9 31 x SunPower 1 x Power-One SPR-E0-37 37 W TRIO-8.5-TL-OUTD 10 ; 1x13 1x13 1 x Power-One 10 ; -30 7.5kW 9 x SunPower 1 x Power-One SPR-E0-37 37 W 10 ; 59 7.5kW 7 x SunPower 1 x Power-One SPR-E0-37 37
NJ Solar Market Update As of 6/30/15
 NJ Solar Market Update As of 6/30/ Prepared by Charlie Garrison July 17, 20 SOLAR INSTALLED CAPACITY DATA The preliminary installed solar capacity as of 6/30/ is approximately 1,500.7 MW. Approximately
TM ETRS-TM35FIN-ETRS89 WTG
 Noise calculation model: ISO 9613-2 General Wind speed: 8,0 m/s Ground attenuation: General, Ground factor: 0,4 Meteorological coefficient, C0: 0,0 db Type of demand in calculation: 1: WTG noise is compared
ENVIRONMENTAL & ENGINEERING SERVICES DEPARTMENT
 CITY OF LONDON ENVIRONMENTAL & ENGINEERING SERVICES DEPARTMENT WASTEWATER TREATMENT OPERATIONS VAUXHALL WASTEWATER TREATMENT PLANT 2013 ANNUAL REPORT FEBRUARY 2014 Vauxhall Wastewater Treatment Plant 2013
ANCR CRU Statistics February 2007 to December 2007
 ANCR CRU Statistics February 2007 to December 2007 o Jan/07 Feb/07* Mar/07 Apr/07 May/07 Jun/07 Jul/07 Aug/07 Sep/07 Oct/07 Nov/07 Dec/07 Total notes data from Perimeter phone system unavailable prior
APPENDIX VIII. SOUND AND SHADOW FLICKER ASSESSMENT
 APPENDIX VIII. SOUND AND SHADOW FLICKER ASSESSMENT 140 New Victoria Community Wind Project July 6, 2016 Sound and Shadow Flicker Report AL-PRO Wind Energy Consulting Canada Inc. Introduction Celtic Current
Monthly data generated on Wednesday, July 31, 2013 at 13:04 UTC
 MESONET CLIMATOLOGICAL DATA SUMMARY May 2013 Time Zone: Midnight-Midnight CST 1 82 40 63.9 NA 4 0 NA NA NA 0.01 28.18 29.90 N 19.2 46.3 24.90 66.6 71.4 77 66 2 54 36 43.5 NA 20 0 NA NA NA 0.05 28.67 30.42
Yield Reduction Due to Shading:
 x Fronius International NA-E35L5 35 W FRONIUS IG Plus 20 V-3 2 0,0kW x Fronius International NA-E35L5 35 W FRONIUS IG Plus 20 V-3 4 0,0kW 84 x SHARP Corporation x Fronius International NA-E35L5 35 W FRONIUS
W (W) Beam
 Beam") Predicted clear day beam and diffuse irradiances (/ W m 2 ) on vertical and horizontal surfaces on specified days in northern (N) and southern (S) hemispheres (see notes at foot of table): LATITUDE 0 N/S
Predicted clear day beam and diffuse irradiances (/ W m 2 ) on vertical and horizontal surfaces on specified days in northern (N) and southern (S) hemispheres (see notes at foot of table): LATITUDE 0 N/S
LOCAL CLIMATOLOGICAL DATA Monthly Summary April 2012
 Deg. Days Precip Ty Precip Wind Solar Hu- Adj. to Sea Level mid- ity Avg Res Res Peak Minute 1 fog 2 hvy fog 3 thunder 4 ice plt 5 hail 6 glaze 7 duststm 8 smk, hz 9 blw snw 1 2 3 4A 4B 5 6 7 8 9 11 12
NJ Solar Market Update
 NJ Solar Market Update April 16, 20 Renewable Energy Committee Meeting Trenton, NJ Prepared by Charlie Garrison Solar Installed Capacity Data The preliminary installed solar capacity as of 3/31/ is approximately
LOCAL CLIMATOLOGICAL DATA Monthly Summary April 2015
 Deg. Days Precip Ty Precip Wind Solar Hu- Adj. to Sea Level mid- ity Avg Res Res Peak 2 Minute 1 fog 2 hvy fog 3 thunder 4 ice plt 5 hail 6 glaze 7 duststm 8 smk, hz 9 blw snw 1 2 3 4A 4B 5 6 7 8 9 11
LOCAL CLIMATOLOGICAL DATA Monthly Summary April 2017
 Deg. Days Precip Ty Precip Wind Solar Hu- Adj. to Sea Level mid- ity Avg Res Res Peak 2 Minute 1 fog 2 hvy fog 3 thunder 4 ice plt 5 hail 6 glaze 7 duststm 8 smk, hz 9 blw snw 1 2 3 4A 4B 5 6 7 8 9 11
Regulation Update. Operating Committee September 12, PJM 2017
 Regulation Update Operating Committee September 12, 2017 Regulation Market Clearing Price *Data up to Aug 22 2 Mileage Ratio Mileage Ratio has increased since the new signal implementation Larger Utilization
Past Due. Account Charges. Contract Charges Security Deposit Due - Jun 09, , Customer Service. Jun 19, PAST DUE $1,693.
 11983978 Jun 19, 217 1 124 958 PAST DUE $1,693.97 Meter Reading Information Meter # 55271 May 3 655 Jun 15 6642 17 days 1397 on or about Aug 15 82 Past Due Balance payable includes an amount which is payable
Port Botany. Trade Statistics Bulletin 1 July June 2018
 Port Botany Trade Statistics Bulletin 1 July 2017 30 June 2018 FY 2017/18 Port Botany Container Trade Jul 2017 Aug 2017 Sep 2017 Oct 2017 Nov 2017 Dec 2017 Jan 2018 Feb 2018 Mar 2018 Apr 2018 May 2018
Energy Produced by PV Array (AC):
:") 4x17 2x16 400 x PHOTON SOLAR 4 x KACO new energy PH-250P-60 (HDS) INT 250 W Powador 30,0 TL3 15 ; 0 25,0kW Location: Climate Data Record: PV Output: Gross/Active PV Surface Area: Antalya Antalya (1961-1990)
4x17 2x16 400 x PHOTON SOLAR 4 x KACO new energy PH-250P-60 (HDS) INT 250 W Powador 30,0 TL3 15 ; 0 25,0kW Location: Climate Data Record: PV Output: Gross/Active PV Surface Area: Antalya Antalya (1961-1990)
Balance from your previous bill $0.00 Meter # Basic Charge: 17 $ /day 3.23* Energy charge:¹ 2
 11983979 Jun 19, 217 1 124 962 Jul 11, 217 $24.34 Meter Reading Previous Bill. Balance from your previous bill $. Meter # 552711 May 3 19813 Account Account charge 12.4* Charges 17 days 82 Jun 15 19895
Large scale solar power plant in Nordic conditions. Antti Kosonen, Jero Ahola, Christian Breyer, Albert Albó
 Large scale solar power plant in Nordic conditions Antti Kosonen, Jero Ahola, Christian Breyer, Albert Albó 25.8.214 Finland Finland: Location: between latitudes of 6 7 Area: 338 435 km 2 Population: 5.4
Results of annual simulation
 2 x Vitosol 100-FM SVKF Total gross surface area:4,46 m² Azimuth: 0 Incl.: 30 160 Liters/Day 50 C Gas-fired boiler 26 kw Vitocell 100-B Vol : 250 l Results of annual simulation Installed collector power:
Energy use in potato stores
 Energy use in potato stores Adrian Cunnington PCL Sutton Bridge Potato Council Energy Forum Huntingdon 11 February 2010 Storage costs Fixed (capital) costs Variable (running) costs Finance costs Potato
ANCR CRU Statistics Februa.. to December 2007
 ANCR CRU Statistics Februa.. to December 2007 Jan/07 Feb/07* Mar/07 Apr/07 May/07 Jun/07 Jul/07 Aug/07 Sep/07 Oct/07 Nov/07 Dec/07 Total notes Answered dato from Perimeter phone system unavailable prior
Climatography of the United States No
 Climate Division: CA 5 NWS Call Sign: Month (1) Min (2) Month(1) Extremes Lowest (2) Temperature ( F) Lowest Month(1) Degree s (1) Base Temp 65 Heating Cooling 100 Number of s (3) Jan 45.9 26.0 36.0 67
The impact of electric vehicle development on peak demand and the load curve under different scenarios of EV integration and recharging options
 The impact of electric vehicle development on peak demand and the load curve under different scenarios of EV integration and recharging options Electricity demand in France: a paradigm shift Electricity
University of Michigan Eco-Driving Index (EDI) Latest data: October 2017
 Latest data: October 2017") University of Michigan Eco-Driving Index () http://www.ecodrivingindex.org Latest data: October 2017 Developed and issued monthly by Michael Sivak and Brandon Schoettle Sustainable Worldwide Transportation
University of Michigan Eco-Driving Index () http://www.ecodrivingindex.org Latest data: October 2017 Developed and issued monthly by Michael Sivak and Brandon Schoettle Sustainable Worldwide Transportation
NJ Solar Market Update As of 2/29/16
 NJ Solar Market Update As of 2/29/16 Prepared by Charlie Garrison March 24, 2016 SOLAR INSTALLED CAPACITY DATA The installed solar capacity as of 2/29/16 is approximately 1,644.3 MW. Approximately 20.3
MONTHLY PERFORMANCE DASHBOARD
 AUSTIN ENERGY MARCH 21 MONTHLY PERFORMANCE DASHBOARD A report highlighting key Austin Energy metrics for uary FY 21 FINANCIAL HEALTH Standard and Poor s Bond Rating Current AA AA Budget Based Revenues
Florida Courts E-Filing Authority Board. Service Desk Report October 2018
 Florida Courts E-Filing Authority Board Service Desk Report October 218 Customer Service Incidents October 218 Status August 218 September 218 October 218 Incidents Received 3,157 2,685 3,779 Incidents
Florida Courts E-Filing Authority Board. Service Desk Report December 2018
 Florida Courts E-Filing Authority Board Service Desk Report December 218 Customer Service Incidents December 218 Status October 218 November 218 December 218 Incidents Received 3,779 2,632 2,376 Incidents
Climatography of the United States No
 Climate Division: WY 9 NWS Call Sign: LND Temperature ( F) Month (1) Min (2) Month(1) Extremes Lowest (2) Lowest Month(1) Degree s (1) Base Temp 65 Heating Cooling 100 Number of s (3) Jan 31.9 8.7 20.3
MONTHLY PERFORMANCE DASHBOARD
 AUSTIN ENERGY JULY MONTHLY PERFORMANCE DASHBOARD A report highlighting key Austin Energy metrics for e FY FINANCIAL HEALTH Standard and Poor s Bond Rating Austin Energy Rating AA AA Budget Based Revenues
Valley Real Estate Review
 Valley Real Estate Review 35, 3, 25, 2, 15, 1, 5, December 218 Listings Months of Inventory 217 218 % of Change 2,479 2,74 1.53% 2.46 2.77 12.6% Offices Combined Force Total Listing Issued Total Annual
OPERATIONS TOTALS ,135 7,511 8,823 8,056 8,021 8,319 8,039 8,283 8,001 8,738 8,219 8,094 98,239
 2007 OPERATIONS AIRCRAFT OPS-2006 JAN FEB MAR APR MAY JUN JUL AUG SEP OCT NOV DEC TOTAL AIR CARRIER - ITINERANT 748 725 907 804 930 969 832 996 841 899 990 1,249 10,890 AIR TAXI - ITINERANT 3,744 3,638
NJ Solar Market Update As of 10/31/15
 NJ Solar Market Update As of 10/31/15 Prepared by Charlie Garrison Renewable Energy Committee Meeting November 10, 2015 SOLAR INSTALLED CAPACITY DATA The preliminary installed solar capacity as of 10/31/15
FINAL SHADOW FLICKER REPORT FOR THE DEVELOPMENT OF WIND ENERGY FACILITIES AT NAVSTA NEWPORT, RHODE ISLAND. Prepared By:
 FINAL SHADOW FLICKER REPORT FOR THE DEVELOPMENT OF WIND ENERGY FACILITIES AT NAVSTA NEWPORT, RHODE ISLAND Prepared By: Geo-Marine, Inc. 2201 K Avenue, Suite A2 Plano, Texas 75074 May 2011 March 2011 1
Example Airshed. Sample January 2019 Monthly Ambient Air Quality Monitoring Report
 Example Airshed Sample January 219 Monthly Ambient Air Quality Monitoring Report 28 February 219 DISCLAIMER: This sample monthly report is provided as guidance only. The structure, look and layout of monthly
Report energy requirements Ljusdal
 Report energy requirements Ljusdal Commissioned by: Royal Pride Holland B.V. Wagenpad 12 1775 RJ MIDDENMEER Consulting company: AAB Nederland Horti Business Center 2 e verdieping Jupiter 420 2675 LX HONSELERSDIJK
MONTHLY PERFORMANCE DASHBOARD
 AUSTIN ENERGY MONTHLY PERFORMANCE DASHBOARD A report highlighting key Austin Energy metrics for uary FY 219 FINANCIAL HEALTH Standard and Poor s Bond Rating Austin Energy Rating AA AA Budget Based Revenues
100kW GROUND MOUNTED SOLAR PHOTOVOLTIC POWER PLANT DETAILED PROJECT REPORT AERO SPACE MATERIALS PVT LTD
 EXECUTIVE SUMMARY 100kW GROUND MOUNTED SOLAR PHOTOVOLTIC POWER PLANT 1. Location i) State : TAMIL NADU, ii) Locality : KOVILPALAYAM, POLLACHI iii) Latitude : 10 45 16.22 N iv) Longitude : 77 01 15.27 E
RIDERSHIP TRENDS. April 2018
 RIDERSHIP TRENDS April Prepared by the Division of Strategic Capital Planning June Table of Contents Executive Summary...1 Ridership...3 Estimated Passenger Trips by Line...3 Estimated Passenger Trips
S WSW 67
 HANDOUT AT RS A FROM: RS A 909 133½ WSW REGULARITY SECTION A VIA: TO: TPA1, TPA2, TPA3 Test 2 via 843 250½ S and West Raynham map on page 12 of Roadbook. PROCEED AT 26.5 MPH for 5 MILES THEN AT 24.0 MPH
Local Market Update February 2013
 Local Market Update February 213 February sales of single-family homes reported in Lucas and Upper Wood County by the Toledo Board of REALTORS totaled 315. This was unchanged compared to February of 212.
Port Botany. Trade Statistics Bulletin 1 July April 2018
 Port Botany Trade Statistics Bulletin 1 July 2017 30 April 2018 YTD April 2018 Port Botany Container Trade Jul 2017 Aug 2017 Sep 2017 Oct 2017 Nov 2017 Dec 2017 Jan 2018 Feb 2018 Mar 2018 Apr 2018 Export
NEWS Release. U.S. Manufacturing Technology Orders. Year-to-date U.S. manufacturing technology orders up 4.1% over 2011
 U.S. Manufacturing Technology Orders A statistical program of AMT NEWS Release FOR RELEASE: October 8, 2012 Contact: Pat McGibbon, AMT, 703-827-5255 Year-to-date U.S. manufacturing technology orders up
2017 SC Producers Whole Farm Revenue Protection Expected Price Justification
 2017 SC Producers Whole Farm Revenue Protection Expected Price Justification RMA Projected Expected As of Average Futures Price Close As of RMA Projected Prices 4 Feb 2011 2015 % Differ 4 Feb Crop Contract
Company name: Created by: Phone:
 Qty. Description 1 SQF 2.5-2 Note! Product picture may differ from actual product Product No.: 95027330 The 3" SQFlex pump with helical rotor is for high heads and low flow rates. The SQFlex system is
Climatography of the United States No
 Climate Division: MA 3 NWS Call Sign: BOS Month (1) Min (2) Month(1) Extremes Lowest (2) Temperature ( F) Lowest Month(1) Degree s (1) Base Temp 65 Heating Cooling 100 Number of s (3) 36.5 22.1 29.3 72
MONTHLY PERFORMANCE DASHBOARD
 AUSTIN ENERGY MONTHLY PERFORMANCE DASHBOARD A report highlighting key Austin Energy metrics for ember FY 219 FINANCIAL HEALTH Standard and Poor s Bond Rating Austin Energy Rating AA AA Budget Based Revenues
A 3-Year Case Study of a Residential Photovoltaic System with Microinverters
 A 3-Year Case Study of a Residential Photovoltaic System with Microinverters Clifford K. Ho Sandia National Laboratories, Albuquerque, NM Sandia National Laboratories is a multi-program laboratory managed
Facilitated Discussion on the Future of the Power Grid
 Facilitated Discussion on the Future of the Power Grid EPRI Seminar: Integrated Grid Concept and Technology Development Tokyo Japan, August 20, 2015 Matt Wakefield, Director Information, Communication
Daily output in average month 77 m³ Daily values Jan Feb Mar Apr May Jun Jul Aug Sep Oct Nov Dec Av.
 Parameter Location: Romania, Bârlad (46 North; 27 East) Water temperature: 12 C Required daily output: 40 m³; Sizing for average month Dirt loss: 5,0 % Motor cable: 30 m Pipe type: plastic, drawn/pressed,
PDR Energy Baseline Alternative. Proposal for Discussion October 27, 2015
 PDR Energy Baseline Alternative Proposal for Discussion October 27, 2015 Update Since Last Meeting Since the October 12 th Working Group Meeting Stem, Solar City, AMS and CESA have had over a half-dozen
Preston s Edmond Market Report
 Preston s Edmond arket Report April 2 Prepared By Brian Preston RE/AX Associates obile: 45-826-5725 Office: 45-359-87 bpreston88@sbcglobal.net www.edmond4sale.com Realtor of the Year 1995 & 22 Lifetime