Gasoline Prices and the Consumer: Perceptions and Realities
|
|
|
- Lee Reeves
- 6 years ago
- Views:
Transcription
1 Gasoline Prices and the Consumer: Perceptions and Realities NACS Online Annual Gasoline Price Resource Kit February 2,
2 Gasoline Prices and the Consumer: Perceptions and Realities As the petroleum industry prepares for the beginning of the spring transition to summer-blend fuel, NACS examines the basic conditions that affect the industry, including a new report on consumer perceptions about gasoline prices, the 2007 NACS Consumer Fuels Report. Overview How to Use These Resources Information about why these resources were developed and how they can be used. Backgrounders Pennies Matter to Consumers at the Pump (Findings from the 2007 NACS Consumer Fuels Report) High gasoline prices have not changed Americans driving habits, but they have significantly changed their gas-purchasing habits, with price becoming more important than ever. Consumer Perceptions of the Retail Gasoline Industry (Findings from the 2007 NACS Consumer Fuels Report) The makeup of the retail locations at which they buy their gasoline and how much the stores profit from gasoline sales are a mystery to most U.S. consumers. Consumer Expectations with Alternative Fuels (Findings from the 2007 NACS Consumer Fuels Report) Consumers say they are green, but the only green that tends to matter to them is in their wallets. Who Sells Gasoline in the United States? Convenience stores sell nearly 80 percent of the gasoline in the United States, and only a few percent are owned by the oil companies. How Do Retailers Get and Sell Gasoline? Retail prices directly track wholesale gasoline prices. How and when retailers purchase wholesale gasoline plays a significant role in the ultimate price at the pump. Retailers Pain at the Pump Convenience stores dislike higher prices as much as their customers do, as margins decrease while costs -- particularly credit card fees -- increase. Retailers Margins Shrink as Prices Climb Gasoline prices increased 60 cents last spring, but retailer margins tightened. Diesel Fuel Market Also Sees Price Volatility Diesel fuel prices, like gasoline prices, are heavily influenced by the price of crude oil. Refining Capacity and Boutique Fuels A variety of boutique fuels compounds the existing challenges of the domestic refining industry. Statistics and Definitions The latest information available on demand, supply, refining, distribution and retail.
3 100-plus Years of Gasoline Retailing Some of the significant milestones in the industry since the first gas station opened in Graphics Where Does Your Fill-Up Go? More than 90 percent of the cost of a gallon of gasoline is determined before it even leaves the refinery. From Dollars in Cost to Cents in Profit After expenses, retailers may only see a penny in pretax profit per gallon. Related Fact Sheets Gasoline Theft at Convenience Stores When gasoline prices increase, many gasoline retailers report an increase in gasoline theft, commonly referred to as "drive-offs." Motor Fuels Sales at Convenience Stores Convenience stores sell nearly 80 percent of all gasoline purchased in the country. Debit Holds for Fuel Purchases As gas prices and the use of plastic at the pump have increased, consumers are increasingly concerned about the debit "holds" on their accounts. Credit Card Fees a Growing Challenge Fees now equal more than 90 percent of a store's profits -- and continue to grow. Gasoline Myths and Facts A few of the more common myths - -and the actual facts -- about gasoline. Other Resources Online Resources on Gasoline Prices Web sites and resources providing additional information. Contact Information Reporters can click here to access NACS media contacts. Also, retailers are encouraged to provide feedback to help NACS address the issues of most concern to you.
4 How to Use These Resources To address consumers' questions about gasoline prices, the National Association of Convenience Stores (NACS) has annually developed an online resource kit about the U.S. petroleum industry. As the national trade association representing the convenience and petroleum retailing industry, which sells an estimated 80 percent of all the gasoline purchased in the United States, NACS developed these resources so that the media, legislators and the general public can better understand the petroleum industry, especially at the retail level. These resources also can be used by retailers who are interested in conducting their own outreach in communicating the issues behind today's higher gasoline prices. For the first time, this kit also includes consumer perceptions about gasoline prices, sharing the results of the 2007 NACS Consumer Fuels Report, a nationwide study conducted in late December 2006 and early January Convenience store retailers dislike higher gasoline prices as much as their customers do, since margins decrease while costs particularly credit card fees increase. When wholesale prices go up, prices at the pump typically lag as retailers absorb some of the wholesale price increases by reducing their margins to remain competitive. Price volatility in 2004 and 2005, for example, helped lead to gasoline margins that were at their lowest levels since (Final NACS data for 2006 is not available yet, but data from the Oil Price Information Service suggests that margins were much slimmer in 2006.) These convenience stores also do not benefit from the strong upstream profits announced by the major oil companies. Very few retail fuel outlets are owned by the major oil companies. In fact, less than 3 percent of all convenience stores selling gasoline are owned by one of the five major integrated oil companies. To counter slim profit margins for gasoline sales, these stores seek to drive profits by growing their in-store sales, whether coffee, sandwiches, financial services or cold beverages. Virtually any item in the store can carry a healthier profit margin that a fill-up at the pump. This is the sixth year that NACS has developed an online resource kit addressing gasoline issues. While the circumstances may be different every year, the pattern seen in petroleum markets is eerily similar year to year, and will once again be of concern for consumers and retailers alike in the coming months. The first week of February traditionally marks the beginning of the spring transition to summer-blend fuels for the petroleum industry. Since 2000, gasoline prices have increased, on average, more than 30 cents between the first week in February and the time of the seasonal high price, typically late May. In 2005, gasoline prices jumped more than 60 cents in that period. In a sense, the petroleum markets are similar to the Bill Murray movie Groundhog Day in which his character wakes up every day to find that it unfolds, event-by-event, exactly the same as the day he had just experienced. Like the character in Groundhog Day, the petroleum markets experience similar conditions over and over except on an annual, rather than daily, basis. It is because of the similarity to the movie Groundhog Day and the traditional start of the spring transition to summer-blend gasoline that NACS has annually launched its online resource kit on February 2, Groundhog Day. We have tried to incorporate the most current data on the petroleum marketing industry, and some numbers are just days or weeks old. For NACS-specific data, we have used 2005 numbers, since NACS' 2006 industry data will not be available until April 2007.
5 It is difficult, if not impossible, to predict where crude oil or gasoline prices will go. There are simply too many variables that affect the supply of fuel in this country. The goal of this resource is to instead look at the underlying conductions and address perceptions and realities in the marketplace. These resources are designed to provide resources for an open discussion about the issues impacting supply and prices during the seasonal transition and, through a better understanding of the petroleum markets, help ease the frustrations consumers often experience when prices increase. And, importantly, to help guide discussions on the issue of higher gasoline prices to solutions that can benefit us all.
6 Pennies Matter to Consumers at the Pump Findings from 2007 NACS Consumer Fuels Report High gasoline prices have not changed Americans driving habits but they have significantly changed their purchasing habits, as price is by far the number-one reason why drivers select a specific store to purchase gasoline. In fact, more than one out of four drivers say they change their behavior to save as little as one penny per gallon. The typical fill-up at a convenience store ranges from 10 to 12 gallons, according to NACS estimates. The following findings from the 2007 NACS Consumer Fuels Report were released February 2 by NACS as part of its annual gas price kit, which examines conditions and trends that could impact gasoline prices. Convenience stores sell an estimated 80 percent of the gasoline purchased in the United States. The 2007 NACS Consumer Fuels Report was based on a nationwide survey of 1,238 consumers conducted in late December 2006 and early January 2007 by Penn, Schoen and Berland Associates LLC. Consumers will change behavior for as little as a penny per gallon. More than one in four drivers say they would take a left-hand turn across a busy street to save a penny per gallon, and nearly half would do it to save three cents per gallon. Q: Take a left hand turn across a busy street... Overall If you could save 1 cent per gallon of gas would you do this? If you could save 2 cents per gallon of gas would you do this? If you could save 3 cents per gallon of gas would you do this? If you could save 4 cents per gallon of gas would you do this? If you could save 5 cents per gallon of gas would you do this?
7 One in five drivers would drive five minutes out of their way to save a penny per gallon. Q: Drive 5 minutes out of your way Overall If you could save 1 cent per gallon of gas would you do this? If you could save 2 cents per gallon of gas would you do this? If you could save 3 cents per gallon of gas would you do this? If you could save 4 cents per gallon of gas would you do this? If you could save 5 cents per gallon of gas would you do this? One in nine drivers would travel 10 minutes out of their way to save a penny per gallon, and one in four would do it to save up to three cents. Q: Drive 10 minutes out of your way Overall If you could save 1 cent per gallon of gas would you do this? If you could save 2 cents per gallon of gas would you do this? If you could save 3 cents per gallon of gas would you do this? If you could save 4 cents per gallon of gas would you do this? If you could save 5 cents per gallon of gas would you do this? While consumers will adjust their buying behavior as gasoline prices rise, most will not adjust their driving behavior. More than half of all drivers say they drive the same amount when prices are high, and only one in nine say they drive a lot less when prices go up. Q: When gas prices rise do you typically drive? Overall About the same amount 57 Somewhat less 31 A lot less 11 Don't know/refuse (vol.) 1
8 Two out of three drivers say price is the most important factor when shopping for gasoline, while only 22 percent say location is most important. Combined with consumers second most important factor, price was important to 88 percent of consumers surveyed. Q: When buying gas, which of the following factors is most important to you? Overall Price 66 Location of store/station 22 Brand 9 In-store offer 1 Other (vol.) 1 Don't know/ refused (vol.) 1 Q: What would you say is the next most important factor? Overall Location of store/station 56 Price 22 Brand 13 In-store offer 3 Other (vol.) 3 Don't know/refused (vol.) 3 The findings represent a significant shift in consumer behavior over the past seven years. In 1999, a NACS consumer study found that price ranked behind convenient location as a primary reason why consumers select a store to purchase gasoline. Consumer price sensitivity has intensified competition among retailers, resulting in declining gasoline net margins over the past few years to approximately a penny per gallon. NACS estimates that the break-even mark-up for a gallon of gasoline was 13 cents per gallon in 2006, and the Oil Price Information Service reports that in 2006 the national average gross margins on gasoline were cents per gallon. Consumer price sensitivity also impacts retailers, as one in four consumers say they buy less inside the store when gasoline prices are high. Q: When you go into the store to pay for gas, which of the following statements best describes you? Overall When gas prices rise I typically buy fewer items inside the store to save money 27 When gas prices rise I typically buy more items than I would otherwise to combine trips 6 When gas prices rise I typically buy the same amount inside the store 52 Don't know/refuse (vol.) 14
9 Consumers are much more likely to pay with plastic when gasoline prices are high. Nearly half (47 percent) of all drivers said that they are much more likely to use a debit or credit card when gasoline prices rise, leading to additional credit card interchange fees for retailers and potential increases in personal debt for consumers. Q: When gas prices rise are you? Overall Much more likely to use a debit or credit card 47 Somewhat more likely to use a debit or credit card 10 Somewhat more likely to pay with cash 6 Much more likely to pay with cash 29 Don't know/refused (vol.) 8
10 Consumer Perceptions of the Retail Gasoline Industry Findings from 2007 NACS Consumer Fuels Report While the vast majority of drivers buy gasoline at least weekly and shop based on a store s specific price, the makeup of the retail locations at which they buy their gasoline and how much the stores profit from gasoline sales are a mystery to most U.S. consumers. Most consumers believe that major oil companies own and operate the majority of fueling stations in the United States, far above the percentage that actually do. Consumers also believe profits made by gasoline retailers are much higher than they actually are. The following findings from the 2007 NACS Consumer Fuels Report were released February 12 by NACS as part of its annual gas price kit, which examines conditions and trends that could impact gasoline prices. Convenience stores sell an estimated 80 percent of the gasoline purchased in the United States. The 2007 NACS Consumer Fuels Report was based on a nationwide survey of 1,238 consumers conducted in late December 2006 and early January 2007 by Penn, Schoen and Berland Associates LLC. Consumers believe that major oil companies dominate retail gasoline sales. Over half of all consumers say that most of the gasoline retailing locations in the United States are owned and operated by one of the major oil companies. In reality, less than 3 percent of the more than 112,000 convenience stores selling gasoline are owned and operated by major oil companies. Roughly 60 percent of these stores are one-store operations, owned by independent entrepreneurs who may choose to sell a specific brand of fuel. Q: What percentage of retail gas locations do you believe are owned and operated by major oil companies? Overall 0%-5% 3 6%-10% 4 11%-25% 7 26%-50% 16 51%-75% 21 76%-100% 31 Don't know/refuse (vol.) 17
11 Consumers believe profits made by gasoline retailers are much higher than they actually are. One in seven (14 percent) consumers aged 18 to 49 believe that retail profits top $1 per gallon. In reality, after factoring in all expenses, including credit card fees but excluding labor, the real average profit per gallon is closer to 1 cent, NACS estimates. Overall, one in 11 consumers say that gasoline retailers make more than $1 per gallon. Q: If you are paying $2.50, how much do you think a retailer is making in profit on a gallon of the gas after subtracting costs such as the cost of the gas, taxes, rent insurance and employee salaries? Overall Age cents cents cents cents to $ More than $ Don't know/refuse (vol.) More than one in three consumers say that retailers make more per gallon when prices increase. Only one in 20 (5 percent) consumers correctly said that profit margins typically decrease as gasoline prices increase. Q: When the price of gas goes up do you think the profit a retailer makes typically increases, decreases, or stays about the same? Overall Stays about the same 55 Increases 36 Decreases 5 Don't know/refused (vol.) 4
12 Consumers idea of fair profit is actually a lot higher than real profit. Three out of five consumers say it would be fair for a retailer to make a profit of 6 cents or more per gallon of gasoline, much higher than retailers real profits. One in 9 consumers say that at least 50 cents per gallon in profit, after expenses, would be fair. Q: If you are paying $2.50, how much profit do you think it is fair for a retailer to make on a gallon of gas after subtracting costs such as the cost of the gas, taxes rent, insurance and employee salaries? Overall 1-5 cents cents cents cents to $ More than $ Don't know/refuse (vol.) 27 Consumers consider price the main reason why they select a store to fill up. Two out of three drivers say price is the most important factor when shopping for gasoline, while only 22 percent say location is most important. Combined with consumers second most important factor, price was important to 88 percent of consumers surveyed. Q: When buying gas, which of the following factors is most important to you? Overall Price 66 Location of store/station 22 Brand 9 In-store offer 1 Other (vol.) 1 Don't know/ refused (vol.) 1 Q: What would you say is the next most important factor? Overall Location of store/station 56 Price 22 Brand 13 In-store offer 3 Other (vol.) 3 Don't know/refused (vol.) 3 The findings represent a significant shift in consumer behavior over the past seven years. In 1999, a NACS consumer study found that price ranked behind convenient location as a primary reason why consumers select a store to purchase gasoline.
13 American consumers frequently fill up their tanks. Virtually all consumers reported that they purchase gasoline at least weekly, with 93 percent indicating that they had purchased fuel in the past week. More than one in three consumers had purchased gasoline within the previous two days. Q: When was the last time you bought gas for the vehicle you drive the most? Overall Earlier today 16 Yesterday 20 Within the last few days 34 Some time within the last week 23 Some time within the last month 6
14 Who Sells Motor Fuel in the United States? Convenience stores sell the overwhelming majority of the gasoline purchased in the United States, and despite canopies that promote a specific brand of gasoline, very few of these stores less than 3 percent are owned and operated by one of the integrated, major oil companies. It is much more likely that the business is owned by an independent entrepreneur who lives in the community. Of the roughly 112,000 convenience stores selling gasoline in the United States in 2005, about 60 percent were one-store operations, compared to only about 13 percent that were operated by a company having 500 or more stores. Convenience stores sell more than three-quarters of the country s motor fuel Convenience stores in 2005 sold an estimated 78 percent of all gasoline and diesel fuel purchased in the U.S. a sharp increase from as recent as 1997 when convenience stores sold an estimated 59 percent of the country s motor fuel. Overall, 79.2 percent of convenience stores sell motor fuels, and gasoline and diesel fuel sales account for 69.5 percent of the convenience store industry s total sales. (However, low gross margins on fuel 6.9 percent in 2005 mean that motor fuels sales contributed only about one-third of total store gross margins dollars 39.9 percent.) Contrast this to 1971, when only 6.8 percent of convenience stores a total of only 1,401 stores nationwide sold gasoline. What happened? Following the 1973 OPEC oil embargo, more states began allowing self-service fueling (New Jersey and Oregon still prohibit it), so the number of convenience store gasoline outlets grew. By 1976, stores selling gasoline were profitable and the numbers were growing. There was a competitive battle in gasoline retailing as seen by the number of stores offering gasoline the average margin dropped, while the average gallons sold per store went up. As the major oil companies withdrew from certain locations, convenience stores became more and more significant as a source of gasoline sales. Hypermarkets increasingly are selling gasoline Besides convenience stores, a growing percentage of gasoline sales in the U.S. are from hypermarkets or hypermarts the terms collectively refer to the group of mass retailers that includes supermarkets, discount retailers and warehouse clubs. According to Energy Analysts International (EAI) and its Outlook for the U.S. Fuels Business & Hypermart in Retail Business Study, as of July 2006, there were over 4,100 hypermart sites selling 12.8 billion gallons of gasoline, representing approximately 9.2 percent of the total U.S. market. Hypermarkets comprise approximately 2 to 3 percent of the motor fuels retailing outlets and have experienced a slowing fuel site growth rate over the 2004 to 2006 period, with recent levels at 320-plus sites per year, EAI reports. One particular area of growth for fuels sales are supermarkets. In 2003, only 18 percent of new supermarkets had gas pumps. But almost 62 percent of grocery stores that were scheduled to be constructed in 2004 included fueling in their blueprints, according to the Food Marketing Institute.
15 Fuel-only stations on the decline The rest of the gasoline purchased in the United States is sold at traditional service stations, but those that depend on gasoline sales alone are disappearing due to low and declining gasoline margins. An annual survey by the trade publication NPN, which tracks all retail outlets where the public can purchase gasoline (including very-low volume outlets such as marinas) bears that out. In 1995, NPN counted 195,455 fueling outlets. In 2006, that number dropped to 167,476 outlets. Most stores are branded, but few are operated by major oil NPN also looks at the branded retail outlets by company. These were the top branded outlets in 2005: Citgo Petroleum Corp. (13,682 sites) ConocoPhillips (13,600 sites) Shell Oil Products U.S. (13,500 sites) BP America Inc. (13,000 sites) ExxonMobil (12,798 sites) Also of note are Chevron Products Co. (9,354 sites), Sunoco Inc. (4,763 sites) and Getty Petroleum (1,965 sites.) These figures include all gasoline retailers, not just convenience stores; cumulatively they represent roughly half of the country s fueling outlets. One of the biggest areas of confusion today relates to branded gas stations and oil profits. In fact, according to the 2007 NACS Consumer Fuels Report, more than half of the general public believes that major oil operates the majority of fueling outlets in the country. Therefore, most consumers assume that the strong profits announced by the major oil companies, which are derived from crude oil and natural gas exploration and production, chemical and refining operations, are also enjoyed by the station selling a specific brand of gasoline. Nothing could be further from the truth. While most of the 112,007 convenience stores selling gasoline sell a branded gasoline, very few are owned and operated by the major oil companies. According to Convenience Store News, as of August 2006 only 2,718 convenience stores selling gasoline were owned and operated by one of the five major integrated oil companies or 2.4 percent. Here is the breakdown: BP North America: 1,131 stores Exxon Mobil Corp.: 896 stores ChevronTexaco Corp: 373 stores Shell Oil Products US: 168 stores ConocoPhillips Inc.: 150 stores The confusion largely comes from the fact that the majority of neighborhood gas stations typically get marketing support from an oil company in exchange for carrying that brand of gasoline. This includes exterior signage, such as canopies, that lead some to believe that the store is owned by the oil company producing that specific gasoline brand. However, the reality is that there is no link beyond an agreement to sell a specific gasoline. The arrangement is similar to arrangements inside the store, where a store may choose to dispense a specific brand of soft drink and receive branded dispensers and other signage. But the business arrangement ends there.
16 How Do Retailers Get and Sell Gasoline? Retail gasoline prices directly reflect wholesale prices. However, how and when retailers purchase wholesale gasoline can differ significantly, leading to varying prices and/or margins on the gasoline they sell. The wholesale market has complexities that lead to retailers having different cost structures, whether they are branded or unbranded, have long-term contracts or buy on the spot market or, in the case of tight supply periods and rising wholesale prices, even the time of day that wholesale product was purchased can play a role in determining the retail price. Retail Gasoline Supply Retailers obtain gasoline supplies based upon the nature of their relationship with their suppliers, and because there are several different ways that retailers can purchase gasoline, the cost structure and availability of gasoline may vary greatly from one retailer to another, even those operating under the same gasoline brand. There are three primary supply arrangements influencing a retailer s operations: Major oil owned and operated It s estimated that less than 5 percent of the approximately 168,000 retail gasoline facilities in the United States are owned and operated by the major oil companies. (Less than 3 percent of the more than 112,000 U.S. convenience stores selling gasoline are owned and operated by major oil companies.) These retail locations receive product directly from the corporation s refinery assets and their profit or loss is integrated into that of the corporation. Branded independent retailer Approximately 52 percent of retail gasoline facilities are operated by independent business owners who sign a supply contract and sell gasoline under a brand owned or controlled by a refining company. Not every contract is drafted equally, and various market conditions can influence the terms of the contract. Branded retailers pay a slight surcharge per gallon for using the refiner s brand, benefiting from the supplier s marketing and ensuring a more secure supply of product. Their wholesale costs are established by their refiner supplier. When supplies are constrained, these retailers are given a higher level of priority for accessing product, although access to supplies may be restricted. Unbranded independent retailer Approximately 43 percent of retail gasoline facilities are operated by independent business owners who do not sell gasoline under a brand owned or controlled by a refining company. These retailers purchase gasoline off the unbranded wholesale market, which is comprised of gallons not dedicated to fulfill a refiner s contracts. These retailers do not pay a marketing surcharge like their branded competitors do; consequently, unbranded gasoline is typically sold at all levels of trade for a lower price than branded gasoline. However, when supplies are constrained, these retailers have the lowest level of priority to access gasoline, often incur the largest wholesale price increases and may be completely denied access to product. Their wholesale costs are also established by the refiner supplier(s). A company s supply contracts and size determine its options for obtaining gasoline. Branded independent retailers have one option for gasoline the refiner that provides it with supply. Some larger unbranded independent retailers also may have contracts with a specific refiner, or even multiple refiners. Others may simply purchase product off the open market. Most retailers are small businesses that obtain their gasoline at a terminal, also known as the rack. Prices at the terminal are known as spot prices, and these typically experience the most price volatility. For those purchasing fuel at the rack, there are two options for delivery. Some companies may elect to have gasoline delivered to their stores by a jobber who delivers fuel to their store branded or unbranded for a
17 delivery fee. Other retailers have invested in their own fleets of trucks that go to a specific terminal or terminals to obtain gasoline. These companies may also serve as jobbers to other retailers. Some larger unbranded retailers may purchase gasoline futures, attempting to lock in specific prices for delivery on a specific date in the future. This type of purchase, commonly referred to as hedging, helps these retailers manage their costs in anticipation of volatile wholesale prices. Retail gasoline pricing considerations Wholesale gasoline is a commodity that is traded on the open market. As such, its price can change by the minute, which may influence the cost structure for a retailer. In 2005, convenience stores sold, on average, about 3,500 gallons of gasoline per store per day. The average underground storage tank has a capacity of 8,000 or 10,000 gallons, so many retailers average a shipment of gasoline once every day or so. However, high-volume retailers those selling three or even four times that amount may receive multiple shipments each day. The cost of each delivery can vary significantly, especially when wholesale prices are in flux. Competitive Considerations While wholesale costs are a significant factor in retailer prices, the retail pricing decision also is heavily influenced by market conditions and local competition. Ultimately, movements in wholesale gasoline prices influence the cost structure of a retail facility, but competition for customers will dictate the store s profitability. How a retailer reacts to wholesale market conditions is based upon its individual pricing strategy, which varies greatly from retailer to retailer. For example, a retailer may seek to maintain consistent margins, matching its retail price with variations in the wholesale cost based upon a certain formula. This strategy may result in a retailer pricing gasoline contrary to the prevailing competitive market conditions. Consequently, when wholesale prices increase, the retailer may, in fact, become one of the more expensive stores in the market in order to maintain a consistent margin. The result could be reduced customer counts and diminished overall revenues. However, when wholesale prices decrease, the retailer may in turn become one of the least expensive stores in the market, thereby recovering customer counts and overall revenues. Margins for this retailer would remain consistent over time. Conversely, a retailer may seek to remain competitive in the market place, in spite of changing wholesale market conditions. This strategy may enable the retailer to maintain customer counts and overall revenue by setting competitive prices; however, it could lead to reduced or even negative margins. Competitive retail prices may not increase as quickly as wholesale prices, resulting in lost margins for the retailer. This strategy anticipates that during a declining wholesale market, local competitive conditions may enable the retailer to recover lost margins by slowly reflecting wholesale price changes at the pump. This type of retailer is focused on the complete market cycle, trusting that market forces will result in an average positive margin on gasoline sales over time. With either strategy, gross margins are likely similar over the course of a year. In 2005, a gasoline retailer s average gross margin (before expenses) was 16.6 cents per gallon, or 6.9 percent gross margin, according to NACS data. This percent margin was the same as in 2004 and the lowest recorded by the industry since After expenses, typical net profits per gallon are a few cents per gallon, at most. NACS estimates that in 2006 the break-even mark-up for a gallon of gasoline was 13 cents per gallon, and the Oil Price Information Service (OPIS) reports that average gross margins on gasoline in 2006 was cents per gallon. Replacement Costs In a rapidly raising market, a gasoline retailer faces the significant challenge of maintaining sufficient operating capital to cover the cost of the product that will replace the inventory it is selling.
18 A gasoline retailer typically seeks to establish a retail price based on the cost of replacing the gasoline currently at the retail location, not the cost of that product itself. Basing prices on replacement costs is especially critical when wholesale prices fluctuate frequently. A retailer must generate sufficient cash from its current retail sales to purchase its next delivery of gasoline; otherwise, the retailer would be constantly using debt to finance wholesale gasoline purchases. When wholesale gasoline prices hit $2.50 per gallon, a fill-up of even 6,000 gallons of gasoline can cost a retailer $15,000. With pricing influenced by replacement costs, there can be consumer misperceptions when prices rise, as some consumers observe prices changing at a retail location even though the station did not receive a new shipment of gasoline. However, the store may be responding to a notice from its supplier about how much its next shipment will cost. But even these decisions to respond to anticipated changes in wholesale costs are strongly influenced by competitive pressures and, often, a retailer is unable to adjust retail prices to match the change in wholesale costs. When prices retreat, market competition again influences a retailer s pricing decisions. Each retailer makes its own pricing decisions based upon its calculations of the best volume/margin equation to maximize its profits. During these periods, consumer interest in prices wanes and they usually don t notice that prices dropped even though a new shipment has not arrived. Also, even if a store receives multiple shipments in one day, each priced differently, some states, such as New Jersey, limit retailers to one price change per day. Retailer Costs In addition to wholesale prices and competitive pressures, gasoline retailers must consider the following costs and expenses: Federal, state, and local excise and sales taxes, which average approximately 46 cents per gallon in the United States. (The federal gasoline tax is 18.4 cents per gallon and each state has additional gasoline taxes.) Transportation fees (1 to 3 cents per gallon, depending on distance). Credit card transaction fees (approximately 2.5 percent of the price of each transaction on plastic). Retailer overhead (employee wages, rent, electricity, depreciation and other costs of doing business). Retailer net profit (varies from day to day and market to market retailer net profits can range from negative numbers to several cents per gallon). NACS estimates that the average retailer had a net pretax profit of between one and four cents in 2005, and about one cent in There is a difference between gross retail margins (the difference between the tax-paid wholesale cost of gasoline and the retail price of gasoline at the dispenser) and net retail margins (the gross retailer margin minus the costs of doing business outlined above). For 2006, NACS estimates that a retailer s break-even margin was approximately 13 cents per gallon. Wholesale Gasoline Pricing Wholesale gasoline prices generally are tied to one of two data points: A price based on a differential from the current price of a future gasoline delivery contract from a commodities exchange (New York Mercantile Exchange, known as "the Merc" or "Nymex") or from a gasoline price tracking service, such as Platts, Oil Price Information Service, or DTN; or, A price based on the "cash" or "spot" market for gasoline. Nymex- or Platts-based wholesale pricing is used primarily for short-, medium- and long-term contracts for gasoline supplies between refiners, blenders, importers and traders and gasoline wholesalers and retailers. Such a contract might call for a supplier to sell a certain quantity of gasoline at "Nymex plus 2 cents" or "local OPIS low rack minus one cent."
19 Spot market-based wholesale pricing is used primarily by gasoline wholesalers and retailers for immediate delivery of gasoline supplies by these parties. Such pricing might call for immediate delivery of 10,000 barrels of 87 octane unleaded at New York harbor for a set price. Nymex and spot market gasoline prices move independently and are influenced by many factors, including national and regional gasoline inventories, the price of crude oil, weather and market events such as pipeline disruptions and refinery shutdowns. When market conditions become more volatile because of weather or crude oil events, Nymex -based prices may rise somewhat, while spot market prices may soar. A gasoline market in which spot market prices are higher than NYMEX prices for future deliveries is termed a "backwardated market" and generally indicates that the markets believe that current upward pressures on prices will ease in the future. Many gasoline wholesalers and retailers use the Nymex to hedge their gasoline supply needs, thereby reducing their exposure to future gasoline price movements. However, many trades of Nymex futures contracts are undertaken by "paper traders" brokers and speculators that never expect to take physical delivery of a gallon of gasoline from a Nymex futures contract. These paper traders tend to lead Nymex contract prices up or down based on market conditions and breaking news events. Wholesale prices for gasoline generally are reported by most sources as excluding federal, state and local taxes, without the transportation costs from the wholesale market to the retail outlet, and do not include any retailer-related costs, including overhead, credit card fees and any profit margin the retailer may seek. Thus, a spot market price of $2.00 per gallon for 87 octane unleaded gasoline does not include any of the below the "rack" costs and expenses that ultimately determine a retailer's "laid-in" costs of gasoline. These costs vary by market and by other conditions, but generally add approximately 60 cents to the retail cost of gasoline.
20 Retailers Pain at the Pump Convenience store retailers dislike higher gasoline prices as much as their customers do, as margins decrease while costs particularly credit card fees increase. With competition for the gasoline customer intensifying, consumers are extremely price sensitive. In fact, the 2007 NACS Consumer Fuels Report, the results of a nationwide survey conducted in late December 2006 and early January 2007, found that price is by far the number-one reason why consumers purchase gasoline at a particular location, and that more than one in four consumers would go out of their way to save as little as one cent per gallon. Challenging Margins When wholesale prices increase, retail prices generally increase at a slower rate as retailers often engage in a high-stakes game of chicken to remain competitive, absorbing some or all of wholesale price increases until they see others pass along their wholesale price increases. For 2006, the U.S. Energy Information Administration (EIA) reports that average retail prices increased from $2.27 to $2.57. However, the percent attributed to Distribution & Marketing (retailer markup plus other factors, including distribution) remained stagnant at 9.0 percent, the same as in This is far below the 12.9 percent average from 2000 to 2004, when gasoline prices averaged $1.53. (NACS data for 2006 will not be available until April In 2005, NACS data shows that retail gross margins were 6.9 percent, at a 20-year low, as a result of gasoline prices jumping from an average of $1.85 in 2004 to $2.27 per gallon.) The reason for continued margin erosion is that it typically takes seven to 12 weeks for wholesale price adjustments to be completely passed-through to retail consumers, according to EIA s 2003 report, Gasoline Price Pass-through. During this time, retailers typically absorb some of the wholesale price increases by reducing their margins. Allocations When gasoline is in short supply, retailers face more than just tighter margins. They may have difficulty obtaining fuel without additional surcharges. During severe supply/demand imbalances (such as in 2005 after Hurricanes Katrina and Rita, and in Spring 2006 with the rapid switchover from MTBE to ethanol) retailers with supply contracts may be put on allocation, or restricted access to supply. Retailers on allocation can only get a percentage of what they got on the same day last year typically suppliers initially begin with 100 percent allocations, which then decrease as supply conditions worsen. In this case, retailers can suffer both low margins and low volume, based on restricted supply. Retailers can get more than their specified allocations, but they must pay a lifting fee similar to a luxury tax in sports where they have to pay up to 25 cents, 50 cents, sometimes as much as $1.00 a gallon more to get extra product. Allocations only apply to retailers selling branded gasoline, and are intended by refiners to help maintain supply so that they can distribute product to all their contracts when supplies are or could be tight. Unbranded retailers without supply contracts don t face allocations. However, they usually have it worse when supplies tighten. Because they don t have a supply contact, they get last dibs on gasoline, and they pay the going rate, which is usually the highest. This is similar to buying a walk-up airline ticket you can only buy what is left and you pay a premium for it. If there are no seats available, you don t fly; if there is no gasoline available, you don t open for business.
21 The reality is, however, that no matter how much of the wholesale price increase they pass on, retailers still get accused of gouging. Rising Credit Card Fees Gross margins aren t to be confused with profit margins. After factoring in expenses, most retailers make, at best, a few cents per gallon in pretax profit, and may even lose money on some sales when margins are tight and credit card expenses are high. For stores that sell gasoline and accept plastic, credit card fees cost stores an average of $45,785 in 2005, a figure eclipsing the average per-store pretax profit of $42,196. On an industry-wide basis, the total cost of credit/debit fees was $5.4 billion. When gasoline prices increase, more people pay by plastic, either because they don t have the cash on hand (or don t want to spend it) or because they try to displace the pain of the higher prices until their next billing statement. In fact, the 2007 NACS Consumer Fuels Report found that nearly half of all consumers (47 percent) said they are much more likely to pay by plastic when gas prices increase. The overall increase in average annual gas prices from 2004 to 2005 (from $1.85 to $2.27 per gallon) led to a significant increase in the use of plastic at the pump, with 58 percent of all gasoline customers paying with plastic in The huge increase in gasoline prices in 2005 has accelerated that trend, and NACS consumer data shows that 65 percent of consumers today typically pay for their gasoline with plastic. One implication for the convenience store industry is that as credit card usage and gasoline prices increase, so does the payment amount per fill-up (since it is largely computed on a percentage basis). With razor-thin margins for retailers selling gasoline, credit card fees are often more than the retailer s net or even gross margin. Convenience store retailers pay approximately 2.5 percent in credit card fees on each gallon of gasoline sold, no matter what the price of gasoline. The rise in credit card expenses has led to an increasing number of retailers to consider cash discounts, once popular in the 1970s. These retailers are generally offering a discount from one cent to six cents per gallon for customers paying by cash, sharing the savings of reducing credit cards expenses with their customers. There are strict requirements and limitations on its practice that vary by state. Reason Code 96 Payment Card Authorization Limits Authorization limits imposed by some banks can force retailers to cut off gasoline sales at a pre-set amount, such as $50, which is the current Visa authorization limit (although MasterCard raised its limit to $75 in response to energy prices), irritating customers with large-tank vehicles like SUVs that are unavailable to completely fill up. This situation forces retailers to select one of two bad options. One choice is to adhere to this authorization limit, and hope that affected consumers don t take out their frustration on the store by refusing to return. If these frustrated customers do not immediately drive away and instead stay to continue fueling up, they must initiate a second fill-up authorization, which further alienates customers and adds more costs for retailers because of the fixed-cost pricing component of interchange related to the relatively small second sale. The other option is to allow customers to exceed this authorization limit. Retailers who choose this option risk having the charge denied by the bank, even if the card is not fraudulent, and lose getting credited for the entire amount of the sale. Still, many retailers have taken on this risk to reduce customer inconvenience. (Customers are still assessed the full amount if the retailer is denied payment in this situation, but the bank, not the retailer, keeps the money, which, with low gasoline margins, can wipe out the day s gasoline profits.) Reduced Sales of Higher Octane Fuel
22 Sales of premium and mid-grade gasoline, which have healthier margins than regular gasoline, have declined over the past few years as consumers trade down octane levels when prices increase. This leads to some consumers permanently switching to lower-octane fuel. The sale of mid-grade and premium has declined from 30.2 percent of gasoline gallons purchased in 1998 to 18.3 percent in Reduced In-Store sales As can be expected, when gas prices take a bigger bite out of consumers wallets, customers are less likely to go inside the store and purchase other items. Because gas margins are so thin, retailers make most of their profits on in-store items. In 2005, motor fuels sales accounted for 69.5 percent of the convenience store industry s sales, but only 39.9 percent of profits. The 2007 NACS Consumer Fuels Report found that nearly one in three consumers said they spend less on/buy fewer in-store items at convenience stores when gas prices increase.
23 Retailer Margins Shrink as Prices Climb Gasoline prices for the year 2006 averaged $2.574 per gallon, approximately 30 cents per gallon over the average in The U.S. Energy Information Administration (EIA) breaks down the cost of gasoline into four components: cost of crude oil, taxes, refining and distribution and marketing. (About a dozen states have sales taxes on gasoline, meaning the taxes increase as the price does.) Breakdown of the Retail Price of Gasoline Retail Price Crude Oil Taxes Refining Distribution & Marketing cents/gallon % cents/gallon % cents/gallon % cents/gallon % cents/gallon Source: U.S. Energy Information Administration (Note: EIA began tracking this information in January 2000) However, this is not retailer profit; EIA s Distribution & Marketing component includes other costs, notably pipeline, terminal and other transportation expenses. Here are some estimated costs (which vary by retailer): 4 cents cost of pipelines/terminals/other costs before distribution to stores 3 cents distribution to stores 1 cent inventory fluctuation (drive-offs, underfilling, evaporation) 6 cents store operating expenses (labor/utilities/insurance/maintenance/etc.) 4 cents credit card fees 1 2 cents amortization of equipment 2 With these expenses totaling approximately 20 cents per gallon, that leaves the retailer with approximately one to four cents in pretax profit per gallon. For a point of reference, NACS 2005 numbers showed an average retail gross margin of 16.6 cents/gallon, which are comparable to EIA s numbers after taking out the 7 cents for the costs of pipeline/terminal costs, as well as distribution to stores. (Margins were even tighter for diesel fuel in For the year, EIA s Distribution & Marketing component was 7.0 percent. On a cents-per-gallon basis, this component was 19.0 cents per gallon based on the average price of diesel at $2.71 per gallon. And according to the OPIS Retail Fuel Watch, gross margins averaged cents per gallon during Margins averaged 10.9 cents in the first quarter, 12.3 cents in the second quarter, 19.8 cents in the third quarter, and 12.0 cents in the fourth quarter. The typical break-even margin for retailers factoring in all expenses, including credit card fees is about 13 cents per gallon, NACS estimates.) 1 Two-thirds of all transactions at the pump are paid by credit card. With fees averaging 2.6 percent of transaction cost, at least 4 cents per gallon represents the average for all gasoline sales. 2 Based on 7-year amortization of $300,000 of equipment, with the typical store selling 1.3 million gallons of fuel/year.
24 From 2003 to 2006, according to EIA data, annual average gasoline prices jumped cents, while Distribution & Marketing rose only 1.1 cents. Since most of the transportation costs have either increased or remained the same, it s obvious that retailer margins as a percent of sales have tightened. The reason for continued margin erosion is that it typically takes seven to 12 weeks for wholesale price adjustments to be completely passed-through to retail consumers, according to EIA s 2003 report, Gasoline Price Pass-through. During this time, retailers typically absorb some of the wholesale price increases by reducing their margins.
25 Diesel Fuel Market Also Sees Price Volatility What happens with diesel fuel impacts more than those who drive diesel-powered vehicles. The United States economy runs on the backs of diesel-powered trucks. Higher fuel prices add to the cost of shipping food, clothes and other goods, and that expense eventually shows up in the retail prices everyone pays. Therefore, although not all consumers pay attention to diesel fuel prices, the movement of this market has significant implications for the economy. Ultra Low Sulfur Diesel The big event for diesel fuel in 2006 was the implementation of the U.S. Environmental Protection Agency s (EPA) Ultra Low Sulfur Diesel (ULSD) program. In June 2006, 80 percent of all on-road diesel fuel produced by refineries was required to comply with a sulfur limit of 15 parts per million (ppm); this level represented a 97 percent reduction in the sulfur content. Although retailers are not yet required to sell ULSD (a gradual phase-in continues until 2010), the overwhelming majority of diesel fuel produced by refineries as ULSD led many to convert their tanks to the new fuel. By October 15, 2006, any retail dispenser selling fuel as USLD could contain no more than 15 ppm. Meanwhile, both ULSD and Low Sulfur Diesel (LSD) were produced and available in the market. Despite widespread concerns regarding the potential challenges of this transition, which was one of the most significant transitions ever for diesel fuel, it has been relatively smooth, in large part because of industry-wide cooperation over the past five years with EPA. (Evidence of this cooperation can be seen with the Clean Diesel Fuel Alliance But the conversion to a new fuel does put statistics into a new perspective. From a paltry 24,000 barrels per day in 2005, production of ULSD in 2006 nearly matched that for LSD, recording million barrels per day compared to million barrels per day. Imports added another 95,000 barrels per day ULSD and 86,000 barrels per day of LSD. Net production totaled nearly 3.1 million barrels per day, an increase of 8.5 percent over the previous three year average and 4.3 percent over Convenience Stores and Diesel Fuel Convenience stores sell a considerable amount of diesel fuel. In 2005, nearly 40 percent of all convenience stores sold diesel fuel and the product accounted for 7.1 percent of the industry s total motor fuels sales. In 2005, when retail prices averaged $2.41, retailers diesel fuel gross margins averaged 15.5 cents per gallon, or 6.4 percent of the retail price. Diesel fuel prices, like gasoline prices, are heavily influenced by the price of crude oil, which alone constitutes roughly half of the total retail price at the pump. In 2006, crude oil prices increased 16.6 percent above 2005 to average $66.04 per barrel, thereby leading to a bump in retail diesel prices. Like with gasoline prices, retail diesel fuel prices topped $3.00 per gallon in August. The Energy Information Administration (EIA), which does not distinguish between ULSD and LSD retail pricing, reports the average retail price of diesel fuel in 2006 was $2.71 per gallon, up 30 cents from 2005 and 79 cents over the previous three year average. It is worth noting that diesel fuel taxes are higher than those for gasoline. The federal tax per gallon for diesel fuel is 24.4 cents per gallon, six cents higher than the federal gasoline tax.
26 Refining Capacity and Boutique Fuels Demand and Production Capacity Despite higher prices, in 2006 gasoline demand increased 1.43 percent over demand in 2005, according to the U.S. Energy Information Administration (EIA). Demand in 2006 was 5.35 percent greater than the five-year average from 2001 to 2005, and nearly 10 percent over EIA predicts that demand will increase another 1.2 percent in In 2006, Americans consumed 9.24 million barrels per day of gasoline, and a total of million barrels per day of petroleum products in general. In short, demand for gasoline remains strong in the United States. The steady increase in demand outpaces slightly the domestic refining industry s increase in production capacity. In 2006, the industry posted a strong increase in production (4.9 percent over 2005) largely because of its recovery from long-term outages caused by Hurricanes Katrina and Rita. Since 2000, refining production is up 7.8 percent, but this increase is less than the 10 percent increase in demand over the same time period. Consequently, imports are up 116 percent. This is a clear indication that domestic refining capacity is not keeping up with demand, increasing U.S. reliance on imported finished product and reducing the ability of the refining industry to efficiently respond to disruptions. The last domestic refinery was built in 1976, and since 1981 the number of domestic refineries has dropped by more than 50 percent. While the number of refineries has been cut in half, the refining industry has upgraded its existing facilities to increase per-unit capacity by 97.3 percent, thereby minimizing the overall loss in production capacity to approximately 9 percent. But this expanded capacity has come at a price. The typical U.S. manufacturing industry operates at a capacity utilization rate of approximately 82 percent. In 2004, the average U.S. refinery utilization rate was 93.0 percent of capacity, the highest rate in six years. In 2005, due to disruptions associated with the hurricanes, capacity utilization dropped to 90.6 percent. Although refineries have proven capable of maintaining such high levels of operability, this leaves little excess capacity to accommodate any type of supply disruption. When a refinery experiences an unexpected disruption, other refineries are unable to increase production, thus leaving the market in a shortage situation. Demand is so strong that the refining system had no choice but to continue to push itself to the limit. In 2006, U.S. gasoline production was 8.87 million barrels per day (2.4 percent over the previous five years average) and on-road diesel production was 3.05 million barrels (8.5 percent over the previous five years average). Only two developments can ease the pressure on the refining system: reduced consumer demand for refined petroleum products or increased domestic refining capacity. The first component is a long-term problem that will not be resolved in the near future. It will require a national change in consumer behavior, characterized by a much more deliberate approach to enhancing fuel economy or reducing vehicle miles traveled. The second option is likewise a long-term problem. Historically, the refining industry has earned a five percent return on investment, far below the 10 percent required by many market analysts and investors in New York. The cost of expanding or building a new facility is often reported in the billions of dollars, not to mention the difficulty in obtaining permits for such work. For example, estimates place the per-barrels cost
27 of building a new refinery at $17,000, while the per-barrel cost of expanding capacity at an existing facility typically ranges between $9,000 to $12,000. Boutique Fuels Compounding the challenges of insufficient spare capacity in the domestic refining industry to respond to supply disruption is the condition of the U.S. gasoline distribution infrastructure, which remains a significant challenge for the industry in 2007 and beyond. Throughout the United States, individual localities and states have adopted specific fuel formulation regulations to control for specific air quality concerns. While many of these regulations have been environmentally successful, they have sacrificed the efficiency of the distribution system. Today, the U.S. pipeline system, designed to originally handle six fuel types, transports and delivers more than 90 distinct products, including gasoline, on-road and off-road diesel fuel, home heating oil, kerosene, and jet fuel. (Ethanol cannot be transported via pipeline and instead must be trucked.) With gasoline alone, there are approximately 20 distinct fuel formulation requirements, not including the multiple octane grades marketed. Each product must be kept segregated and distinct from the others and delivered to its specific market. If there is any disruption to the delivery schedule, the integrity of the entire distribution system can be compromised. (In rulemaking and a December 2006 report, the U.S. Environmental Protection Agency (EPA), determined that there were in actuality only seven distinct boutique fuels as defined by the Energy Policy Act of This definition, however, did not include the special fuels used in California, the federal Reformulated Gasoline Program, nor any state biofuel program.) The proliferation of these unique, boutique fuels has affected the efficiency of the pipeline system, reduced the storage capacity for specific products at terminals and contributed to the loss of spare capacity at refineries. Rather than producing, delivering and storing interchangeable product for each market, the system now must operate according to small market regulations, thereby rendering each market more susceptible to disruption and resultant shortages and price spikes than would otherwise be the case. In some instances, retailers operating in a market experiencing a supply disruption must travel more than 500 miles one way to obtain compliant product for sale to their consumers because product is simply not available anywhere closer. This is neither time nor resource efficient. The greater consumer demand and the more tightly balanced the supply situation, the more likely there could be a disruption in the distribution system. The Energy Policy Act of 2005, which contained legislation prohibiting the adoption of new boutique fuels, empowered EPA to intervene to offset supply
28 shortages, like those caused by the hurricanes in By authorizing the temporary sale of noncompliant gasoline, and diesel fuel, in markets where shortages were experienced or anticipated, EPA was able to mitigate the market implications of the disaster. The boutique fuels provisions of the legislation not only specifically authorize EPA to grant these temporary waivers, they also protect market participants from legal retribution when abiding by such administrative orders. Such certainty provided necessary flexibility to the market place and hastened the return to stable conditions. The actions taken by Congress and EPA in recent years will begin the process of restoring fungibility to the motor fuels supply and distribution system. However, this is a long-term process that will take time for implementation and even longer to reflect in actual market conditions. Consequently, the risk of distribution-related supply disruptions remains unabated.

29 The U.S. Petroleum Industry: Statistics, Definitions Demand: Oil World demand for oil was approximately 84.4 million barrels per day in 2006, an increase of 1.1 percent over that of Demand is expected to increase 1.7 percent in (Source: International Energy Agency) The United States uses more petroleum for transportation needs (67 percent of total demand) than for heat and power. As a result, demand peaks in the summer as people travel more, the opposite of most of the rest of the world where demand for oil peaks in the coldest months. (Source: U.S. Energy Information Administration) U.S. petroleum demand in 2007 is projected to average million barrels per day, up from million barrels per day in (Source: U.S. Energy Information Administration) West Texas Intermediate spot oil prices averaged $66.02 per barrel in 2006, and are projected to dip to $64.42 per barrel in (Source: U.S. Energy Administration, Short-Term Energy Outlook, released January 2007) Motor fuels It is projected that Americans will drive an average of billion miles every day in 2007, an increase from the billion miles in (Source: U.S. Energy Information Administration) U.S. gasoline consumption in 2006 averaged 9.24 million barrels per day (approximately 388 million gallons per day, or about 35 million fill-ups per day), and is expected to increase to 9.35 million barrels a day in (Source: U.S. Energy Information Administration) U.S. demand for gasoline significantly increases beginning every February, and peaks in August. (Source: U.S. Energy Information Administration) U.S. gasoline demand is approximately 43 percent of the United States petroleum needs. Here are the components that are typically made from a barrel of oil: Gasoline: 42 percent Diesel and heating oil: 24 percent Jet fuel: 10 percent Heavy fuel oil: 4 percent Liquefied petroleum gas: 4 percent Other products: 22 percent (Source: Government Accountability Office analysis of U.S. Energy Information Administration) Supply: U.S. oil production in 2006 was an estimated 5.14 million barrels per day and is expected to increase to 5.31 million barrels per day in (Source: U.S. Energy Information Administration)
30 U.S. Imports The U.S. imported million barrels per day of crude oil and finished petroleum products in Imports account for approximately two-thirds of U.S. petroleum supply. (Source: U.S. Energy Information Administration) The top five importers of petroleum (crude oil and finished products) to the United States: Canada (2.103 million barrels per day) Mexico (1.493 million barrels per day) Saudi Arabia (1.454 million barrels per day) Venezuela (1.399 million barrels per day) Nigeria (1.134 million barrels per day) (Source: U.S. Department of Energy, Jan.-Oct averaged data) The United States imports the majority of its oil from non-opec countries: 45 percent of total imports came from OPEC; only 18 percent of total imports came from Persian Gulf countries. (Source: American Petroleum Institute, Jan.-Oct averaged data) The top five importers accounted for more than one-third of all U.S. petroleum consumed: Canada (10.2 percent) Mexico (7.3 percent) Saudi Arabia (7.1 percent) Venezuela (6.8 percent) Nigeria (5.5 percent) (Source: American Petroleum Institute, Jan.-Oct averaged data) Stocks and Inventories There are 7-8 billion barrels of oil tied up in worldwide stocks at any given time, from the wellhead to the consumer, filling tankers, pipelines, railcars, trucks and linking all of the markets. (Source: U.S. Energy Information Administration) Holding inventory costs money approximately $1.50 a barrel for oil if a company owns the tank storage facility and $4 per barrel is the storage is rented. For gasoline, the costs are approximately $2 and $6, or about 1 cent per gallon per month if the storage space is rented. Thus, companies try to manage their inventories as efficiently as possible. (Source: U.S. Energy Information Administration) As of early January 2007, U.S. crude inventories were about 320 million barrels, roughly the average of 325 million barrels of inventory from 1982 to (Source: U.S. Energy Information Administration) Strategic Petroleum Reserve The U.S. Strategic Petroleum Reserve (SPR) is the largest stockpile of government-owned emergency crude oil in the world. It was established in 1975 in the aftermath of the oil embargo to provide emergency crude oil supplies for the U.S. The oil is stored in underground salt caverns in Texas and Louisiana. In November 2001, President Bush directed the U.S. Department of Energy to fill the SPR to its capacity (capacity is approximately727 million barrels). In January 2007, before his State of the Union address in which he requested that the holdings of the SPR be doubled, it held approximately million barrels, a decrease from the high of million barrels reached in late August 2005, prior to Hurricanes Katrina and Rita.
31 The maximum drawdown capability of the SPR is 4.4 million barrels per day. It would take 13 days from the time a Presidential decision were made to tap the reserves for oil to enter the U.S. market. (Source: U.S. Department of Energy) Refining: The largest refinery in the United States is the ExxonMobil Baytown, Texas facility, which produces 557,000 barrels per day. (Source: U.S. Energy Information Administration, 2004 data) Planned periodic shutdowns of refineries, called turnarounds, allow for the regular maintenance, overhaul, repair, inspection, and testing of plants and their process materials and equipment. They are scheduled at least 1-2 years in advance, and usually when demand for refined product is at its lowest level, typically early in the year. At this time, refineries also convert their crackers so that they can refine summer-blend fuel. (Source: American Petroleum Institute) The length of a refinery turnaround is typically 1-4 weeks, depending on the unit and the amount of maintenance that needs to be done. The industry average is about four years between turnarounds for catalytic cracking units. (Source: American Petroleum Institute) The total number of U.S. refineries has been significantly reduced since Approximately half of the U.S. refineries have closed since then; as of January 2006, there were149 refineries in United States (plus two in Puerto Rico and one in the U.S. Virgin Islands). The last major refinery built in the United States was in (Source: U.S. Energy Information Administration) Distribution: Tankers Shipping oil from Venezuela to the U.S. takes approximately 6-8 days (roundtrip); shipping oil from the Middle East to the United States takes between 40 and 45 days (roundtrip). During this journey, the price and ownership of the oil can change a number of times. (Source: American Petroleum Institute) Crude oil from the Middle East is moved mainly by Very Large Crude Carriers (VLCCs) capable of delivering 2 million barrels per trip. (Source: U.S. Energy Information Administration) Pipelines Pipelines are, by far, the most important petroleum supply line in the United States for transporting crude oil, refined fuel and raw materials. Pipelines move nearly two-thirds (66 percent) of the ton-miles of oil transported annually. The rest is transported via water carriers (28 percent), trucks (4 percent) or rail (2 percent). (Source: Association of Oil Pipe Lines) Product pipelines, which range in size from eight inches to over 30 inches, transport more than 50 refined petroleum products such as: various grades of motor gasoline, home heating oil, diesel fuel, aviation fuel, jet fuels, and kerosene. (Source: Association of Oil Pipe Lines) Interstate pipelines deliver more than 540 billion gallons of petroleum each year, of which 59 percent is crude oil; the remaining is refined product. The cost to transport a barrel of refined gasoline from Houston to the New York harbor is about $1, which equates to about 2.5 cents per gallon.
32 (Source: Association of Oil Pipe Lines) The Colonial Pipeline is the major product pipeline that stretches from Texas to New Jersey, transporting almost 40 different formulations of gasoline alone different grades of each mandated type of gasoline, the requirements for which vary seasonally and regionally. Liquefied ethylene, propane, butane, and some petrochemical feedstocks are also transported through oil pipelines. (Source: Association of Oil Pipe Lines) Product moves through pipelines at three to eight miles per hour (roughly walking pace) depending upon line size, pressure, and other factors such as the density and viscosity of the liquid being transported. At these rates, it takes from 14 to 22 days to move liquids from Houston to New York City. (Source: Association of Oil Pipe Lines) There are approximately 200,000 miles of oil pipe lines in the United States; they are in all 50 states. (Source: Association of Oil Pipe Lines) Wholesale: Petroleum products may be sold at any of the following levels: Spot market refers to the one-time sale of a quantity of product on the spot, in practice typically involving quantities in thousands of barrels at a convenient transfer point, such as a refinery, port, or pipeline junction. Spot prices are commonly collected and published by a number of price reporting services. Terminal, or rack sales of product by the truckload (typically about 8,000 gallons) at the loading rack of a product terminal, supplied from a refinery, pipeline, or port. Dealer tankwagon, or DTW sales of a truckload or less of product, delivered into storage at a retail outlet. Retail sales to the consumer, normally occurring at a service station, convenience store, or other retail outlet. (Larger consumers, such as commercial or government vehicle fleets, may buy directly from wholesalers in larger quantities.) (Source: Gasoline Price Pass-through, published January 2003 by the U.S. Energy Information Administration) Taxes: The federal excise tax on gasoline is 18.4 cents per gallon and 24.4 cents per gallon for diesel fuel. Motor gasoline taxes averaged 46.8 cents per gallon through July 2006, including 18.4 cents per gallon in federal taxes, and 28.4 cents per gallon in average state taxes. (Source: American Petroleum Institute) Retail: Prices In general, with 42 gallons in each barrel of oil, a $1 change in the price of a barrel of oil roughly translates to a 2.4-cent change at the pump. According to the OPIS Retail Fuel Watch, gross margins averaged cents per gallon during Margins averaged 10.9 cents in the first quarter, 12.3 cents in the second quarter, 19.8 cents in the third quarter, and 12.0 cents in the fourth quarter. The typical break-even margin for retailers factoring in all expenses, including credit card fees is about 13 cents per gallon, NACS estimates.
33 Estimates showed that the price pass-through from the spot to the retail market is complete within two-and-one-half months, with about 50 percent of the change occurring within two weeks and 80 percent within four weeks. The average speed of pass-through is significantly more rapid for diesel fuel, possibly reflecting fewer middlemen, on average, transacting for each gallon of diesel fuel as opposed to gasoline. (Source: Gasoline Price Pass-through, published January 2003 by the U.S. Energy Information Administration) Over the past six years, crude oil prices have fluctuated between a low of $18.28 in November 2001 to a high of $78.40 per barrel on July 14, Gasoline prices fluctuated between a low of $1.06 in December 2001 to a high of $3.06 in September (Source: U.S. Energy Information Administration data) Over the past seven years, the seasonal transition to summer-blend fuel has helped gasoline prices increase 20 to 60 cents each spring. Year Price 1st week in Feb Peak seasonal price Increase (Feb. 6) (May 15) (Feb. 7) (April 11) (Feb. 2) (May 24) (Feb. 3) (Mar. 17) (Feb. 4) (Apr. 8) (Feb. 5) (May 14) (Feb. 7) (June 19) (Source: U.S. Energy Information Administration) Branding While the majority of the roughly 112,000 convenience stores selling gasoline are branded outlets selling a specific major oil company s brand of fuel, NACS estimates that less than 3 percent, are owned and operated by own of the five major oil companies. Top five branded retail outlets by company in 2005: Citgo Petroleum Corp. (13,682 sites) ConocoPhillips (13,600 sites) Shell Oil Products U.S. (13,500 sites) BP America Inc. (13,000 sites) ExxonMobil (12,798 sites) (Note: These figures include all gasoline retailers, not just convenience stores) (Source: National Petroleum News Market Facts 2006) Hypermarts According to Energy Analysts International (EAI) and its Outlook for the U.S. Fuels Business & Hypermart in Retail Business Study, as of July 2006, there were over 4,100 hypermart sites (big-box retailers) selling 12.8 billion gallons of gasoline, representing approximately 9.2 percent of the total U.S. market. Hypermarkets comprise approximately 2 to 3 percent of the motor fuels retailing outlets and have experienced a slowing fuel site growth rate over the 2004 to 2006 period, with recent levels at 320 plus sites per year. Margins Retailer gross margins for motor fuels continue to erode, and in 2004 hit at their lowest level, on a percentage basis, since 1984 when they were 6.0 percent: 2005 gross margin: 6.9 percent 2004 gross margin: 6.9 percent 2003 gross margin: 8.8 percent 2002 gross margin: 9.1 percent 2001 gross margin: 9.2 percent 2000 gross margin: 9.3 percent
34 1999 gross margin 11.7 percent (Source: NACS data) Retail consultant Francis Bologna estimates that for each 35-cent increase in price (the average price increase each spring since 2000), retailers lose a penny in margin. Sales Motor fuels sales in convenience stores totaled $344.2 billion in 2005, with a total of billion gallons sold. (Source: NACS data) Motor fuels sales accounted for more than two-thirds of the convenience store industry s sales in 2005 (69.5 percent). However, because of low margins, motor fuels sales contributed only about one-third of total store gross margins dollars (39.9 percent). (When factoring in only stores that sold gasoline, the revenue percentage climbs to near 75 percent.) Source: NACS data As of December 31, 2005, there were 112,007 convenience stores selling motor fuels in the United States. This represents 79.6 percent of the 140,655 convenience stores in the country. (Source: NACS/TDLinx) The number of convenience stores selling motor fuels has increased significantly in 30 years: 2005: 112,007 stores (78 percent of all stores) 1995: 73,803 stores (73 percent of all stores) 1985: 49,995 stores (55 percent of all stores) 1975: 7,334 stores (21 percent of all stores) (Source: NACS data) Motor fuels sales per convenience store have increased in 30 years: 2005: 108,733 gallons/month 1995: 81,000 gallons/month 1985: 41,000 gallons/month 1975: 20,900 gallons/month (Source: NACS data) Motor fuels sales at convenience stores are an increasing part of total industry revenues: 2005: $344.2 billion in motor fuels sales (69.5% of total sales) 1995: $79.0 billion in motor fuels sales (51.5% of total sales) 1985: $25.1 billion in motor fuels sales (34.4% of total sales) 1975: $0.5 billion in motor fuels sales (6.1% of total sales) (Source: NACS data) Sales of premium and mid-grade have declined over the past few years as consumers trade down octane levels when prices increase. This leads to some consumers not returning to higher octanes as prices decline. The sale of mid-grade and premium has declined from 30.2 percent of gasoline gallons purchased in 1998 to 18.3 percent in (Source: NACS data) In 2005, an estimated $300 million was lost to gasoline theft. With overall gasoline sales of $334.2 billion, this means one in every 1,100 fill-ups was stolen, or roughly one or two per week per store. (Source: NACS data) In 2003, 18 percent of new supermarkets had gas pumps. And almost 62 percent of grocery stores that were scheduled to be constructed in 2004 including fueling in their blueprints. (Source: Food Marketing Institute)
35 Credit Card Fees Credit cards fees cost convenience stores that sell gas $45,785 per store in For the convenience store industry, the total cost of credit/debit fees was $5.4 billion in 2005, a huge increase over the $3.8 billion in fees in 2004, making this the third-largest expense at the store level. (Source: NACS data) In 2005, credit/debit card usage at the pump at convenience stores was 58 percent. However, the huge price increases in 2006 accelerated the trend to pay by plastic, and NACS estimates that 65 percent of all gasoline purchases are now paid with plastic. (Source: NACS data) Glossary of Terms: Balkanization: The end-result of the patchwork quilt of unique fuels required throughout the United States Unique fuel regulations have created gasoline zones across the U.S. where only certain fuels can be sold. This Balkanization of the fuel supply has made it more expensive and difficult to produce and deliver gasoline. Boutique fuels: Unique gasoline blends required for a specific region or metropolitan area of the U.S. Prior to 1990, six types of gasoline were sold in the U.S. Today, there are approximately 20 unique gasoline formulations manufactured for, and sold within, specific markets throughout the United States that are mandated by federal, state, and local governments. These "boutique" fuels are not interchangeable with fuel blends sold in other areas of the country. Branded retail outlet: A retailer that sells a motor fuel with the name of a major oil company, but is not necessarily owned (and is usually not owned) by that oil company. Branded retailers benefit from marketing and advertising support, consumer brand loyalty, and priority access to gasoline supplies. In return, the branded marketer pays a surcharge for the use of the brand and the benefits that come with it. Capacity: A measure of how close a manufacturer is operating at peak efficiency, based on 24- hour operations. Domestic refineries currently operate at between 93 and 95 percent of capacity (which in reality is full capacity given refinery downtime for maintenance). By contrast, the average American industry operates at approximately 82 percent of capacity. Federal Reformulated Gasoline: Also known as RFG. The 1990 Clean Air Act required the nation s most polluted metropolitan areas to sell a special blend of gasoline during summer months in order to reduce the emissions of ozone forming volatile organic compounds (VOCs) and toxic air pollutants. The regulations require specific fuel content levels for oxygen, benzene and aromatics and set performance standards for nitrogen oxides, VOCs and toxics. Requirements vary by region but generally terminals are required to sell RFG beginning May 1; retailers must sell RFG beginning June 1. Fungible: Interchangeable. The U.S. gasoline system was designed to facilitate the efficient flow of gasoline to all regions of the nation, allowing the same gasoline formulation to be sold in all markets. The system is no longer fungible, with approximately 20 unique gasoline formulations required in specific markets throughout the United States. OPEC: The Organization of Petroleum Exporting Countries. OPEC is an international organization of 11 developing countries from Africa, Asia, the Middle East, and Latin America that are heavily reliant on oil revenues as their main source of income. OPEC s members Algeria, Indonesia, Iran, Iraq, Kuwait, Libya, Nigeria, Qatar, Saudi Arabia, the United Arab Emirates and Venezuela collectively supply about 40 per cent of the world s oil output, and possess more than three-quarters of the world s total proven crude oil reserves. Twice a year, or more frequently if required, the oil and energy ministers of OPEC member countries meet to
36 decide on its output level, and consider whether any action to adjust output is necessary in the light of recent and anticipated oil market developments. PADD: Petroleum Administration for Defense Districts. The U.S. Department of Energy divides the United States into five regions for planning purposes. The result is a geographic aggregation of the 50 states and the District of Columbia into five Districts, each operating essentially as its own market. The five districts are: PADD I (East Coast, PADD II (Midwest), PADD III (Gulf Coast), PADD IV (Rocky Mountain) and PADD V (West Coast). (Graphic courtesy of Association of Oil Pipe Lines) Pass-through: The time from which wholesale price changes fully reach consumers. Wholesale gasoline price increases or decreases paid by retailers are not immediately passed on to consumer, but spread over a period of time. A large portion of the price change is passed through immediately, with the rest spread over a period of time that could be as long as eight weeks. Pass-throughs help minimize the price volatility of gasoline. Refinery: Where crude oil is refined into a specific blend of gasoline or other fuels (such diesel, kerosene, etc.) or for other oil-based applications. There are currently only 150 refineries in the U.S. less than half the number 20 years ago. In addition, production capacity has decreased from 18.6 to 16.5 million barrels per day since No new refinery has been built in the United States since Replacement costs: The cost to acquire the next shipment of fuel. This price is almost always different than the cost of the gas that retailers have in their tanks. Because of the enormous volume of fuel sold a typical store sells more than 100,000 gallons of gas a month retailers must price their fuel based on their estimated cost of the next delivery. Even slight wholesale price variations can increase a retailer s replacement cost by hundreds or even thousands of dollars. The importance of replacement costs is particularly acute for smaller businesses, which have less cash on hand to meet payments. Retailer: Refers to convenience stores that sell motor fuels. As of Dec. 31, 2005, a total of 112,007 convenience stores were selling motor fuels in the U.S. (79 percent of country s 140,655 convenience stores). These retailers are also referred to as petroleum marketers. Spot market: This market is usually comprised of motor fuel that has not been pre-allocated to the integrated or branded outlets. Retailers and other fuel distributors purchase fuel at terminals, or racks, where costs fluctuate based on current prices. Summer-fuel blends: Several state and local governments have developed fuel regulations to control for the formation of smog during summer months. These generally require that gasoline sold during the summer have a lower Reid vapor pressure (RVP), which measures the gasoline s potential to emit vapors, which contribute to the formation of smog. Tight supplies: Describes a situation in which demand for gasoline or crude oil exceeds the supply available, and prices rise based on this supply/demand imbalance. Also known as market shorts or upsets. Ultra Low Sulfur Diesel (ULSD): ULSD is a clean-burning diesel fuel that is defined by the United States Environmental Protection Agency (EPA) to have a maximum sulfur content of 15 parts per million (ppm). ULSD will eventually replace the current on-highway diesel fuel, known as Low Sulfur Diesel (LSD), which can have as much as 500 ppm sulfur content. ULSD is required for use in vehicles that will be equipped with advanced emission control systems starting with the 2007 model year, and is being phased into use between 2006 and 2010.
37 100-plus Years of Gasoline Retailing It took two decades from Gottlieb Daimler's 1885 invention of what is generally recognized as the prototype of the modern gas engine for the first gas station to open. In the ensuing 100-plus years there have been a number of developments that have helped shape the petroleum marketing industry to what it is today. 1905: In St. Louis, Automobile Gasoline Co., a subsidiary of Shell of California, opens what is believed to be the first gas station in St. Louis in Some other accounts suggest that the first gas station was opened by SOCAL in Seattle in At these early stations, shopkeepers would fill a five-gallon can from behind the store and bring it to the customer's car to fill it. 1908: While there are already approximately 300,000 automobiles on the road, the introduction of the first affordable Model T leads to a rapid growth in automobile sales within several years. 1911: The U.S. Supreme Court declares John D. Rockefeller's Standard Oil Trust to be an "unreasonable" monopoly. The trust, which controlled much of the production, transport, refining and marketing of petroleum products in the United States, is broken up into a number of distinct companies, including: Standard Oil of Ohio (Sohio), now part of BP Standard Oil of Indiana (Stanolind), renamed Amoco, now part of BP Standard Oil of New York (Socony), merged with Vacuum, renamed Mobil, now part of ExxonMobil Standard Oil of New Jersey (Esso), renamed Exxon, now part of ExxonMobil Standard Oil of California (Socal), renamed Chevron, now part of ChevronTexaco Atlantic and Richfield, merged to form Atlantic Richfield (Arco), now part of BP (Atlantic operations were spun off and bought by Sunoco) Standard Oil of Kentucky (Kyso) was acquired by Standard Oil of California, now part of ChevronTexaco Continental Oil Company (Conoco) is now part of ConocoPhillips 1913: Gulf Refining Co. opens what is believed to be the nation's first drive-up service station on December 1 in Pittsburgh. On its first day it sells 30 gallons of gasoline at 27 cents per gallon. This is also the first architect-designed station and the first to distribute free road maps. 1916: The first canopy is introduced, as Standard Oil of Ohio unveils a prefabricated canopy prototype. 1927: The Southland Ice Company introduces the first convenience store in May in Dallas. "Uncle Johnny" Jefferson Green, who ran the Southland Ice Dock in Oak Cliff, realized that customers sometimes needed to buy things such as bread, milk and eggs after the local grocery stores were closed. Unlike the local grocery stores, his store was already open 16 hours a day, seven days a week, so he decided to stock a few of those staples in addition to items he was already offering. Late 1920s: By the end of the decade, 24-hour service stations already are in operation, serving the needs of, among others, the commercial trucking industry. The first 24-hour convenience store didn't open until : Congress enacts the first excise tax on gasoline on June 21, a one-cent-per-gallon tax, with the proceeds going into the general fund. Since 1997, the federal tax on gasoline has been 18.4 cents per
38 gallon, with the bulk of revenues going to the highway account. Virtually every state already had its own additional gasoline tax at this time; the first state gasoline taxes go back to the 1910s. 1947: Frank Ulrich opens the first modern self-serve gas station, at the corner of Jilson and Atlantic in Los Angeles. (The 20-store Hoosier Petroleum Co. tried self-serve in 1930 but the state fire marshal stopped it, calling it a fire hazard.) With the slogan "Save 5 cents, serve yourself, why pay more?" Ulrich's station sells more than 500,000 gallons its first month. A number of other independent stations begin to offer self serve, primarily in California, the Southwest and the Southeast, but the total number of stations offering self serve remain less than 3,000 until the early 1970s. By 1973, self-serve was permitted in 42 states. In addition, the 1973 energy crisis helped spur consumer demand for self-service, which is now available in 48 states. (New Jersey and Oregon still require full-service operations New Jersey's law was enacted in 1949; Oregon's in 1951.) 1950: Frank McNamara and Ralph Schneider introduce the concept of a credit card with their Diners Club Card. In 1958, American Express and BankAmericard are introduced. Today, an estimated two-thirds of all gasoline purchases at convenience stores are paid by plastic. 1960: OPEC the Organization of Petroleum Exporting Countries is founded by Iran, Iraq, Kuwait, Saudi Arabia and Venezuela. The five founding members were later joined by Qatar (1961), Indonesia (1962), Socialist Peoples Libyan Arab Jamahiriya (1962), United Arab Emirates (1967), Algeria (1969), Nigeria (1971). Ecuador ( ) and Gabon ( ) also were OPEC members. 1973: The U.S. Environmental Protection Agency (EPA) issues regulations calling for the incremental reduction of tetraethyl lead (TEL) in gasoline. TEL had helped reduce engine knock and spurred the way for the development of high-power, high-compression engines. Starting with the 1975 model year, U.S. automakers respond by equipping new cars with pollution-reducing catalytic converters designed to run only on unleaded fuel. 1973: OPEC announces an oil embargo against countries (including the United States) that supported Israel during the October 1973 Yom Kippur War. Arab nations cut production by 5 million barrels per day, but increased production in other countries adds 1 million barrels of day back into the system. Still, the net loss of 4 million barrels a day represents 7 percent of the free world production and causes oil prices to shoot up from $3.01 to $11.65 per barrel by December. The combination of short supply and price controls initiated by President Nixon to control inflation lead to the closing of thousands of stations. By March 1974, the embargo ends and the shortage abates. 1974: A national speed limit of 55 miles per hour is enacted (some states are later permitted to increase the limit to 65 MPH on rural interstates). Ten years later, Sammy Hagar's song, "I Can't Drive 55" is a hit. In 1995, President Clinton signs a bill lifting federal control over speed limits. Today some states have speed limits of as much as 75 MPH. 1976: The last major grassroots refinery in the United States is built in Garyville, Louisiana. 1977: The Strategic Petroleum Reserve, the world's largest supply of emergency crude oil, is established. As of January 2006, it held approximately 684 million barrels of oil in underground salt caverns in Texas and Louisiana : In February 1979, the revolution in Iran begins, and in November the U.S. Embassy in Iran is stormed and hostages are taken. Midway through the year, Saudi Arabia cuts production and the price of crude oil soars. The Iran/Iraq war also reduces production in both countries. The world price of crude oil jumps from around $14 per barrel at the beginning of 1979 to more than $35 per barrel in January 1981 (approximately $80 in today's dollars, adjusted for inflation) before stabilizing. Gasoline prices peak in March 1981 at $1.42 per gallon, which, adjusted for inflation, is about $3 per gallon. 1981: The U.S. Government responds to the oil crisis by removing price and allocation controls on the oil industry. For the first time since the early 1970s, market forces replaced regulatory programs and
39 domestic crude oil prices were allowed to rise to a market-clearing level. Decontrol also set the stage for the relaxation of export restrictions on petroleum products. 1986: Pay-at-the-pump is introduced, with dispensers featuring a built-in credit/debit card reader system. Only 13 percent of convenience stores have the technology by 1994, but 80 percent of convenience stores are using the technology by In 2004, Sheetz is the first to use touch-screen kiosks at the pump where customers can also order in-store foodservice items that they pick up after fueling. 1988: Underground storage tank (UST) regulations are passed, requiring all operators to upgrade their storage tank systems with spill-prevention and leak-detection equipment within a decade. While convenience store owners invest millions of dollars to ensure that their underground storage tanks are compliant with current regulations, many local, state and federal government owners and operators, as well as some tribes and commercial fleets, continue to dispense fuel from non-compliant tanks. 1990: Congress passes the Clean Air Act Amendments of 1990, which contain six provisions to be implemented by the U.S. Environmental Protection Agency (EPA) in stages between November 1, 1992, and January 1, Among the provisions is one for the Reformulated Gasoline Program, requiring the most polluted metropolitan areas, representing more than one-fifth of the nation's population, to sell a reformulated gasoline; other areas may "opt in" to the program by applying to the EPA. This program introduces into widespread use the additives MTBE and ethanol to satisfy the oxygen content requirement : In August 1990, Iraq invades Kuwait. The United Nations approves an embargo on all crude oil and products originating from either Iraq or Kuwait, creating concern over supply shortages that leads to a run-up in crude oil prices. Within a month, the price of crude oil climbs from about $16 per barrel to more than $28 per barrel. The price escalates to a high of about $36 per barrel in September The Gulf War begins in January 1991, but by then oil prices had already stabilized. Early 1990s: Hypermarkets selling fuel begin to make inroads in the United States as H-E-B is among the stores selling fuel in the Southwest. Interestingly, the concept was first introduced to the United States in the 1960s when a number of supermarket chains and retailers like Sears tried to sell fuel, but it did not generate sufficient consumer interest. Wal-Mart is the largest hypermarket selling fuel, with about 1,100 locations offering fueling. Today there are more than 3,600 hypermarket stores selling fuel, representing an estimated 8 percent of total U.S. gasoline sales. 1996: Wallis Companies, a convenience store chain based in Cuba, MO, serves as the test market for the introduction of Speedpass. In tests, Speedpass reduced the average three- to four-minute fueling time by 30 seconds. Within five years, more than 5 million customers were considered regular Speedpass users at Mobil or Exxon branded stations. 1999: Consolidation of the industry begins with the merger of British Petroleum and Amoco, and, later that year, Exxon and Mobil. In 2001, Chevron and Texaco merged, and Conoco and Phillips merged in : Terrorists strike the United States on September 11. The market reacts to a rapid decline in demand for crude oil and petroleum products prompted by reduced air traffic. Crude oil prices drop from nearly $28 per barrel on September 7 to $17.50 on November 15. Gasoline prices, likewise, drop from $1.52 per gallon on September 10 to $1.06 December 17, with many areas of the country seeing gasoline prices under $1.00 per gallon : A general strike in Venezuela beginning on Dec. 2, 2002, deprives the United States of a critical source of imported crude oil and refined petroleum product for several months. (Venezuela supplied approximately 8 percent of total U.S. petroleum products.) Crude oil prices increase from a pre-strike level of $26.83 to a mid-february 2003 level of $35.50 per barrel. Domestic crude oil stocks drop to their lowest level since October Meanwhile, gasoline prices increase from $1.36 per gallon for the week the strike begins to $1.73 per gallon by mid-march 2003.
40 2004: Crude oil prices hit a then-record high of more than $55 per barrel in October. High crude oil prices throughout the year help lead to record prices at the pump, and gasoline prices peak at $2.06 per gallon weekly national average on May : Gasoline prices experience a seasonal peak on April 11 when prices reach a then-record $2.28 per gallon. Gasoline prices fall for the next six weeks as oil prices drop. However, oil prices climb again in May, and gasoline prices follow suit. Oil prices hit a record $70.85 per barrel on August 30 following Hurricane Katrina, and retail gasoline prices also rise, peaking at a record $3.07 per gallon for the week of September : Gasoline prices begin to take off in April with the rapid elimination of MTBE as a fuel additive, and diesel fuel is affected by the transition to Ultra Low Sulfur Diesel. Crude oil prices again rise, hitting a record $78.40 per barrel on July 14. Gasoline prices hit a weekly high of $3.00 per gallon on August 7. Also, more nontraditional fuel retailers begin selling fuel, including a drug store chain in upstate New York and The Home Depot in Tennessee.
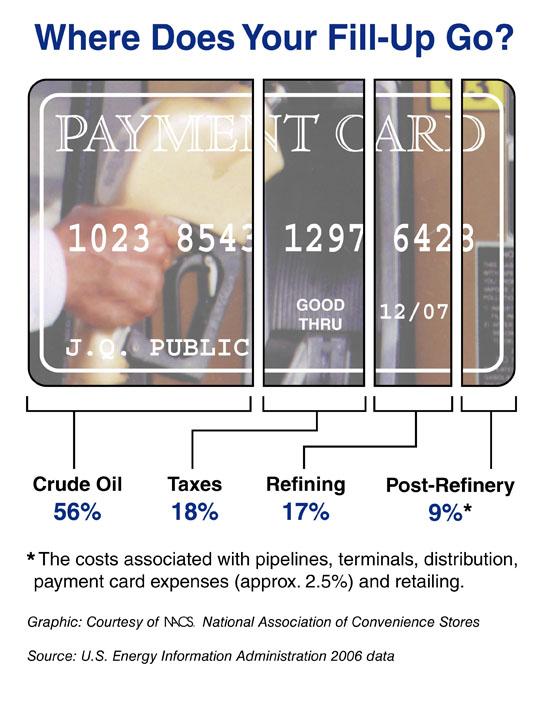
41

: 6 cents store operating expenses 4 cents credit card")

42 From Dollars in Cost to a Penny in Profit Retail Price In 2006 gasoline prices averaged $2.57. Source: Oil Price Information Service Retail Gross Margin The national average retailer markup for gasoline in 2006 was cents per gallon. The estimated costs per gallon averaged 13 cents. Estimated costs per gallon (varies by retailer): 6 cents store operating expenses 4 cents credit card fees 2 cents amortization of equipment 1 cent inventory shrink Retail Pretax Profit Source: Oil Price Information Service, NACS estimates After factoring in expenses, retailers are left with an average of less than a penny pretax profit.
Why gasoline prices are headed for $3.50 at the pump
 April 18, 2006 The price spike in the Spring of 2006 Why gasoline prices are headed for $3.50 at the pump Commissioned By: The Foundation For Taxpayer and Consumer Rights 1750 Ocean Park Boulevard, Suite
Golden State Gouge The Summer of Record Refining Profits
 Golden State Gouge The Summer of Record Refining Profits By: Cody Rosenfield and Liza Tucker August 5, 2015 1 EXECUTIVE SUMMARY In the six months since California s record gasoline price spike began in
Chapter 1: Overview of Industry
 Chapter 1: Overview of Industry A macro overview of a company's industry and the economy are critical starting points for any valuation analysis. In many cases, the industry trends are better indications
Diesel prices finally ease Winter weather and international events could determine your fuel bill for 2018 By Bryce Knorr, senior grain market analyst
 Diesel prices finally ease Winter weather and international events could determine your fuel bill for 2018 By Bryce Knorr, senior grain market analyst After rallying to their highest level in nearly three
Denver Car Share Program 2017 Program Summary
 Denver Car Share Program 2017 Program Summary Prepared for: Prepared by: Project Manager: Malinda Reese, PE Apex Design Reference No. P170271, Task Order #3 January 2018 Table of Contents 1. Introduction...
Used Vehicle Supply: Future Outlook and the Impact on Used Vehicle Prices
 Used Vehicle Supply: Future Outlook and the Impact on Used Vehicle Prices AT A GLANCE When to expect an increase in used supply Recent trends in new vehicle sales Changes in used supply by vehicle segment
PEC is continuously experiencing growth in its service territory. Weather and member growth are primary drivers for increased kwh sales.
 Year System Value Median NBR Rank Median NBR Rank Median NBR Rank Median NBR Rank Median NBR Rank Comment BASE GROUP (RATIOS 1-5) RATIO 1 --- AVERAGE TOTAL CONSUMERS SERVED 2010 234,676 13,250 815 1 19,413
Fuel Focus. Understanding Gasoline Markets in Canada and Economic Drivers Influencing Prices. Volume 10, Issue 4
 Fuel Focus Understanding Gasoline Markets in Canada and Economic Drivers Influencing Prices Volume 1, Issue 4 March, Copies of this publication may be obtained free of charge from: Natural Resources Canada
Corn Outlook. David Miller Director of Research & Commodity Services Iowa Farm Bureau Federation December 2013
 Corn Outlook David Miller Director of Research & Commodity Services Iowa Farm Bureau Federation December 2013 Source: USDA-WAOB U.S. Corn Supply & Usage U.S. Corn Supply & Usage Comments With the largest
EITF Issue 15-A, Application of the Normal Purchases and Normal Sales Scope Exception to Certain Electricity Contracts within Nodal Energy Markets
 EITF Issue 15-A, Application of the Normal Purchases and Normal Sales Scope Exception to Certain Electricity Contracts within Nodal Energy Markets Education Session January 22, 2014 1 Overview and agenda
Aging of the light vehicle fleet May 2011
 Aging of the light vehicle fleet May 211 1 The Scope At an average age of 12.7 years in 21, New Zealand has one of the oldest light vehicle fleets in the developed world. This report looks at some of the
America s Bright Future: Cleaner Air and Affordable, Reliable Electricity. Susan F. Tierney, Ph.D.
 America s Bright Future: Cleaner Air and Affordable, Reliable Electricity Susan F. Tierney, Ph.D. Analysis Group, Inc. May 23, 2012 America s Bright Future: Cleaner Air and Affordable, Reliable Electricity
International Research Journal of Applied Finance ISSN Audit Practices for Automobile Dealerships
 Audit Practices for Automobile Dealerships Paul C. Schauer Abstract One of the most important factors in a successful audit is a well-designed audit plan. The audit plan is a comprehensive process determining
EMBARGOED UNTIL RELEASE AT 8:30 A.M. EST, WEDNESDAY, JANUARY 30, 2013 GROSS DOMESTIC PRODUCT: FOURTH QUARTER AND ANNUAL 2012 (ADVANCE ESTIMATE)
") NEWS RELEASE EMBARGOED UNTIL RELEASE AT 8:30 A.M. EST, WEDNESDAY, JANUARY 30, 2013 Lisa Mataloni: (202) 606-5304 (GDP) gdpniwd@bea.gov Recorded message: (202) 606-5306 BEA 13-02 GROSS DOMESTIC PRODUCT:
NEWS RELEASE EMBARGOED UNTIL RELEASE AT 8:30 A.M. EST, WEDNESDAY, JANUARY 30, 2013 Lisa Mataloni: (202) 606-5304 (GDP) gdpniwd@bea.gov Recorded message: (202) 606-5306 BEA 13-02 GROSS DOMESTIC PRODUCT:
EMBARGOED UNTIL RELEASE AT 8:30 A.M. EDT, THURSDAY, MAY 29, 2014
 NEWS RELEASE EMBARGOED UNTIL RELEASE AT 8:30 A.M. EDT, THURSDAY, MAY 29, 2014 Lisa Mataloni: (202) 606-5304 (GDP) gdpniwd@bea.gov BEA 14-21 Kate Shoemaker: (202) 606-5564 (Profits) cpniwd@bea.gov GROSS
EMBARGOED UNTIL RELEASE AT 8:30 A.M. EST, TUESDAY, DECEMBER 23, 2014
 NEWS RELEASE EMBARGOED UNTIL RELEASE AT 8:30 A.M. EST, TUESDAY, DECEMBER 23, 2014 Lisa Mataloni: (202) 606-5304 (GDP) gdpniwd@bea.gov BEA 14-65 Kate Shoemaker: (202) 606-5564 (Profits) cpniwd@bea.gov Jeannine
NEWS RELEASE EMBARGOED UNTIL RELEASE AT 8:30 A.M. EDT, THURSDAY, MARCH 27, 2014
 NEWS RELEASE EMBARGOED UNTIL RELEASE AT 8:30 A.M. EDT, THURSDAY, MARCH 27, 2014 Lisa Mataloni: (202) 606-5304 (GDP) gdpniwd@bea.gov BEA 14-13 Kate Shoemaker: (202) 606-5564 (Profits) cpniwd@bea.gov GROSS
EMBARGOED UNTIL RELEASE AT 8:30 A.M. EST, WEDNESDAY, JANUARY 31, 2007 GROSS DOMESTIC PRODUCT: FOURTH QUARTER 2006 (ADVANCE)
") NEWS RELEASE EMBARGOED UNTIL RELEASE AT 8:30 A.M. EST, WEDNESDAY, JANUARY 31, 2007 Virginia H. Mannering: (202) 606-5304 BEA 07-02 Recorded message: (202) 606-5306 GROSS DOMESTIC PRODUCT: FOURTH QUARTER
NEWS RELEASE EMBARGOED UNTIL RELEASE AT 8:30 A.M. EST, WEDNESDAY, JANUARY 31, 2007 Virginia H. Mannering: (202) 606-5304 BEA 07-02 Recorded message: (202) 606-5306 GROSS DOMESTIC PRODUCT: FOURTH QUARTER
ALG July/August 2011 Edition Report
 ALG July/August 2011 Edition Report ALG July/August 2011 Edition Report Introduction: For the July/August 2011 edition, ALG has updated both gas price and used supply outlook to reflect the latest available
Driven NADA MANAGEMENT SERIES. ATD Performance Measurement 2017
 Driven NADA MANAGEMENT SERIES TD08 ATD Performance Measurement 2017 The National Automobile Dealers Association (NADA) has prepared this management guide to assist its dealer members in being as efficient
Fuel Focus. Understanding Gasoline Markets in Canada and Economic Drivers Influencing Prices. Issue 20, Volume 8
 Fuel Focus Understanding Gasoline Markets in Canada and Economic Drivers Influencing Prices Issue 20, Volume 8 October 18, 2013 Copies of this publication may be obtained free of charge from: Natural Resources
Biofuel Market Factors
 Biofuel Market Factors Michael Cooper Ultra Green Energy Corporation, Executive Vice President Biofuel Brokers, LLC, President/Director 866-E-MY-FUEL (369-3835) info@ultragreenenergy.com emyfuel@biofuelbrokers.com
Solar Project Development in Regulated Markets. Smart and Sustainable Campuses Conference 2017
 Solar Project Development in Regulated Markets Smart and Sustainable Campuses Conference 2017 Session Outline Overview of renewable energy procurement options Market structure and policy impacts on solar
Demystifying Your Utility Bill
 New York City Chapter Hospitality Financial and Technology Professionals DEIRDRE LORD PH: (917) 750-3771 EMAIL: DLORD@THEMWH.COM Demystifying Your Utility Bill HFTP NYC CHAPTER MONTHLY MEETING JUNE 20,
Caltex Australia comments on Carbon Pollution Reduction Scheme White Paper February 2009
 Caltex Australia comments on Carbon Pollution Reduction Scheme White Paper February 2009 Upstream Point of Liability - Fuel Tax Package Outline of scheme The Carbon Pollution Reduction Scheme (CPRS) White
Policy Note. Vanpools in the Puget Sound Region The case for expanding vanpool programs to move the most people for the least cost.
 Policy Note Vanpools in the Puget Sound Region The case for expanding vanpool programs to move the most people for the least cost Recommendations 1. Saturate vanpool market before expanding other intercity
Conventional Fuel Management Strategies That Work
 Conventional Fuel Management Strategies That Work THROUGH RESEARCH, REPLACEMENTS, AND PREVENTIVE MAINTENANCE, FLEET MANAGERS CAN GET THE BIGGEST BANG OUT OF THEIR FLEET DOLLARS. November 2013, By Brad
WHITE PAPER. Preventing Collisions and Reducing Fleet Costs While Using the Zendrive Dashboard
 WHITE PAPER Preventing Collisions and Reducing Fleet Costs While Using the Zendrive Dashboard August 2017 Introduction The term accident, even in a collision sense, often has the connotation of being an
Future Funding The sustainability of current transport revenue tools model and report November 2014
 Future Funding The sustainability of current transport revenue tools model and report November 214 Ensuring our transport system helps New Zealand thrive Future Funding: The sustainability of current transport
BENCHMARK SURVEY 2013
 AUSTRALIAN CAR WASH INDUSTRY BENCHMARK SURVEY 2013 This survey was undertaken in response to many requests for information about the car wash industry in Australia both the current position and the trends
EMBARGOED UNTIL RELEASE AT 8:30 A.M. EST, THURSDAY, JANUARY 30, 2014 GROSS DOMESTIC PRODUCT: FOURTH QUARTER AND ANNUAL 2013 (ADVANCE ESTIMATE)
") NEWS RELEASE EMBARGOED UNTIL RELEASE AT 8:30 A.M. EST, THURSDAY, JANUARY 30, 2014 BEA 14-03 Lisa Mataloni: (202) 606-5304 (GDP) gdpniwd@bea.gov Recorded message: (202) 606-5306 GROSS DOMESTIC PRODUCT:
NEWS RELEASE EMBARGOED UNTIL RELEASE AT 8:30 A.M. EST, THURSDAY, JANUARY 30, 2014 BEA 14-03 Lisa Mataloni: (202) 606-5304 (GDP) gdpniwd@bea.gov Recorded message: (202) 606-5306 GROSS DOMESTIC PRODUCT:
HOW TO SAVE THOUSANDS ON FUEL WHAT YOU CAN DO TO KEEP YOUR TANK AND YOUR WALLET FULL
 1 HOW TO SAVE THOUSANDS ON FUEL WHAT YOU CAN DO TO KEEP YOUR TANK AND YOUR WALLET FULL 2 FUEL CAN ACCOUNT FOR UP TO 40% OF A TRUCKING COMPANY S BUSINESS EXPENSES. So it s no secret that saving money on
EMBARGOED UNTIL RELEASE AT 8:30 A.M. EST, FRIDAY, JANUARY 30, 2015 GROSS DOMESTIC PRODUCT: FOURTH QUARTER AND ANNUAL 2014 (ADVANCE ESTIMATE)
") NEWS RELEASE EMBARGOED UNTIL RELEASE AT 8:30 A.M. EST, FRIDAY, JANUARY 30, 2015 Lisa Mataloni: (202) 606-5304 (GDP) gdpniwd@bea.gov Jeannine Aversa: (202) 606-2649 (News Media) BEA 15-04 GROSS DOMESTIC
NEWS RELEASE EMBARGOED UNTIL RELEASE AT 8:30 A.M. EST, FRIDAY, JANUARY 30, 2015 Lisa Mataloni: (202) 606-5304 (GDP) gdpniwd@bea.gov Jeannine Aversa: (202) 606-2649 (News Media) BEA 15-04 GROSS DOMESTIC
Real GDP: Percent change from preceding quarter
 EMBARGOED UNTIL RELEASE AT 8:30 A.M. EST, WEDNESDAY, FEBRUARY 28, 2018 BEA 18-08 Technical: Lisa Mataloni (GDP) (301) 278-9083 gdpniwd@bea.gov Media: Jeannine Aversa (301) 278-9003 Jeannine.Aversa@bea.gov
MONRO MUFFLER BRAKE, INC. PROVIDES FOURTH QUARTER AND FISCAL 2017 FINANCIAL RESULTS
 CONTACT: John Van Heel Chief Executive Officer (585) 647-6400 Robert Gross Executive Chairman (585) 647-6400 FOR IMMEDIATE RELEASE Brian D Ambrosia Senior Vice President Finance Chief Financial Officer
For personal use only
 AER ISSUES NETWORK REVENUES DRAFT DECISIONS FOR ACT AND NSW ENERGY CUSTOMERS The Australian Energy Regulator (AER) has issued draft decisions on the revenue proposals submitted by ACT and NSW distribution
Gross Domestic Product: Third Quarter 2016 (Third Estimate) Corporate Profits: Third Quarter 2016 (Revised Estimate)
 Corporate Profits: Third Quarter 2016 (Revised Estimate)") EMBARGOED UNTIL RELEASE AT 8:30 A.M. EST, THURSDAY, DECEMBER 22, 2016 BEA 16-71 Technical: Lisa Mataloni (GDP) (301) 278-9083 gdpniwd@bea.gov Kate Pinard (Corporate Profits) (301) 278-9417 cpniwd@bea.gov
EMBARGOED UNTIL RELEASE AT 8:30 A.M. EST, THURSDAY, DECEMBER 22, 2016 BEA 16-71 Technical: Lisa Mataloni (GDP) (301) 278-9083 gdpniwd@bea.gov Kate Pinard (Corporate Profits) (301) 278-9417 cpniwd@bea.gov
Figure 1 Unleaded Gasoline Prices
 Policy Issues Just How Costly Is Gas? Summer 26 Introduction. Across the nation, the price at the pump has reached record highs. From unleaded to premium grade, prices have broken three dollars per gallon
Gross Domestic Product: Fourth Quarter and Annual 2016 (Second Estimate)
") EMBARGOED UNTIL RELEASE AT 8:30 A.M. EST, TUESDAY, FEBRUARY 28, 2017 BEA 17-07 Technical: Lisa Mataloni (GDP) (301) 278-9083 gdpniwd@bea.gov Media: Jeannine Aversa (301) 278-9003 Jeannine.Aversa@bea.gov
EMBARGOED UNTIL RELEASE AT 8:30 A.M. EST, TUESDAY, FEBRUARY 28, 2017 BEA 17-07 Technical: Lisa Mataloni (GDP) (301) 278-9083 gdpniwd@bea.gov Media: Jeannine Aversa (301) 278-9003 Jeannine.Aversa@bea.gov
DISCOVER U.S. SPENDING MONITOR SM
 DISCOVER U.S. SPENDING MONITOR SM Mar Feb DSM 86.5 88.7 86.1 86.0 86.8 85.4 85.1 86.4 Spending 95.6 95.8 97.5 97.6 97.9 95.3 93.9 92.1 Econ 75.2 79.9 71.9 71.4 73.0 73.0 74.2 79.4 DSBW 74.6 86.9 84.6 71.8
The Impact on Québec s Budget Balance
 ISSN 1715-2682 Volume 1, no. 2 August 17, 2005 Higher Fuel Prices The Impact on Québec s Budget Balance Summary 1. The increase in the price of gasoline at the pump since 1999 is due primarily to the soaring
Gross Domestic Product: Second Quarter 2016 (Second Estimate) Corporate Profits: Second Quarter 2016 (Preliminary Estimate)
 Corporate Profits: Second Quarter 2016 (Preliminary Estimate)") EMBARGOED UNTIL RELEASE AT 8:30 A.M. EDT, FRIDAY, AUGUST 26, 2016 BEA 16-44 Technical: Lisa Mataloni (GDP) (301) 278-9080 gdpniwd@bea.gov Kate Pinard (Corporate Profits) (301) 278-9417 cpniwd@bea.gov Media:
EMBARGOED UNTIL RELEASE AT 8:30 A.M. EDT, FRIDAY, AUGUST 26, 2016 BEA 16-44 Technical: Lisa Mataloni (GDP) (301) 278-9080 gdpniwd@bea.gov Kate Pinard (Corporate Profits) (301) 278-9417 cpniwd@bea.gov Media:
Trend Report on Competition and Consumer Confidence in the Energy Market Second half of 2011
 Trend Report on Competition and Consumer Confidence in the Energy Market Second half of 2011 Office of Energy Regulation The Netherlands Competition Authority The Hague, March 2012 Contents Introduction...
U.S. GASOLINE AND DISTILLATE FUELS UPDATE - DECEMBER 20, 2017
 U.S. GASOLINE AND DISTILLATE FUELS UPDATE - DECEMBER 20, 2017 PRICE TRENDS Monday, December 18 According to the Energy Information Administration (EIA), the average U.S. retail price for regular grade
Start covering fall fuel needs OPEC unity stabilizes oil market for now By Bryce Knorr, senior grain market analyst
 Start covering fall fuel needs OPEC unity stabilizes oil market for now By Bryce Knorr, senior grain market analyst OPEC and its allies are a strange bunch. Iran hates Saudi Arabia as much as it dislikes
Facts and Figures. October 2006 List Release Special Edition BWC National Benefits and Related Facts October, 2006 (Previous Versions Obsolete)
") Facts and Figures Date October 2006 List Release Special Edition BWC National Benefits and Related Facts October, 2006 (Previous Versions Obsolete) Best Workplaces for Commuters - Environmental and Energy
Facts and Figures Date October 2006 List Release Special Edition BWC National Benefits and Related Facts October, 2006 (Previous Versions Obsolete) Best Workplaces for Commuters - Environmental and Energy
HOUSING REPORT SOUTHEAST MICHIGAN 2ND QUARTER 2018
 SOUTHEAST MICHIGAN 2ND QUARTER 218 Southeast Michigan Curb Appeal for Added Value Curb appeal plays a significant role in getting your home ready to sell. Among Realtors, 94% have suggested that sellers
Worldwide Demand for Crude Oil & Refined Products: Refinery Business Objectives: Fundamental Qualities of Oil:
 6HFWLRQ )DFWRUV'ULYLQJ &UXGH2LO3ULFHV +RZWKH)DFWRUV $IIHFW&KDG V 3ULFHV &RQWH[W0DUNHWLQJ&KDG V2LO T he Project has now shipped over 50 million barrels of Chadian crude oil to market and the results so
Week ending 5 August Sunday, 5 August 2018.
 Week ending 5 August 2018 Sunday, 5 August 2018. 1 The Australian Fuel Market - An Overall Snapshot Understanding Movements in Key Diesel Price Indicators The Chart below provides an overall snapshot of
EMBARGOED UNTIL RELEASE AT 8:30 A.M. EDT, FRIDAY, MARCH 25, 2016
 NEWS RELEASE EMBARGOED UNTIL RELEASE AT 8:30 A.M. EDT, FRIDAY, MARCH 25, 2016 GDP: Lisa Mataloni (202) 606-5304 gdpniwd@bea.gov Profits: Kate Pinard (202) 606-5564 cpniwd@bea.gov News Media: Jeannine Aversa
Week ending 6 January Sunday, 6 January 2019.
 Week ending 6 January 2019 Sunday, 6 January 2019. 1 The Australian Fuel Market - An Overall Snapshot Understanding Movements in Key Diesel Price Indicators The Chart below provides an overall snapshot
AMAG posts record shipments in 2013; dividend recommendation of 0.60 EUR per share unchanged on last year
 Ranshofen, 28 February 2014 AMAG posts record shipments in 2013; dividend recommendation of 0.60 EUR per share unchanged on last year Shipments at an all-time high of 351,700 tonnes (t) in 2013, compared
Gross Domestic Product: Third Quarter 2016 (Advance Estimate)
") EMBARGOED UNTIL RELEASE AT 8:30 A.M. EDT, FRIDAY, OCTOBER 28, 2016 BEA 16-57 Technical: Lisa Mataloni (GDP) (301) 278-9083 gdpniwd@bea.gov Media: Jeannine Aversa (301) 278-9003 Jeannine.Aversa@bea.gov
EMBARGOED UNTIL RELEASE AT 8:30 A.M. EDT, FRIDAY, OCTOBER 28, 2016 BEA 16-57 Technical: Lisa Mataloni (GDP) (301) 278-9083 gdpniwd@bea.gov Media: Jeannine Aversa (301) 278-9003 Jeannine.Aversa@bea.gov
BASIC REQUIREMENTS TO BE A DEALER. RV Trade Digest, January 1995
 BASIC REQUIREMENTS TO BE A DEALER - Bill Gorman - RV Trade Digest, January 1995 The time for fair-weather dealers is back. Fair weather dealers are those who only come out of the closet in good times.
Energy Outlook. U.S. Energy Information Administration. For EnerCom Dallas February 22, 2018 Dallas, TX
 Energy Outlook For EnerCom Dallas Dallas, TX Jeff Barron Industry Economist, U.S. Energy Information Administration U.S. Energy Information Administration Independent Statistics & Analysis www.eia.gov
DOWNSTREAM PETROLEUM 2017 DOWNSTREAM PETROLEUM
 DOWNSTREAM PETROLEUM International and Asian Refining The global refining industry is fundamentally changing as emerging and maturing trends re-shape the global supply and demand patterns for crude oil
Prices indeed dropped on Thursday, aided by a surprise increase in crude oil supplies caused by stronger imports.
 Trump s war on OPEC Farm fuel prices resist President s attempt to jawbone cartel By Bryce Knorr, senior grain market analyst For a day or two, at least, it looked like President Trump s attempt to tweet
Trends in Iowa Ethanol Blends Sales: E10, E15, E20, and E85 and the Biofuel Distribution Percentage
 Trends in Iowa Ethanol Blends Sales: E10, E15, E20, and E85 and the Biofuel Distribution Percentage By IFBF Research and Commodity Services- By Patricia Batres-Marquez, Decision Innovation Solutions (DIS).
9 Secrets to Cut Fleet Costs
 ebook 9 Secrets to Cut Fleet Costs GPS fleet tracking can help improve productivity and reduce fuel usage, which can lead to increased revenue and better customer service. The day-to-day costs of running
All Gasoline is Not Created Equal
 All Gasoline is Not Created Equal A Look at Fuel Quality in the United States December 2007 Proposed Framework for the Day Current State of the U.S. Retail Gasoline Industry Customer perception Fuels in
H1 2018: Strong organic order growth and profitability increase
 Sulzer Management Ltd Neuwiesenstrasse 15 8401 Winterthur Switzerland Phone +41 52 262 30 00 Fax +41 52 262 31 00 In the first half of 2018, Sulzer s rebound continued. Order intake increased by 11.6%
Franchising. Bruce R. Barringer R. Duane Ireland
 Franchising Bruce R. Barringer R. Duane Ireland 1 Chapter Objectives 1 of 2 1. Explain franchising and how this form of business ownership works. 2. Describe steps entrepreneurs can take to establish a
EMBARGOED UNTIL RELEASE AT 8:30 A.M. EST, TUESDAY, DECEMBER 22, 2015
 NEWS RELEASE EMBARGOED UNTIL RELEASE AT 8:30 A.M. EST, TUESDAY, DECEMBER 22, 2015 GDP: Lisa Mataloni (202) 606-5304 gdpniwd@bea.gov Profits: Kate Pinard (202) 606-5564 cpniwd@bea.gov News Media: Jeannine
Week ending 13 January Sunday, 13 January 2019.
 Week ending 13 January 2019 Sunday, 13 January 2019. 1 The Australian Fuel Market - An Overall Snapshot Understanding Movements in Key Diesel Price Indicators The Chart below provides an overall snapshot
Fuel Focus. Understanding Gasoline Markets in Canada and Economic Drivers Influencing Prices. Volume 7, Issue 8
 Fuel Focus Understanding Gasoline Markets in Canada and Economic Drivers Influencing Prices May 4, 12 Copies of this publication may be obtained free of charge from: Natural Resources Canada Petroleum
How Old Cars And New Solutions Will Impact Our Industry
 How Old Cars And New Solutions Will Impact Our Industry New Car Market Trends Watch the Used Car Market Tariffs and Other Concerns The Evolution of Mobility 1 2018 MID-YEAR REVIEW TRANSFORMING THE WAY
FISCAL YEAR MARCH 2015 THIRD QUARTER FINANCIAL RESULTS. Updated Mazda CX-5 (Japanese specification model)
") FISCAL YEAR MARCH 2015 THIRD QUARTER FINANCIAL RESULTS Updated Mazda CX-5 (Japanese specification model) Mazda Motor Corporation February 4, 2015 1 PRESENTATION OUTLINE Highlights Fiscal Year March 2015
FISCAL YEAR MARCH 2015 THIRD QUARTER FINANCIAL RESULTS Updated Mazda CX-5 (Japanese specification model) Mazda Motor Corporation February 4, 2015 1 PRESENTATION OUTLINE Highlights Fiscal Year March 2015
Operating Refineries in a High Cost Environment. Options for RFS Compliance. March 20, Baker & O Brien, Inc. All rights reserved.
 Operating Refineries in a High Cost Environment Options for RFS Compliance March 2, 217 Baker & O Brien, Inc. All rights reserved. Discussion Points Introduction Renewable Fuels Standard (RFS) Overview
Week ending 4 February Sunday, 4 February 2018.
 Week ending 4 February 2018 Sunday, 4 February 2018. 1 The Australian Fuel Market - An Overall Snapshot Understanding Movements in Key Diesel Price Indicators The Chart below provides an overall snapshot
Record CY 2016 EPS-diluted-adjusted of $6.12, an increase of $1.10 Y-O-Y. Q EPS-diluted-adjusted of $1.28, a decrease of $0.11 Y-O-Y.
 1 2 3 Q4 2016 global deliveries up 0.1 million units year-over-year (Y-O-Y), a 3.3% increase. Volume gains primarily in North America and China, offset by reductions in International Operations (excluding
Discover the power of seven! 5. Enjoy 24/7 U.S.-based customer service. 6. Use at 11,000+ Exxon- or Mobil-branded stations
 Discover the power of seven! Save 7 per gallon * for 7 months when you apply now 7 ways to power your fueling: 1. Get great rebates 2. Fuel securely with card controls and Driver IDs 3. Track spending
FRAUD MATTERS UNITED KINGDOM. Keeping pace with a changing world
 FRAUD MATTERS UNITED KINGDOM Keeping pace with a changing world Tightening fraud protection Cashless payments are on the rise. According to CapGemini s World Payments Report, there were around 366 billion
U.S. Rail Crude Oil Traffic
 U.S. Rail Crude Oil Traffic Association of American Railroads November 215 Summary U.S. crude oil production has risen sharply in recent years, with much of the increased output moving by rail. In 28,
EMBARGOED UNTIL RELEASE AT 8:30 A.M. EDT, THURSDAY, AUGUST 27, 2015
 NEWS RELEASE EMBARGOED UNTIL RELEASE AT 8:30 A.M. EDT, THURSDAY, AUGUST 27, 2015 Lisa Mataloni: (202) 606-5304 (GDP) gdpniwd@bea.gov BEA 15-38 Kate Pinard: (202) 606-5564 (Profits) cpniwd@bea.gov Jeannine
Residential Load Profiles
 Residential Load Profiles TABLE OF CONTENTS PAGE 1 BACKGROUND... 1 2 DATA COLLECTION AND ASSUMPTIONS... 1 3 ANALYSIS AND RESULTS... 2 3.1 Load Profiles... 2 3.2 Calculation of Monthly Electricity Bills...
Real GDP: Percent change from preceding quarter
 EMBARGOED UNTIL RELEASE AT 8:30 A.M. EDT, THURSDAY, SEPTEMBER 28, 2017 BEA 17-51 Technical: Lisa Mataloni (GDP) (301) 278-9083 gdpniwd@bea.gov Kate Pinard (Corporate Profits) (301) 278-9417 cpniwd@bea.gov
POLICY BRIEF. Citizen s Guide to Electric Choice & Competition ELIZABETH BRYAN & KATRINA ANDERSON. Background
 POLICY BRIEF from the COMMONWEALTH FOUNDATION Vol. 22, No. 01 January 2010 Citizen s Guide to Electric Choice & Competition ELIZABETH BRYAN & KATRINA ANDERSON Background Why are we now getting electricity
BMW Group posts record earnings for 2010
 10.03.2011 BMW Group posts record earnings for 2010 Profit before tax rises to euro 4,836 million Profit before financial result climbs to euro 5,094 million Automobiles segment reports EBIT of euro 4,355
Lazydays Holdings, Inc. Reports Second Quarter 2018 Financial Results
 News Contact: +1 (813) 204-4099 investors@lazydays.com Lazydays Holdings, Inc. Reports Second Quarter 2018 Financial Results Tampa, FL (August 9, 2018) Lazydays Holdings, Inc. ( Lazydays )(NasdaqCM: LAZY)
It s time to start buying propane for fall Expect to pay more to dry 2017 corn crop By Bryce Knorr, senior grain market analyst
 It s time to start buying propane for fall Expect to pay more to dry 2017 corn crop By Bryce Knorr, senior grain market analyst It s the end of winter hopefully and that means it s a good time to buy coats,
Figure 1 Unleaded Gasoline Prices
 Policy Issues Just How Costly Is Gas? Summer 24 Introduction. Across the nation, the price at the pump has reached record highs. From unleaded to premium grade, prices have broken the two-dollar-per-gallon
On track. Investor and Analyst Presentation On the Occasion of the Release of the Preliminary Figures for FY 2011 Hanover, 19 January 2012
 On track. Investor and Analyst Presentation On the Occasion of the Release of the Preliminary Figures for FY 2011 Agenda Delticom at a Glance Business Model Profit & Loss Balance Sheet Outlook 2 Agenda
Week ending 6 May Sunday, 6 May 2018.
 Week ending 6 May 2018 Sunday, 6 May 2018. 1 The Australian Fuel Market - An Overall Snapshot Understanding Movements in Key Diesel Price Indicators The Chart below provides an overall snapshot of movements
U.S. Rail Crude Oil Traffic
 U.S. Rail Crude Oil Traffic Association of American Railroads May 217 Summary U.S. crude oil production has risen sharply in recent years, with much of the increased output moving by rail. In 28, U.S.
Factory activity accelerated further in our region this month, posting its highest composite reading since 2011, said Wilkerson.
 FOR RELEASE Thursday, October 26, 17 EMBARGOED FOR A.M. CENTRAL TIME CONTACT: Pam Campbell 45-27-8617 Pam.Campbell@kc.frb.org TENTH DISTRICT MANUFACTURING ACTIVITY POSTS STRONG GROWTH Federal Reserve Bank
Powercell Technologies - Strategic Marketing Direction?
 Powercell Technologies - Strategic Marketing Direction? Powercell Technologies is a B2B distributor and value-added retailer of rechargeable and disposable batteries used in institutions, specialty industrial
FISCAL YEAR MARCH 2014 FIRST HALF FINANCIAL RESULTS. New Mazda Axela (Overseas name: New Mazda3)
") FISCAL YEAR MARCH 2014 FIRST HALF FINANCIAL RESULTS New Mazda Axela (Overseas name: New Mazda3) Mazda Motor Corporation October 31, 2013 1 PRESENTATION OUTLINE Highlights Fiscal Year March 2014 First Half
FISCAL YEAR MARCH 2014 FIRST HALF FINANCIAL RESULTS New Mazda Axela (Overseas name: New Mazda3) Mazda Motor Corporation October 31, 2013 1 PRESENTATION OUTLINE Highlights Fiscal Year March 2014 First Half
Fueling Savings: Higher Fuel Economy Standards Result In Big Savings for Consumers
 Fueling Savings: Higher Fuel Economy Standards Result In Big Savings for Consumers Prepared for Consumers Union September 7, 2016 AUTHORS Tyler Comings Avi Allison Frank Ackerman, PhD 485 Massachusetts
Gross Domestic Product: First Quarter 2017 (Advance Estimate)
") EMBARGOED UNTIL RELEASE AT 8:30 A.M. EDT, FRIDAY, APRIL 28, 2017 BEA 17-19 Technical: Lisa Mataloni (301) 278-9083 gdpniwd@bea.gov Media: Jeannine Aversa (301) 278-9003 Jeannine.Aversa@bea.gov Gross Domestic
EMBARGOED UNTIL RELEASE AT 8:30 A.M. EDT, FRIDAY, APRIL 28, 2017 BEA 17-19 Technical: Lisa Mataloni (301) 278-9083 gdpniwd@bea.gov Media: Jeannine Aversa (301) 278-9003 Jeannine.Aversa@bea.gov Gross Domestic
Fuel Focus. Understanding Gasoline Markets in Canada and Economic Drivers Influencing Prices. Issue 24, Volume 8
 Fuel Focus Understanding Gasoline Markets in Canada and Economic Drivers Influencing Prices Issue 24, Volume 8 December, Copies of this publication may be obtained free of charge from: Natural Resources
AMAG posts record shipments in 2013; dividend recommendation of 0.60 EUR per share
 Ranshofen, 28 February 2014 AMAG posts record shipments in 2013; dividend recommendation of 0.60 EUR per share Shipments at an all-time high of 351,700 tonnes (t) in 2013, compared with 344,200 t a year
Refining Profits: How Californians Get Fleeced at the Pump
 Refining Profits: How Californians Get Fleeced at the Pump By: Jamie Court, Cody Rosenfield and Liza Tucker May 5, 2015 Refining Profits: How Californians Get Fleeced at the Pump Page! 1 of 7! EXECUTIVE
GROSS DOMESTIC PRODUCT: FIRST QUARTER 2016 (THIRD ESTIMATE) CORPORATE PROFITS: FIRST QUARTER 2016 (REVISED ESTIMATE)
 CORPORATE PROFITS: FIRST QUARTER 2016 (REVISED ESTIMATE)") EMBARGOED UNTIL RELEASE AT 8:30 A.M. EDT, TUESDAY, JUNE 28, 2016 BEA 16-32 Technical: Lisa Mataloni (GDP) Kate Pinard (Corporate Profits) 301.278.9080 301.278.9417 gdpniwd@bea.gov cpniwd@bea.gov Media:
EMBARGOED UNTIL RELEASE AT 8:30 A.M. EDT, TUESDAY, JUNE 28, 2016 BEA 16-32 Technical: Lisa Mataloni (GDP) Kate Pinard (Corporate Profits) 301.278.9080 301.278.9417 gdpniwd@bea.gov cpniwd@bea.gov Media:
EMBARGOED UNTIL RELEASE AT 8:30 A.M. EST, FRIDAY, FEBRUARY 27, 2015
 NEWS RELEASE EMBARGOED UNTIL RELEASE AT 8:30 A.M. EST, FRIDAY, FEBRUARY 27, 2015 Lisa Mataloni: (202) 606-5304 (GDP) gdpniwd@bea.gov BEA 15-07 Jeannine Aversa: (202) 606-2649 (News Media) GROSS DOMESTIC
Saft Groupe SA reports Quarterly Financial Information for the third quarter of 2007
 N 61-07 Saft Groupe SA reports Quarterly Financial Information for the third quarter of 2007 Paris, 9 th November 2007 - Saft, leader in the design, development and manufacture of high-end batteries for
FISCAL YEAR MARCH 2015 FIRST QUARTER FINANCIAL RESULTS. Mazda Roadster 25 th Anniversary Model
 FISCAL YEAR MARCH 2015 FIRST QUARTER FINANCIAL RESULTS Mazda Roadster 25 th Anniversary Model Mazda Motor Corporation July 31, 2014 1 PRESENTATION OUTLINE Highlights Fiscal Year March 2015 First Quarter
Strong performance by the Bolloré Group s operating activities in 2018 Mr Cyrille Bolloré unanimously appointed Chairman and Chief Executive Officer
 PRESS RELEASE 2018 results (1) March 14, 2019 Strong performance by the Bolloré Group s operating activities in 2018 Mr Cyrille Bolloré unanimously appointed Chairman and Chief Executive Officer Revenue:
TENTH DISTRICT MANUFACTURING SURVEY REBOUNDED MODERATELY Federal Reserve Bank of Kansas City Releases January Manufacturing Survey
 FOR RELEASE Thursday, January 23, 2014 EMBARGOED FOR 10 A.M. CENTRAL TIME CONTACT: Bill Medley 816-881-2556 Bill.Medley@kc.frb.org TENTH DISTRICT MANUFACTURING SURVEY REBOUNDED MODERATELY Federal Reserve
1. Introduction and Summary
 Calculating Gasoline RVP Seasonal Change Giveaway Economics 1. Introduction and Summary A. Barsamian, L.E. Curcio Refinery Automation Institute, LLC Tel: +1-973-644-2270 Email: jabarsa@refautom.com US
Annual KRTA Report for the Year 2016
 Annual KRTA Report for the Year 2016 Tracy Golden, CPE, CPA Chief Financial Officer Board Meeting August 21, 2017 Key Ratio Trend Analysis Provided by CFC each year Numbers come from annual CFC Form 7