STATISTICS ON CHILDREN IN INDIA
|
|
|
- Patience Sherman
- 6 years ago
- Views:
Transcription
1 STATISTICS ON CHILDREN IN INDIA HAND BOOK 2009 NATIONAL INSTITUTE OF PUBLIC COOPERATION AND CHILD DEVELOPMENT 5, Siri Institutional Area, Hauz Khas, New Delhi
2 2009 Twelfth Revised Edition No. of Copies 1500 Published by National Institute of Public Cooperation and Child Development 5, Siri Institutional Area, Haaz Khas, New Delhi and printed at Chandu Press, D-97, Shakarpur, Delhi
3
4 iv
5 Foreword Ensuring survival, development and protection of children is one of the foremost concerns of the nation. National Plan of Action for Children, 2005 represents the response of the government s commitments by setting ambitious goals in this direction and efforts are being made to realise these goals. India also has the distinction of running the world s largest child related programme Integrated Child Development Services (ICDS). The Government is increasingly working in collaboration with voluntary organisations which have star ted looking af ter different facets of child development. In this context, availability of reliable data on different aspects related to child development and protection is not only necessary for quantifying targets in order to achieve goals but also for critically assessing the progress and evaluating achievements. The data enables the concerned professional to look more closely, see more clearly and act more conscientiously. It is important to have adequate and reliable information on child population and various facets of child development and welfare which serve as a basis for programme planning and implementation in this field. While such information may be available with various Ministries/Departments/National and International Organisations, the Institute took an initiative to compile data related to various facets of child development and welfare from different sources and publish in the form of a pocket book in The data contained includes information on different aspects such as population, vital statistics, health & family welfare, education, welfare services, child labour and socio-economic indicators. The data contained in the pocket book is continuously updated and published in the form of a pocket book/ hand book from time to time to provide a handy source of reliable data which is easily accessible to all and thus facilitating the policy makers, planners, administrators and researchers in planning, implementing and evaluating the programmes. The new edition of the hand book Statistics on Children in India contains not only updated information but also new data which have become available now. Efforts have been made to provide latest information available from various sources. I hope that this document will meet the needs of the planners, researchers and administrators and they find it useful in designing their tasks. We would, however, welcome any suggestion for improvement in the coverage and quality of the publication. I wish to place on record my appreciation for the efforts put in by the faculty of the Institute in bringing out this edition. (A.K. Gopal) Director
6 vi
7 Project Team Project Coordinator Dr. Dinesh Paul Additional Director (TC) Project Incharge H.P. Joshi Research Assistant Project Assistant Himani Nautiyal vii
8 viii
9 ix
10 % x
11 < xi
12 xii
13 xiii
14 xiv
15 1. Population Statistics Table 1.1 Contents Title Population of ten most populous selected countries as per latest census xv Page No. Table 1.2 Demographic trends in SAARC countries, Table 1.3 Population and its growth, India : Table 1.4 Statewise area and population by sex (Census 2001) 9 Table 1.5 Statewise population by rural/urban residence (Census 2001) 13 Table 1.6 Table 1.7 Table 1.8 Table 1.9 Table 1.10 Table 1.11 Table 1.12 Table Vital Statistics Percentage population in five years age-group by residence and sex, 2001 Percentage of Population in the age group 0-4 years by sex and residence, India & States/UTs, 2001 Total population, child population (0-14 yrs) and proportion of child population to total population by sex and residence, India Statewise child population (0-14 yrs) and its proportion to total population by sex and residence, India 2001 Child population in the age group 0-6 years by sex and its proportion to total population in 1991 and 2001 Child population (0-14 years) in India, states (except Goa) and northeast states (excluding Assam) 1981 to 2026 Sex ratio of total population and child population (0-6 years) 1991 and 2001 Mean age at effective marriage of females by residence, India and bigger states, 2007 Table 2.1 Vital statistics of ten most populous selected countries, Table 2.2 Survival, progress and setbacks in SAARC countries, Table 2.3 Estimated birth and death rates in India Table 2.4 Expectation of life at birth by sex from to Table 2.5 Mortality indicators in India, Table 2.6 Table 2.7 Neo-natal mortality rates and percentage share of neo-natal deaths to infant deaths by residence, India and bigger states, 2007 Peri-natal mortality rates and still birth rates by residence, India and bigger states, 2007 Table 2.8 Infant Mortality Rates in India 1951 to Table 2.9 Estimated infant mortality rates by sex and residence in India and states,
16 Title Page No. Table 2.10 Estimated infant mortality rates in India and bigger states, Table 2.11 Estimated death rates for children aged 0-4 yrs by sex and residence India and bigger states, Table 2.12 Age-specific death rates by sex and residence in India, Table 2.13 Table 2.14 Table 2.15 Table 2.16 Table 2.17 Percent distribution of deaths by broad age groups, India and bigger states, 2007 Percentage of infant deaths to total deaths by residence in India and bigger states, 2007 Percentage of deaths in the age group 0-4 years to total deaths by residence in India and bigger States, 2007 Death rates for children aged 5-14 years by sex and residence in India and bigger states, 2007 Percentage distribution of medically certified deaths over age groups by sex and major cause groups (based on tenth revision of ICD) during Table 2.18 Percentage distribution of medically certified deaths by age and sex over major cause groups (based upon tenth revision of ICD) during Health and Family Welfare Table 3.1 Indicators of maternal and child health Table 3.2 Commitment to health : access, services and resources in SAARC countries in latest years 89 Table 3.3 Leading global health crises and challenges in SAARC countries 91 Table 3.4 Yearwise vaccination performance for years Table 3.5 Table 3.6 Universal immunization programme estimated targets and reported coverage in percent to Percentage of children age months who received specific vaccines by state, India Table 3.7 Immunisation of children against specified diseases to Table 3.8 Table 3.9 Table 3.10 Table 3.11 Percentage of children below 3 years who were ill with acute respiratory infection(ari) and diarrhoea by states, India, Yearwise distribution of births by residence and type of medical attention received (percentage) Percent distribution of live births by type of medical attention received by the mother at delivery by residence, India and bigger states, 2007 Yearwise distribution of deaths by residence and type of medical attention received (%) Table 3.12 State/UT wise cumulative AIDS cases in India till December xvi
17 Table 3.13 Title AIDS cases among different age-groups in India (reported to NACO as on 31 December, 2005 Page No. 114 Table 3.14 Place of delivery and reasons for not delivering in a health facility 115 Table 3.15 Percent distribution of women who had alive birth in the five years preceding the survey by antenatal care (ANC) provider during pregnancy for the most recent live birth, according to state, India, Table 3.16 Antenatal care indicators by state, India Table 3.17 Maternal mortality ratio in SAARC countries ( ) 121 Table Nutrition Table 4.1 Percentage of women age who have begun childbearing by age and residence Percentage of children (below 5 years) under weight for age in SAARC countries ( ) Table 4.2 Daily average intake of energy and proteins against recommended intake by age/sex/physical activity of rural population 129 Table 4.3 Mean intake of food stuffs (g/day) by age group and sex, Table 4.4 Table 4.5 Table 4.6 Table 4.7 Statewise percentage distribution of children under 5 years classified as malnourished according to three anthropometric indices of nutritional status: stunting, wasting, underweight Percentage of children under age 5 years classified as Malnourished according to weight for age by Residence (Rural/Urban) Statewise percentage distribution of children under 5 years classified as malnourished according to weight for age by sex, Percentage of children under age 3 years classified as Malnourished according to weight for age NFHS 3 & NFHS Table 4.8 Initial breastfeeding by state, India Table 4.9 Table 4.10 Initiation of breast feeding and prelacteal feeding for last-born children by residence Median duration (months) of breastfeeding among last born children in the last three years¹ Table 4.11 Number of beneficiaries for supplementary nutrition and pre-school education in ICDS during Table 4.12 Table 4.13 Table 4.14 Statewise beneficiaries of supplementary nutrition as on 31st March 2009 Prevalence (%) of signs and symptoms of vitamin A deficiency among 1 - <5 year children Percentage of children (age months) who received vitamin A supplements in last six months by states, India, xvii
18 Table 4.15 Table 4.16 Table 4.17 Title Yearwise achievements of targets of prophylaxis against nutritional anaemia among women and against blindness due to vit. A deficiency amongst children Prophylaxis against nutritional anaemia among women and blindness due to vitamin A deficiency among children, Percentage of children age 6-59 months classified as having anaemia, according to state, India, Page No Table 4.18 Prevalence (%) of anaemia among 1 <5 years children 162 Table 4.19 Prevalence (%) of anaemia among year girls 163 Table 4.20 Prevalence (%) of anaemia among year girls 164 Table 4.21 Prevalence (%) of anaemia among pregnant women (> 6 months) 165 Table 4.22 Prevalence (%) of anaemia among lactating women (< 6 months) 166 Table 4.23 Prevalence (%) of undernutrition (<Median -2SD) among pre-school children (NNMB rural surveys ) 167 Table 4.24 Prevalence of micronutrients deficiency disorders in rural population in India ; NNMB rural survey 5. Education and Literacy Table 5.1 Literacy rates in India, Table 5.2 Statewise and genderwise literacy rates, India Table 5.3 Growth of recognised educational institutions from to Table 5.4 Distribution of teachers by type of schools, to Table 5.5 Sexwise enrollment in primary and middle/upper-primary classes since Table 5.6 Gross enrollment ratio in classes I-V and VI-VIII Table 5.7 Table 5.8 Table 5.9 Gross enrollment ratio of students belonging to scheduled castes, Gross enrolment ratio of students belonging to scheduled tribes in Classes I-V and VI-VIII, Number of institutions and enrollment in pre-primary/pre-basic stage in States/UTs, Table 5.10 Enrollment in primary/junior-basic stage in states/uts, Table 5.11 Statewise dropout rates in classes I-V and I-VIII, Table 5.12 Dropout rates (percent) at different stages of school education from to Table 5.13 Reasons for children not attending school in India 200 Table 5.14 Children attending pre-school education under ICDS scheme as on 31st March, 2009 xviii 202
19 Table 5.15 Table 5.16: Title Coverage of children in pre-school education under ICDS scheme, Budgeted expenditure (revenue account) on education in states/uts, Page No Table 5.17 Educational expenditure as percentage of GDP (at current prices) for India to Child Development and Welfare Services Table 6.1 Table 6.2 Integrated Child Development Services (ICDS) statewise sanctioned projects as on 31st March 2009 Statewise number of creches for children of working and ailing mothers by Central Social Welfare Board in states/union territories, Table 6.3 Disabled population by type of disability, age group and sex, Table 6.4 Table 6.5 Number of persons per 1000 disabled persons of age 5-18 years by enrollment status and type of disability for each sex and sector in India (July-December 2002) State/UT wise distribution of convicts in jails by sex and age groups at the end of 2006 Table 6.6 Number of women prisoners with children at the end of Table 6.7 Table 6.8 Table 6.9 Table 6.10 Table 6.11 Juveniles apprehended under IPC and SLL crimes in India by sex ( ) Juveniles apprehended under IPC and SLL crimes in India by age groups ( ) Juveniles apprehended under IPC and SLL crimes in India by age groups and sex during 2007 Juveniles apprehended under SLL crimes by age group & sex in states/uts during 2007 Juveniles Apprehended under IPC crimes by age group & sex in states/uts during 2007 Table 6.12 Juvenile delinquency under Different Crime Heads (IPC) during Table 6.13 Table 6.14 Table 6.15 Table 6.16 Table 6.17 Juveniles apprehended under different SLL crimes in states and UTs during 2007 Classification of juveniles arrested (under IPC and SLL) in states & UTs by attributes during 2007 State/UT wise disposal of juveniles arrested (under IPC and SLL crimes) and sent to courts during 2007 Incidence and rate of crimes committed against children in States and UTs during 2007 Crimes against children in the country and percentage variation in 2007 over xix
20 Table 6.18 Table 6.19 Table 6.20 Table 6.21 Table 6.22 Table 6.23 Table 6.24 Table 6.25 Table 6.26 Table 6.27 Title Age group wise victims of incest (rape) cases in States/UTs during 2007 Crime head-wise incidence of various crimes under human trafficking during and percentage variation in 2007 over 2006 Incidence (I), Rate (R) and Percentage Contribution (P) to all India total of crimes committed against children during 2007 Statewise percentage of children reporting physical abuse in one or more situations by gender* Genderwise percentage of children reporting one or more forms of sexual abuse in different states Percentage of children among different evidence groups reporting different forms of sexual abuse State and genderwise percentage of children reporting emotional abuse through humiliation Statewise perception of girl children reporting neglect as compared to brothers Yearwise number of children given into foreign and Indian adoption ( ) under the Guardians and Wards Act, 1990 Number of awards given to children by sex for outstanding deeds of bravery and gallantry under the scheme of national awards by ICCW 1957 to 2008 Page No Table Child Labour Agewise analysis of life insurance policies by sex as on 31st March 2002 Table 7.1 Statewise distribution of working children, Table 7.2 Working children by residence and sex, India, 1991 and Table 7.3 Table 7.4 Table 7.5 Table 7.6 Table 7.7 Table 7.8 Table 7.9 Statewise percentage of children (5-14 years) classified as main workers and marginal workers by sex, India, 2001 Distribution of children (age 5-14 years) categorised as marginal workers by main activity, age and sex, India 2001 Distribution of children age 5-14 years categorised as main workers by educational level, residence and sex, India 2001 Children (age 5-14 years) categorised as marginal workers and nonworkers seeking/available for work by educational level, residence and sex, India, 2001 Children (5-14 years) attending educational institutions by economic activity status, sex and residence, 2001 Trends in index of child labour in India; major sectors, and projections for 2001 Trends in index of child labour in and projection for 2001 in major states xx
21 Title Table 7.10 Number of child labour by industrial category and sex in India Page No. 305 Table 7.11 Table 7.12 Table 7.13 Age-specific usual status worker population ratio (ASWPR) by sex and residence India, , and Age specific labour force participation rates according to usual status (ps+ss) , and Work participation rate and proportion unemployed by broad agegroups, India Table 7.14 Age-specific work participation rate by sex and residence, India Table 7.15 Unemployment rates by age group, India as per various rounds of NSSO by age to Table 7.16 Age specific unemployment rates by sex for India as per various rounds of NSSO 8. Socio Economic Indicators Table 8.1 Gross National Product (GNP) and per capita income from to Table 8.2 Table 8.3 Percentage of population below the poverty line - India to Number and percentage of population below poverty line by states (Based on URP-consumption) Table 8.4 Number and percentage of population below poverty line by states (Based on MRP-consumption) GLOSSARY & ABBREVIATIONS xxi
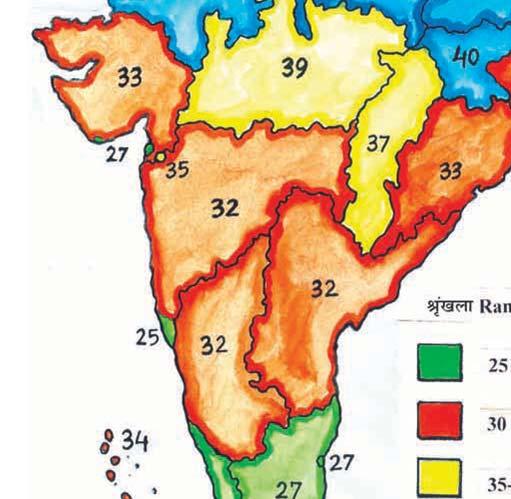
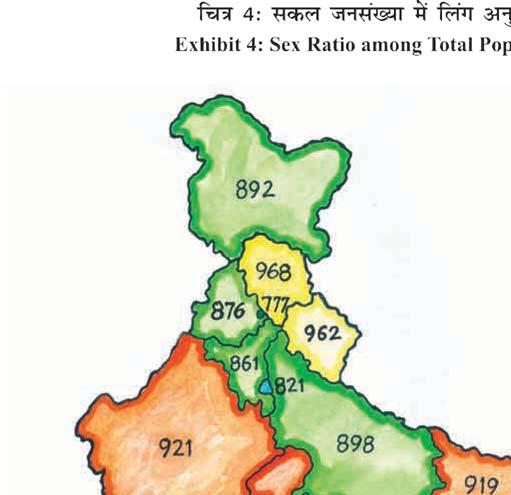
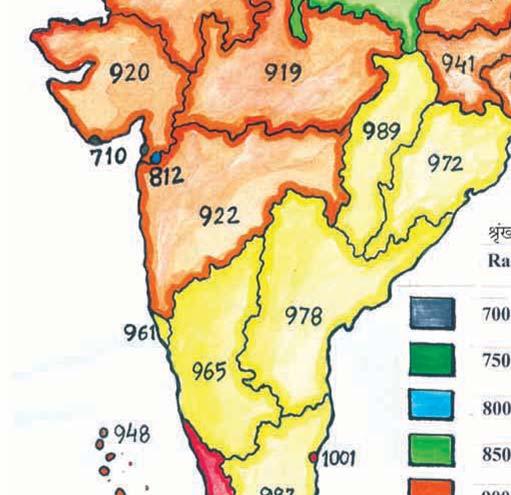
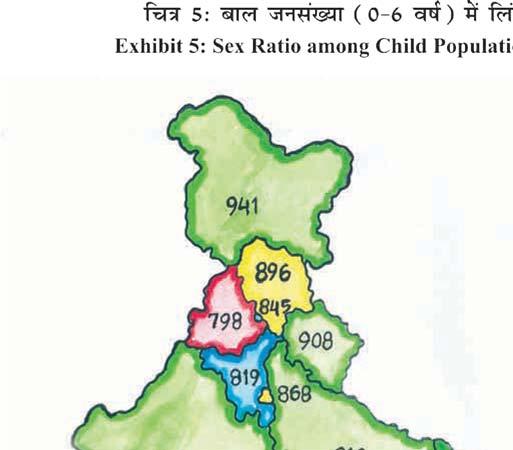
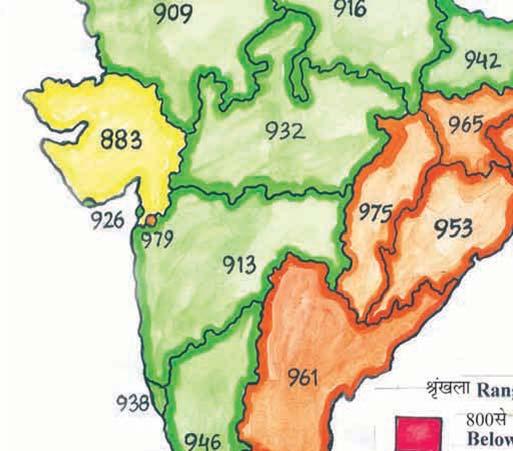
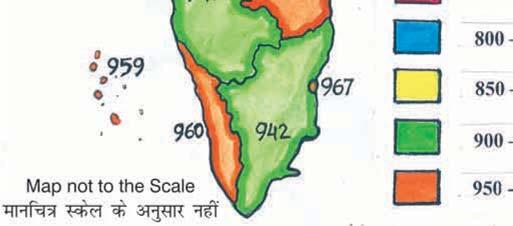
22 xxii List of Exhibits Page No. Exhibit 1 Population in India 4 Exhibit 2 Child population proportion to total population, Exhibit 3 Child population in India 32 Exhibit 4 Sex ratio among total population, Exhibit 5 Sex ratio among child population (0-6 years), Exhibit 6 Neo-natal and infant mortality rates, Exhibit 7 Perinatal mortality and still birth rates, Exhibit 8 Estimated IMR in India, Exhibit 9 Percentage of the live birth attended by untrained functionaries & others 108 Exhibit 10 Initiation of breastfeeding within one hour of birth 140 Exhibit 11 Percentage of children (12-35 months) received Vit. A dose 154 Exhibit 12 Percentage of children (6-59 months) classified as having anemia 161 Exhibit 13 Literacy rates in India, Exhibit 14 Literacy rates in India and States, Exhibit 15 Drop out rates at primary, elementary and secondary level 196
23 1 Population Statistics
24 , * , * % % * * * * 2
25 Table 1.1: Population of ten most populous selected countries as per latest census S.No. Country Reference date Population (Millions) China , India* , U.S.A. April, Indonesia Brazil Pakistan Russian Fed Bangladesh Japan Nigeria * Excluding the population of Mao Maran, Poamata and Purul sub-divisions of Senapati district of Manipur where census could not be held. Sources : 1. Census of India 2001, Series-1, India, Provisional Population Tables, Registrar General and Census Commissioner India, New Delhi, p Census of India 2001, Series-1, India, Final Population Tables, Registrar General and Census Commissioner India, New Delhi, p. 1. Table 1.2: Demographic trends in SAARC countries, S. No. Country Total Population (Millions) Urban Population ( % of total) Population under age 15 yrs. (% of total) * * * India Maldives Sri Lanka Pakistan Nepal Bhutan Bangladesh Afghanistan * Data refer to medium-variant projections. Sources : i) United Nations Development Programmes (UNDP), Human Development Report 2007/2008, pp ii) The State of the World s Children 2007, The United Nations Children s Fund (UNICEF), 2006, p
26 4
27 5
28 ,396, ,093,390 13,697, ,321, , ,977,238 27,656, ,660,580 39,683, # 361,088,090 42,427, # 439,234,771 78,146, ,159, ,924, @ 683,329, ,169, * 846,387, ,058, ** 1,028,610, ,222, * ** 6
29 Table 1.3 : Population and its growth, India : Census Year Population Decadal growth Average annual Absolute Percent exponential growth rate (percent) Sex ratio ,396, ,093,390 13,697, ,321, , ,977,238 27,656, ,660,580 39,683, # 361,088,090 42,427, # 439,234,771 78,146, ,159, ,924, @ 683,329, ,169, * 846,387, ,058, ** 1,028,610, ,222, Note: # In working out `Decadal Growth and `percentage Decadal Growth for India and the population of Tuensang district for 1951 (7,025) and the population of Tuensang (83,501) and Mon (5,774) districts for 1961 Census of Nagaland state have not been taken into account as the areas were censused for the first time in 1951 and the same are not The 1981 Census could not be held owing to disturbed conditions prevailing in Assam. Hence the population figures for 1981 of Assam have been worked out by `interpolation. * The 1991 Census could not be held owing to disturbed conditions prevailing in Jammu and Kashmir. Hence the population figures for 1991 of Jammu and Kashmir have been worked out by `interpolation. ** Excludes population of Paomata, Mao Maran and Purul sub-divisions of Senapati district of Manipur or Sources : 1. Census of India 2001, Series 1, India, Provisional Population Totals, Paper 1 of 2001, Registrar General and Census Commissioner India, New Delhi, pp. 34, Census of India 2001, Series 1, India, Final Population Totals, Registrar General and Census Commissioner India, New Delhi, p Census of India for various years, Office of Registrar General and Census Commissioner India, New Delhi. 7
30 $ @ 1. $ @
31 Table 1.4: Statewise area and population by sex (Census 2001) S. No. India/States/Union Territories Area in Sq. Kms. Population$ Males Females Persons Density of India *$ @ 1. J & K $ @ 2. Himachal Pradesh Punjab Chandigarh Uttarakhand Haryana Delhi Rajasthan Uttar Pradesh Bihar Sikkim Arunachal Pradesh Nagaland Manipur * Mizoram Tripura Meghalaya Assam West Bengal Jharkhand Orissa Chhatisgarh Madhya Pradesh Gujarat Contd... 9
32 ( $ 10
33 Table 1.4 (Contd...) Daman & Diu Dadra & Nagar Haveli Maharashtra Andhra Pradesh Karnataka Goa Lakshadweep Kerala Tamil Nadu Pondicherry Andaman & Nicobar Islands Notes : Sources : The area figures for India is 3,287,263 sq.km. which includes 78,114 sq. km. under the illegal occupation of Pakistan, 5,180 sq. km. illegally handed over by Pakistan to china and 37,555 sq.km. under the illegal occupation of China in Ladakh district. * Excluding the population of Mao Maram, Paomata and Purul sub-divisions of Senapati district of For working out density of India, the entire area and population of those portion of Jammu & Kashmir which are under illegal occupation of Pakistan and China have not been taken into account. $ India and Jammu & Kashmir exclude population of those portions of Jammu & Kashmir which are under illegal occupation of Pakistan & China. 1. Census of India 2001, Population Profiles (India, States & Union Territories), Office of the Registrar General of India, New Delhi, Census of India 2001, Series 1:India, Primary Census Abstract, Table A-5, Registrar General & Census Commissioner, India, New Delhi, pp
34 # # 12
35 Table 1.5: Statewise population by rural/urban residence (Census 2001) S.No. India/States/Union Territories Population Rural Urban Persons India* J & K# Himachal Pradesh Punjab Chandigarh Uttarakhand Haryana Delhi Rajasthan Uttar Pradesh Bihar Sikkim Arunachal Pradesh Nagaland Manipur * Mizoram Tripura Meghalaya Assam West Bengal Jharkhand Orissa Chhatisgarh Madhya Pradesh Gujarat Daman & Diu Dadra & Nagar Haveli Maharashtra Andhra Pradesh Karnataka Goa Lakshadweep Kerala Tamil Nadu Pondicherry Andaman & Nicobar Islands * Excluding the population of Mao Maram Paomata and Purul sub-divisions of Senapati district of Manipur. # The Population of J & K and India excludes the population of area under unlawful occupation of Pakistan and China Source : Census of India 2001, Final Population Totals, Registrar General and Census Commissioner, India, pp
36
37 Table 1.6: Percentage population in five years age-group by residence and sex, 2001 Agegroup Total Rural Urban Persons Males Females Persons Males Females Persons Males Females All ages Age not stated Source : Census of India 2001, C-14 Population in five-year age group, Registrar General and Census Commissioner, India, New Delhi. 15
38
39 Table 1.7: Percentage of Population in the age group 0-4 years by sex and residence, India & States/ UTs, 2001 States/UTs Total Rural Urban Persons Males Males Males Females Persons Females Persons Females India Jammu & Kashmir Himachal Pradesh Punjab Chandigarh Uttarakhand Haryana Delhi Rajasthan Uttar Pradesh Bihar Sikkim Arunachal Pradesh Nagaland Manipur Mizoram Tripura Meghalaya Assam West Bengal Jharkhand Orissa Chhattisgarh Madhya Pradesh Gujarat Daman & Diu Dadra & Nagar Haveli Maharashtra Andhra Pradesh Karnataka Goa Lakshadweep Kerala Tamil Nadu Pondicherry A & N Islands Source : Census of India 2001, C-14 Population in Five Year Age-group by Residence and sex, Registrar General and Census Commissioner, India, New Delhi. 17
40 % % * % ** % % (I) (II) I, IV 18
41 Table 1.8: Total population, child population (0-14 yrs) and proportion of child population to total population by sex and residence, India (Population in '000) Census Year Agegroup Total Rural Urban Persons Males Females Persons Males Females Persons Males Females All ages % All ages % * All ages % ** All ages % All ages % * Excludes Assam; ** Excludes Jammu & Kashmir Sources : 1. Census of India 1961, Vol. 1, Part 2-C(I), Social and Cultural Tables, Registrar General and Census Commissioner, India, New Delhi, p Census of India 1971, Series-I, C-II, Age and Marital Status, Registrar General and Census Commissioner, India, p Census of India 1981, A Hand book of Population Statistics, Issued on the occasion of the first Data Users' Conference for 1991 census, New Delhi, April 18-20, Census of India 1991, Series I, India Part IV A C Series, Social and Cultural Tables, Volume - 1, Registrar General and Census Commissioner, India, New Delhi. 5. Census of India 2001, C-14 Population in Five Year Age-group by Residence and sex, Office of the Registrar General and Census Commissioner, India, New Delhi. 19
42 % % % % % % % %
43 Table 1.9: Statewise child population (0-14 yrs) and its proportion to total population by sex and residence, India 2001 States/UTs Agegroup Total Rural Urban Persons Males Females Persons Males Females Persons Males Females India All ages % Jammu & Kashmir All ages % Himachal All ages Pradesh % Punjab All ages % Chandigarh All ages % Uttarakhand All ages % Haryana All ages % Delhi All ages % Contd... 21
44 ( ) % % % % % % % % %
45 Table 1.9 (Contd...) Rajasthan All ages % Uttar Pradesh All ages % Bihar All ages % Sikkim All ages % Arunachal All ages Pradesh % Nagaland All ages % Manipur All ages % Mizoram All ages % Tripura All ages % Contd... 23
46 ( ) % % % % % % % % % %
47 Table 1.9 (Contd...) Meghalaya All ages % Assam All ages % West Bengal All ages % Jharkhand All ages % Orissa All ages % Chhattisgarh All ages % Madhya All ages Pradesh % Gujarat All ages % Daman & Diu All ages % Dadra & Nagar All ages Haveli % Contd... 25
48 ( ) % % % % % % % % %
49 Table 1.9 (Contd...) Maharashtra All ages % Andhra Pradesh All ages % Karnataka All ages % Goa All ages % Lakshadweep All ages % Kerala All ages % Tamil Nadu All ages % Pondicherry All ages % Andaman & Nicobar Islands All ages % Source : Census of India 2001, C-14 Population in Five Year Age-group by Residence and sex, Office of the Registrar General and Census Commissioner, India, New Delhi. 27
50 # N.A
51 Table 1.10: Child population in the age group 0-6 years by sex and its proportion to total population in 1991 and 2001 S. No. India/States/Union Territories Child population in the age group 0-6 years 2001 Proportion of child population (age group 0-6 years) to total population Persons Males Females India# J & K N.A Himachal Pradesh Punjab Chandigarh Uttarakhand Haryana Delhi Rajasthan Uttar Pradesh Bihar Sikkim Arunachal Pradesh Nagaland Manipur* Mizoram Tripura Meghalaya Assam West Bengal Jharkhand Orissa Chhatisgarh Madhya Pradesh Contd... 29
52 # 30
53 Table 1.10 (Contd...) Gujarat Daman & Diu Dadra & Nagar Haveli Maharashtra Andhra Pradesh Karnataka Goa Lakshadweep Kerala Tamil Nadu Pondicherry Andaman & Nicobar Islands Note: 1. While working out the proportion of child population for 1991 census in the age group 0-6 for India, the population in the age group 0-6 of areas of Himachal Pradesh and Gujarat affected by natural calamities have been excluded. 2. The proportion of child population for 1991 census in the age group 0-6 shown against Himachal Pradesh for 1991 excludes population in the age group 0-6 of kinnaur district to make the data comparable with 2001 census. 3. The proportion of child population for 1991 census in the age group 0-6 shown against Gujarat excludes the population data of entire Kachchh district, Morvi, Maliya-Miyana and Wankaner talukas of Rajkot district, Jodiya taluk of Jamnagar district of Gujarat State to make the data comparable with 2001 census. * Provisional data # Excludes Manipur Source : Census of India, 2001 Office of the Registrar General of India,New Delhi. 31
54 32
55 33
56 ( in 000 ) * 2021* 2026* ** ** ** ** ** ** ** ** ** ** ** **
57 Table 1.11: Child population (0-14 years) in India, states (except Goa) and north-east states (excluding Assam) 1981 to 2026 ( in 000 ) India/States Year * 2021* 2026* Male Female Male Female Male Female Male Female Male Female Male Female India Jammu & Kashmir Himachal Pradesh Punjab Uttarakhand ** ** ** ** Haryana Delhi Rajasthan Uttar Pradesh Bihar Assam West Bengal Jharkhand ** ** ** ** Orissa Chhattisgarh ** ** ** ** Madhya Pradesh Gujarat Contd... 35
58 IV 36
59 Table 1.11 (Contd...) Maharashtra Andhra Pradesh Karnataka Kerala Tamil Nadu North-East States- ( Excluding Assam ) Note : Census was not held in Assam in the year 1981 and in Jammu & Kashmir in the year * Projected values ** Population Included in the States of Uttar Pradesh, Bihar and Madhya Pradesh respectively. Source : Derived from : 1. Census of India 2001, Population Projections for India and States , Report of the Technical Group on Population Projections, Office of the Registrar General, Census Commission, India, New Delhi, pp Census of India, 1981, Series - 1, India General Economic Tables (Table B-1 to B-5) Registrar General of Census Commission India, New Delhi. 3. Census of India 1991, Series - 1, India, Part-IV A -C Series, Socio-Cultural Tables, Volume-1, Registrar General & Census Commission India, New Delhi. 4. Census of India 2001, C-14 Population in Five Year Age-group by Residence and sex, Office of the Registrar General and Census Commis sioner, India, New Delhi. 37
60 N.A 892 N.A
61 Table 1.12: Sex ratio of total population and child population (0-6 years) 1991 and 2001 S. No. India/State/Union territories Sex ratio (females per 1,000 males) Total Population Child population in the age group 0-6 years India* Jammu & Kashmir N.A 892 N.A Himachal Pradesh Punjab Chandigarh Uttarakhand Haryana Delhi Rajasthan Uttar Pradesh Bihar Sikkim Arunachal Pradesh Nagaland Manipur Mizoram Tripura Meghalaya Assam West Bengal Jharkhand Orissa Chhatisgarh Madhya Pradesh Gujarat Daman & Diu Contd... 39
62 , ,036 1, ,
63 Table 1.12 (Contd...) Dadra & Nagar Haveli , Maharashtra Andhra Pradesh Karnataka Goa Lakshadweep Kerala 1,036 1, Tamil Nadu Pondicherry 979 1, Andaman & Nicobar Islands Notes : 1. While working out sex ratio of child population for 1991 Census in the age group 0-6 and population aged 7 and above for India, the population in the age group 0-6 and population aged 7 and above of areas of Gujarat and Himachal Pradesh affected by natural calamities have been excluded. The details of affected areas are given in Note number 2 and 3 below. 2. To make the data comparable with Census of India, 2001, the proportion of child population for 1991 Census in the age group 0-6 and population aged 7 and above shown against Himachal Pradesh for 1991 excludes population in the age group 0-6 and population aged 7 and above of Kinnaur district where population enumeration of Census of India, 2001, could not be conducted due to natural calamity. 3. To make the data comparable with Census of India, 2001, the proportion of child population for 1991 Census in the age group 0-6 and population aged 7 and above shown against Gujarat excludes the population data of entire Kachchh district, Morvi, Maliya-Miyana and Wankaner talukas of Rajkot district and Jodiya taluka of Jamnagar district of Gujarat state where population enumeration of Census of India, 2001, could not be conducted due to natural calamity. 4. Sex ratio for 2001 is provisional for Manipur State. * Excludes Manipur Source : Office of the Registrar General of India, Census,
64
65 Table 1.13: Mean age at effective marriage of females by residence, India and bigger states, 2007 India and bigger states Total Rural Urban below 18 yrs yrs 21+ yrs All Ages below 18 yrs yrs 21+ yrs All Ages below 18 yrs yrs 21+ yrs All Ages India Andhra Pradesh Assam Bihar Chhattisgarh Delhi Gujarat Haryana Himachal Pradesh Jammu & Kashmir Jharkhand Karnataka Kerala Madhya Pradesh Maharashtra Orissa Punjab Rajasthan Tamil Nadu Uttar Pradesh West Bengal Source : Sample Registration System, Statistical Report, 2007, Office of Registrar General, India, p
66 44
67 2 Vital Statistics
68
69 Table 2.1: Vital statistics of ten most populous selected countries, 2007 S. No. Country Life expectancy at birth (2007) Infant morta lity rate (2007) Under-five mortality rate (2007) Crude death rate (2007) Crude birth rate (2007) Total fertility rate (2007) China India U.S.A Indonesia Brazil Pakistan Russian Fed Bangladesh Japan Nigeria Source : The State of the World s Children 2009, The United Nations Children s Fund (UNICEF). 47
70
71 Table 2.2: Survival, progress and setbacks in SAARC countries, 2007 S. No. Country Life expectancy at birth (2007) Infant mortality rate (under 1) (2007) Under five mortality rate (2007) Crude death rate (2007) Crude birth rate (2007) Total fertility rate (2007) India Maldives Sri Lanka Pakistan Nepal Bhutan Bangladesh Afghanistan Source : The State of the World's Children,2009,United Nation's Children's Fund (UNICEF), New York. 49
72 # # # # $ $ * # $ i. ii. 50
73 Table 2.3: Estimated birth and death rates in India Year Birth rate Death rate Rural Urban Combined Rural Urban Combined # # # # $ $ * Note : # Excludes Jammu & Kashmir and Mizoram for 1996 excludes Nagaland also. $ Excludes Jammu & Kashmir due to part-receipt of returns * Excludes Nagaland (Rural) due to part receipt of returns Source : i. SRS Bulletin(s), Vol 44, No. 1, October 2009, Sample Registration System, Office of the Registrar General, New Delhi, India. ii. SRS Statistical Reports for different years. 51
74 * * * * * * 52
75 Table 2.4: Expectation of life at birth by sex from to Year Male Female * * * * * Note : * The data for the years marked with (*) are the projected Values Sources: i. Census of India 1991, Population Projections for India and States ii. Census of India 2001, Population Projections for India and States (Revised December 2006), Report of the Technical Group on Population Projections Constituted by the National Commission on Population, May 2006, Office of the Registrar General & Census Commissioner, India, New Delhi. 53
76 54
77 55
78
79 Table 2.5: Mortality indicators in India, Indicators Area Year Infant Mortality Rate R U C Neonatal Mortality Rate R U C Early Neonatal Mortality Rate R U C Peri- Natal Mortality Rate R U C Still Birth Rate R U C Note : Source: R - Rural, U - Urban, C - Combined For definitions see Glossary & Abbreviations. Sample Registration System, Statistical Reports, Office of the Registrar General, India, New Delhi. 57
80
81 Table 2.6: Neo-natal mortality rates and percentage share of neo-natal deaths to infant deaths by residence, India and bigger states, 2007 India and Bigger states Neo-natal mortality rate Percentage of Neo-natal death to infant deaths Total Rural Urban Total Rural Urban India Andhra Pradesh Assam Bihar Chhattisgarh Delhi Gujarat Haryana Himachal Pradesh Jammu & Kashmir Jharkhand Karnataka Kerala Madhya Pradesh Maharashtra Orissa Punjab Rajasthan Tamil Nadu Uttar Pradesh West Bengal Source : Sample Registration System, Statistical Report, 2007, Office of the Registrar General, India, New Delhi, p
82
83 Table 2.7: Peri-natal mortality rates and still birth rates by residence, India and bigger states, 2007 India and bigger states Peri-natal mortality rate Still birth rate Total Rural Urban Total Rural Urban India Andhra Pradesh Assam Bihar Chhattisgarh Delhi Gujarat Haryana Himachal Pradesh Jammu & Kashmir Jharkhand Karnataka Kerala Madhya Pradesh Maharashtra Orissa Punjab Rajasthan Tamil Nadu Uttar Pradesh West Bengal Source : Sample Registration System, Statistical Report 2007, Office of the Registrar General, India, New Delhi, p
84 a a a a a $ $ 62
85 Table 2.8: Infant Mortality Rates in India 1951 to 2008 Period IMR a a a a a $ Note : a: Excludes Jammu & Kashmir and Mizoram $: Excludes Nagaland (Rural) due to part receipt of returns. Sources : (i) Selected Socio Economics Statistics, India 1999, 2001 CSO, Ministry of Statistics and Programme Implementation, New Delhi. (ii) Sample Registration Bulletins, Office of the Registrar General of India. New Delhi. 63
86
87 Table 2.9: Estimated infant mortality rates by sex and residence in India and states, 2008 S. India/States/UTs Total Rural Urban No. Total Male Female Total Male Female Total Male Female India Bigger States 1. Andhra Pradesh Assam Bihar Chhattisgarh Delhi Gujarat Haryana Jammu & Kashmir Jharkhand Karnataka Kerala Madhya Pradesh Maharashtra Orissa Punjab Rajasthan Tamil Nadu Uttar Pradesh West Bengal Smaller States 20. Arunachal Pradesh Goa Himachal Pradesh Manipur Meghalaya Mizoram Nagaland Sikkim Tripura Uttarakhand Union Territories 30. Andaman & Nicobar Islands 31. Chandigarh Dadra & Nagar Haveli Daman & Diu Lakshadweep Puducherry Note : Infant Mortality rates for Smaller States and Union Territories are based on three years period On Account of wide year to year fluctuations due to inadequate sample size, the infant mortaility rate by sex, separately for rural & urban areas is not given. Source : SRS Bulletin, Volume 43, No. 1, October, 2008, Sample Registration System, Vital Statistics Division, Office of the Registrar General of India, New Delhi. p.5 65
88 66
89
90 Table 2.10: Estimated infant mortality rates in India and bigger states, S. No. India/States/Uts Year India Bigger States 1. Andhra Pradesh Assam Bihar Chhattisgarh Delhi Gujarat Haryana Jammu & Kashmir Jharkhand Karnataka Kerala Madhya Pradesh Maharashtra Orissa Punjab Rajasthan Tamil Nadu Uttar Pradesh West Bengal Himachal Pradesh Note: Newly Established States for previous year data is already included in the parent states Sources: 1. Sample Registration Bulletin, Volume 32, No. 1, January, 1998, Vital Statistics Division, Office of the Registrar General of India, New Delhi. 2. Sample Registration Bulletin, Volume 36, No. 2, October, 2002, Vital Statistics Division, Office of the Registrar General of India, New Delhi. 3. Sample Registration System, Annual Reports, 1996, 1997, 1999, 2000, 2001, 2003, 2004, 2005, 2006 Vital Statistics Division, Office of the Registrar General of India, New Delhi. 4. SRS Bulletin, Volume 43, No. 1, October, 2008, Sample Registration System, Vital Statistics Division, Office of the Registrar General of India, New Delhi. p SRS Bulletin, Volume 44, No. 1, 2009, Sample Registration System, Vital Statistics Division, Office of Registrar General of India, New Delhi. 68
91
92 Table 2.11: Estimated death rates for children aged 0-4 yrs by sex and residence India and bigger states, 2007 India/States Total Rural Urban Total Male Female Total Male Female Total Male Female India Andhra Pradesh Assam Bihar Chhattisgarh Delhi Gujarat Haryana Himachal Pradesh Jammu & Kashmir Jharkhand Karnataka Kerala Madhya Pradesh Maharashtra Orissa Punjab Rajasthan Tamil Nadu Uttar Pradesh West Bengal Source : Sample Registration System, Statistical Report, 2007, Office of the Registrar General, India, New Delhi, p
93
94 Table 2.12: Age-specific death rates by sex and residence in India, 2007 Age group(years) Total Rural Urban Total Male Female Total Male Female Total Male Female Below All ages (Crude Death Rate ) Source : Sample Registration System, Statistical Report, 2007, Office of Registrar General, India, New Delhi, p
95
96 Table 2.13: Percent distribution of deaths by broad age groups, India and bigger states, 2007 S. No. India and bigger states Broad age-groups (years) Below India Andhra Pradesh Assam Bihar Chhattisgarh Delhi Gujarat Haryana Himachal Pradesh Jammu & Kashmir Jharkhand Karnataka Kerala Madhya Pradesh Maharashtra Orissa Punjab Rajasthan Tamil Nadu Uttar Pradesh West Bengal Note : Total may not add upto 100 due to rounding. Source : Sample Registration System, Statistical Report, 2007, Office of the Registrar General, India, New Delhi, p
97
98 Table 2.14: Percentage of infant deaths to total deaths by residence in India and bigger states, 2007 Sl. No. India and bigger states Total Rural Urban India Andhra Pradesh Assam Bihar Chhat tisgarh Delhi Gujarat Haryana Himachal Pradesh Jammu & Kashmir Jharkhand Karnataka Kerala Madhya Pradesh Maharashtra Orissa Punjab Rajasthan Tamil Nadu Uttar Pradesh West Bengal Source : Sample Registration System, Statistical Report, 2007, Office of the Registrar General, India, New Delhi, p
99
100 Table 2.15: Percentage of deaths in the age group 0-4 years to total deaths by residence in India and bigger States, 2007 Sl. No. India and bigger states Total Rural Urban India Andhra Pradesh Assam Bihar Chhattisgarh Delhi Gujarat Haryana Himachal Pradesh Jammu & Kashmir Jharkhand Karnataka Kerala Madhya Pradesh Maharashtra Orissa Punjab Rajasthan Tamil Nadu Uttar Pradesh West Bengal Source : Sample Registration System, Statistical Report, 2007, Office of the Registrar General, India, New Delhi, p
101
102 Table 2.16: Death rates for children aged 5-14 years by sex and residence in India and bigger states, 2007 S. No. India and bigger states Total Rural Urban Total Male Female Total Male Female Total Male Female India Andhra Pradesh Assam Bihar Chhattisgarh Delhi Gujarat Haryana Himachal Pradesh Jammu & Kashmir Jharkhand Karnataka Kerala Madhya Pradesh Maharashtra Orissa Punjab Rajasthan Tamil Nadu Uttar Pradesh West Bengal Source : Sample Registration System, Statistical Report, 2007, Office of the Registrar General, India, New Delhi, p
103 < I II III IV V VI VII VIII IX X XI XII XIII XIV XV XVI XVII XVIII XIX
104 Table 2.17: Percentage distribution of medically certified deaths over age groups by sex and major cause groups (based on tenth revision of ICD) during 2002 Major Group No. Cause of Death Sex Age Groups All Age Group < I Certain Infections and Parasitic Diseases (A00-B99) M F II Neoplasms (C00-D48) M F III Diseases of the Blood and Blood forming organs and certain M disorders involving immune mechanism (D50-D89) F IV Endocrine, Nutritional and Metabolic Diseases (E00-E89) M F V Mental and Behavioural disorders(f01-f99) M F VI Diseases of the Nervours System (G00-G98) M F VII Diseases of the eye and adnexa (H00-H59) M F VIII Diseases of the ear and mastoid process (H60-H95) M F IX Diseases of the circulatory system(i00-i99) M F X Diseases of the respiratory system (J00-J98) M F XI Diseases of the digestive system (K00-K92) M F XII Diseases of the skin and subcutaneous tissue (L00-L98) M F XIII Diseases of the Musculoskeletal system and connective M tissue (M00-M99) F XIV Diseases of the genitourinary system (N00-N99) M F XV Pregnancy, Childbirth and the puerperium (O00-O99) F XVI Certain conditions originating in the perinatal period (P00- M P96) F XVII Congenital malformations, deformations and chromosomal M abnormalities (Q00-Q99) F XVIII Symptoms, Signs and abnormal clinical and laboratory M findings not elsewhere classified (R00-R99) F XIX Injury, poisioning and certain other consequences of M external causes (S00-T98) F All Causes M F T Note : Percentages are to the total deaths of the sex due to that cause. Source : Medical Certification of Cause of Death, 2002, Office of the Registrar General, India, Ministry of Home Affairs, New Delhi, p
105 < I II III IV V VI VII VIII IX X XI XII XIII XIV XV XVI XVII XVIII XIX
106 Table 2.18: Percentage distribution of medically certified deaths by age and sex over major cause groups (based upon tenth revision of ICD) during 2002 Major Cause of Death Sex Age Groups (years) Group No. < I Certain Infections and Parasitic Diseases(A00-B99) M F II Neoplasms(C00-D48) M F III Diseases of the Blood and Blood forming organs and M certain disorders involving immune mechanism(d50-d89) F IV Endocrine, Nutritional and Metabolic Diseases (E00-E89) M F V Mental and Behavioural disorders (F01-F99) M F VI Diseases of the Nervours System (G00-G98) M F VII Diseases of the eye and adnexa (H00-H59) M F VIII Diseases of the ear and mastoid process (H60-H95) M F IX Diseases of the circulatory system (I00-I99) M F X Diseases of the respiratory system (J00-J98) M F XI Diseases of the digestive system (K00-K92) M F XII Diseases of the skin and subcutaneous tissue (L00-L98) M F XIII Diseases of the Musculoskeletal system and connective M tissue (M00-M99) F XIV Diseases of the genitourinary system (N00-N99) M F XV Pregnancy, Childbirth and the puerperium (O00-O99) F XVI Certain conditions originating in the perinatal period M (P00-P96) F XVII Congenital malformations, deformations and chromosomal M abnormalities (Q00-Q99) F XVIII Symptoms, Signs and abnormal clinical and laboratory M findings not elsewhere classified (R00-R99) F XIX Source : Injury, poisioning and certain other consequences of M external causes(s00-t98) F All Causes M F Medical Certification of Cause of Death, 2002, Office of the Registrar General, India, Ministry of Home Affairs, New Delhi, p
107 3 Health and Family Welfare
108 % % % % %
109 Table 3.1: Indicators of maternal and child health S. No. Indicators Area Current level Reference period Infant mortality rate Rural Urban Total Neo-natal mortality rate Perinatal mortality rate Crude death rate Pre-school child (0-4) years mortality Maternal mortality ratio Life expectancy at birth (years) Male Female Babies with birth weight below 2500 gm (%) Crude birth rate Pregnant mother receiving ante-natal care (%who had 3 or more ANC visits) 11. Birth Assisted by Doctor/nurse/LHV/ANM/Other health personnel (skilled providers)(%) Immunisation Status a) T.T for pregnant women (received 2 or more TT injections) b) DPT (% of children months) DPT DPT DPT c) Polio (% of children months) Polio Polio Polio Polio d) B.C.G (% of children months) e) Measles (% of children months) Sources : 1. Sample Registration Bulletin, Vol. 43 & 44, No. 1, October, 2008 & 2009, Office of the Registrar General of India, New Delhi. 2. Sample Registration System, Statistical Report, 2007, Office of Registrar General, India. 3. National Family Health Survey (NFHS-3), , International Institute for Population Sciences, Mumbai. 87
110 %, % **
111 Table 3.2 Commitment to health : access, services and resources in SAARC countries in latest years Name of the Country with HDI rank % of population using improved drinking water sources 2006 % of population using improved sanitation facilities 2006 One year old children immunised Against tuberculosis (%) 2007 Against measles (%) 2007 % under fives with diarrhoea receiving oral rehydration & Continued feeding * Contraceptive Prevalence ** (%) * Skilled attendant at delivery (%) * Physicians (per 100,000 people) ( )* Public (% of GDP) 2004 Health expenditure Private (% of GDP) 2004 Per Capita (PPP- US$) 2004 Maldives Sri Lanka India Pakistan Nepal Bhutan y Bangladesh Afghanistan Notes : ** Data refer to Women ages who are married or in union: the actual age range covered may vary across countries. * Data refer to the most recent year available during the period specified in the column heading. Other UN member state. - Data not available. y Data refers to years or periods other than those specified in the column heading, differ from the standard defination or refer to only part of a country. Such data are included in the calculation of regional or global. Source : 1. United Nations Development Programmes (UNDP), Human Development Report 2007/08, pp ( Cl-1,9,10,11,12). 2. The State of the World's Children 2009, United Nations Children's Fund (UNICEF) New York, p (C 1-6), p (C 1-8) 89
112 * # (<0.2) $ 37$ 23y 14y 22 <0.1(<0.2) ( ) x 0.1( ) ( ) x 40x 15x <0.1(<0.2) <0.1(<0.2) y 54y # $ x y 90
113 Table 3.3: Leading global health crises and challenges in SAARC countries Countries % of under-fives ( ) Suffering from Under weight (WHO ref.pop.) moderate & severe %of under fives ( ) suffering from Stunting (NCHS/ WHO) moderate & severe %of Infants with low birth-weight ( ) HIV Prevalence* (% aged 15-49) 2005 % under -fives with fever receiving anti malaria drugs Malaria ( ) Tubersculosis Cases Prevalence# per 100,000 people 2005 Prevalence of Smoking (% of Adults) ** Women Men Maldives (<0.2) $ 37$ Sri Lanka 23y 14y 22 <0.1 (<0.2) India ( ) Pakistan x 0.1 ( ) Nepal ( ) Bhutan 14x 40x 15x <0.1 (<0.2) Bangladesh <0.1 (<0.2) Afghanistan 33y 54y Data not available. * Data refer to point and range estimates based on new estimation models developed by UNAIDS. Range estimates are presented in brackets. ** The age range varies across countries but in most is 18 and older or 15 and older. # Data refers to all forms of tuberculosis. $ Data refers to a period other than that specified. Data refer to the most recent year available during the period specified in the column heading. x Data refer to years or periods other than those specified in the column headings, differ from the standard definition or refer to only part of country. Such data are not included in the calculation of regional and global averages. y Data refer to years or periods other than those specified in the column headings, differ from the standard definition or refer to only part of country. Such data are included in the calculation of regional and global averages. Sources : 1. The State of the World s Children 2009, United Nations Children s Fund, New York, column 2,3,4 (pp ), column 6 (pp ). 2. United Nations Development Programme, Human Development Report 2007/2008, column 5,7,8,9 (pp ). 91
114
115 Table 3.4: Yearwise vaccination performance for years (Figures in million) Year (T.T. for Expectant Mothers) Tetanus Immunisation Target Achievement Percentage Achievement DPT for children Target Achievement Percentage Achievement Contd... Table 3.4 (Contd...) Year D.T. Polio Target Achievement Percentage Achievement Target Achievement Percentage Achievement Contd... 93
116
117 Table 3.4 (Contd...) Year BCG Measles Target Achievement Percentage Achievement Target Achievement Percentage Achievement (Contd...) Table 3.4 (Contd...) Year T.T. (10 Years) T.T. (16 Years) Target Achievement Percentage Achievement Target Achievement Percentage Achievement Source : Family Welfare Programme in India - Year Book 2001, Ministry of Health and Family Welfare. Govt. of India, New Delhi. 95
118 (%) * VII 96
119 Table 3.5: Universal immunization programme estimated targets and reported coverage in percent to Year Target (in Lakhs) Coverage levels (%) Infants P.Women DPT OPV BCG MSL TT(PW) * Source : Report on the Working Group on Health of Women and Children for the Eleventh Five-Year Plan ( ), Govt of India, Planning Commission, New Delhi, Annexure-VII, p-98. ( 97
120
121 Table 3.6: Percentage of children age months who received specific vaccines by state, India Sl. State BCG DPT Polio¹ Measles All basic No No vacci- vacci- India North 1. Delhi Haryana Himachal Pradesh 4. Jammu & Kashmir 5. Punjab Rajasthan Uttarakhand Central 8. Chhattisgarh Madhya Pradesh 10. Uttar Pradesh East 11. Bihar Jharkhand Orissa West Bengal North East 15. Arunanchal Pradesh 16. Assam Manipur Meghalaya Mizoram Nagaland Sikkim Tripura West 23. Goa Gujarat Maharashtra South 26. Andhra Pradesh 27. Karnataka Kerala Tamil Nadu ¹ Polio 0 is the polio vaccination given at birth ² BCG, measles, and three doses each of DPT and polio vaccine (excluding polio vaccine given at birth ). Source : National Family Health Survey (NFHS -3), Vol. -I, , International Institute of Population Sciences, Mumbai, p
122
123 Table 3.7: Immunisation of children against specified diseases to Year Number of children immunised (in million) DPT DT Polio BCG P Note : P - Provisional DPT - Diphtheria, Pertussis (whooping cough) and Tetanus Source : DT - Diphtheria and Tetanus BCG - Bacillus Calemette Geurin Selected Socio-Economic Statistics,2006, C.S.O., Ministry of Statistics and Programme Implementation, Govt. of India, New Delhi, p
124 (%) % ¹ 102 (%) % ¹ % % ² (58.5) (35.3) (83.0) (28.3) (88.0) (12.0) * * (68.9) (27.3) (88.8) (33.2) * * (61.5) (51.8) (76.5) (13.5) (45.8) (17.1) * I
125 Table 3.8: Percentage of children below 3 years who were ill with acute respiratory infection(ari) and diarrhoea by states, India, S. No. States Acute Respiratory infection in the last two weeks taken to health facility (%) % of children under 5 with symptoms of ARI ¹ children under 5 with symptoms of ARI % for whom treatment was sought from a health facility or provider ² % who received antibiotics Children under 5 who had diarrhoea in last two weeks % of children with diarrhoea taken to health care provider ¹ Any ORT or increased fluids No Treatment India Andhra Pradesh 2.0 (58.5) (35.3) Arunachal Pradesh Assam Bihar Chhattisgarh Delhi Goa 3.6 (83.0) (28.3) Gujarat Haryana 2.7 (88.0) (12.0) Himachal Pradesh 1.3 * * Jammu & Kashmir Jharkhand Karnataka 1.7 (68.9) (27.3) Kerala 2.7 (88.8) (33.2) Madhya Pradesh Maharashtra Manipur Meghalaya 1.9 * * Mizoram 4.1 (61.5) (51.8) Nagaland Orissa 2.8 (76.5) (13.5) Punjab Rajasthan Sikkim 5.0 (45.8) (17.1) Tamil Nadu Tripura Uttar Pradesh Uttarakhand West Bengal Note : ORT includes solution prepared from an oral rehydration salt (ORS) packet and gruel. * Percentage not shown, based on fewer than 25 unweighted cases. ¹ Symptoms of ARI (cough accompanied by short, rapid breathing which was chest realated) are considered a proxy for pneumonia. ² Excludes pharmacy, shop, and traditional practitioner. ( ) Based on unweighted cases. Source : National Family Health Survey (NFHS-3) Volume I, International Institute of Population Sciences, pp. 236,
126 * * * 1992@ * * * 1993@ * * * 1994@ * * * 1995@ @ * * * * * * * * * * * * 104
127 Table 3.9: Yearwise distribution of births by residence and type of medical attention received (percentage) Year Rural Urban Total I T U O I T U O I T U O * * * 1992@ * * * 1993@ * * * 1994@ * * * 1995@ @ * * * * * * * * * * * * Note: I Institutions like hospitals, maternity/nursing homes,health centres etc. T Delivery conducted in the home by doctor, trained dai, trained midwife, trained nurse,etc. U Delivery conducted in the home by untrained village dai or other untrained professtional functionary O Delivery conducted in the home by relation and others excluding the above * Included in category excludes Jammu and Kashmir Source: Sample Registration System, Annual Report for different years, Office of Registrar General, India, New Delhi. 105
128
129 Table 3.10: Percent distribution of live births by type of medical attention received by the mother at delivery by residence, India and bigger states, 2007 India and bigger states Govt Hospital Private Hospital Qualified professional Untrained functionary & others Total Rural Urban Total Rural Urban Total Rural Urban Total Rural Urban India Andhra Pradesh Assam Bihar Chhattisgarh Delhi Gujarat Haryana Himachal Pradesh Jammu & Kashmir Jharkhand Karnataka Kerala Madhya Pradesh Maharashtra Orissa Punjab Rajasthan Tamil Nadu Uttar Pradesh West Bengal Source : Sample Registration System, Statistical Report, 2007, Office of Registrar General, India, p
130 108
131 @ * * * 1992@ * * * 1993@ * * * 1994@ * * * 1995@ @ * * * * * * * * * * * * 109
132 Table 3.11: Yearwise distribution of deaths by residence and type of medical attention received (%) Year Rural Urban Combined I M U N I M U N I M U N @ * * * 1992@ * * * 1993@ * * * 1994@ * * * 1995@ @ * * * * * * * * * * * * Note : I Death occurred in a hospitals, dispensary, health centre, other medical institution etc. M Death occurred at home but was attended by a qualified practitioner Source: U Death occurred at home and was attended by an unqualified practitioner N No professional doctor/hakim/vaidya attended * Included in category Excludes Jammu & Kashmir 1. Selected Socio-Economic Statistics, CSO, Ministry of Statistics & Programme Implementation, New Delhi, India 1999, p Sample Registration System, Statistical Report 2003,2004,2005,2006, 2007, Office of RGI, New Delhi. 110
133
134 Table 3.12: State/UT wise cumulative AIDS cases in India till December 2007 S. No. State/UT AIDS Cases 1. Andhra Pradesh Assam Arunachal Pradesh A &N Islands Bihar Chhattisgarh Chandigarh (UT) Delhi Daman & Diu Dadra & Nagar Haveli Goa Gujarat Haryana Himachal Pradesh Jharkhand Jammu & Kashmir Karnataka Kerala Lakshadweep Madhya Pradesh Maharashtra Orissa Nagaland Manipur Mizoram Meghalaya Puducherry Punjab Rajasthan Sikkim Tamil Nadu Tripura Uttarakhand Uttar Pradesh West Bengal Ahmedabad Mun. Corp Chennai M.C Mumbai M.C Total Sources: 1. National AIDS Control Organisation 2. National Health Profile 2007,Central Bureau of Health Intelligence, Ministry of Health and Family Welfare, New Delhi, pp
135 Total Table 3.13: AIDS cases among different age-groups in India (reported to NACO) as on 31 December, 2005 Age Group Male Female Total yrs yrs yrs yrs Total Source: Health Information of India 2005, Min. of Health & Family Welfare, GOI, New Delhi, p
136 ,233 9, I 114
137 Table 3.14: Place of delivery and reason for not delivering in a health facility Place of delivery /reason for not delivering in health facility Urban Rural Total Youngest child delivered in a health facility Yes No Total Number of Men 4,233 9, Main reason for not delivering in a health facility Cost too much Facility not open Too far /no transportation Don't trust facility/poor quality service No female provider at facility Not the first child Child's mother did not think it was necessary Father of child /family did not think it was necessary /did not allow Other Don't know Missing Total Number of Men Source : National Family Health Survey (NFHS-3), , Vol-I, International Institute of Population Sciences, Mumbai, p
138 = = = = I 116
139 Table 3.15: Percent distribution of women who had alive birth in the five years preceding the survey by antenatal care (ANC) provider during pregnancy for the most recent live birth, according to state, India, S. No. State Doctor ANM/ nurse/ midwife/ LHV Other health personnel Dai/ TBA Anganwadi/ ICDS worker Other No one Missing India North 1. Delhi Haryana Himachal Pradesh 4. Jammu & Kashmir 5. Punjab Rajasthan Uttarakhand Central 8. Chhattisgarh Madhya Pradesh 10. Uttar Pradesh East 11. Bihar Jharkhand Orissa West Bengal North East 15. Arunanchal Pradesh 16. Assam Manipur Meghalaya Mizoram Nagaland Sikkim Tripura West 23. Goa Gujarat Maharashtra South 26. Andhra Pradesh 27. Karnataka Kerala Tamil Nadu Note : If more than one source of ANC was mentioned, only the provider with the highest qualification is considered. ANM = Auxillary nurse midwife; LHV = Lady health visitor; TBA = Traditional birth attendant; ICDS =Integrated Child Development Services. Source : National Family Health Survey (NFHS -3), , Vol. I, International Institute of Population Sciences, Mumbai, p. 195 Total 117
140 = = I
141 Table 3.16: Antenatal care indicators by state, India S. No State Percentage who had atleast one ANC visit Percentage who had three or more ANC visits Per-centage with an ANC visit in the first trimester of pregnency Per-centage who received information about specific pregnency complications 1 Per-centage who received two or more TT injections during the pregnency Percentage who received one TT injection during the pregnency and at least one more in three years prior to the pregnency Percentage given or brought IFA Percentagcentage Per- who took who took an IFA for at intestinal least 90 parasite days drug India North 1. Delhi Haryana Himachal Pradesh 4. Jammu & Kashmir 5. Punjab Rajasthan Uttarakhand Central 8. Chhattisgarh Madhya Pradesh Uttar Pradesh East 11. Bihar Jharkhand Orissa West Bengal North East 15. Arunanchal Pradesh 16. Assam Manipur Meghalaya Mizoram Nagaland Sikkim Tripura West 23. Goa Gujarat Maharashtra South 26. Andhra Pradesh 27. Karnataka Kerala Tamil Nadu TT= Tetanus toxoid ; IFA = Iron and folic acid tablets or syrup ¹ Vaginal bleeding, convulsions, prolonged labour, or where to go if she had pregnency complications. Source : National Family Health Survey (NFHS-3), , Vol. I, International Institute of Population Sciences, Mumbai, p
142 $ * $ * 120
143 Table 3.17: Maternal mortality ratio in SAARC countries ( ) S. No. Countries Maternal mortality ratio (per 100,000 live births) Reported$ Adjusted* Maldives Sri Lanka India Pakistan Nepal Bhutan Bangladesh Afghanistan - - $ Data reported by National authorities. * Data adjusted based on reviews by UNICEF, WHO and UNFPA to account for well documented problems of underreporting and misclassifications. Data refer to the most recent year available during the period specified. - Data not available. Source : United Nations Development Programme, Human Development Report 2007 & 2008, pp
144 I 122
145 Table 3.18: Percentage of women age who have begun childbearing by age and residence State Age (in years) Residence Urban Rural Andhra Pradesh Arunachal Pradesh Assam Bihar Chhattisgarh Delhi Goa Gujarat Haryana Himachal Pradesh Jammu & Kashmir Jharkhand Karnataka Kerala Madhya Pradesh Maharashtra Manipur Meghalaya Mizoram Nagaland Orrisa Punjab Rajasthan Sikkim Tamil Nadu Tripura Uttar Pradesh Uttarakhand West Bengal Source : National Family Health Survey (NFHS-3) , State Reports, International Institute for Population Sciences, Mumbai. 123
146 4 Nutrition
147 % * b a b * a b 126
148 Table 4.1: Percentage of children (below 5 years) under weight for age in SAARC countries ( ) S. No. Countries Under weight children under age five (% (WHO ref.pop)moderate & severe ( )* 1. Maldives - 2. Sri Lanka 23y 3. India Pakistan Nepal Bhutan 14x 7. Bangladesh Afghanistan 33y Notes : * Data refers to the most recent year available during the period specified in the column heading. x Data refers to years or periods other than those specified in the column heading, differ from the standard definition or refer to only part of a country. Such data are not included in the calculation of regional or global averages. y Data refers to years or periods other than those specified in the column heading, differ from the standard defination or refer to only part of a country. Such data are included in the calculation of regional or global averages. - Data not available. Source : The State of the World's Children 2009, United Nations Children's Fund, New York, 2008, pp
149
150 Table 4.2: Daily average intake of energy and proteins against recommended intake by age/sex/physical activity of rural population Age (years) Sex Activity Energy (Kcal/day) Proteins (g/day) Average intake RDI Average intake Boy & girl Boy & girl Boy & girl Boy Girl Boy Girl Boy Girl Male Sedentary Moderate 18 Female (NPNL) Sedentary Moderate NPNL : Non-pregnant Non-lactating. RDI : Recommended Deitary Intakes Source : Women and Men in India 2007, Central Statistical Organisation, Ministry of Statistics and Programme Implementation, Govt. of India, New Delhi, p RDI
151
152 Table 4.3: Mean intake of food stuffs (g/day) by age group and sex, Age (years) Sex Cereals & millets Pulses & legumes Leafy vegetables Other vegetables Roots & tubers Nuts & oilseeds Condiments & spices Fruits Fish Other flesh foods Milk & milk products Fats & oils Sugar & jaggery 1-3 Boys Girls Pooled Boys Girls Pooled Boys Girls Pooled Boys Girls Boys Girls Boys Girls Source : NNMB - Report of Second Repeat Survey - Rural, p. 33 National Institute of Nutrition, ICMR, Hyderabad
153 % % ¹ % % ¹ % % ¹
154 Table 4.4: Statewise percentage distribution of children under 5 years classified as malnourished according to three anthropometric indices of nutritional status: stunting, wasting, underweight S. States Height- for- age Weight- for- Height Weight-for- age No. below -3SD below -2SD¹ below -3SD below -2SD¹ below -3SD below -2SD¹ India Andhra Pradesh Arunachal Pradesh Assam Bihar Chhattisgarh Delhi Goa Gujarat Haryana Himachal Pradesh Jammu & Kashmir Jharkhand Karnataka Kerala Madhya Pradesh Maharashtra Manipur Meghalaya Mizoram Nagaland Orissa Punjab Rajasthan Sikkim Tamil Nadu Tripura Uttar Pradesh Uttarakhand West Bengal Note : Table is based on children who stayed in the household the night before the interview. Each of the indices is expressed in standard deviation units (SD) from the median of the 2006 WHO International Reference Population. Table is based on children with valid dates of birth (month and year) and valid measurements of both height and weight. ¹ Includes children who are below -3 standard deviations (SD) from the International Reference Population median. Source : National Family Health Survey (NFHS-3) , International Institute of Population Sciences, Mumbai, p
155
156 Table 4.5: Percentage of children under age 5 years classified as Malnourished according to weight for age by Residence (Rural/Urban) S. No. States Total Weight for age (-3 SD) Weight for age (-2 SD) Rural Urban Total Rural Urban 1 Andhra Pradesh Arunachal Pradesh Assam Bihar Chhattisgarh Delhi Goa Gujarat Haryana Himachal Pradesh Jammu & Kashmir Jharkhand Karnataka Kerala Madhya Pradesh Maharashtra Manipur Meghalaya Mizoram Nagaland Orissa Punjab Rajasthan Sikkim Tamil Nadu Tripura Uttar Pradesh Uttarakhand West Bengal India Source : National Family Health Survey (NFHS-3) State Reports, International Institute of Population Sciences, Mumbai. 135
157 -3SD -2SD 1-3SD -2SD
158 Table 4.6: Statewise percentage distribution of children under 5 years classified as malnourished according to weight for age by sex, S. No. States Male Female % below -3 SD % below % below -2 SD 1-3 SD % below -2 SD 1 1 Andhra Pradesh Arunachal Pradesh Assam Bihar Chhattisgarh Delhi Goa Gujarat Haryana Himachal Pradesh Jammu & Kashmir Jharkhand Karnataka Kerala Madhya Pradesh Maharashtra Manipur Meghalaya Mizoram Nagaland Orissa Punjab Rajasthan Sikkim Tamil Nadu Tripura Uttar Pradesh Uttarakhand West Bengal Note : Table is based on children who stayed in the household the night before the interview. Each of the indices is expressed in standard deviation units (SD) from the median of the 2006 WHO International Reference Population. Table is based on children with valid dates of birth (month and year) and valid measurements of both height and weight. 1 Includes children who are below -3 standard deviations (SD) from the International Reference Population median. Source : National Family Health Survey (NFHS-3), India, State Reports, International Institute of Population Sciences, Mumbai. 137
159
160 Table 4.7: Percentage of children under age 3 years classified as malnourished according to weight for age by NFHS-2 & NFHS-3 S. No. States NFHS-2 NFHS-3 Target for 2012 (-3 SD) (-2 SD) (-3 SD) (-2 SD) (-3 SD) (-2 SD) 1 Andhra Pradesh Arunachal Pradesh Assam Bihar Chhattisgarh Delhi Goa Gujarat Haryana Himachal Pradesh Jammu & Kashmir Jharkhand Karnataka Kerala Madhya Pradesh Maharashtra Manipur Meghalaya Mizoram Nagaland Orissa Punjab Rajasthan Sikkim Tamil Nadu Tripura Uttar Pradesh Uttarakhand West Bengal India Source : National Family Health Survey (NFHS-3) State Reports, International Institute of Population Sciences, Mumbai. 139
161 140
162 % % ¹ ² ³ I 141
163 Table 4.8: Initial breastfeeding by state, India S. No. State % ever breastfed Within half an hour of birth 142 Among last born children born in the last 5 yrs who were ever breastfed % who started breastfeeding Percentage who received a prelacteal feed³ Within one hour of birth¹ Within one day of birth² India North 1. Delhi Haryana Himachal Pradesh Jammu & Kashmir Punjab Rajasthan Uttarakhand Central 8. Chhattisgarh Madhya Pradesh Uttar Pradesh East 11. Bihar Jharkhand Orissa West Bengal North East 15. Arunanchal Pradesh Assam Manipur Meghalaya Mizoram Nagaland Sikkim Tripura West 23. Goa Gujarat Maharashtra South 26. Andhra Pradesh Karnataka Kerala Tamil Nadu Note : Table is based on births in the last five years whether the children are living or dead at the time of interview. ¹ Includes children who started breastfeeding within half an hour of birth. ² Includes children who started breastfeeding within half an hour and one hour of birth ³ Children given something other than breastmilk during the first three days of life. Source : National Family Health Survey (NFHS-3), , Vol-I, International Institute of Population Sciences, Mumbai, p.278.
164 % % ¹ ² ³ ¹ ² ³ I 143
165 Table 4.9: Initiation of breastfeeding and prelacteal feeding for last-born children by residence With in one day of State Urban Rural Percentage who started breastfeeding Percentage Within half an With in one hour Percentage who started breastfeeding Percentage who received a who received a prelacteal feed 3 Within half an With in one hour With in one day of prelacteal feed 3 hour of birth of birth 1 birth 2 hour of birth of birth 1 birth 2 Andhra Pradesh Arunachal Pradesh Assam Bihar Chhattisgarh Delhi Goa Gujarat Haryana Himachal Pradesh Jammu & Kashmir Jharkhand Karnataka Kerala Madhya Pradesh Maharashtra Manipur Meghalaya Mizoram Nagaland Orrisa Punjab Rajasthan Sikkim Tamil Nadu Tripura Uttar Pradesh Uttaranchal West Bengal Note : Table is based on births in the last five years whether the children are living or dead at the time of interview. ¹ Includes children who started breastfeeding within half an hour of birth. ² Includes children who started breastfeeding within half an hour and one hour of birth ³ Children given something other than breastmilk during the first three days of life. Source : National Family Health Survey (NFHS-3), , Vol-I, International Institute of Population Sciences, Mumbai, p
166 I 145
167 Table 4.10: Median duration (months) of breastfeeding among last born children in the last three years¹ S. No. State Any breastfeeding 1 Exclusive breast-feeding Predominant breast-feeding 2 Percentage using a bottle with a nipple India North 1. Delhi Haryana Himachal Pradesh Jammu & Kashmir Punjab Rajasthan Uttarakhand Central 8. Chhattisgarh Madhya Pradesh Uttar Pradesh East 11. Bihar Jharkhand Orissa West Bengal North East 15. Arunanchal Pradesh Assam Manipur Meghalaya Mizoram Nagaland Sikkim Tripura West 23. Goa Gujarat Maharashtra South 26. Andhra Pradesh Karnataka Kerala Tamil Nadu Note : Median durations are based on current status. Duration includes children living & deceased at the time of survey. ¹It is assumed that children not currently living with the mother are not currently breastfeeding. 2 Either exclusively breastfed or received breast milk and plain water, and /or non-milk liquids only. Source : National Family Health Survey (NFHS-3), , Vol-I, International Institute of Population Sciences, Mumbai, p
168
169 Table 4.11: Number of beneficiaries for supplementary nutrition and pre-school education in ICDS during S. No. Indicators Total (Cumulative numbers) as in the month of March 2002 i.e end of IX Plan March 2008 March No. of fully operational Projects Number of projects Reporting Anganwadi Workers 1. Sanctioned In-position Services a. Supplementary Nutrition 1. Number of Anganwadi Providing Supplementary Nutrition 2. Children Receiving Supplementary Nutrition (0-3 years) 3. Children Receiving Supplementary Nutrition (3-6 years) 4. Children Receiving Supplementary Nutrition (Total) Mothers Receiving Supplementary Nutrition Total Beneficiaries b. Pre-school Education 1. Number of Anganwadis Providing Pre-school Education 2. Children attending Pre-school Education (3-6 years) Source : Status Report of ICDS as on 31st March 2009, Ministry of Women & Child Development, Govt. of India, New Delhi, p
170
171 Table 4.12: Statewise beneficiaries of supplementary nutrition as on 31st March 2009 S. States/UT ICDS No. anganwadis No. of SNP beneficiaries No. projects Reporting Providing 0-3 years 3-6 years Total Mothers Reporting Service Children total 1. Andhra Pradesh Arunachal Pradesh 3. Assam Bihar Chhattisgarh Goa Gujarat Haryana Himachal Pradesh 10. Jammu & Kashmir 11. Jharkhand Karnataka Kerala Madhya Pradesh Maharashtra Manipur Meghalaya Mizoram Nagaland Orissa Punjab Rajasthan Sikkim Tamil Nadu Tripura Uttar Pradesh Uttarakhand West Bengal A & N Islands Chandigarh Delhi D & N Haveli Daman & Diu Lakshadweep Puducherry All India Source : Status Report of ICDS as on 31st March 2009, Ministry of Women & Child Development, Govt. of India, New Delhi, pp.1 &
172 % (0.04, 0.16) (0.11, 0.29) (0.11, 0.29) (0.88, 1.31) (0.61, 0.99) (0.04,0.16) (0.11, 0.29) (0.03, 0.17) (0.11, 0.29) (1.89, 2.51) (1.07,1.53) (1.06, 1.54) (4.45, 5.35) (0.19, 0.41) (3.31, 4.09) (0.36, 0.64) (0.52, 0.88) (0.98, 1.42) (1.06, 1.54) (1.15, 1.65) (0.19, 0.41) (0.44, 0.76) (0.26, 0.34) (1.70, 1.90) (0.73, 0.87) Table 4.13: Prevalence (%) of signs and symptoms of vitamin A deficiency among 1 - <5 year children Vitamin A deficiency Kerala Tamil Nadu Karnataka Andhra Pradesh States Maharashtra Madhya Pradesh Orissa West Bengal n Night Blindness Conjunctival Xerosis Bitot Spots (XIB) Note : Source : (0.04, 0.16) (0.11, 0.29) (0.11, 0.29) (0.88, 1.31) (0.61, 0.99) (0.04,0.16) (0.11, 0.29) (0.03, 0.17) (0.11, 0.29) (1.89, 2.51) (1.07,1.53) (1.06, 1.54) (4.45, 5.35) (0.19, 0.41) (3.31, 4.09) (0.36, 0.64) (0.52, 0.88) (0.98, 1.42) (1.06, 1.54) (1.15, 1.65) (0.19, 0.41) (0.44, 0.76) Total (0.26, 0.34) (1.70, 1.90) (0.73, 0.87) n - Sample size Figures in the parentheses indicate confidence intervals. Prevalence of Micronutrient Deficiencies, NNMB Technical Report No. 22, National Nutrition Monitoring Bureau, NIN, ICMR, Hyderabad, 2003, p
173 I 152
174 Table 4.14: Percentage of children (age months) who received vitamin A supplements in last six months by states, India, S. No. States NFHS-3 % of Children (12-35 months) received Vit A dose India Andhra Pradesh Arunachal Pradesh Assam Bihar Chhattisgarh Delhi Goa Gujarat Haryana Himachal Pradesh Jammu & Kashmir Jharkhand Karnataka Kerala Madhya Pradesh Maharashtra Manipur Meghalaya Mizoram Nagaland Orissa Punjab Rajasthan Sikkim Tamil Nadu Tripura Uttar Pradesh Uttarakhand West Bengal 46.8 Source : National Family Health Survey (NFHS-3) ,Vol-1, International Institute of Population Sciences, Mumbai, p
175 154
176 % * 65.0 K * 53.3 K * 64.1 K * 77.5 K * 86.2 K % $ 16*$ 65.3$ # 36.7 kk $ 16*$ 74.3$ # 44.5 kk $ 17*$ 67.7$ # 38.7 kk # 33.3 kk $ 20.19*$ 81.7$ # 35.2 kk *$ 92.2$ # 36.9 kk $ # 155
177 Table 4.15: Yearwise achievements of targets of prophylaxis against nutritional anaemia among women and against blindness due to vit. A deficiency amongst children (Figures in millions) Year Prophylaxis against Nutritional Anaemia among Mothers Prophylaxis against Blindness due to Vit A Deficiency 1st Dose 2nd Dose to 5th Dose Target No. of Beneficiaries (Completed) No. of Total Women % Achvt. of Target (Total Women) Target No. of Beneficiaries % Achvt. of Target Target No. of Beneficiaries % Achvt. of Target * 65.0 K * 53.3 K * 64.1 K * 77.5 K * 86.2 K *$ 16*$ 65.3*$ # 36.7 kk *$ 16*$ 74.3*$ # 44.5 kk *$ 17*$ 67.7*$ # 38.7 kk # 33.3 kk *$ 20.19*$ 81.7*$ # 35.2 kk *$ 92.2*$ # 36.9 kk Worked out after excluding the targets of those States/UTs for which figures have not been 'received. K Percentage of achievement of targets were worked out by taking half of the total doses given to the first time initiated, continued and completed dosed beneficiaries. * In doses *$ Relates to 1st dose (below 1 year + above 1 year) # % achievement of targets of Vit. 'A' (2-5 doses) worked out by taking 2x1.9 times of targets of children (1-2 years). kk Percentage achievement of targets were worked out by taking 2 x 1.9 times of target. Sources: Yearbook 2001, Family Welfare Programmes in India, Ministry of Health and Family Welfare, Govt. of India, New Delhi. 156
178 # l. 1. 1, ,787, , ,395, , ,268, , , , , , , ,369, , ,600, , , , ,175, , ,101, , ,861, , , ,059, , , , , , , , , ,941, , , ,437, , ,957, , ,044, , ,128, , ,701, , ,991, , ,842, , , , , , , , , , , ,004, , ,567, , ,071, , ,918, , ,661, , ,085, , ,619, , ,567, , ,831, , ,450, , ,901, II , , , ,293,992 2, , , , , , , , , , , , , , , , , , , , , , , , , , , , , ,604 III , , , , NA NA , , , , , , , , , , , , , IV 1. $ 27,606 $ 19,940 $ 21, $ 37,218 $ 29,937 $ 47,770 28, ,957, , ,441, , ,298, $ # 157
179 Table 4.16: Prophylaxis against nutritional anaemia among women and blindness due to vitamin A deficiency among children, S. No. States/Union Territory/Agency Prophylaxis against Nutritional Anaemia among women Target Total Women % (in (Prophylactic) Achvt. 000's) of Target Prophylaxis against Blindness due to Vit. A deficiency 1st Dose 2nd Dose to 5th Dose Achvt. % Target (in Achvt. (Below 1 Achvt. 000's) (Above 1 year) of year) Target (in 000's) % Achvt. of Target (#) Target l. Major States (Population>20 million) 1. Andhra Pradesh 1, ,787, , ,395, , ,268, Assam , , , Bihar 3, , , ,369, , ,600, Chhattisgarh 678, ,077 NA 5. Gujarat 1, ,175, , ,101, , ,861, Haryana , , ,059, Jharkhand 291, , , Karnataka 1, , , , , ,941, Kerala , , ,437, Madhya Pradesh 2, ,957, , ,044, , ,128, Maharashtra 2, ,701, , ,991, , ,842, Orissa 1, , , , Punjab , , , Rajasthan 1, , , ,004, , ,567, Tamil Nadu 1, ,071, , ,918, , ,661, Uttar Pradesh 6, ,085, , ,619, , ,567, West Bengal 1, ,831, , ,450, , ,901, II Smaller States 1. Arunachal Pradesh , , , Delhi ,293,992 2, , , Goa , , , Himachal Pradesh , , , Jammu & Kashmir , , , Manipur , , , Meghalaya , , , Mizoram , , , Nagaland NA NA NA NA NA NA 10. Sikkim , , , Tripura , , , Uttarakhand 183, , ,604 III Union Territories 1. A & N Islands , , , Chandigarh , NA NA , D & N Haveli , , , Daman & Diu , , , Lakshadweep , , , Puducherry , , , IV Other Agencies 1. M/o Defence $ 27,606 $ 19,940 $ 21, M/o Railways $ 37,218 $ 29,937 $ 47,770 All India 28, ,957, , ,441, , ,298, Notes: Source: NA - Not Available $ - No separate targets allocated in respect of M/o Defence and Railways. # - % achievement of targets of Vit.'A' (2-5 dose) worked out by taking 2 x 1.9 times of targets of children ( 1-2 years). Year Book 2001, Family Welfare Programmes in India, Ministry of Health & Family Welfare, Govt. of India, New Delhi. 158
180 ( g/dl) ( g/dl) (<7.0g/dl) (<11.0 g/dl) ¹ I 159
181 Table 4.17: Percentage of children age 6-59 months classified as having anaemia, according to state, India, S. No State Anaemia Status by haemoglobin level Mild ( g/dl) 160 Moderate ( g/dl) Severe (<7.0g/dl) Any anaemia (<11.0 g/dl) India¹ North 1. Delhi Haryana Himachal Pradesh Jammu & Kashmir Punjab Rajasthan Uttarakhand Central 8. Chhattisgarh Madhya Pradesh Uttar Pradesh East 11. Bihar Jharkhand Orissa West Bengal North East 15. Arunanchal Pradesh Assam Manipur Meghalaya Mizoram Sikkim Tripura West 23. Goa Gujarat Maharashtra South 26. Andhra Pradesh Karnataka Kerala Tamil Nadu Note : Table is based on children who stayed in the household the night before the interview. Prevalence of anaemia, based on haemoglobin levels is adjusted for altitude using formula in CDC(1998). Haemoglobin in g/dl = grams per decilitre. ¹Excludes Nagaland. Source : National Family Health Survey (NFHS-3), , Vol. I, International Institute of Population Sciences, Mumbai, p.290.
182 161
183 (28.8,38.4) (58.0,67.3) (61.9,70.9) (66.6,75.0) (54.3,63.9) (60.0,69.4) (89.8,95.0) (77.5,84.9) (65.3,68.5) Table 4.18: Prevalence (%) of anaemia among 1 <5 years children S. No. States n Normal (> = 11 g/dl) Mild (10-11g/dl) Moderate (7-10g/dl) Anaemia Severe (<7g/ dl) Total (CI) Kerala (28.8,38.4) 2. Tamil Nadu (58.0,67.3) 3. Karnataka (61.9,70.9) 4. Andhra Pradesh (66.6,75.0) 5. Maharashtra (54.3,63.9) 6. Madhya Pradesh (60.0,69.4) 7. Orissa (89.8,95.0) 8. West Bengal (77.5,84.9) Total (65.3,68.5) Source: National Nutrition Monitoring Bureau, Technical Report No. 22, National Institute of Nutrition, Indian Council of Medical Research, Hyderabad, India 2003, p
184 (49.1,59.7) (49.0,58.6) (57.2,66.4) (68.6,76.8) (53.0,62.6) (67.9,76.7) (78.5,85.7) (87.3,92.9) (67.1,70.3) Table 4.19: Prevalence (%) of anaemia among year girls S. No. States n Normal (>12 g/dl) Mild (10-12g/dl) Moderate (7-10g/dl) Anaemia Severe (<7g/dl) Total (CI) Kerala (49.1,59.7) 2. Tamil Nadu (49.0,58.6) 3. Karnataka (57.2,66.4) 4. Andhra Pradesh (68.6,76.8) 5. Maharashtra (53.0,62.6) 6. Madhya Pradesh (67.9,76.7) 7. Orissa (78.5,85.7) 8. West Bengal (87.3,92.9) Total (67.1,70.3) Source: National Nutrition Monitoring Bureau, Technical Report No. 22, National Institute of Nutrition, Indian Council of Medical Research, Hyderabad, India 2003, p
185 (44.1,54.3) (54.6,64.2) (62.5,71.5) (68.8,77.0) (59.5,68.7) ( 71.9,80.3) (73.7,81.5) (84.5,90.7) (68.1,71.3) Table 4.20: Prevalence (%) of anaemia among year girls S. No. States n Normal (>=12 g/dl) Mild (10-12g/dl) Moderate (7-10g/dl) Anaemia Severe (<7g/dl) Total (CI) Kerala (44.1,54.3) 2. Tamil Nadu (54.6,64.2) 3. Karnataka (62.5,71.5) 4. Andhra Pradesh (68.8,77.0) 5. Maharashtra (59.5,68.7) 6. Madhya Pradesh ( 71.9,80.3) 7. Orissa (73.7,81.5) 8. West Bengal (84.5,90.7) Total (68.1,71.3) Source: National Nutrition Monitoring Bureau, Technical Report No. 22, National Institute of Nutrition, Indian Council of Medical Research, Hyderabad, India 2003, p
186 (44.3,56.1) (64.4,73.6) (75.8,83.8) (69.6,78.0) (71.6,80.2) (79.9,87.7) (77.5,85.5) (73.2,81.0) (72.9,76.1) Table 4.21: Prevalence (%) of anaemia among pregnant women (> 6 months) S. No. States n Normal (>=11 g/dl) Mild (10-11g/dl) Moderate (7-10g/dl) Anaemia Severe (<7g/dl) Total (CI) Kerala (44.3,56.1) 2. Tamil Nadu (64.4,73.6) 3. Karnataka (75.8,83.8) 4. Andhra Pradesh (69.6,78.0) 5. Maharashtra (71.6,80.2) 6. Madhya Pradesh (79.9,87.7) 7. Orissa (77.5,85.5) 8. West Bengal (73.2,81.0) Total (72.9,76.1) Source: National Nutrition Monitoring Bureau, Technical Report No. 22, National Institute of Nutrition, Indian Council of Medical Research Hyderabad, India 2003, p
187 (50.0,60.6) (63.2,72.4) (70.2,78.8) (72..3,80.3) (68.6,77.2) (82.4,89.4) (88.5,93.9) (94.0,97.8) (76.7,79.5) Table 4.22: Prevalence (%) of anaemia among lactating women (< 6 months) S. No. States n Normal ( 12 g/ dl) Mild (10-12g/dl) Moderate (7-10g/dl) Anaemia Severe (<7g/dl) Total (CI) Kerala (50.0,60.6) 2. Tamil Nadu (63.2,72.4) 3. Karnataka (70.2,78.8) 4. Andhra Pradesh (72..3,80.3) 5. Maharashtra (68.6,77.2) 6. Madhya Pradesh (82.4,89.4) 7. Orissa (88.5,93.9) 8. West Bengal (94.0,97.8) Total (76.7,79.5) Source : National Nutrition Monitoring Bureau Technical Report No. 22, National Institute of Nutrition, Indian Council of Medical Research, Hyderabad, India 2003, p
188 < * * Table 4.23: Prevalence (%) of undernutrition (<Median -2SD) among pre-school children (NNMB rural surveys ) S. States Underweight Stunting Wasting No. Boys Girls Pooled Boys Girls Pooled Boys Girls Pooled Andhra Pradesh 2. Gujarat Madhya Pradesh 4. Maharashtra Karnataka Kerala Orissa Tamil Nadu West Bengal States Pooled* Note : *States Pooled' include all the above mentioned states. Source : National Nutrition Monitoring Bureau (NNMB); Fact Sheets on Nutrition, 2008 ( 167
189 (< 20μg/ dl) XN X1 X = 168
190 Table 4.24: Prevalence of micronutrients deficiency disorders in rural population in India : NNMB rural survey S. No. States Vitamin - A Deficiency (VAD) Iron Deficiency Anaemia Iodine Deficiency Disorder (IDD) : School Age Children Iodine Content in Cooking Salt Chronic Energy Deficiency: Adults Clinical VAD Sub- Clinical VAD (< 20μg/ dl) XN X1A X1B 1-3 yrs 3-5 yrs 1-5 yrs yrs yrs Pregnant Women Lactating Mothers Goitre Deaf & Mute Mentally Retarded Pooled Male Female 0 PPM 7 PPM 15 PPM Andhra Pradesh Gujarat Madhya Pradesh Maharashtra Karnataka Kerala Orissa Tamil Nadu West Bengal States Pooled Note: PPM : Particles per million. Source: National Nutrition Monitoring Bureau (NNMB); Fact Sheets on Nutrition, 2008 ( 169
191 5 Education and Literacy
192 i. ii. 172
193 Table 5.1: Literacy rates in India, Year Rural/Urban/Total Persons Males Females Total Total Total Rural Urban Total Rural Urban Total Rural Urban Total Note : i. Literacy rates for 1951, 1961 and 1971 related to population aged five years and above. The rates for the years 1981, 1991 and 2001 related to the population aged seven years and above. ii. Census could not be conducted in 1981 in Assam and in 1991 in Jammu & Kashmir. Source : 1. Primary Census Abstract : Census of India Selected Educational Statistics , Govt. of India, Ministry of HRD, Department of Higher Education, Statistics Division, New Delhi 2007, p.x X XVIII. 3. Selected Educational Statistics , Govt. of India, Ministry of HRD, Department of Higher Education, Statistics Division, New Delhi, 173
194 174
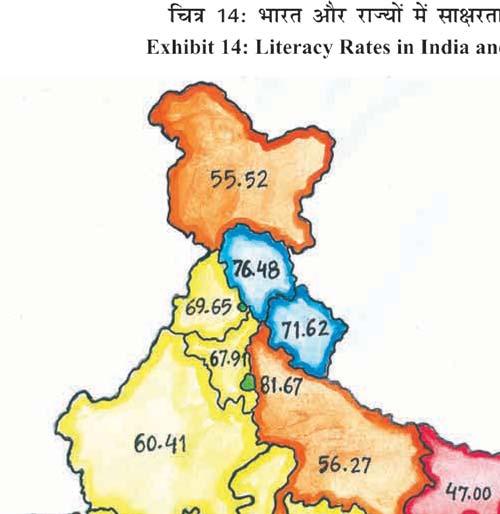

195 175
Chapter 1 POPULATION
 Chapter 1 POPULATION Women & Men In India- 2016 1 2 Population related Statistics Population and related Statistics This chapter presents the important statistics on population characteristics from a gender
POPULATION. Chapter 1
 Chapter 1 POPULATION Coverage Rural urban Distribution of Sex Ratio and Population Growth Rate in Post-Independence India State-wise percent share of Female population in Total Population Year-wise State-wise
Chapter 2 HEALTH. Women & Men In India
 Chapter 2 HEALTH Women & Men In India 2016 19 20 Health related statistics Health A healthy population being the basic necessity for development, it is essential to assess the variability in terms of gender
04-Jun-08 FILE NAME : GSDPCRNS STATE SERIES
 04-Jun-08 FILE NAME : GSDPCRNS STATE SERIES STATEMENT : GROSS STATE DOMESTIC PRODUCT AT CURRENT PRICES (1980-81 TO 1993-94) As on 26.11.1999 (Crore Rupees) Sl. State/U.T. 1980-81 1981-82 1982-83 1983-84
ECONOMIC SURVEY STATISTICAL APPENDIX
 ECONOMIC SURVEY 2011-12 STATISTICAL APPENDIX STATISTICAL APPENDIX : ECONOMIC SURVEY 2011-2012 PAGE 0.1 Select Indicators: 1950-51 to 2010-11... A1-A2 1. National Income and Production 1.1 Gross National
Population and decadal change by residence -India: 2011 (Persons)
") Population and decadal change by residence -India: 2011 (Persons) State/ UT Code India/ Population 2011 State/Union Territory # Percentage decadal change 2001-2011 Total Rural Urban Total Rural Urban 1
Population and decadal change by residence -India: 2011 (Persons) State/ UT Code India/ Population 2011 State/Union Territory # Percentage decadal change 2001-2011 Total Rural Urban Total Rural Urban 1
Employees' Provident Fund Organisation, India Ministry of Labour & Employment, Government of India
 Employees' Provident Fund Organisation, India Ministry of Labour & Employment, Government of India Date 20th December, 2018 NET PAYROLL DATA EPFO PROVISIONAL ESTIMATE OF NET PAYROLL IN AGE BUCKETS AS PER
GOVERNMENT OF INDIA MINISTRY OF HOME AFFAIRS LOK SABHA UNSTARRED QUESTION NO. 2009
 GOVERNMENT OF INDIA MINISTRY OF HOME AFFAIRS LOK SABHA UNSTARRED QUESTION NO. 2009 TO BE ANSWERED ON THE 14 TH MARCH, 2017/ PHALGUNA 23, 1938 (SAKA) DOMESTIC VIOLENCE 2009. SHRI NIHAL CHAND: SHRI R. DHRUVA
INDIAN HORTICULTURE PRODUCTION - AT A GLANCE ( and to )
") 2 INDIAN HORTICULTURE PRODUCTION - AT A GLANCE (1991-92 and 2001-02 to 2012-13) Year Fruits Vegetables Flowers Nuts (Almond & Walnut) A P A P A P (Loose) A P 1991-92 2874 28632 5593 58532 NA NA NA NA 2001-02
2 INDIAN HORTICULTURE PRODUCTION - AT A GLANCE (1991-92 and 2001-02 to 2012-13) Year Fruits Vegetables Flowers Nuts (Almond & Walnut) A P A P A P (Loose) A P 1991-92 2874 28632 5593 58532 NA NA NA NA 2001-02
Description Rural Urban Combined. Weights June 18 Index (Final) July 18 Index (Prov.) (1) (2) (3) (4) (5) (6) (7) (8) (9) (10) (11) (12)
 July 18 Index (Prov.) (1) (2) (3) (4) (5) (6) (7) (8) (9) (10) (11) (12)") Annexure I All India Consumer Price Indices Group Subgroup Description Rural Urban Combined () () (3) (4) (5) (6) (7) (8) (9) (0) () () Cereals.35 37.6 38.4 6.59 35.3 35.6 9.67 36.9 37.5 Meat fish 4.38
Annexure I All India Consumer Price Indices Group Subgroup Description Rural Urban Combined () () (3) (4) (5) (6) (7) (8) (9) (0) () () Cereals.35 37.6 38.4 6.59 35.3 35.6 9.67 36.9 37.5 Meat fish 4.38
14.Storage Infrastructure
 Infrastructure 393 394 14. STORAGE 14.1 There is no specific data source for this item, which compiles data for all types of storages in one place. Data has been individually obtained from Central Warehousing
northeast group, llc India Smart Grid: Market Forecast ( ) January group.com
 January group.com") northeast group, llc India Smart Grid: Market Forecast (2015 2025) January 2015 www.northeast- group.com India Smart Grid: Market Forecast (2015 2025) In many ways, India represents the best smart grid
northeast group, llc India Smart Grid: Market Forecast (2015 2025) January 2015 www.northeast- group.com India Smart Grid: Market Forecast (2015 2025) In many ways, India represents the best smart grid
Total Surface Area DEVELOPING MEMBER COUNTRY (DMC) ( 000 sq. km) (Mn) (%)
 ( 000 sq. km) (Mn) (%)") Economics and Research Department Development Indicators and Policy Research Division Basic Statistics 2011 Millennium Development Goals Land Population National Accounts Prices Money Balance of Payments
Economics and Research Department Development Indicators and Policy Research Division Basic Statistics 2011 Millennium Development Goals Land Population National Accounts Prices Money Balance of Payments
Total Surface Area DEVELOPING MEMBER ECONOMY. ( 000 km 2 ) (million) (%)
 (million) (%)") Land Population Millennium Development Goals National Accounts Prices Money Balance of Payments Reserves External Debt Central Government Finance BASIC STATISTICS 2015 Economic Research and Regional Cooperation
Land Population Millennium Development Goals National Accounts Prices Money Balance of Payments Reserves External Debt Central Government Finance BASIC STATISTICS 2015 Economic Research and Regional Cooperation
¼ããÀ ¹ã㪠ã Ôãâ ãìêã ã ãäà¹ããñ Ã
 Central Electricity Authority LGBR: 211-12 ¼ããÀ ¹ã㪠ã Ôãâ ãìêã ã ãäà¹ããñ à Load Generation Balance Report 211-12 ¼ããÀ ã ÔãÀ ãšãà Government of India ãäìã²ãì ã ½ãâ ããêã¾ã Ministry of Power ãñš ³ãè¾ã ãäìã²ãì
Total Surface Area DEVELOPING MEMBER ECONOMY. ( 000 km 2 ) (million) (%)
 (million) (%)") BASIC 2016 STATISTICS Economic Research and Regional Cooperation Department Development Economics and Indicators Division Land Population National Accounts Prices Money Balance of Payments Reserves External
BASIC 2016 STATISTICS Economic Research and Regional Cooperation Department Development Economics and Indicators Division Land Population National Accounts Prices Money Balance of Payments Reserves External
¼ããÀ ¹ã㪠ã Ôãâ ãìêã ã ãäà¹ããñ Ã
 ¼ããÀ ¹ã㪠ã Ôãâ ãìêã ã ãäà¹ããñ à Load Generation Balance Report 212-13 ¼ããÀ ã ÔãÀ ãšãà Government of India ãäìã²ãì ã ½ãâ ããêã¾ã Ministry of Power ãñš ³ãè¾ã ãäìã²ãì ã ¹ãÆããä ã ãšà ã Central Electricity
CONTENTS. Table Subject. I Area under Rubber and Average Yield per hectare
 CONTENTS Table Subject Page I Area under Rubber and Average Yield per hectare 1 Area Newplanted and Replanted with Rubber 5 2 State-wise Area under Rubber at the end of each year 6 3 District/State-wise
STATISTICS. Economic Research and Regional Cooperation Department. Core Indicators. Development Economics and Indicators Division
 Total Average Annual Growth Proportion of below $1.90 Purchasing Power Parity (PPP) a Day CORE INDICATORS Proportion of Living below the National Poverty Line Annual Growth Per Capita of Gross Gross National
TRANSMISSION CAPACITY ADDITION PROGRAMME DURING No. 1 Introduction 1
 TRANSMISSION CAPACITY ADDITION PROGRAMME DURING 2006-07 Sl. No. Contents Page No. 1 Introduction 1 2 Chapter 1 Transmission Capacity Additions During 2005-06 of 10 th plan period 3 Chapter 2 Construction
RPO-REC Framework: Emerging Challenges and way forward. Background Presentation
 RPO-REC Framework: Emerging Challenges and way forward Background Presentation Ashwin Gambhir, Vishal Toro, Vijaypal Singh Prayas (Energy Group), Pune 10 th June, 2013, IHC, New Delhi Prayas Energy Group,
Status Review Report on Implementation of Batteries (Management and Handling) Rules, 2001 (as amended thereof)
 Rules, 2001 (as amended thereof)") Status Review Report on Implementation of Batteries (Management and Handling) Rules, 2001 (as amended thereof) 2016 CENTRAL POLLUTION CONTROL BOARD Ministry of Environment, Forest and Climate Change, Govt.
Status Review Report on Implementation of Batteries (Management and Handling) Rules, 2001 (as amended thereof) 2016 CENTRAL POLLUTION CONTROL BOARD Ministry of Environment, Forest and Climate Change, Govt.
INDEX. Constant prices from to (P) 7. Quarterly GDP by Activity at factor Cost (at Constant and at Current
 7. Quarterly GDP by Activity at factor Cost (at Constant and at Current") INDEX No. Title Page Indian Economy Related 1. India Macro-economic Summary : 1999-00 to 2014-15 1 2. India Economy at a Glance : Some Indicators - India (1999-2000 to 2 2014-15) 3. GDP at Factor Cost
INDEX No. Title Page Indian Economy Related 1. India Macro-economic Summary : 1999-00 to 2014-15 1 2. India Economy at a Glance : Some Indicators - India (1999-2000 to 2 2014-15) 3. GDP at Factor Cost
Unnat Jyoti by Affordable LEDs for All Conserve Electricity, Conserve Energy
 Unnat Jyoti by Affordable LEDs for All (UJALA) Ministry of Power www.swaniti.in Unnat Jyoti by Affordable LEDs for All Conserve Electricity, Conserve Energy Key Features of UJALA Unnat Jyoti by Affordable
Frequently Asked Questions for Grid Connected Solar Rooftop Systems
 Frequently Asked Questions for Grid Connected Solar Rooftop Systems 1. What is a Solar Rooftop System? In a solar rooftop system, the solar panels are installed in the roof of any residential, commercial,
भ र त स र क र क न र य व द य त प ध क र ण C E N T R A L E L E C T R I C I T Y A U T H O R I T Y
 भ र त स र क र G O V E R N M E N T O F I N D I A व द य त म त ल य M I N I S T R Y O F P O W E R क न र य व द य त प ध क र ण C E N T R A L E L E C T R I C I T Y A U T H O R I T Y ( व द य त अ ध नन य म, 2 3 क
Perceived Adequacy of Food Consumption in Indian Households
 Report No. 512(61/1.0/5) Perceived Adequacy of Food Consumption in Indian Households 2004-2005 NSS 61 st Round July 2004- June 2005 National Sample Survey Organisation Ministry of Statistics & Programme
People REGIONAL TABLES. Introduction. Key Trends. Key Indicators for Asia and the Pacific 2010
 125 People The Asia and Pacific region accounts for about 56% of the world s population, with about 37% living in the two most populous economies, People s Republic of China (PRC) and India. Population
Unorganised Manufacturing Sector in India Its Size, Employment and Some Key Estimates
 Report No. 433(51/2.2/1) Unorganised Manufacturing Sector in India Its Size, Employment and Some Key Estimates NSS Fifty-first round July 1994 - June 1995 National Sample Survey Organisation Department
ECONOMIC SURVEY STATISTICAL APPENDIX
 ECONOMIC SURVEY 2017-18 STATISTICAL APPENDIX STATISTICAL APPENDIX : ECONOMIC SURVEY 2017-18 PAGE 1 National Income and Production 1.1 Gross National Income and Net National Income... A1-A2 1.2 Annual
DEVELOPMENT AND IMPLEMENTING URBAN HEALTH EQUITY INDICATORS IN TEHRAN URBAN HEART- TEHRAN. On behalf of Urban- HEART Team Tehran
 DEVELOPMENT AND IMPLEMENTING URBAN HEALTH EQUITY INDICATORS IN TEHRAN URBAN HEART- TEHRAN On behalf of Urban- HEART Team Tehran CAPACITY BUILDING WORKSHOP ON HEALTH SYSTEM DEVELOPMENT What is Urban HEART
भ र उत प द स त लन रप टर LOAD GENERATION BALANCE REPORT
 भ र उत प द स त लन रप टर 214-15 LOAD GENERATION BALANCE REPORT 214-15 Distribu tion Transm ission Generation भ रत सरक र Government of India व त म लय Ministry of Power क न य व त धकरण Central Electrici Authori
2018 ESCAP population data sheet
 2018 ESCAP data sheet Population and Development Indicators for Asia and the, 2018 Region, subregion, country, territory or area Population at mid-year Population growth 1 2 3 4 5 6 7 8 9 10 11 12 13 14
Faecal Sludge and Septage Management
 Sanitation & Faecal Sludge and Septage Management - Status, Progress, Challenges and Way Forward Arumugam Kalimuthu Program Director WASH Institute WASH Inst. Basics 1.27 billion people (17.5% of world
Issue 12. micrometer. data as of 31 st December 2014
 Issue 12 micrometer data as of 31 st December 2014 All rights reserved. No part of this publication may be reproduced or transmitted in any form or by any means without written permission from MFIN. However,
Migration in India NSS 55 th ROUND (July 1999 June 2000)
") Report No. 470 (55/10/8) Migration in India 1999-2000 NSS 55 th ROUND (July 1999 June 2000) National Sample Survey Organisation Ministry of Statistics & Programme Implementation Government of India September
Report No. 470 (55/10/8) Migration in India 1999-2000 NSS 55 th ROUND (July 1999 June 2000) National Sample Survey Organisation Ministry of Statistics & Programme Implementation Government of India September
Different Techniques of Loss Minimization in Distribution System
 Different Techniques of Loss Minimization in Distribution System Gurpreet kour 1, R. K. Sharma 2 1 M. Tech Scholar, Electrical Engineering, Lovely Professional University, Punjab, India 2 HOD, Electrical
Use of durable goods by Indian households:
 Report No. 426 1993-94 Use of durable goods by Indian households: 1993-94 5th quinquennial survey of consumer expenditure NSS 50th Round 1993-94 National Sample Survey Organisation Department of Statistics
Title of the Presentation
 Trends in Emissions from Energy Sector Title of the Presentation Date: September 28, 2017 Venue: New Delhi Date Venue Sectoral Break-up & Approach Fuel Combustion National GHG Inventory Fugitive Emissions
ASEAN Statistical Yearbook 2013
 ASEAN Statistical Yearbook 2013 one vision one identity one community ASEAN Statistical Yearbook 2013 The ASEAN Secretariat Jakarta The Association of Southeast Asian Nations (ASEAN) was established on
ANNUAL REPORT
 lr;eso t;rs CONSUMER PRICE INDEX NUMBERS (for AL/RL) on base 1986-87 = 100 ANNUAL REPORT 2008-2009 GOVERNMENT OF INDIA MINISTRY OF LABOUR & EMPLOYMENT LABOUR BUREAU SHIMLA/CHANDIGARH PREFACE Consumer Price
CHAPTER 20 MOTOR VEHICLES
 CHAPTER 20 MOTOR VEHICLES 20.1 In India the first car ran on roads in 1897. Prior to independence in the 1940s India had no automobile industry to speak of. Cars were brought into the country in a knocked
Appendix Tables [ 129 ]
![Appendix Tables [ 129 ]](/thumbs/89/98823517.jpg "Appendix Tables [ 129 ]") Appendix Tables Appendix Table 1. Gross national product (GNP) per capita in constant 1995 U.S. dollars: Selected countries of East, Southeast, and South and Central Asia, 1960 1999 Subregion and country
Appendix Tables Appendix Table 1. Gross national product (GNP) per capita in constant 1995 U.S. dollars: Selected countries of East, Southeast, and South and Central Asia, 1960 1999 Subregion and country
Road Funds in South Asia
 Road Funds in South Asia Jean-Noel Guillossou & Fang Xu Transport Sector, SASSD Transport Forum March26-30 Outlines Maintenance Requirements Vs. Actual Allocations/Expenditures Types of Road Funds Financing
Meeting with Commissioner, Kendriya Vidyalaya Sangathan (KVS) New Delhi 11 April 2016
 New Delhi 11 April 2016") Chariot Wheel Konark Sun Temple, Odisha Konark Sun Temple is a 13th Century Sun Temple Meeting with Commissioner, Kendriya Vidyalaya Sangathan (KVS) New Delhi 11 April 2016 Solar potential in the country
Chariot Wheel Konark Sun Temple, Odisha Konark Sun Temple is a 13th Century Sun Temple Meeting with Commissioner, Kendriya Vidyalaya Sangathan (KVS) New Delhi 11 April 2016 Solar potential in the country
Deen Dayal Upadhyaya Gram Jyoti Yojana Creating Efficiency in Electricity Distribution
 Deen Dayal Upadhyaya Gram Jyoti Yojana (DDUGJY) Ministry of Power Deen Dayal Upadhyaya Gram Jyoti Yojana Creating Efficiency in Electricity Distribution Key Features of DDUGJY The DDUGJY is a flagship
Employment and Unemployment Situation Among Religious Groups in India,
 Report No. 438 Employment and Unemployment Situation Among Religious Groups in India, 1993-94 Fifth Quinquennial Survey NSS 50th Round July 1993 - June 1994 National Sample Survey Organisation Department
Government and Governance
 218 Government and Governance Negative fiscal balances are observed in slightly over half of the economies in the region. A number of relatively fast-growing economies have low tax burdens. Government
Household Assets and Liabilities in India (as on )
") Report No. 500 (59/18.2/1) Household Assets and Liabilities in India (as on 30.06.2002) NSS 59 th Round (January December 2003) National Sample Survey Organisation Ministry of Statistics and Programme
Report No. 500 (59/18.2/1) Household Assets and Liabilities in India (as on 30.06.2002) NSS 59 th Round (January December 2003) National Sample Survey Organisation Ministry of Statistics and Programme
Government and Governance
 255 Government and Governance The global crisis has increased fiscal deficits in most economies and reduced tax revenues, but government expenditures on education and on social security and welfare have
NATIONAL NUTRITION MONITORING BUREAU
 NNMB Technical Report No : 19 NATIONAL NUTRITION MONITORING BUREAU DIET AND NUTRITIONAL STATUS OF TRIBAL POPULATION REPORT ON FIRST REPEAT SURVEY NATIONAL INSTITUTE OF NUTRITION Indian Council of Medical
DIRECTORATE OF STATISTICS & EVALUATION, BIHAR, PATNA.
 BIHAR lr;eso t;rs BIHAR THROUGH FIGURES 2003 DIRECTORATE OF STATISTICS & EVALUATION, BIHAR, PATNA. List of officers and staff engaged in bringing out this Publication. 1. Sri Dinesh Sharma Joint Director
one vision one identity one community
 one vision one identity one community The Association of Southeast Asian Nations (ASEAN) was established on 8 August 1967. The Member States of the Association are Brunei Darussalam, Cambodia, Indonesia,
Government and Governance
 264 Government and Governance Fiscal deficits fell in 2010 as economies throughout the region recovered from the financial crisis. Government spending on social security and welfare have been rising throughout
Table 1. GDP per Capita, current prices, (US$)
") Table 1. GDP per Capita, current prices, -211 (US$) 21 22 23 24 25 26 27 28 29 211 Estimates Start After Brunei Darussalam 18,477 16,828 16,977 18,757 21,885 25,754 29,949 31,44 36,223 26,423 29,852 36,584
Table 1. GDP per Capita, current prices, -211 (US$) 21 22 23 24 25 26 27 28 29 211 Estimates Start After Brunei Darussalam 18,477 16,828 16,977 18,757 21,885 25,754 29,949 31,44 36,223 26,423 29,852 36,584
ASEAN. Statistical Yearbook. The ASEAN Secretariat Jakarta
 ASEAN Statistical Yearbook 2005 The ASEAN Secretariat Jakarta The Association of Southeast Asian Nations (ASEAN) was established on 8 August 1967. The members of the Association are Brunei Darussalam,
The Electric Power System
 The Electric Power System INDIA Indian Power System 1 2 Basic facts Area:3.288 million km² Population:1.25 Billion Electricity consumers: 216 Million- (31.3.2013) Number of TSOs: 14- (31.3.2013) Numbe
Gujarat Power Sector A Statistical Profile
 Power Sector A Statistical Profile 6th Floor, GIFT ONE, Road 5C, Zone 5, GIFT CITY, Gandhinagar, 8 55. Ph.: +91796 Fax : +91796 5/55 Email : gerc@gercin.org Website : www.gercin.org 6th Floor, GIFT ONE,
ROAD ACCIDENTS IN INDIA 2017
 ROAD ACCIDENTS IN INDIA 2017 GOVERNMENT OF INDIA MINISTRY OF ROAD TRANSPORT & HIGHWAYS TRANSPORT RESEARCH WING NEW DELHI www.morth.nic.in S. No. CONTENTS Section Page No. 1. Executive Summary 1-2 2.
ROAD ACCIDENTS IN INDIA 2016
 ROAD ACCIDENTS IN INDIA 2016 GOVERNMENT OF INDIA MINISTRY OF ROAD TRANSPORT & HIGHWAYS TRANSPORT RESEARCH WING NEW DELHI www.morth.nic.in ROAD ACCIDENTS IN INDIA 2016 GOVERNMENT OF INDIA MINISTRY OF ROAD
STATISTICAL TABLES RELATING TO INCOME, EMPLOYMENT, AND PRODUCTION
 A P P E N D I X B STATISTICAL TABLES RELATING TO INCOME, EMPLOYMENT, AND PRODUCTION C O N T E N T S NATIONAL INCOME OR EXPENDITURE Page B 1. Gross domestic product, 1960 2009... 328 B 2. Real gross domestic
12MORTALITY AND LIFE EXPECTANCY
 12MORTALITY AND LIFE EXPECTANCY U.S. mortality rates and life expectancies have improved dramatically over the long term. The aggregate, ageadjusted death rate (per 1,000 population) has fallen from 17.9
American Driving Survey,
 RESEARCH BRIEF American Driving Survey, 2015 2016 This Research Brief provides highlights from the AAA Foundation for Traffic Safety s 2016 American Driving Survey, which quantifies the daily driving patterns
Seat Belt Law and Road Traffic Injuries in Delhi, India
 Seat Belt Law and Road Traffic Injuries in Delhi, India Dinesh MOHAN Professor Transportation Research & Injury Prevention Programme Indian Institute of Technology Delhi Hauz Khas New Delhi 110016, India
Mercedes-Benz takes road safety awareness campaign to Kerala
 Mercedes-Benz takes road safety awareness campaign to Kerala by Autocar Pro News Desk Aug 31, 2016 Manu Saale, MD and CEO, MBRDI and Jochen Feese, Head of Accident Research, Pedestrian Protection and Sensor
GREENE COUNTY SCHOOLS ENROLLMENT PROJECTIONS REPORT APRIL 12, 2017
 APRIL 12, 2017 PREPARED FOR: Greene County Schools 910 West Summer Street Greeneville, TN 37743 T 423-639-4194 PREPARED BY: Cooperative Strategies 3325 Hilliard Rome Road Hilliard, OH 43026 T 614.798.8828
Annual Report on National Accounts for 2015 (Benchmark Year Revision of 2011) Summary (Flow Accounts)
 Summary (Flow Accounts)") Annual Report on National Accounts for 2015 (Benchmark Year Revision of 2011) Summary (Flow Accounts) I. Overview of Benchmark Year Revision of 2011 P 2 II. Expenditure Series P 3 III. Income Series P
Annual Report on National Accounts for 2015 (Benchmark Year Revision of 2011) Summary (Flow Accounts) I. Overview of Benchmark Year Revision of 2011 P 2 II. Expenditure Series P 3 III. Income Series P
TRANSIT DEMAND IN RURAL DOUGLAS COUNTY: PRELIMINARY BACKGROUND DATA
 TRANSIT DEMAND IN RURAL DOUGLAS COUNTY: PRELIMINARY BACKGROUND DATA Lawrence-Douglas County MPO Regional Transit Advisory Committee Lawrence, Kans. Tuesday October 31, 2017 Chris Zeilinger Assistant Director
Power Distribution Tariffs in India 2016 Discom Wise & Consumer Wise Comprehensive Track
 Power Distribution Tariffs in India 2016 Discom Wise & Consumer Wise Comprehensive Track E-REP Fact Factor Series March 2016 INR/Month INR/Month Power Distribution Tariffs in India 2016 2 CERC Final tariff
Recommendations of the Expert Group on Preventing Motorcycle Injuries in Children
 Recommendations of the Expert Group on Preventing Motorcycle Injuries in Children All Member States in the WHO South-East Asia (SEA) Region are low- and middle-income countries. In the SEA Region, the
WORTHINGTON SCHOOLS ENROLLMENT PROJECTIONS REPORT FEBRUARY 14, 2018
 FEBRUARY 14, 2018 PREPARED FOR: Worthington Schools 200 E. Wilson Bridge Rd. Worthington, OH 43085 T 614.450.6000 PREPARED BY: Cooperative Strategies 3325 Hilliard Rome Road Hilliard, OH 43026 T 614.798.8828
Appendix B STATISTICAL TABLES RELATING TO INCOME, EMPLOYMENT, AND PRODUCTION
 Appendix B STATISTICAL TABLES RELATING TO INCOME, EMPLOYMENT, AND PRODUCTION C O N T E N T S Page NATIONAL INCOME OR EXPENDITURE: B. Gross domestic product, 959 005... 80 B. Real gross domestic product,
BENCHMARKING URBAN TRANSPORT-A STRATEGY TO FULFIL COMMUTER ASPIRATION
 BENCHMARKING URBAN TRANSPORT-A STRATEGY TO FULFIL COMMUTER ASPIRATION Rahul Tiwari Senior City Transport Officer Directorate, Urban Administration and Development Bhopal & PhD Scholar (+91) 98930 44012
CHAPTER 20 MOTOR VEHICLES
 CHAPTER 20 MOTOR VEHICLES 20.1 In India the first car ran on roads in 1897. Prior to independence in the 1940s India had no automobile industry to speak of. Cars were brought into the country in a knocked
WORTHINGTON SCHOOLS ENROLLMENT PROJECTIONS REPORT JANUARY 25, 2019
 JANUARY 25, 2019 PREPARED FOR: Worthington Schools 200 E. Wilson Bridge Rd. Worthington, OH 43085 T 614.450.6000 PREPARED BY: Cooperative Strategies 3325 Hilliard Rome Road Hilliard, OH 43026 T 614.798.8828
Indirect Estimates of District wise IMR and Under 5 Mortality using Census 2011 data - Draft NHSRC. Dr Sandhya Ahuja
 Indirect Estimates of District wise IMR and Under 5 Mortality using 2011 data - Draft NHSRC Dr Sandhya Ahuja CONTENTS PAGE PREFACE :...1 CHAPTER-1 CHAPTER-2 CHAPTER-3 CHAPTER-4 ANNEXURE : INTRODUCTION...4
SOLAR PLANT PERFORMANCE IN INDIA
 Now Available SOLAR PLANT PERFORMANCE IN INDIA 2017-18 Report (PDF) Data-set (Excel) India Infrastructure Research SOLAR PLANT PERFORMANCE IN INDIA 2017-18 Table of Contents 1. Solar Power Sector Overview
The ASEAN Secretariat Jakarta
 ASEAN Statistical Yearbook, 28 ii The ASEAN Secretariat Jakarta ASEAN Statistical Yearbook, 28 i Foreword The ASEAN Statistical Yearbook 28 is now in its seventh edition. It continues to be the leading
FOURTH QUARTER OF Copyrights Statistics Botswana 2019
 STATISTICS BOTSWANA GROSS DOMESTIC PRODUCT FOURTH QUARTER OF 2018 Copyrights 2019 Private Bag 0024, Gaborone. TOLL FREE NUMBER: 0800600200 Tel: ( +267) 367 1300Fax: ( +267) 395 2201 E-mail: info@statsbots.org.bw
Item
 Key Indicators for Asia and the Pacific 2010 POPULATION a Total population million; as of 1 July 18.17 18.55 18.93 19.33 19.73 20.14 20.56 20.99 21.42 21.87 22.32 22.79 23.30 23.82 24.36 24.91 25.47 26.04
STATE PLS SEARCH REQUESTS
 CSM 420 1 of 7 STATE PLS SEARCH REQUESTS LEGAL REQUIREMENTS 45 CFR 302.35 45 CFR 303.3 45 CFR 303.15 45 CFR 303.70 MCLA 400.231-400.235 OCS Central Office is required to operate the State Parent Locator
Monthly, Seasonal and Annual Rainfall Time Series for All-India, Homogeneous Regions and Meteorological Subdivisions:
 ISSN 0252-1075 Contribution from IITM Research Report No. RR-138 ESSO/IITM/STCVP/SR/02(2017)/189 Monthly, Seasonal and Annual Rainfall Time Series for All-India, Homogeneous Regions and Meteorological
India Solar Market Update Q Executive Summary.
 India Solar Market Update Q4 2017 Executive Summary India Solar Demand Forecast India Solar Demand Forecast (MW) 12,000 Annual Rooftop Solar Installations (MW) 80,000 Solar installations rose 123 percent
Teaching English to Foreigners: 2008
 15 June 2009 1100 hrs 106/2009 In 2008, 83,288 foreign students followed courses at local English-language specialised schools. This shows a decrease of 0.8 per cent over 2007. Teaching English to Foreigners:
Global Status Report on Road Safety: Respondents' Questionnaire
 Global Status Report on Road Safety: Respondents' Questionnaire Country: Respondent's Information Name: Position: Institution: Email: Telephone: Fax: National Data Coordinator Name: Position: Institution:
Volume XII National Bureau of Statistics Ministry of Planning, Economy and Empowerment Dar es Salaam
 THE UNITED REPUBLIC OF TANZANIA Volume XII National Bureau of Statistics Ministry of Planning, Economy and Empowerment Dar es Salaam December, 2006 D A R E S S A L A A M R E G I O N N K i n o n d o n i
EVALUATING THE SOCIO-ECONOMIC AND ENVIRONMENTAL IMPACT OF BATTERY OPERATED AUTO RICKSHAW IN KHULNA CITY
 Proceedings of the 4 th International Conference on Civil Engineering for Sustainable Development (ICCESD 2018), 9~11 February 2018, KUET, Khulna, Bangladesh (ISBN-978-984-34-3502-6) EVALUATING THE SOCIO-ECONOMIC
School Districts of Randolph County, IN Demographic Study
 School Districts of Randolph County, IN Demographic Study November 15, 2017 McKibben Demographic Research Jerome McKibben, Ph.D. Rock Hill, SC j.mckibben@mckibbendemographics.com 978-501-7069 Assumptions
ETHANOL BLENDED PETROL PROGRAMME
 ETHANOL BLENDED PETROL PROGRAMME To achieve blending levels for delivering multiple outcomes such as Environmental benefits, Forex savings and Value addition in the economy EBP PROGRAMME VISION Achieve
The Manitoba Workplace Injury Statistics Report
 The Manitoba Workplace Injury Statistics Report 2000 2014 Table of Contents Acknowledgements... 2 Methodology Note on 2009 Extension of WCB Coverage and Change in Average Weekly Earnings... 2 Major Highlights
Comparing the Quality of Service of Bus Companies Operating in two Cities in Brazil
 Comparing the Quality of Service of Bus Companies Operating in two Cities in Brazil D. I. De Souza, D. Kipper, G. P. Azevedo Abstract The main objective of this work is to compare the quality of service
DRAFT. Enrollment Projections Report. November 25, 2015
 November 25, 2015 3325 Hilliard Rome Road Hilliard, Ohio 43026 P: 614.798.8828 f: 614.798.8839 www.dejongrichter.com Table of Contents Acknowledgements... 1 Executive Summary... 3 Enrollment Projection
THE ANDHRA PRADESH GAZETTE PART IV-B EXTRAORDINARY PUBLISHED BY AUTHORITY [No.1] HYDERABAD, THURSDAY, JANUARY 24, 2013
![THE ANDHRA PRADESH GAZETTE PART IV-B EXTRAORDINARY PUBLISHED BY AUTHORITY [No.1] HYDERABAD, THURSDAY, JANUARY 24, 2013](/thumbs/95/124093489.jpg "THE ANDHRA PRADESH GAZETTE PART IV-B EXTRAORDINARY PUBLISHED BY AUTHORITY [No.1] HYDERABAD, THURSDAY, JANUARY 24, 2013") THE ANDHRA PRADESH GAZETTE PART IV-B EXTRAORDINARY PUBLISHED BY AUTHORITY [No.1] HYDERABAD, THURSDAY, JANUARY 24, 2013 ANDHRA PRADESH ACTS, ORDINANCES AND REGULATIONS Etc. The following Act of the Andhra
THE ANDHRA PRADESH GAZETTE PART IV-B EXTRAORDINARY PUBLISHED BY AUTHORITY [No.1] HYDERABAD, THURSDAY, JANUARY 24, 2013 ANDHRA PRADESH ACTS, ORDINANCES AND REGULATIONS Etc. The following Act of the Andhra
World Urbanization Prospects: The 2011 Revision (Population Studies) By United Nations
 By United Nations") World Urbanization Prospects: The 2011 Revision (Population Studies) By United Nations If you are looking for the book World Urbanization Prospects: The 2011 Revision (Population Studies) by United Nations
World Urbanization Prospects: The 2011 Revision (Population Studies) By United Nations If you are looking for the book World Urbanization Prospects: The 2011 Revision (Population Studies) by United Nations
Government Of India Ministry of Power Central Electricity Authority New Delhi
 Government Of India Ministry of Power Central Electricity Authority New Delhi Executive Summary Power Sector January-15 Executive Summary for the Month of January 215 Contents SN Section A - Highlights
Road fatalities in 2012
 Lithuania 1 Inhabitants Vehicles/1 000 inhabitants Road fatalities in 2012 Fatalities /100 000 inhabitants in 2012 2.98 million 751 301 10.1 1. Road safety data collection Definitions Road fatality: person
Government Of India Ministry of Power Central Electricity Authority New Delhi. Power Sector
 Government Of India Ministry of Power Central Electricity Authority New Delhi Power Sector Jan-218 Executive Summary for the Month of Jan 218 Contents SN Section A - Highlights of Power Sector Page 1 Electricity
Passenger seat belt use in Durham Region
 Facts on Passenger seat belt use in Durham Region June 2017 Highlights In 2013/2014, 85 per cent of Durham Region residents 12 and older always wore their seat belt when riding as a passenger in a car,
BASELINE STUDY ON VEHICLE INVENTORY AND FUEL ECONOMY FOR MALAWI (KEY FINDINGS)
") BASELINE STUDY ON VEHICLE INVENTORY AND FUEL ECONOMY FOR MALAWI (KEY FINDINGS) TASK TEAM- LEAD INSTITUTION Ministry of Natural Resources, Energy and Mining Mount Soche Hotel, Blantyre. 11 th December 2017
BASELINE STUDY ON VEHICLE INVENTORY AND FUEL ECONOMY FOR MALAWI (KEY FINDINGS) TASK TEAM- LEAD INSTITUTION Ministry of Natural Resources, Energy and Mining Mount Soche Hotel, Blantyre. 11 th December 2017
OLYMPIC GATEWAY PLAZA
 OLYMPIC GATEWAY PLAZA ABERDEEN, WA MICHAEL S SUBLEASE AVAILABLE IMMEDIATELY Property Highlights Located in the Olympic Gateway Plaza Great Visibility to State Hwy 12 13,258 sf Available (103 front x 129