Fish investigations in the Barents Sea winter
|
|
|
- Emery Stone
- 6 years ago
- Views:
Transcription

1 J O I N IMR/PINRO T R E 2 P O R T S E I E R S Fish investigations in the Barents Sea winter 2013 Institute of Marine Research IMR Polar Research Institute of Marine Fisheries and Oceanography PINRO
2 This report should be cited as: Mehl, S., Aglen, A., Bogstad, B., Dingsør, G.E., Gjøsæter, H., Godiksen, J., Johannessen, E., Korsbrekke, K., Murashko, P.A., Russkikh, A.A., Staby, A., Wenneck, T. de Lange, Wienerroither, R.. Fish investigations in the Barents Sea winter IMR/PINRO Joint Report Series (2), 73 pp. ISSN
3 Fish investigations in the Barents Sea winter 2013 Sigbjørn Mehl, Asgeir Aglen, Bjarte Bogstad, Gjert E. Dingsør, Harald Gjøsæter, Jane Godiksen, Edda Johannesen, Knut Korsbrekke, Arved Staby, Thomas de Lange Wenneck and Rupert Wienerroither Institute of Marine Research P.O. Box 1870 Nordnes, N5817 Bergen, Norway Pavel A. Murashko and Alexey A. Russkikh PINRO77 6 Knipovich Street, Murmansk. Russia
4 CONTENTS Preface Introduction Methods Acoustic measurements Swept area measurements Sampling of catch and agelength keys Survey operation and material Hydrography Total echo abundance of cod and haddock Distribution and abundance of cod Acoustic estimation Swept area estimation Growth and survey mortalities Stomach sampling Distribution and abundance of haddock Acoustic estimation Growth and survey mortalities Distribution and abundance of redfish Acoustic estimation Swept area estimation Distribution and abundance of greenland halibut and long rough dab Greenland halibut Long rough dab Distribution and abundance of capelin, polar cod and blue whiting Capelin Polar cod Blue whiting Registrations of other species SUMMARY Cod Haddock
5 Greenland halibut Long rough dab Capelin Polar cod Blue whiting REFERENCES Appendix 1. Annual survey reports Appendix 2. Changes in survey design, methods, gear etc Appendix 3. Scientific participants
6 Preface Annual catch quotas and other regulations of the Barents Sea fisheries are set through negotiations between Norway and Russia. Assessment of the state of the stocks and quota advices are given by the International Council for the Exploration of the Sea (ICES). Their work is based on survey results and international landings statistics. The results from the demersal fish winter surveys in the Barents Sea are an important source of information for the annual stock assessment. The development of the survey started in the early 1970s and focused on acoustic measurements of cod and haddock. Since 1981 it has been designed to produce both acoustic and swept area estimates of fish abundance. Some development has taken place since then, both in area coverage and in methodology. The development is described in detail by Jakobsen et al. (1997), Johannesen et al. (2009) and Appendix 2. At present the survey provides the main data input for a number of projects at the Institute of Marine Research, Bergen: monitoring abundance of the Barents Sea demersal fish stocks mapping fish distribution in relation to climate and prey abundance monitoring food consumption and growth estimating predation mortality caused by cod This report presents the main results from the surveys in JanuaryMarch The surveys were performed with the Norwegian research vessels Johan Hjort and Helmer Hanssen and the Russian research vessels Fridtjof Nansen and Vilnyus. Annual survey reports since 1981 are listed in Appendix 1, and names of scientific participants are given in Appendix 3. 6
7 1 Introduction The Institute of Marine Research (IMR), Bergen, has performed acoustic measurements of demersal fish in the Barents Sea since Since 1981 a bottom trawl survey has been combined with the acoustic survey. Typical effort of the combined survey has been 1014 vesselweeks, and about 350 bottom trawl hauls have been made each year. Most years three vessels have participated from about 1 February to 15 March. The purpose of the investigations is: Obtain acoustic abundance indices by length and age for cod, haddock and redfish Obtain swept area abundance indices by length (and age) for cod, haddock, redfish and Greenland halibut Map the geographical distribution of those fish stocks Estimate length, weight and maturity at age for those stocks Collect and analyse stomach samples from cod, for estimating predation by cod Map the distribution of maturing/prespawning capelin Data and results from the survey are used both in the ICES stock assessments and by several research projects at IMR and PINRO. From 1981 to 1992 the survey area was fixed (strata 112, main areas ABCD in Fig. 2.1). Due to warmer climate and increasing stock size in the early 1990s, the cod distribution area increased. Consequently, in 1993 the survey area was extended to the north and east (strata 1 23, main areas D ES in Fig. 2.1) in order to obtain a more complete coverage of the younger age groups of cod, and since then the survey has aimed at covering the whole cod distribution area in open water. For the same reason the survey area was extended further northwards in the western part in (strata 2426 in Fig. 2.1). In most years since 1997 Norwegian research vessels have had limited access to the Russian EEZ, and in 1997, 1998 and 2007 the vessels were not allowed to work in the Russian EEZ. In 1999 the coverage was partly limited by a rather unusually wide iceextension. Since 2001, except in 2006 and 2007, Russian research vessels have participated in the survey and the coverage has been better, but for various reasons not complete in most years. In 2008 Norwegian vessels had access to major parts of the Russian EEZ. The coverage was more complete in these years, especially in 2008, 2011 and. In 2009, 2010, 2012 and 2013 the coverage in eastern areas was more limited due to strict rules regarding handling of the catch, bad weather or vessel problems. Table 3.6 summarizes degree of coverage and main reasons for incomplete coverage in the Barents Sea winter
8 2 Methods 2.1 Acoustic measurements The method is explained by Dalen and Smedstad (1979, 1983), Dalen and Nakken (1983), MacLennan and Simmonds (1991) and Jakobsen et al. (1997). The acoustic equipment has been continuously improved. Since the early 1990s Simrad EK500 echo sounder and Bergen Echo Integrator (BEI, Knudsen 1990) have been used. The Simrad ER60 echo sounder and the Large Scale Survey System (LSSS, Korneliussen et al. 2006) has replaced the EK500 and BEI; on R/V Johan Hjort since the 2005 survey and on R/V Helmer Hanssen since the 2008 survey. On the Russian vessels EK 500 was used from 2000 to 2004 and ER60 since In the mid 1990s the echo sounder transducers were moved from the hull to a retractable centreboard, on R/V Johan Hjort since the 1994 survey and on R/V Jan Mayen since the 2008 survey. This latter change has largely reduced the signal loss due to air bubbles in the close to surface layer. None of the Russian vessels have retractable centreboards. On the Norwegian vessels acoustic backscattering values (s A ) are stored at high resolution in LSSS. After scrutinizing and allocating the values to species or species groups, the values are stored with 10 m vertical resolution and 1 nautical mile (NM) horizontal resolution. The procedure for allocation by species is based on: composition in trawl catches (pelagic and demersal hauls) the appearance of the echo recordings inspection of target strength distributions inspection of target frequency responses For each trawl catch the relative s A contribution from each species is calculated (Korsbrekke 1996) and used as a guideline for the allocation. In these calculations the fish length dependent catching efficiency of cod and haddock in the bottom trawl (Aglen and Nakken 1997) is taken into account. If the trawl catch gives the true composition of the species contributing to the observed s A value, those catchbased s A proportions could be used directly for the allocation. In the scrutinizing process the scientists have to evaluate to what extent these catchbased s A proportions are reasonable, or if they should be modified on the basis of knowledge about the fish behaviour and the catching performance of the gear. Estimation procedures The area is divided into rectangles of 1/2 latitude and 1 longitude. For each rectangle and each species an arithmetic mean s A is calculated for the demersal zone (less than 10 m above bottom) and the pelagic zone (more than 10 m above bottom). Each of those acoustic densities by rectangle are then converted to fish densities by the equation: sa A (1) A 8
9 A is average fish density (number of fish / square NM) by rectangle s A is average acoustic density (square m / square NM) by rectangle A is average backscattering crosssection (square NM) by rectangle For cod, haddock and redfish the backscattering crosssection ( ), target strength (TS) and fish length (L cm) is related by the equation (Foote, 1987): TS 10 log 20 log( L ) 68 (2) 4 Indices for the period have been recalculated (Aglen and Nakken 1997) taking account of: changed target strength function changed bottom trawl gear (Godø and Sunnanå 1992) size dependant catching efficiency for cod and haddock (Dickson 1993a,b) In 1999 the indices for cod and haddock were revised and some errors in the time series were discovered and corrected (Bogstad et al. 1999). Combining equations 1 and 2 gives A s / L 2 (3) A L 2 is average squared fish length by rectangle and by depth channels (i.e., pelagic and bottom). As a basis for estimating L 2 trawl catches considered to be representative for each rectangle and depth zone are selected. This is a partly subjective process, and in some cases catches from neighbouring rectangles are used. Only bottom trawl catches are used for the demersal zone, while both pelagic and bottom trawl catches are applied to the pelagic zone. Length frequency distributions by 1 cm length groups form the basis for calculating mean squared length. The bottom trawl catches are normalised to 1 NM towing distance and adjusted for length dependant fishing efficiency (Aglen and Nakken 1997, see below). Length distributions from pelagic catches are applied unmodified. Since 2001 the post processing program BEAM has been used for working out the acoustic estimates. This program provides an automatic allocation of trawl samples to strata (rectangles). The automatic allocation is modified by the user when considered necessary. 9
10 Let f i be the (adjusted) catch by length group i and let L i be the midpoint (cm) of the length interval i. Then: L 2 imax 2 fi Li i imin i (4) max i imin f i For each species the total density ( A ) by rectangle and depth zone is now calculated by equation (3). This total density is then split on length groups according to the estimated length distribution. Next, these densities are converted to abundance by multiplying with the area of the rectangle. The abundance by rectangle is then summed for defined main areas (Figure 2.1). Estimates by length are converted to estimates by age using an age length key for each main area. The total biomass is estimated by multiplying the numbers at age by weight at age from the swept area estimates (see section 2.3). 2.2 Swept area measurements All vessels were equipped with the standard research bottom trawl Campelen 1800 shrimp trawl with 80 mm (stretched) mesh size in the front. Prior to 1994 a codend with 3540 mm (stretched) mesh size and a cover net with 70 mm mesh size were used. Since this mesh size may lead to considerable escapement of 1 year old cod, the codends were in 1994 replaced by cod ends with 22 mm mesh size. At present a cover net with 116 mm meshes is mostly used. The trawl is now equipped with a rockhopper ground gear (Engås and Godø 1989). Until and including 1988 a bobbins gear was used, and the cod and haddock indices from the time period have since been recalculated to rockhopper indices and adjusted for length dependent fishing efficiency and/or sweep width (Godø and Sunnanå 1992, Aglen and Nakken 1997). The sweep wire length is 40 m, plus 12 m wire for connection to the doors. In the Norwegian shrimp survey (Aschan and Sunnanå 1997) the Campelen trawl has been rigged with some extra floats (45 along the ground rope and 18 along the under belly and trunk, all with 20mm diameter) to reduce problems on very soft bottom. This rigging has been referred to as Tromsø rigging. When the shrimp survey was terminated 2004 and later merged with the Ecosystem survey in 2005, improved shrimp data were also requested from the winter survey, and the Tromsø rigging was used in parts of the shrimp areas in 2004 (11 stations) and 2005 (9 stations). Since 2006 the Tromsø rigging has been used for nearly all bottom trawl stations taken by Norwegian vessels in the winter survey. Vaco doors (6 m 2, 1500kg), were previously standard trawl doors on board the Norwegian research vessels. On the Russian vessels and hired vessels Vtype doors (ca 7 m 2 ) have been used. In 2004, R/V Johan Hjort changed to a Vtype door (Steinshamn W9, 7.1m 2, 2050 kg), the same type as used on the Russian research vessels. In 2010 the Vdoors were replaced 10

11 by 125 Thyborøn trawl doors. R/V Helmer Hanssen has used Thyborøn trawl doors since the 2008 survey. In order to achieve constant sampling width of a trawl haul independent of e.g. depth and wire length, a 1014 m rope locks the distance between the trawl wires m in front of the trawl doors on the Norwegian vessels. This is called strapping. The distance between the trawl doors is then in most hauls restricted to the range 4852 m regardless of depth (Engås and Ona 1993, Engås 1995). Strapping was first attempted in the 1993 survey on board one vessel, in 1994 it was used on every third haul and in on every second haul on all vessels. Since 1998 it has been used on all hauls when weather conditions permitted. Strapping is not applied on the Russians vessels, but the normal distance between the doors is about 50 m (D. Prozorkevich, pers. comm.). Standard tow duration is now 15 minutes (until 1985 the tow duration was 60 min. and from 1986 to min). Trawl performance is constantly monitored by Scanmar trawl sensors, i.e., distance between the doors, vertical opening of the trawl and bottom contact control. In sensors monitoring the roll and pitch angle of the doors were used due to problems with the Steinshamn W9 doors. The data is logged on files, but have so far not been used for further evaluation of the quality of the trawl hauls. The positions of the trawl stations are predefined. When the swept area investigations started in 1981 the survey area was divided into four main areas (A, B, C and D, Fig 2.1) and 35 strata. Figure 2.1. Strata (123) and main areas (A,B,C,D,D,E and S) used for swept area estimations. The main areas are also used for acoustic estimation. Additional strata (2426, main area N) covered in, but not included in the estimations. 11
12 During the first years the number of trawl stations in each stratum was set based on expected fish distribution in order to reduce the variance, i.e., more hauls in strata where high and variable fish densities were expected to occur. During the 1990s trawl stations have been spread out more evenly, yet the distance between stations in the most important cod strata is shorter (16 or 20 NM) compared to the less important strata (24, 30 or 32 NM). During the 1990s considerable amounts of young cod were distributed outside the initial four main areas, and in 1993 the investigated area was therefore enlarged by areas D, E, and the icefree part of Svalbard (S) (Fig. 2.1 and Table 3.5), 28 strata altogether. In the survey reports, the Svalbard area was included in A and the western (west of 30 E) part of area E. Since 1996 a revised strata system with 23 strata has been used (Figure 2.1). The main reason for reducing the number of strata was the need for a sufficient number of trawl stations in each stratum to get reliable estimates of density and variance. In later years a few predefined trawl stations have been performed north of the strata system due to increased abundance of cod in these areas, and in the investigated area was enlarged by three new strata in northwest, 2426 (main area N, Fig. 2.1). However, the data are so far not included in the estimation of standard abundance indices. Swept area fish density estimation Swept area fish density estimates ( s,l ) by species (s) and length (l) were estimated for each bottom trawl haul by the equation: s, l f a s, l s, l s,l number of fish of length l per n.m. 2 observed on trawl station s f, estimated frequency of length l s l a s, l swept area: d s EW as, l 1852 l d s towed distance (nm) EW l length dependent effective fishing width: EW l l for l l lmax min EWl EW lmin = l for l lmin EWl EW lmax = min l for l lmax max 12
13 The parameters are given in the text table below: Species l min l max Cod cm 62 cm Haddock cm 48 cm The fishing width was previously fixed to 25 m = nm. Based on Dickson (1993a,b), length dependent effective fishing width for cod and haddock was included in the calculations in 1995 (Korsbrekke et al., 1995). Aglen and Nakken (1997) have adjusted both the acoustic and swept area time series back to 1981 for this length dependency based on meanlengthatage information. In 1999, the swept area time series was recalculated for cod and haddock using the new area and strata divisions (Bogstad et al. 1999). For redfish, Greenland halibut and other species, a fishing width of 25 m was applied, independent of fish length. For each station, s, observations of fish density by length ( sl, ) is summed in 5 cm lengthgroups. Stratified indices by lengthgroup and stratum will then be: Ap Lp, l s, S p l s in stratum p L pl, index, stratum p, lengthgroup l A p area (n.m. 2 ) of stratum p (or the part of the stratum covered by the survey) S p number of trawl stations in stratum p The coverage of the most northern and most eastern strata differs from year to year. The areas of these strata are therefore calculated according to the coverage each year (Table 3.5). Indices are estimated for each stratum within the main areas A, B, C, D, D, E and S. Total number of fish in each 5 cm length group in each main area is estimated by adding the indices of all strata within the area. Total number of fish at age is estimated by using an agelength key constructed for each main area. Total indices on length and age are estimated adding the values for all main areas. 2.3 Sampling of catch and agelength keys. Sorting, weighing, measuring and sampling of the catch are done according to instructions given in Mjanger et al. (). Since 1999 all data except age are recorded electronically by Scantrol Fishmeter measuring board, connected to stabilized scales. The whole catch or a representative sub sample of most species was length measured on each station. At each trawl station age (otoliths) and stomach were sampled from one cod per 5 cm lengthgroup. In , all cod above 80 cm were sampled, and in 2010 all above 90 cm, limited to 10 per station. The stomach samples were frozen and analysed after the survey. Haddock 13
14 otoliths were sampled from one specimen per 5 cm lengthgroup. Regarding the redfish species, Sebastes norvegicus and S. mentella, otoliths for age determination were sampled from two fish in every 5 cm lengthgroup on every station. Greenland halibut were sorted by sex before length measurement and otolith sampling. From this species otoliths were collected from 5 fish per 5 cm length group for each sex on all stations. Table 3.4 gives an account of the sampled material. An agelength key is constructed for each main area. All age samples are included and weighted according to: Lpl, w pl, n pl, w p, l weighting factor L, swept area index of number fish in lengthgroup l in stratum p p l n pl, number of age samples in lengthgroup l and stratum p Fractions are estimated according to: () l p a P () l a p p n n w pal,, pl, w pl, pl, weighted fraction of age a in lengthgroup l and stratum p n pal,, number of age samples of age a in lengthgroup l and stratum p Number of fish by age is then estimated following the equation: () l a p, l a p l N L P Mean length and weight by age is then estimated according to (only shown for weight): W a p l j W p l w w aplj,,, pl, j pl, W aplj,,, weight of sample j in lengthgroup l, stratum p and age a 14

15 3 Survey operation and material Table 3.1 presents the vessels participating in the survey in 2013 and IMR trawl station series numbers. Catch data and biological samples from the Russian vessels were converted to the IMR SPDformat. The acoustic data from the Russian vessels was reported to IMR as allocated values by species at 5 nm intervals, split on a bottom layer (<10m from bottom) and a pelagic layer (>10m above bottom). Table 3.1. Norwegian and Russian vessel participation by time period and Norwegian trawl station series numbers by vessel for the winter surveys Year 2013 Vessel Period Series no. Period Series no. Johan Hjort Helmer Hanssen Fridtjof Nansen Vilnyus Table 3.2 presents the number of swept area trawl stations, other bottom trawl stations and pelagic trawl stations taken in the different main areas. For the calculation of swept area indices, only the successful predefined bottom trawl stations within the strata system were used. The number of stations in the new strata 2426 are also given. Table 3.3 gives an account of the sampled length and age material from bottom hauls and pelagic hauls. Figure 3.1 shows survey tracks and trawl stations for each survey in Figure 3.1. Survey tracks and all trawl stations in the winter survey Data source for the monthly ice cover: ftp://sidads.colorado.edu/datasets/noaa/g02135/shapefiles/ 15
16 Table 3.2. Number of trawl stations by main area in the Barents Sea winter B 1 = swept area bottom trawl (quality=1 and condition<3), B 2 =other bottom trawl, P=pelagic trawl, N=trawl stations in new strata. Main area A B C D D' E S Inside strata system N Total Trawl type B 1 B 2 P B 1 B 2 P B 1 B 2 P B 1 B 2 P B 1 B 2 P B 1 B 2 P B 1 B 2 P B 1 B 2 P B P B+B 1 +B2 P Year Table 3.3. Number of fish measured for length (L) and age (A) in the Barents Sea winter Year Cod Haddock S.marinus S. mentella Greenland halibut Blue whiting L A L A L A L A L L
17 Table 3.4. Area (NM 2 ) covered in the bottom trawl surveys in the Barents Sea winter Main Area Sum Added Year A B C D D' E S ABCD Total area REZ not covered 2 REZ(Murman coast and Area D in 2006 and Area D in 2012) not completely covered 3 Additional northern areas covered; ca NM 2, not included in standard survey index calculations Table 3.5. Degree of coverage and main reasons for incomplete coverage in the Barents Sea winter Year Coverage Comments ABCD ABCDD ES 1997 NEZ, S Not allowed access to REZ 1998 NEZ, S, minor part of REZ Not allowed access to most of REZ 1999 ABCDD ES Partly limited coverage due to westerly ice extension 2000 ABCDD ES ABCDD ES Russian vessel covered where Norwegians had no access 2006 ABCDD ES Not access to Murman coast, no Russian vessel 2007 NEZ, S Not allowed access to REZ, no Russian vessel 2008 ABCDD ES Russian vessel covered where Norwegians had no access 2009 ABCDD ES Reduced Norwegian coverage of REZ due to catch handling 2010 ABCDD ES Reduced Norwegian coverage of REZ due to bad weather 2011 ABCDD ES Russian vessel covered where Norwegians had no access 2012 ABCDD ES No Norwegian coverage of REZ due to vessel problems 2013 ABCDD ES No Norwegian coverage of REZ due to vessel shortage ABCDD ESN Strata 2426 covered, but not included in standard survey index calculations 17
18 4 Hydrography The standard hydrographical sections FugløyaBjørnøya and VardøNord are taken during the later part of the surveys. Figure 4.1 shows the observed mean temperature at m depth for the period Both time series show an increasing trend. The increases in temperatures are approximately 0.44 ( FugløyaBjørnøya ) and 0.51 ( Vardø Nord ) C per decade. Unfortunately, the time series have some missing values. Figure 4.1. Mean temperatures in m depth in A) "FugløyaBjørnøya" in March, B) "VardøNord" in March. 5 Total echo abundance of cod and haddock Table 5.1 presents the time series of total echo abundance (echo density multiplied by area) of cod and haddock in the investigated areas. Since 1993 the acoustic values have been split between the two species during the scrutinizing. The values for cod have showed an increasing trend since the mid 2000s, with a peak in The values for haddock increased gradually from the end of the 1990s to 2009, and have decreased somewhat in the later years. The fraction of the total echo abundance recorded in the bottom layer has been somewhat lower in later years for cod compared to the mid 2000s. For haddock this fraction is lower than for cod and more stable over the time series. Figures 5.1 and 5.2 present the distribution of total echo abundance by estimation rectangles in 2013 for cod and haddock, respectively. The maps show distributions north of the swept area strata, probably extending even further north. 18
19 Table 5.1. Cod and haddock. Total echo abundance and echo abundance in the 10 m layer above the bottom in the Barents Sea winter 1981 (m 2 reflecting surface 10 3 ) includes only mainly areas A, B, C and D. Total Bottom Bottom/total Year Cod Haddock Sum Cod Haddock Sum Cod Haddock Sum , not scaled for uncovered areas 2 not possible to split on bottom and total due to LSSS settings

.")
 in red. Figure 5.2. HADDOCK.")
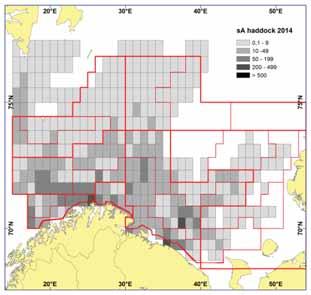
20 Figure 5.1. COD. Distribution of total echo abundance winter Unit is s A per square nautical mile (m 2 /n.mile 2 ). Swept area strata and main areas (thick line) in red. Figure 5.2. HADDOCK. Distribution of total echo abundance winter Unit is s A per square nautical mile (m 2 /n.mile 2 ). Swept area strata and main areas (thick line) in red. 20
21 6 Distribution and abundance of cod 6.1 Acoustic estimation Surveys in the Barents Sea at this time of the year mainly cover the immature part of the cod stock. Most of the mature cod (age 7 and older) have started on their spawning migration southwards out of the investigated area, and are therefore covered to a lesser extent. There are indications that a higher proportion than normal spawned along Finnmark in some of the recent years, e.g Thereby a higher proportion of the spawners might have been covered by the survey these years. Table 6.1 shows the acoustic indices for each age group by main areas in The time series (1981) is presented in Table 6.2. The estimates have been variable and increasing in later years, with a peak in 2013, and this may partly be explained by variable and not complete coverage of the distribution area towards north and east in several years. As cod grow older, their distribution shifts more southwesterly during winter, and they it so to say grows into the incomplete survey. This is especially evident for the strong 2004 and 2005 yearclasses, which as 67 year olds stand out as the strongest in the time series. Of more recent yearclasses the 2011 yearclass seems to be strong. Table 6.1. COD. Acoustic abundance for the main areas of the Barents Sea winter 2013 (numbers in millions). Area Year Age group Total Biomass ('000 t) A 2013 B 2013 C 2013 D 2013 D' 2013 E 2013 S ABCD Total
22 Table 6.2. COD. Abundance indices from acoustic surveys in the Barents Sea winter 1981 (numbers in millions) includes only main areas A, B C and D. Observations outside main areas AS not included. Age Biomass Year Total ( 000 t) Indices raised to also represent the Russian EEZ. 2 Indices raised to also represent uncovered parts of the Russian EEZ. 22
 were found in the eastern part of the survey area within the Russian EEZ and near the northern borders of the standard")
 found that since 2009 more of the largest cod had been found in the northwestern part of the survey area (main area S), and this trend is confirmed by the 2013 and estimates.")
23 6.2 Swept area estimation Figures show the geographic distribution of bottom trawl catch rates (number of fish per NM 2, for cod size groups 19 cm, 2034 cm, 3549 cm and 50 cm. As in previous years, a high proportion of the smallest cod (less than 35 cm) were found in the eastern part of the survey area within the Russian EEZ and near the northern borders of the standard strata system (strata 123). In a higher proportion of cod 19 cm were found in the extended survey area (strata 2426) than in the rest of the survey area (Table 6.3). These size groups have probably been largely underestimated in earlier years. Mehl et al. (2013) found that since 2009 more of the largest cod had been found in the northwestern part of the survey area (main area S), and this trend is confirmed by the 2013 and estimates. Figure 6.1. COD 19 cm. Distribution in valid bottom trawl catches winter 2013 (number per nm 2 ). Zero catches are indicated by black points. Figure 6.2. COD 2034 cm. Distribution in valid bottom trawl catches winter 2013 (number per nm 2 ). Zero catches are indicated by black points. 23
. Zero catches are indicated by black points. Table 6.")


24 Figure 6.3. COD 3549 cm. Distribution in valid bottom trawl catches winter 2013 (number per nm 2 ). Zero catches are indicated by black points. Figure 6.4. COD 50 cm. Distribution in valid bottom trawl catches winter 2013 (number per nm 2 ). Zero catches are indicated by black points. Table 6.3 presents the distribution of the indices by main areas and age and the whole time series (1981) is shown in Table 6.4. Also the bottom trawl indices have fluctuated somewhat due to the same reasons as for the acoustic indices, and the 2004 and 2005 yearclasses at the moment stand out as the strongest in the time series. Both the 2009 and 2011 yearclasses seemed to be strong as 1year olds, but the 2009 yearclass was reduced to below average level at age 3. A considerable amount of cod was found in the extended survey area (Table 6.3), on average over all age groups about 76 % of the amount found in the standard survey area by numbers and about 15 % by biomass. 24
25 Table 6.3. COD. Abundance indices from bottom trawl hauls for main areas of the Barents Sea winter 2013 (numbers in millions.). Area Year A 2013 Age group Total Biomass ('000 t) B C D D' E 2013 S 2013 ABCD 2013 Total 2013 Additional areas Additional areas/ standard areas (%)
26 Table 6.4. COD. Abundance indices from bottom trawl surveys in the Barents Sea winter 1981 (numbers in millions) includes only main areas A, B, C and D. Observations outside main areas AS not included. Age Biomass Year Total ( 000 t) Indices raised to also represent the Russian EEZ. 2 Indices raised to also represent uncovered parts of the Russian EEZ. 26
27 6.3 Growth and survey mortalities Tables 6.5 and 6.6 present the time series for mean length (1981) and mean weight (1983) at age for the entire standard area. Weights and lengths at age were fairly low in the period , but increased somewhat in Since then there has been moderate fluctuations, but with a slight decreasing trend for older fish (6+) in later year. The same pattern is reflected in the annual weight increments (Table 6.7). Table 6.8 gives the time series of survey based mortalities (log ratios between survey indices of the same year class in two successive years) since These mortalities are influenced by natural and fishing mortality, age reading errors, and the catchability and availability (coverage) at age for the survey. In the period there was an increasing trend in the survey mortalities. The trend appears most consistent for the age groups 37 in the swept area estimates. Most later surveys show lower mortalities, but there are some fluctuations for the same reasons as mentioned for the acoustic and swept area indices. Presumably the mortality of the youngest age groups (ages 13) is mainly caused by predation, while for the older age groups it is mainly caused by the fishery. Before 2001 the survey mortalities for age 4 and older were well above the mortalities estimated in the ICES assessment. Decreasing survey catchability at increasing age could be one reason for this. Another possible reason could be that the assessment does not include all sources of mortality, like discards, unreported catches, or poorly quantified predation. The low survey mortalities in the most recent years, even with impossible negative values, could partly be caused by fish gradually growing into the covered area at increasing age. The observed mortality rates in the acoustic investigations have been more variable. This might be caused by changes in fish behaviour and how available the fish is for acoustic registration. 27
28 Table 6.5. COD. Length (cm) at age in the Barents Sea from the investigations winter Observations outside main areas AS not included. Age Year Adjusted lengths 28
29 Table 6.6. COD. Weight (g) at age in the Barents Sea from the investigations winter Observations outside main areas AS not included. Year \ Age Estimated weights 2 Adjusted weights 29
30 Table 6.7. COD. Yearly weight increment (g) from the investigations in the Barents Sea winter Observations outside main areas AS not included. Year\Age
31 Table 6.8. Survey mortality observed for cod during the winter survey in the Barents Sea in Age Year Acoustic investigations Bottom trawl investigations
32 6.4 Stomach sampling Since 1984, cod stomachs have been sampled regularly during the winter survey. The sampling strategy has generally been the same as that for sampling otoliths. Stomach have been frozen onboard and analysed in the laboratory, except for the period , when some of the stomachs were analysed onboard and only the main prey categories were identified. For details about the sampling methodology and the NorwegianRussian cooperation on diet investigations in the Barents Sea, see Mehl and Yaragina (1992) and Dolgov et al. (2007). The number of stations and stomachs sampled as well as the proportion of empty stomachs and the mean stomach fullness index (SFI, see below) for each of 4 size groups ( 19 cm, cm, 3549 cm, 50 cm) is given in Table 6.9. Table show the mean diet composition by prey species/groups by year for each size group. Note that in the years , blue whiting, long rough dab and Norway pout were included in the category other fish when stomachs were analysed onboard. The stomach fullness index is calculated as SFI i =100* WS i /W i, where WS i is the weight (g) of the stomach of fish i, and W i is the weight (g) of fish i. For 1987 SFI has not been calculated, because very few fish were weighed that year due to technical problems. The distribution on prey groups has been adjusted by distributing the unidentified component of the diet proportionally among the various components, taking into account the level of identification. The geographical distribution of stomach fullness and prey composition divided into three prey categories (capelin, other fish, other food) by length group and year is shown in Figures The proportion of empty stomachs is largest for the smallest fish (Table 6.9), a pattern seen for all years. Capelin is the dominating prey for cod 20cm (Tables ), while krill dominates for the smallest cod (Table 6.10). However, in many years capelin is also an important prey for the smallest cod. The diet composition in 2013 was generally similar to that in the period The stomach fullness index SFI was generally lower than in the period In particular, the SFI for the largest fish (>= 50cm) in was the lowest since 1998, and the proportion of capelin in the diet of this size group in was the lowest since Reasons for this could be both that the survey also covered the area west of Svalbard, where capelin is scarce, and also that the proportion of the fish >= 50cm which is mature is higher than in previous years. Mature fish probably feeds less intensively than immature fish at this time of the year. The highest stomach fullness is found in the southeastern part of the survey area and along the coast of Norway and Russia. However, there are also in most years some stations with high stomach fullness close to the northern limit of the survey area. In the western part of the Barents Sea and west of Svalbard the SFI is generally low. 32
33 Table 6.9. Number of stations and stomach sampled, % empty stomachs, and mean stomach fullness by length group in the Barents Sea winter Stomachs % empty Stomach fullness Year Stations <20cm 2034cm 3549cm >=50cm <20cm 2034cm 3549cm >=50cm <20cm 2034cm 3549cm >=50cm
34 Table Mean stomach content composition (% of total SFI) of cod 19 cm from the survey in the Barents Sea winter Year Amphipods Krill Shrimp Other invertebrates Capelin Herring Polar cod Blue whiting Cod Haddock Redfish Long rough dab Norway pout Other fish
35 Table Mean stomach content composition (% of total SFI) of cod 2034 cm from the survey in the Barents Sea winter Other invertebrates Capelin Herring Polar cod Blue whiting Cod Haddock Redfish Long rough dab Year Amphipods Krill Shrimp Norway pout Other fish 35
36 Table Mean stomach content composition (% of total SFI) of cod 3549 cm from the survey in the Barents Sea winter Year Amphipods Krill Shrimp Other invertebrates Capelin Herring Polar cod Blue whiting Cod Haddock Redfish Long rough dab Norway pout Other fish 36
37 Table Mean stomach content composition (% of total SFI) of cod 50 cm from the survey in the Barents Sea winter Year Amphipods Krill Shrimp Other invertebrates Capelin Herring Polar cod Blue whiting Cod Haddock Rredfish Long rough dab Norway pout Other fish 37


38 Figure 6.5. Stomach fullness and diet composition by cod size group in 2013, by 1 x 2 areas. Prey are grouped into the categories capelin, other fish and other prey. The size of the circles indicate the stomach fullness.


39 Figure 6.6. Stomach fullness and diet composition by cod size group in, by 1 x 2 areas. Prey are grouped into the categories capelin, other fish and other prey. The size of the circles indicate the stomach fullness. 39
40 7 Distribution and abundance of haddock 7.1 Acoustic estimation Like for cod it is expected that the survey best covers the immature part of the stock. At this time of the year a large proportion of the mature haddock (age 6 and older) are on its spawning migration southwestwards out of the investigated area. In some earlier years, e.g and 2005, concentrations of mature haddock have been observed pelagic rather far above bottom along the shelf edge. These concentrations are poorly covered by the bottom trawl sampling. There are indications that the distribution of age groups 1 and 2 in some years are concentrated in coastal areas not well covered by the survey. This occurred in the late 1990s and will have strongest effect on poor yearclasses. In the later surveys small haddock has been widely distributed, and the strong yearclasses have been found unusually far to the north. This might be caused by favourably hydrographic conditions and/or densitydependent mechanisms. However, it is difficult to separate the two factors. Favourable hydrographic conditions may lead to better distribution of larvae and thus better survival. On the other hand, high densities of juveniles may cause delayed settlement and more active movement in search of prey. Table 7.1 shows the acoustic abundance indices by age within the main areas. As in most of the previous years the highest abundance was observed in main area D. The time series (1981 ) are presented in Table 7.2. The strong yearclasses can be followed through the time series and still have a strong contribution to the total abundance. In later years, the 2009, 2011 and 2013 yearclasses seem to be fairly strong. Table 7.1. HADDOCK. Acoustic abundance indices for the main areas of the Barents Sea winter 2013 (numbers in millions). Area Year Age group Total Biomass ('000 t) A B C D D' E S ABCD Total
41 Table 7.2. HADDOCK. Abundance indices from acoustic surveys in the Barents Sea winter 1981 (numbers in millions) includes mainly areas A, B, C and D. Observations outside main areas AS not included. Age Biomass Year Total ( 000 t) Indices raised to also represent the Russian EEZ. 2 Indices raised to also represent uncovered parts of the Russian EEZ. 41
, the distribution extends further to the north and to the east than what was usual in the 1990s.")

42 7.2 Swept area estimation Figures show the geographic distribution of bottom trawl catch rates (number of fish per NM 2 ) for haddock size groups 19 cm, 2034 cm, 3549 cm and 50 cm. Like in previous years (Mehl et al. 2013), the distribution extends further to the north and to the east than what was usual in the 1990s. To a certain degree, one can follow the high densities through the size groups, especially the northern and eastern distributions. This indicates that the distribution is more cohortdependent than agedependent, and it may be more appropriate to use cohort as scaling covariate rather than age, when indices are adjusted for poor coverage. Table 7.3 presents the indices for each age group by main areas. The time series (1981) are shown in Table 7.4. As with the acoustic indices, the strong yearclasses dominates bottom trawl indices. Overall, this survey tracks both strong and poor yearclasses fairly well. In later years, the 2009, 2011 and 2013 yearclasses are stronger than the 2007, 2008, 2010 and 2012 yearclasses. Compared to cod a much lower proportion of haddock was found in the extended survey area (Table 6.3), on average over all age groups about 10 % of the amount found in the standard survey area by numbers and about 6 % by biomass (Table 7.3). Figure 7.1. HADDOCK 19 cm. Distribution in valid bottom trawl catches winter 2013 (number per nm 2 ). Zero catches are indicated by black points. 42
. Zero catches are indicated by black points.")
43 Figure 7.2. HADDOCK 2034 cm. Distribution in valid bottom trawl catches winter 2013 (number per nm 2 ). Zero catches are indicated by black points. Figure 7.3. HADDOCK 3549 cm. Distribution in valid bottom trawl catches winter 2013 (number per nm 2 ). Zero catches are indicated by black points. 43
44 Figure 7.4. HADDOCK 50 cm. Distribution in valid bottom trawl catches winter 2013 (number per nm 2 ). Zero catches are indicated by black points. Table 7.3. HADDOCK. Abundance indices from bottom trawl hauls for main areas of the Barents Sea winter 2013 (numbers in millions). Area Year Age Total Biomass ('000 t) A B 2013 C 2013 D 2013 D' 2013 E 2013 S 2013 ABCD 2013 Total 2013 Additional areas Additional areas/ standard areas (%) ,
45 Table 7.4. HADDOCK. Abundance indices from bottom trawl surveys in the Barents Sea winter 1981 (numbers in millions) includes only main areas A, B, C and D. Observations outside Main areas AS not included. Age Biomass Year Total ( 000 t) Indices raised to also represent the Russian EEZ 2 Indices raised to also represent uncovered parts of the Russian EEZ. 45
46 7.3 Growth and survey mortalities Tables 7.5 and 7.6 present the time series for mean length (1983) and mean weight (1983) at age for the entire standard area. Length estimates have been variable with no specific trends in the latest years. However, the variation is less than what it has been in earlier periods. Weight estimates also show less variation in later years, however there is a slight trend of decreasing weights of 4 years and older haddock for the last decade. Annual weight increments are shown in Table 7.7, these are highly variable and show no trends. Table 7.5. HADDOCK. Length (cm) at age in the Barents Sea from the investigations winter Observations outside main areas AS not included. Year Age Adjusted lengths 46
47 Table 7.6. HADDOCK. Weight (g) at age in the Barents Sea from the investigations winter Observations outside main areas AS not included. Year\Age na na na na na na na na na na na na na na na na na na na na na na na na na na na na na na na na na na na na na na na na na na na na na na na na na na na na na na na na na Estimated weights 2 Adjusted weights 47
48 Table 7.7. HADDOCK. Yearly weight increment (g) from the investigations in the Barents Sea winter Observations outside main areas AS not included. Year\Age Survey mortalities based on the acoustic indices (Table 7.8) have varied between years, and for most age groups there is no obvious trends. However, there are signs of covariability within years. 48
49 49 Table 7.8. Survey mortality observed for haddock during the winter survey in the Barents Sea for the period Year/age Acoustic investigations Bottom trawl investigations
50 8 Distribution and abundance of redfish 8.1 Acoustic estimation Earlier reports from this survey has presented distribution maps and abundance indices based on acoustic observations of redfish. In recent years blue whiting has dominated the acoustic records in some of the main redfish areas. Due to incomplete pelagic trawl sampling the splitting of acoustic records between blue whiting and redfish has been very uncertain. The uncertainty relates mainly to the redfish, since it only make up a minor proportion of the total value. This has been the case since the 2003 survey, and the acoustic results for redfish are therefore not included in the report. 8.2 Swept area estimation The swept area time series for redfish (Tables ) are based on catch data from trawls with bobbins gear until 1988 inclusive, and rockhopper gear since The time series has not been adjusted for this change. Figure 8.1 shows the geographical distribution of Sebastes norvegicus (Golden redfish) based on the catch rates in bottom trawl. It is mainly distributed south of the Bear Island. In most years the distribution is completely covered except towards northwest. Also S. norvegicus was found in the extended survey area in, mainly west of Spitsbergen (strata 24), on average over all size groups about 34 % of the amount found in the standard survey area by numbers (Table 8.1). Table 8.1 presents the time series (1986) of swept area indices by 5 cm length groups. The indices have remained low since 1999 for all length groups. This indicates that at least the last fifteen year classes are very weak. The mapping of the distribution of S. mentella (Beaked redfish) (Figure 8.2) is not complete west and north of Spitsbergen. However, compared to S. norvegicus a smaller proportion was found in the extended survey area in, only about 7 % of the amount found in the standard survey area by numbers. Table 8.2 presents the time series (1986) of swept area indices for S. mentella by 5 cm length groups. A few good year classes were born in before the recruitment collapse in 1991 and the stock decreased to low levels for about fifteen years. However, these few year classes got enough protection to survive to maturity and since both recruitment and the number of larger S. mentella has been at a fairly high level. Figure 8.3 shows the geographical distribution of S. viviparus (Norway redfish / lesser redfish) and Table 8.3 presents the time series (1986) of swept area indices by 5 cm length groups. Almost all S. viviparus are found in area ABCD, and mainly in main area B. The indices are often driven by a few large catches, and since the mid 1990s the indices has most in years been below the average level in the time series There was a large and unexplained increase in the indices for most size groups from 2013 to. The total index is the highest in the time series back to


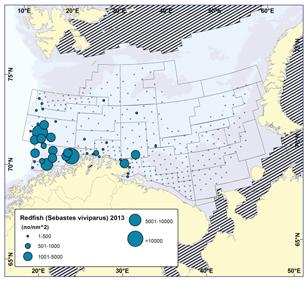
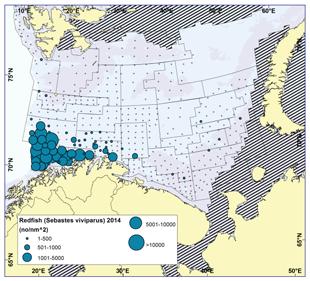
51 Figure 8.1. Sebastes norvegicus. Distribution in the trawl catches winter 2013 (number per nm 2 ). Zero catches are indicated by black points. Figure 8.2. Sebastes mentella. Distribution in the trawl catches winter 2013 (number per nm 2 ). Zero catches are indicated by black points. F Figure 8.3. Sebastes viviparus. Distribution in the trawl catches winter 2013 (number per nm 2 ). Zero catches are indicated by black points. 51
52 Table 8.1. Sebastes norvegicus. Abundance indices from bottom trawl surveys in the Barents Sea winter 1986 (numbers in millions) includes only main areas A, B, C and D. Observations outside main areas AS not included. Species identification uncertain for fish < 10cm. Length group (cm) Biomass Year Total (tons) Additional areas Add. areas/ st.areas (%) Indices raised to also represent the Russian EEZ 2 not scaled for uncovered areas. 52
53 Table 8.2. Sebastes mentella 1. Abundance indices from bottom trawl surveys in the Barents Sea winter 1986 (numbers in millions) includes only main areas A. B. C and D. Observations outside main areas AS not included. Length group (cm) Biomass Year Total (tons) Additional areas Add. areas/ st.areas (%) Includes unidentified Sebastes specimens, mostly less than 10cm 2 Indices raised to also represent the Russian EEZ 53
54 Table 8.3. Sebastes viviparus. Abundance indices from bottom trawl surveys in the Barents Sea winter 1986 (numbers in millions) includes only the area covered in Species identification uncertain for fish < 10cm. Length group (cm) Year Total Biomass (tons) not scaled for uncovered areas, mainly found in NEZ 54
, are not covered by the survey.")

55 9. Distribution and abundance of greenland halibut and long rough dab 9.1 Greenland halibut Figure 9.1 shows the distribution of bottom trawl catch rates of Greenland halibut. The most important distribution areas for the adult fish (depths between 500 and 1000 m along the western slope), are not covered by the survey. Greenland halibut was found in the extended survey area in, on average over all size groups about 24 % of the amount found in the standard survey area by numbers (Table 9.1). The observed distribution pattern in 2013 was similar to those observed in previous years surveys, i.e., mainly in the Bear Island channel towards the Hopen Deep, with some registrations in deep and cold water further east. Figure 9.1 GREENLAND HALIBUT. Distribution in the trawl catches winter 2013 (number per nm 2 ). Zero catches are indicated by black points. The time series of swept area indices by 5 cm length groups for 1990 is presented in Table 9.1. Abundance indices have been low in the whole period, with few signs of improved recruitment in the covered area. However, recruitment from more northern areas has lead to an increase in abundance indices of length groups above 30 cm since about
56 Table 9.1. GREENLAND HALIBUT. Abundance indices from the bottom trawl surveys in the Barents Sea winter 1990 (numbers in thousands) includes only main areas A, B, C and D. Observations outside main areas AS not included. Length group (cm) Biomass Year Total (tons) Add. areas Add.areas/ st.areas (%) Indices raised to also represent the Russian EEZ 2 not scaled for uncovered areas.

57 9.2 Long rough dab Figure 9.2 shows the geographical distribution of long rough dab based on catch rates in bottom trawl. Like in previous years, long rough dab was caught on almost every station in 2013, also in the extended survey area in. It is more evenly spread over its area of distribution than most of the other reported species. This is also reflected in the low relative standard errors (rse) of the abundance indices (Table 9.2). There was an increase in abundance until about 2002, since then most abundance indices have been relatively stable (Figures 9.3ab). The recruitment index has been more variable, with highest values between 2000 and 2006 (Figure 9.3a). Figure 9.2. LONG ROUGH DAB. Distribution in the trawl catches winter 2013 (number per nm 2 ). Zero catches are indicated by black points.
58 Table 9.2 LONG ROUGH DAB. Abundance (N), recruitment (R), total biomass (B), biomass length (L) 25 cm and spawning stock biomass (SSB) indices with relative standard errors (rse) from bottom trawl surveys in the Barents Sea winter 1989 (numbers in millions, biomass in 1000 t) includes only main areas A, B, C and D. Observations outside main areas AS not included. Year N rse(n) R rse(r) B rse(b) B(L 25) rse(b) (L 25) SSB rse(ssb )
59 SSB (index) Recruitement (index) Year Total biomass (index) Biomass L>25cm (index) Year Figure 9.3 LONG ROUGH DAB. Spawning stock biomass, recruitment, total biomass and biomass length (L) 25 cm indices from bottom trawl surveys in the Barents Sea winter 1989 (in 1000 t) includes only main areas A, B, C and D. 59


60 10 Distribution and abundance of capelin, polar cod and blue whiting 10.1 Capelin Although capelin is primarily a pelagic species, small amounts of capelin are normally caught in the bottom trawl throughout most of the investigated area. In Figure 10.1 catch rates of capelin smaller and larger than 14 cm are shown for each of the winter surveys in Capelin smaller than 14 cm during this period will mainly comprise the immature stock component, while the larger capelin constitute the prespawning capelin stock. Some few trawl hauls show large capelin catches (numbers exceeding individuals) and these can probably not be considered representative for the density in the area, because such hauls will either result from hitting a capelin school at the bottom or up in the water column. For this reason, we chose not to present sweptarea based indices for capelin in this report. At this time of the year, mature capelin have started their approach to the spawning areas along the coast of Troms, Finnmark and the Kola peninsula, while immature capelin will normally be found further north and east, in the wintering areas. This is reflected on the maps of capelin distribution, even though some large capelin are always found north of 75 N, and smaller capelin are found sporadically in nearcoastal areas in a couple of years. The geographical coverage of the total capelin stock is incomplete, but the maturing component is probably completely covered. It has been noted during several surveys that when sampling capelin from demersal and pelagic trawls, the individuals from demersal trawls are normally larger (and older) than those sampled pelagically. This has led to the formulation of a hypothesis saying that larger individuals tend to stay deeper than smaller individuals and some even to take up a demersal life. This hypothesis has not been tested, and during the winter surveys there are probably too few pelagic hauls to study the vertical distribution of capelin in a systematic way. Figure CAPELIN. Distribution in the trawl catches winter 2013 (number per nm 2 ). Zero catches are indicated by black points. 60


61 10.2 Polar cod Polar cod are not well represented in the trawl hauls conducted during the winter surveys (Figure 10.2). This reflects the more northern and eastern distribution area of this endemic arctic species. During this time of the year, the polar cod is known to be spawning under the icecovered areas of the Pechora Sea and close to Novaya Semlya. It is not clear whether the concentrations found in open water these years are mature fish either on their way to spawning or from the spawning areas, or this is immature fish. Figure 10.2 POLAR COD. Distribution in the trawl catches winter 2013 (number per nm 2 ). Zero catches are indicated by black points Blue whiting Since 2000 the blue whiting has shown a wider distribution than usual. The echo recordings in 2001 and 2002 indicated unusual high abundance in the Barents Sea, while in 2003 it had decreased somewhat. In the 2004 survey the echo abundance increased again and peaked in Since then it has decreased considerably. Figure 10.3 shows the geographical distribution of the bottom trawl catch rates of blue whiting in Since the fish was mainly found pelagically, the bottom trawls do not reflect the real density distribution, but give some indication of the distribution limits. Acoustic observations would better reflect the relative density distribution. The number of pelagic hauls has, however, been too low to properly separate the pelagic recordings. During the years with high abundance of blue whiting, recordings of pelagic redfish, haddock and small cod might have been masked by dense concentrations of blue whiting. Table 10.3 shows the bottom trawl swept area estimates by 5 cm length groups for the years High abundance of fish below 20 cm in 2001, 2002, 2004, 2005 and 2012 reflects abundant recruiting (age 1) year classes. These recruits are observed in the survey as larger fish in the following years. 61
 Biomass Year 59 1014 1519 2024 2529 3034 3539 4044 Total (tons) 2001 0.1 306.6 1391.3 616.0 44.6 5.3 1.5 0.1 2365 77706 2002 0.0 0.8 434.7 658.1 80.9 18.3 3.1 0.1 1196 58217 2003 0.")

62 Table BLUE WHITING. Abundance indices (swept area estimates) from bottom trawl surveys in the Barents Sea winter 2001 (numbers in millions). Observations outside main areas AS not included. Length group (cm) Biomass Year Total (tons) Additional areas Add. areas/ st.aras (%) Figure 10.3 BLUE WHITING. Distribution in the trawl catches winter 2013 (number per nm 2 ). Zero catches are indicated by black points. 62
63 11 Registrations of other species During the survey fish taxa were recorded (Table 11.1). These include 4 genera and 88 species belonging to 34 families. Of the 92, 50 were recorded all years. Distribution maps of all species caught at the winter survey were presented as a separate report (Wienerroither et al. 2013) similar to the Atlas of the Barents Sea fishes (Wienerroither et al. 2011, based on data from the ecosystem survey). Since the start of the winter survey (1981) the number of fish taxa recorded at the survey has increased mostly due to expansion of the area surveyed and better taxonomic skills and identification keys (Johannesen et al. 2009). During the eight years considered in this report, there was no increasing trend in the number of taxa recorded. Due to dedicated workshops on identification, better identification keys and routines for freezing difficult specimens for later identification on land by taxonomists the fish species identification was good. Still there are some groups that remain problematic, mainly liparids and eelpouts. Table Fish species recorded at the winter survey 2007, all gears included. The number of years each species were recorded is shown and for species not caught all years the capture history (1 = caught and 0 = not caught) are shown in parenthesis for consecutive years Some clear misidentifications have been left out and some may be uncertain (see comment). Order Family Species 63 Number of years caught Myxiniformes Myxinidae Myxine glutinosa 3 (0,1,0,1,1,0,0,0) Squaliformes Dalatiidae Etmopterus spinax 4 (1,1,0,0,1,1,0,0) Somniosus microcephalus 3 (1,0,1,0,1,0,0,0) Rajiformes Arhynchobatidae Bathyraja spinicauda 8 Rajidae Amblyraja hyperborea 7 (1,1,1,1,1,1,0,1) Amblyraja radiata 8 Rajella fyllae 8 Rajella lintea 4 (0,1,1,0,1,0,1,0) Chimaeriformes Chimaeridae Chimaera monstrosa 8 Clupeiformes Clupeidae Clupea harengus 8 Clupea pallasii suworowi 4 (0,1,0,0,1,0,1,1) Osmeriformes Argentinidae Argentina silus 8 Osmeridae Mallotus villosus 8 Salmoniformes Salmonidae Oncorhynchus gorbuscha 1 (0,0,0,0,0,0,0,1) Stomiiformes Sternoptychidae Argyropelecus hemigymnus 2 (0,0,0,1,0,1,0,0) Maurolicus muelleri 8 Aulopiformes Paralepididae Arctozenus risso 8 Myctophiformes Myctophidae unidentified 7 (1,1,1,1,1,1,0,1) Benthosema glaciale 6 (0,0,1,1,1,1,1,1) Gadiformes Macrouridae Macrourus berglax 8 Gadidae Boreogadus saida 8 Gadiculus argenteus 8 Comment
64 Order Family Species Gadus morhua 8 Melanogrammus aeglefinus 8 Merlangius merlangus 8 Micromesistius poutassou 8 Number of years caught Pollachius pollachius 1 (0,0,0,0,0,0,0,1) Pollachius virens 8 Trisopterus esmarkii 8 Trisopterus minutus 1 (0,0,0,1,0,0,0,0) Lotidae Brosme brosme 8 Enchelyopus cimbrius 8 Gaidropsarus argentatus 3 (0,0,1,0,1,0,1,0) Molva molva 8 Phycidae Phycis blennoides 6 (0,0,1,1,1,1,1,1) Ophidiiformes Carapidae Echiodon drummondii 1 (0,0,0,0,0,0,0,1) Lophiiformes Lophiidae Lophius piscatorius 6 (1,1,1,1,0,1,0,1) Gasterosteiformes Gasterosteidae Gasterosteus aculeatus 8 Syngnathiformes Syngnathidae Entelurus aequoreus 2 (1,1,0,0,0,0,0,0) Scorpaeniformes Sebastidae Sebastes mentella 8 Sebastes norvegicus 8 Sebastes viviparus 8 Triglidae Eutrigla gurnardus 7 (1,1,1,0,1,1,1,1) Cottidae Artediellus atlanticus 8 Gymnocanthus tricuspis 3 (0,1,1,0,0,0,0,1) Icelus spp. 8 Myoxocephalus scorpius 6 (1,1,1,1,0,1,0,1) Triglops murrayi 8 Triglops nybelini 5 (1,1,1,1,0,0,0,1) Triglops pingelii 5 (1,1,0,1,1,0,0,1) Psychrolutidae Cottunculus microps 8 Agonidae Agonus cataphractus 1 (0,0,0,0,0,0,1,0) Aspidophoroides olrikii 4 (0,1,0,1,1,0,1,0) Leptagonus decagonus 8 Cyclopteridae Cyclopterus lumpus 8 Eumicrotremus derjugini 2 (0,0,0,0,1,1,0,0) Eumicrotremus spinosus 7 (1,1,1,1,1,1,0,1) Careproctus spp. 8 Liparidae Liparis bathyarcticus 4 (1,1,0,0,0,1,0,1) Comment I. bicornis and I. spatula 64
65 Order Family Species Number of years caught Liparis fabricii 6 (1,1,0,1,1,1,0,1) Liparis liparis 7 (1,1,1,1,1,1,0,1) Liparis montagui 1 (0,0,0,1,0,0,0,0) Liparis tunicatus 2 (0,0,0,1,0,0,0,1) Perciformes Zoarcidae Gymnelus spp. 7 (1,0,1,1,1,1,1,1) Lycenchelys kolthoffi 2 (0,0,0,0,0,0,1,1) Lycenchelys muraena 1 (0,0,0,1,0,0,0,0) Lycenchelys sarsii 2 (0,0,0,0,0,1,1,0) Lycodes esmarkii 8 Lycodes eudipleurostictus 8 Lycodes gracilis 8 Lycodes pallidus 8 Lycodes polaris 1 (0,1,0,0,0,0,0,0) Lycodes reticulatus 8 Lycodes rossi 8 Lycodes seminudus 7 (1,1,1,1,1,1,0,1) Lycodes squamiventer 3 (1,0,0,0,0,1,0,1) Stichaeidae Anisarchus medius 6 (1,0,1,1,1,1,0,1) Leptoclinus maculatus 8 Lumpenus fabricii 1 (0,1,0,0,0,0,0,0) Lumpenus lampretaeformis 8 Anarhichadidae Anarhichas denticulatus 8 Anarhichas lupus 8 Anarhichas minor 8 Ammodytidae Ammodytes spp. 2 (0,1,0,1,0,0,0,0) Centrolophidae Schedophilus medusophagus 1 (0,0,1,0,0,0,0,0) Pleuronectiformes Scophthalmidae Lepidorhombus whiffiagonis 8 Pleuronectidae Glyptocephalus cynoglossus 8 Hippoglossoides platessoides 8 Hippoglossus hippoglossus 8 Limanda limanda 7 (0,1,1,1,1,1,1,1) Microstomus kitt 8 Pleuronectes platessa 8 Reinhardtius hippoglossoides 8 Comment might be misidentified might be misidentified might be misidentified might be misidentified might be misidentified 65
66 12 SUMMARY In later years it has again become obvious that not all species and age groups are properly covered in the enlarged survey area, e.g. young age groups of the strong 2004 and 2005 yearclasses of cod. This will have strong implications on both the consistency of the time series and the quality and uncertainty of the whole assessment and management advice. Good coverage of the whole available distribution area is therefore essential. In the investigated area was enlarged by three new strata in northwest, 2426 (Fig. 2.1). However, the data are so far not included in the estimation of standard abundance indices. Cod The estimates have been variable and increasing in later years, and this may partly be explained by variable and not complete coverage of the distribution area towards north and east in several years. In a considerable amount of cod was found in the extended survey area, about 76 % of the amount found in the standard survey area by numbers and about 15 % by biomass. A higher proportion of cod 19 cm were found in the extended survey area than in the rest of the survey area. These size groups have probably been largely underestimated in later years. Since 2009 more of the largest cod have been found in the northwestern part of the survey area, and this trend is confirmed by the 2013 and estimates. The 2004 and 2005 yearclasses at the moment stand out as the strongest in the time series. Both the 2009 and 2011 yearclasses seemed to be strong as 1year olds, but the 2009 yearclass was reduced to below average level at age 3. Haddock Overall, the survey tracks both strong and poor yearclasses fairly well. In later years, the 2009, 2011 and 2013 yearclasses are stronger than the 2007, 2008, 2010 and 2012 yearclasses. The strong yearclasses have dominated in both the acoustic and bottom trawl indices. Compared to cod a much lower proportion of haddock was found in the extended survey area, about 10 % of the amount found in the standard survey area by numbers and about 6 % by biomass. Redfish Also S. norvegicus was found in the extended survey area in, about 40 % of the amount found in the standard survey area by numbers. The indices have remained low since 1999 for all length groups. This indicates that at least the last fifteen year classes are very weak. A smaller proportion of S. mentella was found in the extended survey area in, only about 7 % of the amount found in the standard survey area by numbers. Since both recruitment and the number of larger S. mentella has been at a fairly high level. There was a large and unexplained increase in the indices for most size groups of S. viviparus from 2013 to, and the total index is the highest in the time series back to
67 Greenland halibut The most important distribution areas for the adult fish are not covered by the survey. Greenland halibut was found in the extended survey area in, on average over all size groups about 24 % of the amount found in the standard survey area by numbers. Recruitment from more northern areas has lead to an increase in abundance indices of length groups above 30 cm since about Long rough dab Like in previous years, long rough dab was caught on almost every station in 2013, also in the extended survey area in. It is more evenly spread over its area of distribution than most of the other reported species. This is also reflected in the low CVs of the abundance indices. Capelin No quantitative acoustic or trawl indices have been calculated for capelin. Capelin is normally found throughout the investigated area; mainly immature fish is found north of 74 N while maturing, prespawning fish is found south of this latitude. The mapped distribution of capelin in bottom trawl seems to correspond well with the distribution of capelin in cod stomachs. An interesting feature is that the smallest cod, which generally eat small amount of capelin, seem to contain more capelin in the northern areas than in the southern. This probably reflects the length distribution of capelin: smaller capelin in the north are more suitable as food for smaller cod, while small and large capelin in the total distribution area constitute a major prey item for larger cod. Polar cod Polar cod are not well represented in the trawl hauls during the winter survey. This reflects the more northern and eastern distribution area of this endemic arctic species. During this time of the year, the polar cod is known to be spawning under the icecovered areas. Blue whiting The echo abundance of blue whiting in the survey area peaked in Since then it has decreased considerably. High abundance of fish below 20 cm, e.g. in 2012, reflects abundant recruiting (age 1) year classes. 67
68 13 REFERENCES Aglen, A. and Nakken, O Improving time series of abundance indices applying new knowledge. Fisheries Research, 30: Aglen, A., Dingsør, G., Mehl, S., Murashko, P. and Wenneck, T. de L Results from the Joint IMR PINRO Barents Sea demersal fish survey 21 January 15 March WD #3 ICES Arctic Fisheries Working Group, Copenhagen, Denmark 2026 April Aschan, M. and Sunnanå, K Evaluation of the Norwegian shrimp surveys conducted in the Barents Sea and Svalbard area ICES C M 1997/Y:07. 24pp. Bogstad, B., Fotland, Å. and Mehl, S A revision of the abundance indices for cod and haddock from the Norwegian winter survey in the Barents Sea, Working Document, ICES Arctic Fisheries Working Group, 23 August 1 September Dalen, J. and Nakken, O On the application of the echo integration method. ICES CM 1983/B: 19, 30 pp. Dalen, J. and Smedstad, O Acoustic method for estimating absolute abundance of young cod and haddock in the Barents Sea. ICES CM 1979/G:51, 24pp. Dalen, J. and Smedstad, O Abundance estimation of demersal fish in the Barents Sea by an extended acoustic method. In Nakken, O. and S.C. Venema (eds.), Symposium on fisheries acoustics. Selected papers of the ICES/FAO Symposium on fisheries acoustics. Bergen, Norway, 2124 June FAO Fish Rep., (300): Dickson, W. 1993a. Estimation of the capture efficiency of trawl gear. I: Development of a theoretical model. Fisheries Research 16: Dickson, W. 1993b. Estimation of the capture efficiency of trawl gear. II: Testing a theoretical model. Fisheries Research 16: Dolgov, A. V., Yaragina, N.A., Orlova, E.L., Bogstad, B., Johannesen, E., and Mehl, S th anniversary of the PINROIMR cooperation in the investigations of feeding in the Barents Sea results and perspectives. Pp in Longterm bilateral RussianNorwegian scientific cooperation as a basis for sustainable management of living marine resources in the Barents Sea. Proceedings of the 12th Norwegian Russian symposium, Tromsø, 2122 August IMR/PINRO report series 5/2007, 212 pp. Engås, A Trålmanual Campelen Versjon 1, 17. januar 1995, Havforskningsinstituttet, Bergen. 16 s. (upubl.). Engås, A. and Godø, O.R Escape of fish under the fishing line of a Norwegian sampling trawl and its influence on survey results. Journal du Conseil International pour l'exploration de la Mer, 45: Engås, A. and Ona, E Experiences using the constraint technique on bottom trawl doors. ICES CM 1993/B:18, 10pp. Foote, K.G Fish target strengths for use in echo integrator surveys. Journal of the Acoustical Society of America, 82: Godø, O.R. and Sunnanå, K Size selection during trawl sampling of cod and haddock and its effect on abundance indices at age. Fisheries Research, 13: Jakobsen, T., Korsbrekke, K., Mehl, S. and Nakken, O Norwegian combined acoustic and bottom trawl surveys for demersal fish in the Barents Sea during winter. ICES CM 1997/Y: 17, 26 pp. Johannesen, E., Wenneck, T. de L., Høines, Å., Aglen, A., Mehl, S., Mjanger, H., Fotland, Å., Halland, T. I. and Jakobsen, T Egner vintertoktet seg til overvåking av endringer i fiskesamfunnet i Barentshavet? En gjennomgang av metodikk og data fra Fisken og Havet nr. 7/ s. Korneliussen, R. J., Ona, E., Eliassen, I., Heggelund, Y., Patel, R., Godø, O.R., Giertsen, C., Patel, D., Nornes, E., Bekkvik, T., Knudsen, H. P., Lien, G The Large Scale Survey System LSSS. Proceedings of the 29th Scandinavian Symposium on Physical Acoustics, Ustaoset 29 January 1 February Korsbrekke, K Brukerveiledning for TOKT312 versjon 6.3. Intern program dok., Havforskningsinstituttet, september s. (upubl.). 68
69 Korsbrekke, K., Mehl, S., Nakken, O. og Sunnanå, K Bunnfiskundersøkelser i Barentshavet vinteren Fisken og Havet nr , Havforskningsinstituttet, 86 s. Knudsen, H.P The Bergen Echo Integrator: an introduction. Journal du Conseil International pour l Exploration de la Mer, 47: MacLennan, D.N. and Simmonds, E.J Fisheries Acoustics. Chapman Hall, London, England. 336pp. Mehl, S., and Yaragina, N.A Methods and results in the joint PINROIMR stomach sampling program. Pp. 516 in Bogstad, B. and Tjelmeland, S. (eds.): Interrelations between fish populations in the Barents Sea. Proceedings of the fifth PINROIMR Symposium, Murmansk, 1216 August Institute of Marine Research, Bergen, Norway. Mehl, S., Aglen, A., Alexandrov, D.I., Bogstad, B., Dingsør, G.E., Gjøsæter, H., Johannesen, E., Korsbrekke, K., Murashko, P.A., Prozorkevich, D.V., Smirnov, O.V., Staby, A., and Wenneck, T. de Lange, Fish investigations in the Barents Sea winter IMRPinro Joint Report Series 12013, 97 pp. Mjanger, H., Hestenes, K., Svendsen, B.V., and Wenneck, T. del.. Håndbok for prøvetaking av fisk og krepsdyr. Versjon 3.16 juni. Havforskningsinstituttet, Bergen. 199s. Wienerroither R, Johannesen E, Dolgov A, Byrkjedal I, Bjelland O, Drevetnyak K, Eriksen KB, Høines Å, Langhelle G, Langøy H, Prokhorova T, Prozorkevich D, Wenneck TdL Atlas of the Barents Sea Fishes. IMR/PINRO Joint Report Series 12011, ISSN Wienerroither R, Johannesen E, Dolgov A, Byrkjedal I, Aglen A, Bjelland O, Drevetnyak K, Eriksen KB, Høines Å, Langhelle G, Langøy H, Murashko P, Prokhorova T, Prozorkevich D, Smirnov O, Wenneck TdL Atlas of the Barents Sea Fishes based on the winter survey. IMRPINRO Joint Report Series ISSN
70 Appendix 1. Annual survey reports 1981 Dalen, J., Hylen, A. og Smedstad, O. M Intern toktrapport unummerert. Havforskningsinstituttet. Dalen, J., Hylen, A., Jakobsen, T., Nakken, O., Randa, K. and Smedstad, O Norwegian investigations on young cod and haddock in the Barents Sea during the winter ICES CM 1982/G: 41, 20 pp. Dalen, J., Hylen, A., Jakobsen, T., Nakken, O., Randa, K., and Smedstad, O Preliminary report of the Norwegian investigations on young cod and haddock in the Barents Sea during the winter ICES CM 1983/G:15, 23 pp Dalen, J., Hylen, A., Jakobsen, T., Nakken, O. and Randa, K Preliminary report of the Norwegian Investigations on young cod and haddock in the Barents Sea during the winter ICES CM 1984/G:44, 26 pp Hylen, A., Jakobsen, T., Nakken, O. and Sunnanå, K Preliminary report of the Norwegian Investigations on young cod and haddock in the Barents Sea during the winter ICES CM 1985/G:68, 28 pp. Hylen, A., Jakobsen, T., Nakken, O., Nedreaas, K. and Sunnanå, K Preliminary report of the Norwegian Investigations on young cod and haddock in the Barents Sea. ICES CM 1986/G:76, 25 pp. Godø, O. R., Hylen, A., Jacobsen, J. A., Jakobsen, T., Mehl, S., Nedreaas, K. and Sunnanå, K Estimates of stock size of Northeast Arctic cod and haddock from survey data 1986/1987. ICES CM 1987/G: 37. Hylen, A., Jacobsen, J.A., Jakobsen, T., Mehl, S., Nedreaas,K. and Sunnanå, K Estimates of stock size of Northeast Arctic cod and haddock, Sebastes mentella and Sebastes marinus from survey data, winter ICES CM 1988/G: 43. Jakobsen,T., Mehl,S., Nakken,O., Nedreaas,K. and Sunnanå,S Estimates of stock size of Norteast Arctic cod and haddock, Sebastes mentella and Sebastes marinus from survey data, winter ICES CM 1989/G: 42. Jakobsen, T., Mehl, S. og Nedreaas, K Kartlegging av mengde og utbredelse av torsk, hyse og uer i Barentshavet januar mars Intern toktrapport, Senter for marine ressurser, Havforskningsinstituttet, Bergen. Engelsk abstract, tabell og figurtekster. 29 s. (upubl.). Hylen, A., Jakobsen, T., Mehl, S., og Nedreaas, K Undersøkelser av torsk, hyse og uer i Barentshavet vinteren Intern toktrapport nr , Senter for marine ressurser, Havforskningsinstituttet, Bergen. Engelsk abstract, tabell og figurtekster. 30 s. (upubl.). Godø, O.R., Jakobsen, T., Mehl, S., Nedreaas, K. og Raknes, A Undersøkelser av torsk, hyse og uer i Barentshavet vinteren Intern toktrapport 39/92, Senter for marine ressurser, Havforskningsinstituttet, Bergen. Engelsk abstract, tabell og figurtekster. 33 s. (upubl.). Korsbrekke, K., Mehl, S., Nakken, O. and Nedreaas, K Bunnfiskundersøkelser i Barentshavet vinteren Rapp. Senter Marine Ressurser nr Engelsk abstract, tabell og figurtekster. 47s. Havforskningsinstituttet, Bergen. Mehl, S. og Nakken, O Bunnfiskundersøkelser i Barentshavet vinteren Fisken Hav (6) s. Havforskningsinstituttet, Bergen. Korsbrekke, K., Mehl, S., Nakken, O. og Sunnanå, K Bunnfiskundersøkelser i Barentshavet vinteren Fisken Hav (13) s. Havforskningsinstituttet, Bergen. Mehl, S. og Nakken, O Botnfiskundersøkingar i Barentshavet vinteren Fisken Hav (11) s. Havforskingsinstituttet, Bergen. Mehl, S Botnfiskundersøkingar i Barentshavet (norsk sone) vinteren Fisken Hav (11) s. Havforskingsinstituttet, Bergen. Mehl, S Botnfiskundersøkingar i Barentshavet (redusert område) vinteren Fisken Hav (7) s. Havforskingsinstituttet, Bergen. Mehl, S Botnfiskundersøkingar i Barentshavet vinteren FiskenHav (13) s. Havforskingsinstituttet, Bergen. Aglen, A., Drevetnyak, K., Jakobsen, T., Korsbrekke, K., Lepesevich, Y., Mehl, S., Nakken, O. and Nedreaas, K Investigations on demersal fish in the Barents Sea winter Detailed report. IMRPINRO Joint Report Series no. 5, pp. 70
71 Aglen, A., Alvsvåg, J, Korsbrekke, K., Lepesevich, Y., Mehl, S., Nedreaas, K., Sokolov, K. And Ågotnes, P Investigations on demersal fish in the Barents Sea winter Detailed report. IMRPINRO Joint Report Series no , 66 pp. Aglen, A., Alvsvåg, J., Drevetnyak, K, Høines, Å., Korsbrekke, K., Mehl, S., and Sokolov, K Investigations on demersal fish in the Barents Sea winter Detailed report. IMR/PINRO Joint report series no 6, pp. Aglen, A., Alvsvåg, J., Halland, T.I., Høines, Å., Nakken, O., Russkikh, A., and., Smirnov, O Investigations on demersal fish in the Barents Sea winter Detailed report. IMR/PINRO Joint report series no 1, pp. Aglen, A., Alvsvåg, J., Høines, Å., Korsbrekke, K., Smirnov, O., and Zhukova, N., Investigations on demersal fish in the Barents Sea winter Detailed report. IMR/PINRO Joint report series no 5/2004, ISSN pp. Aglen, A., Alvsvåg, J., Grekov, A., Høines, Å., Mehl, S., and Zhukova, N Investigations of demersal fish in the Barents Sea winter IMR/PINRO Joint Report Series, No 4/2005. ISSN , 58 pp. Aglen, A., Alvsvåg, J., Høines, Å., Johannesen, E. and Mehl, S Investigations on demersal fish in the Barents Sea winter Detailed report. Fisken og Havet nr. 13/ pp. Aglen, A Report from demersal fish survey in the Barents Sea FebruaryMarch WD #8 ICES Arctic Fisheries Working Group, Vigo, Spain 1928 April Aglen, A., Høines, Å., Mehl, S., Prozorkevich, D., Smirnov, O. and Wenneck, T. de L Results from the Joint IMRPINRO Barents Sea demersal fish survey 25 January 14 March WD #16 ICES Arctic Fisheries Working Group, ICES Headquarters 2129 April Aglen, A., Alexandrov, D., Høines, Å., Mehl, S., Prozorkevich, D. and Wenneck, T. de L Results from the Joint IMRPINRO Barents Sea demersal fish survey 1 February 15 March WD #11 ICES Arctic Fisheries Working Group, SanSebastian, Spain 2127 April Aglen, A., Alexandrov, D., Gjøsæter, H., Johannesen, E., Mehl, S. and Wenneck, T. de L Results from the Joint IMRPINRO Barents Sea demersal fish survey 1 February 17 March WD #15 ICES Arctic Fisheries Working Group, Lisbon, Portugal/Bergen, Norway 2228 April Aglen, A., Alexandrov, D., Gjøsæter, H., Johannesen, E. and Mehl, S Results from the Joint IMRPINRO Barents Sea demersal fish survey 1 February 14 March WD #3 ICES Arctic Fisheries Working Group, Hamburg, Germany 28 April 4 May Aglen, A., Dingsør, G., Mehl, S., Murashko, P. and Wenneck, T. de L Results from the Joint IMR PINRO Barents Sea demersal fish survey 21 January 15 March WD #3 ICES Arctic Fisheries Working Group, Copenhagen, Denmark 2026 April Aglen, A., Dingsør, G., Godiksen, J., Gjøsæter, H., Johannesen, E. and Murashko, P Results from the Joint IMRPINRO Barents Sea demersal fish survey 1 February 13 March WD #3 ICES Arctic Fisheries Working Group, Copenhagen, Denmark 1824 April Aglen, A., Godiksen, J., Gjøsæter, H., Mehl, S., Russkikh, A. and Wenneck, T. de L.. Results from the Joint IMRPINRO Barents Sea demersal fish survey 22 January 8 March. WD #3 ICES Arctic Fisheries Working Group, Lisbon, Portugal 2329 April. 71
72 Appendix 2. Changes in survey design, methods, gear etc. Year Change from To 1984 Representative age sample, 100 per station Stratified age sample, 5 per 5cm length group research vessel, 2 commercial trawlers 2 research vessels, 1 commercial trawler min. tow duration 30 min. tow duration 1989 Bobbins gear Rockhopper gear (time series adjusted for cod and haddock) 1990 Random stratified bottom trawl stations Simrad EK400 echo sounder 1993 TS = 21.8 log L 74.9 for cod and haddock Fixed survey area (A,B,C,D), 1 strata system, 35 strata Fixed station grid, 20 nm distance No constraint technique (strapping) on bottom trawl doors 5 age samples per 5cm group, 2 per stratum Weighting of agelength keys by total catch mm mesh size in codend Strapping on some hauls Hull mounted transducers 1995 Variable use of trawl sensors Constant effective fishing width of the trawl Strapping on every 3. haul 2 research vessels, 1 commercial trawler strata systems and 63 strata, 20/30/40 nm distance 2 age samples per 5cm group, 4 per stratum Fixed station grid, 20 nm distance Simrad EK500 echo sounder and BEI post processing TS = 20 log L 68 for all demersal species (time series corrected) Extended, variable survey area (A,B,C,D,D,E,S) 2 strata systems, strata Fixed station grid, 20/30/40 nm distance Constraint technique on some bottom trawl hauls 2 age samples per 5cm group, 4 per stratum (cod and haddock) Weighting of ALK by swept area estimate 22 mm mesh size in codend Strapping on every 3. haul Keel mounted transducers Johan Hjort Trawl manual specifying use of sensors Fish size dependent effective fishing width (time series corrected) Strapping on every 2. haul 3 research vessels 1 strata system and 23 strata, 16/24/32 nm distance 1 age sample per 5cm group, all stations with > 10 specimens (cod and haddock) 20 nm distance Keel mounted transducers G.O. Sars (Sarsen) Strapping on every haul 20/30 nm distance 2 Norwegian and 1 Russian research vessel /24/32 nm distance Hull mounted transducers 1998 Strapping on every 2. haul 20 nm distance Norwegian research vessels /30 nm distance station grid 16/20/24/32 nm distance station grid 2003 Trawl eye for opening and bottom contact Height trawl sensor for opening and bottom contact Vaco trawl doors EK 500 and BEI Sarsen EK 500 and BEI EK 500 Standard Campelen rigging V trawl doors V trawl doors 30 min. tow duration V doors G.O. Sars and Johan Hjort ER60 and LSSS G.O. Sars ER60 and LSSS Johan Hjort ER60 Russian vessels Tromsø rigging on Norwegian vessels Thyborøn doors Jan Mayen/Helmer Hanssen Thyborøen doors G.O. Sars and Johan Hjort 15 min. tow duration 72
73 Appendix 3. Scientific participants Johan Hjort Vilnyus Johan Hjort Helmer Hanssen Fridtjof Nansen G. Bakke I.M. Beck O.S. Fossheim H. Gjøsæter J. Godiksen T. Haugland E. Hermansen E. Holm Å. Husebø C. Irgens E. Johannesen M. Johannessen A. Kristiansen G. Lien J.E. Nygaard B. Røttingen J. Røttingen J. Saltskår S.E. Seim J.H. Simonsen A. Staby A. Storaker A. Sæverud J. Vedholm To be added A. Aglen J. Alvarez L. Drivenes K.A. Gamst J. Godiksen I. Henriksen E. Hermansen E. Holm Å. Husebø J.D. Johansen A.L. Johnsen K.E. Karlsen H.M. Langøen G. Lien G.J. Macaulay S. Mehl M. Mjanger J.E. Nygaard I. Nymark S.E. Seim L. Solbakken J. Vedholm A. Aasen A.K. Abrahamsen G. Bakke K. Fjellheim H. Gjøsæter K. Hansen T. Haugland C. Irgens S. Karlson A. Kristiansen J. Kristiansen F. Midtøy E. Odland J. Saltskåt S.E. Seim A. Storaker T. de L. Wenneck To be added Cruise leaders in bold 73
74
75
 6 Knipovich Street, 183763")
76 Institute of Marine Research Nordnesgaten 50, 5817 Bergen Norway Polar Research Institute of Marine Fisheries and Oceanography (PINRO) 6 Knipovich Street, Murmansk Russia
Fish investigations in the Barents Sea winter 2016
 J O I N IMR/PINRO T R E 4 2016 P O R T S E I E R S Fish investigations in the Barents Sea winter 2016 Sigbjørn Mehl, Asgeir Aglen, Bjarte Bogstad, Gjert Dingsør, Knut Korsbrekke, Erik Olsen, Arved Staby,
Fish investigations in the Barents Sea winter 2017 IMR/PINRO
 J O I N IMR/PINRO T R E 3 2017 P O R T S E I E R S Fish investigations in the Barents Sea winter 2017 Sigbjørn Mehl, Asgeir Aglen, Bjarte Bogstad, Arved Staby, Thomas de Lange Wenneck and Rupert Wienerroither
Sigbjørn Mehl, Asgeir Aglen ans Espen Johnsen Institute of Marine Research P.O. Box 1870 Nordnes, N-5817 Bergen, Norway
 FISKEN OG HAVET nr. 10/2016 Re-estimation of swept area indices with CVs for main demersao Àsh species in the Barents Sea winter survey 1994 2016 applying the Sea2Data StoX software Sigbjørn Mehl, Asgeir
3.3.3 Capelin (Mallotus villosus) in subareas 1 and 2 (Northeast Arctic), excluding Division 2.a west of 5 W (Barents Sea capelin)
 in subareas 1 and 2 (Northeast Arctic), excluding Division 2.a west of 5 W (Barents Sea capelin)") ICES Advice on fishing opportunities, catch, and effort Barents Sea and Norwegian Sea Ecoregions Published 11 October 2016 3.3.3 Capelin (Mallotus villosus) in subareas 1 and 2 (Northeast Arctic), excluding
ICES Advice on fishing opportunities, catch, and effort Barents Sea and Norwegian Sea Ecoregions Published 11 October 2016 3.3.3 Capelin (Mallotus villosus) in subareas 1 and 2 (Northeast Arctic), excluding
Lemon sole (Microstomus kitt) in Subarea 4 and divisions 3.a and 7.d (North Sea, Skagerrak and Kattegat, eastern English Channel)
 in Subarea 4 and divisions 3.a and 7.d (North Sea, Skagerrak and Kattegat, eastern English Channel)") ICES Advice on fishing opportunities, catch, and effort Greater North Sea Ecoregion Published 30 June 2017 DOI: 10.17895/ices.pub.3153 Lemon sole (Microstomus kitt) in Subarea 4 and divisions 3.a and 7.d
ICES Advice on fishing opportunities, catch, and effort Greater North Sea Ecoregion Published 30 June 2017 DOI: 10.17895/ices.pub.3153 Lemon sole (Microstomus kitt) in Subarea 4 and divisions 3.a and 7.d
8.4.9 Advice June Baltic Sea Flounder in Subdivisions (Baltic Sea)
") 8.4.9 Advice June 2012 ECOREGION STOCK Baltic Sea Flounder in Subdivisions 22 32 (Baltic Sea) Advice for 2013 Based on the ICES approach for data-limited stocks, ICES advises that catches should be no
8.4.9 Advice June 2012 ECOREGION STOCK Baltic Sea Flounder in Subdivisions 22 32 (Baltic Sea) Advice for 2013 Based on the ICES approach for data-limited stocks, ICES advises that catches should be no
Abstract. 1 Introduction. 2 Materials and Methods
 NOT TO BE CITED WITHOUT PRIOR REFERENCE TO THE AUTHOR(S) Northwest Atlantic Fisheries Organization Serial No. N5637 NAFO SCR Doc. 09/11 SCIENTIFIC COUNCIL MEETING JUNE 2009 Stock Abundance Indices and
ICES advice for 2018: widely distributed pelagic stocks. Carmen Fernández, ICES ACOM vice-chair For PelAC (The Hague, October 4, 2017)
") ICES advice for 2018: widely distributed pelagic stocks Carmen Fernández, ICES ACOM vice-chair For PelAC (The Hague, October 4, 2017) Basis of ICES Advice Management Basis Plan for / ICES Strategy Advice
ICES advice for 2018: widely distributed pelagic stocks Carmen Fernández, ICES ACOM vice-chair For PelAC (The Hague, October 4, 2017) Basis of ICES Advice Management Basis Plan for / ICES Strategy Advice
Sebastes marinus in Subareas I and II
 3...b Sebastes marinus in Subareas I and II State of stock/exploitation: It has not been possible to assess the state of this stock with respect to safe biological limits. Available data from the Barents
Saithe (Pollachius virens) in Subareas I and II (Northeast Arctic)
 in Subareas I and II (Northeast Arctic)") ICES Advice on fishing opportunities, catch and effort Barents Sea and Norwegian Sea Ecoregions Published 12 June 2015 3.3.10 Saithe (Pollachius virens) in Subareas I and II (Northeast Arctic) ICES stock
ICES Advice on fishing opportunities, catch and effort Barents Sea and Norwegian Sea Ecoregions Published 12 June 2015 3.3.10 Saithe (Pollachius virens) in Subareas I and II (Northeast Arctic) ICES stock
5 Plaice, turbot, dab, and brill in the Baltic
 ICES WGBFAS REPORT 2012 259 5 Plaice, turbot, dab, and brill in the Baltic The landing data of plaice, turbot, dab, and brill according to ICES Subdivisions and countries are presented in Tables 5.1 5.4.
Flounder (Platichthys flesus) in Subarea 4 and Division 3.a (North Sea, Skagerrak and Kattegat)
 in Subarea 4 and Division 3.a (North Sea, Skagerrak and Kattegat)") ICES Advice on fishing opportunities, catch, and effort Greater North Sea Ecoregion Published 30 June 2017 DOI: 10.17895/ices.pub.3113 Flounder (Platichthys flesus) in Subarea 4 and Division 3.a (North
ICES Advice on fishing opportunities, catch, and effort Greater North Sea Ecoregion Published 30 June 2017 DOI: 10.17895/ices.pub.3113 Flounder (Platichthys flesus) in Subarea 4 and Division 3.a (North
Brill (Scophthalmus rhombus) in Subarea 4 and divisions 3.a and 7.d e (North Sea, Skagerrak and Kattegat, English Channel)
 in Subarea 4 and divisions 3.a and 7.d e (North Sea, Skagerrak and Kattegat, English Channel)") ICES Advice on fishing opportunities, catch, and effort Celtic Seas and Greater North Sea Ecoregions Published 30 June 2017 DOI: 10.17895/ices.pub.3058 Brill (Scophthalmus rhombus) in Subarea 4 and divisions
ICES Advice on fishing opportunities, catch, and effort Celtic Seas and Greater North Sea Ecoregions Published 30 June 2017 DOI: 10.17895/ices.pub.3058 Brill (Scophthalmus rhombus) in Subarea 4 and divisions
Cruise Report. International Acoustic Survey for Pelagic Fish Stocks in the North Sea FRV SOLEA Cruise No.
 Johann Heinrich von Thünen Institute, Federal Research Institute for Rural Areas Forestry and Fisheries (vti). Institute of Sea Fisheries Cruise Report International Acoustic Survey for Pelagic Fish Stocks
SCIENTIFIC COUNCIL MEETING JUNE 2011
 NOT TO BE CITED WITHOUT PRIOR REFERENCE TO THE AUTHOR(S) Northwest Atlantic Fisheries Organization Serial No. N598 NAFO SCR Doc. 11/24 SCIENTIFIC COUNCIL MEETING JUNE 211 Biomass and Abundance of Demersal
Fine and broad (ocean basin) scale acoustic observations of mid-trophic fishes, potential and challenges
 scale acoustic observations of mid-trophic fishes, potential and challenges") Fine and broad (ocean basin) scale acoustic observations of mid-trophic fishes, potential and challenges Rudy Kloser Tim Ryan Jock Young Mark Lewis Acknowledgements Graham Patchell and Les Scott Petuna
Fine and broad (ocean basin) scale acoustic observations of mid-trophic fishes, potential and challenges Rudy Kloser Tim Ryan Jock Young Mark Lewis Acknowledgements Graham Patchell and Les Scott Petuna
202 ICES NWWG REPORT 2012
 202 ICES NWWG REPORT 2012 8 Icelandic saithe 8.1 Summary The assessment model is a separable statistical catch-at-age model implemented in AD Model Builder. Selectivity is age-specific and varies between
Report of the North Western Working Group (NWWG)
") ICES NWWG REPORT 2017 ICES ADVISORY COMMITTEE ICES CM 2017/ACOM:08 REF. ACOM Report of the North Western Working Group (NWWG) 27 April 4 May 2017 Copenhagen, Denmark International Council for the Exploration
ICES NWWG REPORT 2017 ICES ADVISORY COMMITTEE ICES CM 2017/ACOM:08 REF. ACOM Report of the North Western Working Group (NWWG) 27 April 4 May 2017 Copenhagen, Denmark International Council for the Exploration
This paper not to be cited without prior reference to the author. C.M. 1980/H:41 Pelagic Fish (Northern) Committee Ref. Pelagic Fish (S) Committee
 Committee Ref. Pelagic Fish (S) Committee") This paper not to be cited without prior reference to the author Internationl Councilfor the Exploration of the Sea C.M. 1980/H:41 Pelagic Fish (Northern) Committee Ref. Pelagic Fish (S) Committee Distribution
This paper not to be cited without prior reference to the author Internationl Councilfor the Exploration of the Sea C.M. 1980/H:41 Pelagic Fish (Northern) Committee Ref. Pelagic Fish (S) Committee Distribution
Serial No. N6426 SCS Doc. 15/06 SCIENTIFIC COUNCIL MEETING 2015 PORTUGUESE RESEARCH REPORT FOR 2014
 Northwest Atlantic Fisheries Organization Serial No. N6426 SCS Doc. 15/06 SCIENTIFIC COUNCIL MEETING 2015 PORTUGUESE RESEARCH REPORT FOR 2014 by J. Vargas, R. Alpoim, E. Santos and A. M. Ávila de Melo
GEAR SWITCHING AND TRAWL SABLEFISH AREA MANAGEMENT PRELIMINARY DATA
 Agenda Item H.2 Attachment 1 March 2018 GEAR SWITCHING AND TRAWL SABLEFISH AREA MANAGEMENT PRELIMINARY DATA This document provides some of the preliminary data developed on gear switching and trawl sablefish
2014 Gag Update Summary
 2014 Gag Update Summary The SEDAR 10 gag assessment was updated in 2014 with data through 2012. The methodologies and historical data between the two assessments remained mostly consistent, with a few
(IMARES - institute for Marine Resources & Ecosystem Studies)Report number C123/09
Report number C123/09") Jack-Mackerel stock assessment simulation Niels T. Hintzen Report number C123/09 IMARES Wageningen UR (IMARES - institute for Marine Resources & Ecosystem Studies)Report number C123/09 Client: Pelagic
Jack-Mackerel stock assessment simulation Niels T. Hintzen Report number C123/09 IMARES Wageningen UR (IMARES - institute for Marine Resources & Ecosystem Studies)Report number C123/09 Client: Pelagic
Vehicle Safety Risk Assessment Project Overview and Initial Results James Hurnall, Angus Draheim, Wayne Dale Queensland Transport
 Vehicle Safety Risk Assessment Project Overview and Initial Results James Hurnall, Angus Draheim, Wayne Dale Queensland Transport ABSTRACT The goal of Queensland Transport s Vehicle Safety Risk Assessment
Information Collection in Energy Efficiency for Fisheries (ICEEF2011)
") CNR-ISMAR, Ancona (Italy) Information Collection in Energy Efficiency for Fisheries (ICEEF2011) International Fishing Fair 2011 Ancona, Italy Visit report Project Responsible: Antonello Sala Rapporteur:
CNR-ISMAR, Ancona (Italy) Information Collection in Energy Efficiency for Fisheries (ICEEF2011) International Fishing Fair 2011 Ancona, Italy Visit report Project Responsible: Antonello Sala Rapporteur:
FROSTFISH (FRO) (Lepidopus caudatus) Para, Taharangi, Hikau
 (Lepidopus caudatus) Para, Taharangi, Hikau") FROSTFISH (FRO) (Lepidopus caudatus) Para, Taharangi, Hikau 1. FISHERY SUMMARY 1.1 Commercial fisheries Frostfish are predominantly taken as bycatch from target trawl fisheries on jack mackerel and hoki
FROSTFISH (FRO) (Lepidopus caudatus) Para, Taharangi, Hikau 1. FISHERY SUMMARY 1.1 Commercial fisheries Frostfish are predominantly taken as bycatch from target trawl fisheries on jack mackerel and hoki
Hydro Plant Risk Assessment Guide
 September 2006 Hydro Plant Risk Assessment Guide Appendix E8: Battery Condition Assessment E8.1 GENERAL Plant or station batteries are key components in hydroelectric powerplants and are appropriate for
2009 Stock Assessment Report for Atlantic Striped Bass
 2009 Stock Assessment Report for Atlantic Striped Bass A report prepared by the Atlantic Striped Bass Technical Committee Accepted for management use November 2009 Healthy, self-sustaining populations
SOLENT OYSTER FISHERY
 SOLENT OYSTER FISHERY 2015 Stock Report Baird Dredge 9 th -15 th July 2015 Report compiled by Richard Gibbs AKNOWLEDGEMENTS Thanks to the following people for providing assistance during the survey: David
Underwater Acoustics. History and latest technology. Science and Geopolitcs of Himmalaya- Arctic- Antarctic. Tonny Algroey, Kongsberg Maritime
 Underwater Acoustics History and latest technology Science and Geopolitcs of Himmalaya- Arctic- Antarctic Tonny Algroey, Kongsberg Maritime Agenda Introduction to KONGSBERG Underwater acoustics what is
Vehicle Scrappage and Gasoline Policy. Online Appendix. Alternative First Stage and Reduced Form Specifications
 Vehicle Scrappage and Gasoline Policy By Mark R. Jacobsen and Arthur A. van Benthem Online Appendix Appendix A Alternative First Stage and Reduced Form Specifications Reduced Form Using MPG Quartiles The
Mackerel Gramme Size Analysis
 Monitoring Compliance with the Landing Obligation in Pelagic Fisheries Project on Mackerel Gramme Size Analysis PELAC WORKING GROUP II 11 JULY 2017, THE HAGUE EFCA Unit 2 Programmes and Assistance Contents
FORECASTS OF THE 1998 SOCKEYE SALMON RUNS TO BRISTOL BAY
 FRI-UW-9710 October 1997 FISHERIES RESEARCH INSTITUTE School of Fisheries University of Washington Seattle, Washington 98195 FORECASTS OF THE 1998 SOCKEYE SALMON RUNS TO BRISTOL BAY D.E. ROGERS ANNUAL
EU, Norway, and the Faroe Islands request concerning long-term management strategy for mackerel in the Northeast Atlantic
 ICES Special Request Advice Ecoregions in the Northeast Atlantic and Arctic Ocean Published 29 September 2017 DOI: 10.17895/ices.pub.3031 EU, Norway, and the Faroe Islands request concerning long-term
Fisheries Research Services Internal Report No. 01/07
 Not to be quoted without prior reference to the authors Crown Copyright 200 Fisheries Research Services Internal Report No. 01/0 AN ENGINEERING PERFORMANCE OF 2 SINGLE TRAWLS USED BY THE SCOTTISH UNDER
1 Background and definitions
 EUROPEAN COMMISSION DG Employment, Social Affairs and Inclusion Europe 2020: Employment Policies European Employment Strategy Youth neither in employment nor education and training (NEET) Presentation
2015 Carbon footprint JTP. Date of issue: 14 th March 2016
 2015 Carbon footprint JTP Prepared by: Helen Troup Reviewed by: Sarah McCusker Date of issue: 14 th March 2016 Executive summary Carbon Smart 2 Executive summary JTP have seen significant reduction in
Downtown Lee s Summit Parking Study
 Downtown Lee s Summit Parking Study As part of the Downtown Lee s Summit Master Plan, a downtown parking and traffic study was completed by TranSystems Corporation in November 2003. The parking analysis
Propulsion of VLCC Introduction
 Propulsion of VLCC Content Introduction...5 EEDI and Major Ship and Main Engine Parameters...6 Energy efficiency design index (EEDI)...6 Minimum propulsion power...6 Major propeller and engine parameters...7,
Heavy Fuel Oil use by Fishing Vessels in the IMO Polar Code Arctic, 2015
 Briefing 5 Heavy Fuel Oil use by Fishing Vessels in the IMO Polar Code Arctic, 2015 Prepared For: European Climate Foundation Prepared By: Bryan Comer, PhD February, 2018 Table of Contents Introduction...
Habitat Associations of Seabirds and Marine Debris in the North East Pacific at Multiple Spatial Scales
 Habitat Associations of Seabirds and Marine Debris in the North East Pacific at Multiple Spatial Scales Andrew Titmus David Hyrenbach Hawaii Pacific University, Waimanalo, Hawaii Objectives Introduction
FRI-UW-9507 October 1995 DONALD E. ROGERS A REPORT TO THE PACIFIC SEAFOOD PROCESSORS ASSOCIATION
 FRI-UW-957 October 1995 FORECASTS OF THE 1996 SOCKEYE SALMON RUNS TO BRISTOL BAY DONALD E. ROGERS A REPORT TO THE PACIFIC SEAFOOD PROCESSORS ASSOCIATION ACKNOWLEDGMENTS A special thanks to Mrs. Bev Cross
Monitoring the CO 2 emissions from new passenger cars in the EU: summary of data for 2010
 Monitoring the CO 2 emissions from new passenger cars in the EU: summary of data for 2010 EXECUTIVE SUMMARY EEA has collected data submitted by Member States on vehicle registrations in the year 2010,
Field test for the comparison of LNG static and dynamic mass measurement methods
 31 st International North Sea Flow Measurement Workshop 22-25 October 2013 Field test for the comparison of LNG static and dynamic mass measurement methods Tore Mortensen, Justervesenet Henning Kolbjørnsen,
Residential Lighting: Shedding Light on the Remaining Savings Potential in California
 Residential Lighting: Shedding Light on the Remaining Savings Potential in California Kathleen Gaffney, KEMA Inc., Oakland, CA Tyler Mahone, KEMA, Inc., Oakland, CA Alissa Johnson, KEMA, Inc., Oakland,
Aglantha digitale in the Eastern North Pacific. Moira Galbraith - Institute of Ocean Sciences Mary Arai Pacific Biological Station Emeritus
 Aglantha digitale in the Eastern North Pacific Moira Galbraith - Institute of Ocean Sciences Mary Arai Pacific Biological Station Emeritus Aglantha digitale: one of the most common hydromedusae in north
Report on the 2008 Dogger Bank cruise with R. V. Senckenberg
 Report on the 2008 Dogger Bank cruise with R. V. Senckenberg 29. 7 7. 8. 2008 MICHAEL TÜRKAY & MORITZ SONNEWALD Forschungsinstitut Senckenberg Frankfurt a. M. Contents: 1. Aims and setting 2. Narrative
Field Verification and Data Analysis of High PV Penetration Impacts on Distribution Systems
 Field Verification and Data Analysis of High PV Penetration Impacts on Distribution Systems Farid Katiraei *, Barry Mather **, Ahmadreza Momeni *, Li Yu *, and Gerardo Sanchez * * Quanta Technology, Raleigh,
Omineca Region Stocked Lake Assessment Report
 Executive Mackenzie Lake #1 West 2004 Stocking assessments were conducted at Mackenzie Lake #1 West in 2000, 2003 and 2004 to determine the status of the fishery. Mackenzie Lake #1 West is 16.9 ha and
Discharges observed during aerial surveillance in the Baltic Sea 2016
 Baltic Marine Environment Protection Commission Annual report on Discharges observed during aerial surveillance in the Baltic Sea 2016 Öresund bridge between Denmark and Sweden. Photo: Swedish Coast Guard
Detecting and tracing farmed salmon with otolith tags: developing and validating mark delivery techniques. University of Melbourne, Australia
 Detecting and tracing farmed salmon with otolith tags: developing and validating mark delivery techniques University of Melbourne, Australia Fletcher Warren-Myers Associate Prof. Steve Swearer Dr Tim Dempster
Wild Game Aerial Survey Wildlife Management
 Wildlife Management Bighorn Sheep Survey of Designated Winter Ranges within Alberta Wildlife Management Units 437-446 Data Summary Report Prepared by: Jeff Kneteman, Environment and Parks, Operations Division,
Post Opening Project Evaluation. M6 Toll
 M6 Toll Five Post Years Opening After Study: Project Summary Evaluation Report Post Opening Project Evaluation M6 Toll Five Years After Study Summary Report October 2009 Document History JOB NUMBER: 5081587/905
More persons in the cars? Status and potential for change in car occupancy rates in Norway
 Author(s): Liva Vågane Oslo 2009, 57 pages Norwegian language Summary: More persons in the cars? Status and potential for change in car occupancy rates in Norway Results from national travel surveys in
Wildland Solutions RDM Monitoring Procedure Keith Guenther November 2007 version
 Wildland Solutions RDM Monitoring Procedure Keith Guenther November 2007 version Annually create an RDM zone map and a pasture success map with supporting information collected at monitoring reference
A CO2-fund for the transport industry: The case of Norway
 Summary: A CO2-fund for the transport industry: The case of Norway TØI Report 1479/2016 Author(s): Inger Beate Hovi and Daniel Ruben Pinchasik Oslo 2016, 37 pages Norwegian language Heavy transport makes
Evaluation of photo voltaic generating system performance for fishing light application
 FISHERIES SCIENCE 2000; 66: 1062 1067 Original Article Evaluation of photo voltaic generating system performance for fishing light application Hisaharu SAKAI, 1 Mulyono S BASKORO 2 AND Ari KUSBUIYANTO
Passenger seat belt use in Durham Region
 Facts on Passenger seat belt use in Durham Region June 2017 Highlights In 2013/2014, 85 per cent of Durham Region residents 12 and older always wore their seat belt when riding as a passenger in a car,
Alpine Highway to North County Boulevard Connector Study
 Alpine Highway to North County Boulevard Connector Study prepared by Avenue Consultants March 16, 2017 North County Boulevard Connector Study March 16, 2017 Table of Contents 1 Summary of Findings... 1
Missouri Seat Belt Usage Survey for 2017
 Missouri Seat Belt Usage Survey for 2017 Conducted for the Highway Safety & Traffic Division of the Missouri Department of Transportation by The Missouri Safety Center University of Central Missouri Final
International Aluminium Institute
 THE INTERNATIONAL ALUMINIUM INSTITUTE S REPORT ON THE ALUMINIUM INDUSTRY S GLOBAL PERFLUOROCARBON GAS EMISSIONS REDUCTION PROGRAMME RESULTS OF THE 2003 ANODE EFFECT SURVEY 28 January 2005 Published by:
FRI UW 7725 August 1977
 FISHERIES RESEARCH INSTITUTE College of Fisheries University of Washington Seattle, Washington 98195 FRI UW 7725 August 1977 ACOUSTIC ASSESSMENT OF HERRING STOCNS IN ALASKA DURING 1976-1977 by Richard
Tyre noise limits of EC/661/2009 and ECE R117: Evaluation based on sold tyres in the Netherlands
 Transmitted by the expert from the Netherlands Informal document GRB-60-08 (60th GRB, 1-3 September 2014, agenda item 9) M+P MBBM group People with solutions MEMORANDUM www.mplusp.eu To Attn. Ministry
Aaren Healy, 20 September 2017 / 1
 Network Rail s consultation on variable charges and station charges in CP6 Electricity charge for traction (EC4T) and the electrification asset usage charge (EAUC) Aaren Healy, 20 September 2017 / 1 Purpose
Propulsion of 30,000 dwt. Handysize Bulk Carrier
 Propulsion of 3, dwt Handysize Bulk Carrier Content Introduction...5 EEDI and Major Ship and Main Engine Parameters...6 Energy Efficiency Design Index (EEDI)...6 Major propeller and engine parameters...7
Analysis of Production and Sales Trend of Indian Automobile Industry
 CHAPTER III Analysis of Production and Sales Trend of Indian Automobile Industry Analysis of production trend Production is the activity of making tangible goods. In the economic sense production means
Propulsion of 46,000-50,000 dwt. Handymax Tanker
 Propulsion of 46,-, dwt Handymax Tanker Content Introduction... EEDI and Major Ship and Main Engine Parameters...6 Energy Efficiency Design Index (EEDI)...6 Major propeller and engine parameters...7 46,-,
ROAD SAFETY ANNUAL REPORT 2018 LITHUANIA
 ROAD SAFETY ANNUAL REPORT 2018 LITHUANIA LITHUANIA In 2017, 192 persons lost their lives in traffic crashes. Lithuania is one of the IRTAD countries that has achieved the strongest reduction in the number
Rates of Motor Vehicle Crashes, Injuries, and Deaths in Relation to Driver Age, United States,
 RESEARCH BRIEF This Research Brief provides updated statistics on rates of crashes, injuries and death per mile driven in relation to driver age based on the most recent data available, from 2014-2015.
Coriolis Fuel Mass Flow Metering for Fishing Vessels
 1st International Symposium on Fishing Vessel Energy Efficiency Vigo, Spain, 18th - 20th of May 2010 Coriolis Fuel Mass Flow Metering for Fishing Vessels www.ismar.cnr.it Antonello Sala, Francesco De Carlo,
Serial No. N4674 NAFO SCR Doc. 02/62 SCIENTIFIC COUNCIL MEETING JUNE 2002
 NOT TO BE CITED WITHOUT PRIOR REFERENCE TO THE AUTHOR(S) Northwest Atlantic Fisheries Organization Serial No. N4674 NAFO SCR Doc. 02/62 SCIENTIFIC COUNCIL MEETING JUNE 2002 An Assessment of American Plaice
2016 Meteorological Summary for the Galeta Marine Island Laboratory. Prepared by: Steven Paton
 0 2016 Meteorological Summary for the Galeta Marine Island Laboratory Prepared by: Steven Paton 1 Introduction This is the fourth in a series of yearly reports summarising the past year s Smithsonian Tropical
Patterns of distribution and biology of the North Pacific oceanic squid Berryteuthis anonychus with implications for the species life cycle
 Patterns of distribution and biology of the North Pacific oceanic squid Berryteuthis anonychus with implications for the species life cycle Oleg N. Katugin and Gennadyi A. Shevtsov TINRO-Centre), Pacific
Arctic Freshwater Flux and Change
 Arctic Freshwater Flux and Change Daqing Yang, Doug Kane, Sveta Berezovskaya Water and Environment Research Center, Univ. of Alaska Fairbanks Main Topics Large Arctic River Streamflow Regime and Change
2017 Meteorological Summary for the Galeta Marine Island Laboratory. Prepared by: Steven Paton
 0 2017 Meteorological Summary for the Galeta Marine Island Laboratory Prepared by: Steven Paton 1 Introduction This is the 5 th in a series of yearly reports summarising the past year s Smithsonian Tropical
Past, Present-day and Future Ship Emissions
 Past, Present-day and Future Ship Emissions Veronika Eyring DLR-Institute of Atmospheric Physics How to make the sea green: What to do about air pollution and greenhouse gas emissions from maritime transport
DRIVER SPEED COMPLIANCE WITHIN SCHOOL ZONES AND EFFECTS OF 40 PAINTED SPEED LIMIT ON DRIVER SPEED BEHAVIOURS Tony Radalj Main Roads Western Australia
 DRIVER SPEED COMPLIANCE WITHIN SCHOOL ZONES AND EFFECTS OF 4 PAINTED SPEED LIMIT ON DRIVER SPEED BEHAVIOURS Tony Radalj Main Roads Western Australia ABSTRACT Two speed surveys were conducted on nineteen
Excessive speed as a contributory factor to personal injury road accidents
 Excessive speed as a contributory factor to personal injury road accidents Jonathan Mosedale and Andrew Purdy, Transport Statistics: Road Safety, Department for Transport Summary This report analyses contributory
Linking the Alaska AMP Assessments to NWEA MAP Tests
 Linking the Alaska AMP Assessments to NWEA MAP Tests February 2016 Introduction Northwest Evaluation Association (NWEA ) is committed to providing partners with useful tools to help make inferences from
Acid rain. Innholdsfortegnelse. Side 1 / 12
 Acid rain Innholdsfortegnelse 1) Maps: Deposition of sulphur and nitrogen 2) Map: Areas where critical loads are exceeded http://www.environment.no/topics/air-pollution/acid-rain/ Side 1 / 12 Acid rain
D O N A LD E. R O GER S RE SEA RC H P ROFESSOR
 F RI -UW -9417 O c t ober 1 994 FORECASTS OF THE 1995 SOCKEYE SALMON RUNS TO BRISTOL BAY D O N A LD E. R O GER S RE SEA RC H P ROFESSOR A RE P O R T T O T H E P A CIFIC S E A FO O D P ROCESSORS A SSOCIA
IMPROVING FUEL EFFICIENCY IN THE UK FISHING FLEET
 IMPROVING FUEL EFFICIENCY IN THE UK FISHING FLEET Kate Graham, Sea Fish Industry Authority (UK), k_graham@seafish.co.uk ABSTRACT The financial performance of the UK fishing fleet has been directly affected
Linking the Mississippi Assessment Program to NWEA MAP Tests
 Linking the Mississippi Assessment Program to NWEA MAP Tests February 2017 Introduction Northwest Evaluation Association (NWEA ) is committed to providing partners with useful tools to help make inferences
Section Operations Section Organizational Guidance
 1 2 3 4 5 6 7 8 9 10 Section 9315 Operations Section Organizational Guidance 11 12 1 2 3 4 5 6 7 8 9 10 11 T able of Contents Section Page 12 13 14 15 16 17 18 9315 Operations Section Organizational Guidance...
Electric Vehicle Cost-Benefit Analyses
 Electric Vehicle Cost-Benefit Analyses Results of plug-in electric vehicle modeling in five Northeast & Mid-Atlantic states Quick Take With growing interest in the electrification of transportation in
BUSINESS AND CONSUMER SURVEY RESULTS. February 2019: Economic Sentiment broadly stable in the euro area, down in the EU
 February 2019 BUSINESS AND CONSUMER SURVEY RESULTS 120 Graph 1: Economic sentiment indicator (s.a.) 110 100 90 80 EA EU 70 long-term av erage (1990-2018) = 100 60 1995 1997 1999 2001 2003 2005 2007 2009
COMMISSION STAFF WORKING PAPER. Technical Annex. Accompanying the document REPORT FROM THE COMMISSION TO THE EUROPEAN PARLIAMENT AND THE COUNCIL
 EUROPEAN COMMISSION Brussels, 22.6.2011 SEC(2011) 759 final COMMISSION STAFF WORKING PAPER Technical Annex Accompanying the document REPORT FROM THE COMMISSION TO THE EUROPEAN PARLIAMENT AND THE COUNCIL
2.1 Outline of Person Trip Survey
 Trip Characteristics 2.1 Outline of Person Trip Survey 2.1.1 Outline of the Survey The Person Trip survey was carried out from 2006 to 2007 as a part of the Istanbul Transportation Master Plan undertaken
Supporting Businesses
 Supporting Businesses Maintain our position in supporting businesses Refining the future The leading provider of cleaner traffic fuels Supporting businesses Refining Complementary businesses ( Base oils,
Relevance of head injuries in side collisions in Germany Comparison with the analyses and proposals of the WG13
 Relevance of head injuries in side collisions in Germany Comparison with the analyses and proposals of the WG13 Relevanz von Kopfanprallverletzungen bei Seitenkollisionen in Deutschland Vergleich mit den
ASTM D4169 Truck Profile Update Rationale Revision Date: September 22, 2016
 Over the past 10 to 15 years, many truck measurement studies have been performed characterizing various over the road environment(s) and much of the truck measurement data is available in the public domain.
Abstract. 1. Introduction. 1.1 object. Road safety data: collection and analysis for target setting and monitoring performances and progress
 Road Traffic Accident Involvement Rate by Accident and Violation Records: New Methodology for Driver Education Based on Integrated Road Traffic Accident Database Yasushi Nishida National Research Institute
Climatography of the United States No
 Climate Division: CA 5 NWS Call Sign: Month (1) Min (2) Month(1) Extremes Lowest (2) Temperature ( F) Lowest Month(1) Degree s (1) Base Temp 65 Heating Cooling 100 Number of s (3) Jan 45.9 26.0 36.0 67
City of Palo Alto (ID # 6416) City Council Staff Report
 City Council Staff Report") City of Palo Alto (ID # 6416) City Council Staff Report Report Type: Informational Report Meeting Date: 1/25/2016 Summary Title: Update on Second Transmission Line Title: Update on Progress Towards Building
City of Palo Alto (ID # 6416) City Council Staff Report Report Type: Informational Report Meeting Date: 1/25/2016 Summary Title: Update on Second Transmission Line Title: Update on Progress Towards Building
Interstate Freight in Australia,
 Interstate Freight in Australia, 1972 2005 Leo Soames, Afzal Hossain and David Gargett Bureau of Transport and Regional Economics, Department of Transport and Regional Services, Canberra, ACT, Australia
Performance Evaluation of Electric Vehicles in Macau
 Journal of Asian Electric Vehicles, Volume 12, Number 1, June 2014 Performance Evaluation of Electric Vehicles in Macau Tze Wood Ching 1, Wenlong Li 2, Tao Xu 3, and Shaojia Huang 4 1 Department of Electromechanical
Garden Well Gold Deposit Diamond Drilling Confirms Gold at Depth Highlights
 7 December 2010 ABN 28 009 174 761 www.regisresources.com Manager Announcements Company Announcements Office Australian Securities Exchange Limited Level 4, 20 Bridge Street Sydney NSW 2000 Level 1, 1
Linking the Kansas KAP Assessments to NWEA MAP Growth Tests *
 Linking the Kansas KAP Assessments to NWEA MAP Growth Tests * *As of June 2017 Measures of Academic Progress (MAP ) is known as MAP Growth. February 2016 Introduction Northwest Evaluation Association (NWEA
Fueling Savings: Higher Fuel Economy Standards Result In Big Savings for Consumers
 Fueling Savings: Higher Fuel Economy Standards Result In Big Savings for Consumers Prepared for Consumers Union September 7, 2016 AUTHORS Tyler Comings Avi Allison Frank Ackerman, PhD 485 Massachusetts
Summary of the Industry-DFO Collaborative Post-season Trap Surveys for Snow Crab in Div. 2J3KLOPs4R
 Wp: 2013/ Summary of the Industry-DFO Collaborative Post-season Trap Surveys for Snow Crab in Div. 2J3KLOPs4R by D.E. Stansbury, D. Fiander and D. Maddock Parsons INTRODUCTION The industry-department of