2004 ATLANTIC HURRICANE SUMMARY
|
|
|
- Roger Newton
- 6 years ago
- Views:
Transcription

1 2004 ATLANTIC HURRICANE SUMMARY Weather Research Center Houston, Texas
2 Weather Research Center 3227 Audley Houston, Texas Phone: Fax: Atlantic Tropical Storm/Hurricane Summary NAME DATES INTENSITY CAT PRESSURE DEATHS MBS ALEX 31 July 6 August Hurricane BONNIE 3-12 August Tropical Storm CHARLEY 9-15 August Hurricane DANIELLE August Hurricane EARL August Tropical Storm FRANCES 24 August 7 September Hurricane GASTON 27 August 1 September Tropical Storm HERMINE August Tropical Storm IVAN 2-24 September Hurricane JEANNE September Hurricane KARL September Hurricane LISA 19 September - 3 October Hurricane MATTHEW 8-10 October Tropical Storm NICOLE October Sub-tropical OTTO 30 Nov 2 December Tropical Storm Hurricanes 8 Sub-tropical Storms 1 Tropical Storms 6 Total Named Systems 15 To obtain wind speed in miles per hour (mph), multiply the wind by 1.15.
3
4
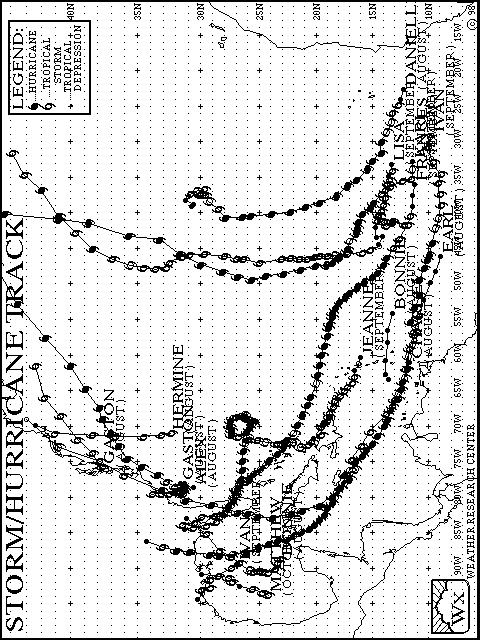
5 TM Weather Research Center 3227 Audley Houston, Texas Phone: Fax: Season Highlights The 2004 Atlantic Hurricane Season began slowly with the first tropical depression forming on July 31st. However, this was no indication of what was in store for the remainder of the season. There were 14 named cyclones with 8 intensifying into hurricanes and 1 sub-tropical storm Nicole. Seven Category 3 or stronger hurricanes formed in Atlantic Basin this season: Alex, Charley, Danielle, Frances, Ivan, Jeanne, and Karl. Nine storms made landfall along the United States with five of these storms [Bonnie, Charley, Frances, Jeanne and Ivan] making landfall in Florida. The last time at least 9 cyclones made landfall on the United States Coast was Each day during the month of September there was an active storm somewhere in the Atlantic. The first tropical depression of the season formed on July 31 st and intensified into Tropical Storm Alex late on the August 1 st. Alex strengthened into the first hurricane of the season on August 3 rd, the beginning of a very active August. Seven more tropical cyclones formed in August for a total of eight named tropical cyclones. This is a new record for August surpassing the seven named storms 1933 and of With Tropical Storm Bonnie making landfall near Apalachicola on the Florida Peninsula on August 12 th, the un-relenting storm strikes began on Florida. Bonnie was the first of five named storms, four of which were hurricanes to make landfall. Hurricane Charley in mid-august caused extensive damage to Florida, becoming the second costliest tropical cyclone in U.S. history behind Hurricane Andrew in 1992, with estimated total damage near 15 billion dollars. Charley was followed by Frances, Ivan and Jeanne. What would become Ivan formed as a tropical depression formed late on September 2 nd in the Far Eastern Atlantic and moved westward across the Atlantic and Caribbean Sea into the Gulf of Mexico. After moving in the Gulf of Mexico as a very strong Hurricane, Ivan moved inland near the Alabama/Florida border with devastating damage. Ivan then moved through the southeast United States and weakened as it started a large loop that would bring it back into the Gulf. The remnants of Ivan moved back into the Atlantic and then south toward Florida. This area of disturbed weather then crossed Florida and re-emerged into the Gulf of Mexico and re-formed into a Tropical Storm and made landfall at the Texas Louisiana Border on September 23 rd. Ivan made two landfalls along the coast of the United States. During its existence, Ivan reached Category 5 strength three times.
6 Hurricane Jeanne in September caused devastation throughout Haiti and the Dominican Republic and caused thousands of deaths. Jeanne was the third hurricane to make landfall in Florida and moved inland in the same location as Frances. Danielle, Earl, Karl, Lisa and Nicole stayed well east of the United States never making landfall. The season wound down in October with only two named storms. Tropical Storm Matthew formed in the Gulf of Mexico. After it made landfall, Matthew caused inland flooding over southeastern Louisiana. The first sub-tropical storm of the season, Nicole, formed in October. National Summary 1. Hurricane ALEX 31 July 6 August 2004 A tropical depression formed off the northeast Florida coast on July 31 st. This depression drifted erratically and became Tropical Storm Alex on August 1 st. By August 2 nd, Alex started to move northeast along the coast of the southeastern United States. Alex was upgraded to a hurricane on August 3 rd. Alex made landfall within 10 miles of Cape Hatteras, North Carolina with maximum sustained winds of 88 knots. Alex then turned to the northeast and moved rapidly into the western North Atlantic. Alex reached its peak with maximum sustained winds of 105 knots. On August 5 th, Alex passed a few hundred miles south of the Canadian Maritimes. On August 6 th, Alex became extra-tropical in the far North Atlantic. No deaths were reported. 2. Tropical Storm BONNIE 3 12 August 2004 A tropical depression formed from a westward moving tropical wave on August 3 rd over the tropical Atlantic several hundred miles east of the Lesser Antilles. The depression weakened to a tropical wave on August 5 th. This wave then developed into Tropical Storm Bonnie on August 9 th just north of the Yucatan Peninsula in the Gulf of Mexico. Bonnie began to move north and northeast on August 10 th and 11 th. Bonnie moved inland near Apalachicola, Florida as a tropical storm on August 12 th. Bonnie was responsible for 3 deaths in North Carolina from tornadoes. 3. Hurricane CHARLEY 9-15 August 2004 Charley began as a tropical depression on August 9 th just east of Barbados and moved rapidly to the west and strengthened into a hurricane by August 11 th. Charley moved over Cuba as a Category 3 hurricane with maximum sustained winds of 105 knots on August 13 th and then moved over the Straits of Florida before turning northward passing over the Dry Tortugas as a Category 2 hurricane. Charley then moved north-northeast and moved rapidly toward the southwest coast of Florida and intensified into a Category 4 hurricane as it made landfall in Florida near Cayo Costa late on the 13 th. The eye wall then moved over Punta Gorda and Port Charlotte causing extensive damage. The hurricane moved north-northeast across the Florida Peninsula and into the Atlantic remaining a hurricane as it crossed close to Kissimmee and Orlando early on the 14 th of August causing serious damage. The storm then moved off the northeast coast of Florida near Daytona Beach. Charley moved north-northeast offshore and
7 made landfall again near Cape Romain, South Carolina, moved offshore briefly, and then made landfall near North Myrtle Beach. Charley weakened to a tropical storm over southeastern North Carolina on the 15 th of August and then became extra-tropical over Virginia. Damage totals are estimated at 15 billion dollars, making it the second costliest tropical cyclone in U.S. history. At this time thirty-one deaths are attributed to Charley. 4. Hurricane DANIELLE August 2004 On August 13 th a tropical depression formed from a westward moving tropical wave about 240 miles south-southeast of the Cape Verde Islands. The depression intensified into Tropical Storm Danielle late on August 13 th, moving west-northwest and intensified into a hurricane by August 14th. Danielle s peak intensity reached 110 knots as it moved north-northwest through the Far Eastern Atlantic. Danielle dissipated on August 21 st. 5. Tropical Storm EARL August 2004 Earl formed from a tropical wave on the evening of August 13 th over the central Atlantic and intensified into a tropical storm on the 14 th as it moved west through the Atlantic. Earl then brought heavy rains and strong winds to the Windward Islands on the 15 th. The short-lived storm dissipated to a tropical wave early on the 16 th. 6. Hurricane FRANCES 24 August 7 September 2004 On August 24 th a tropical depression formed from a tropical wave in the Far Eastern Atlantic. As the depression moved west-northwest to northwest the system intensified into Tropical Storm Frances on the 25 th, and then strengthened into a hurricane on August 26 th. On August 29 th, Frances turned westward and passed 125 miles north of Puerto Rico with winds of 120 knots on August 31 st. On September 1 st, Frances turned west-northwest towards the southeastern Bahamas and moved over the Turks by September 2 nd, intensifying into a Category 4 hurricane. Frances weakened to a Category 2 hurricane and moved slowly through the northwestern Bahamas on the 3 rd and 4 th of September. The center reached the Florida coast near Sewall s Point on September 5 th. The hurricane then moved west-northwest across central Florida and moved into the extreme northeastern Gulf of Mexico on the 6 th, making landfall once again as a Tropical Storm near St. Marks, Florida. Frances was responsible for 37 deaths while setting a record by spawning 117 tornadoes from Florida to Virginia. Total damage from Frances is estimated at $4 billion. 7. Tropical Storm GASTON 27 August 1 September 2004 A tropical depression formed on August 27 th about 140 miles southeast of Charleston, South Carolina. The depression drifted toward the coast and strengthened into Tropical Storm Gaston on the 28 th, making llandfall just west of McClellanville, South Carolina on August 29 th with maximum sustained winds of 60 knots. Gaston weakened to a tropical depression near Florence, South Carolina and then moved northeastward over North Carolina before moving back over open water. Gaston re-strengthened into a tropical storm on August 31 st and then
8 became extra-tropical on September 1 st. Gaston caused extensive flooding over Virginia and the Carolinas and was responsible for 5 deaths in Virginia from flooding. 8. Tropical Storm HERMINE August 2004 The eighth named storm of the season formed on August 29 th about 350 miles west of Bermuda. Tropical Storm Hermine moved north through the Atlantic on the 30 th and weakened and became extra-tropical early on the 31 st as it moved across eastern Massachusetts. 9. Hurricane IVAN 2-24 September 2004 On August 31 st a very strong tropical wave moved off the west coast of Africa. On September 2 nd a tropical depression formed and on September 3 rd and intensified into Tropical Storm Ivan. By September 5 th Ivan had become a major hurricane moving westward for several days passing over the Windward Islands as a dangerous hurricane and caused considerable damage and loss of life on Granada. Ivan then moved west-northwest across the southern Caribbean Sea passing just north of Venezuela and the Netherlands Antilles. On September 9 th, Ivan strengthened into a Category 5 hurricane in the central Caribbean Sea. Ivan approached Jamaica weakening to a Category 4 hurricane and moved just south of Jamaica. On September 11 th, Ivan restrengthened to a Category 5 as it moved toward Cuba. The eye of Ivan moved through the Yucatan Channel on the 13 th and then moved northwest through the Gulf of Mexico and made landfall as a Category 3 hurricane on September 16 th near Gulf Shores, Alabama. A weakened Ivan moved northeastward over the eastern United States, then emerged off the Delmarva Peninsula on the 19 th of September as a extra-tropical low pressure system making a clockwise loop. The remnants of Ivan moved southwestward just east of the southeastern US coastline and passed over south Florida into the Gulf of Mexico on the 21 st. Ivan intensified into a tropical storm once again on the 23 rd and made landfall on the evening of the 24 th at the Louisiana/Texas border. Ivan is responsible for at least 122 deaths and destroyed seven oil platforms. Estimated damage totals for Ivan are greater than $7 billion. 10. Hurricane JEANNE September 2004 On September 13 th a tropical depression formed from a tropical wave in the Far Eastern Atlantic. Tropical Storm Jeanne formed on September 14 th as it moved west-northwest over the Leeward Islands. Jeanne moved slowly over the Virgin Islands and Puerto Rico on September 15 th bringing near hurricane force winds and torrential rains to Haiti and the Dominican Republic on the 16 th and 17 th. Jeanne became a hurricane for a brief period on the 16 th.and then turned north on the 18 th and moved over the southeastern Bahamas as a tropical storm. Jeanne strengthened again to a hurricane on the 20 th while 400 miles east of Freeport in the Bahamas. Jeanne moved very slowly in a clockwise loop for several days strengthening to a Category 2 hurricane. On September 23 rd, Jeanne started to track just north of due west. On September 25 th, Jeanne moved over Abacos Island and the Grande Bahama Island in the northwestern Bahamas. Jeanne made landfall as a Category 3 hurricane near Stuart, Florida early on September 26 th. This was the same place where Frances made landfall just 20 days earlier. Jeanne weakened to a tropical storm over central and northwestern Florida and then turned north. Jeanne weakened to a tropical depression over Georgia and re-curved over the mid-atlantic coastal states on the 28 th
9 and the 29 th moving into the Atlantic. By the 30 th, Jeanne became extra-tropical a few hundred miles south of Nova Scotia. Jeanne is responsible for over 3000 deaths, mostly in Haiti and the Dominican Republic. 11. Hurricane KARL September 2004 A tropical wave about 670 miles west-southwest of the Cape Verde Islands formed into a tropical depression on September 16 th and moved west-northwest. This depression intensified into Tropical Storm Karl on September 17 th. On the 18 th, Karl intensified into a hurricane and turned to the northwest. Karl continued to move west-northwest to northwest on the 19 th and 20 th and strengthened to a Category 4 hurricane in the open Atlantic. On September 24 th, Karl became extra-tropical in the northern Atlantic. 12. Hurricane LISA 19-September 3 October 2004 On September 19 th, a tropical depression formed from a westward moving tropical wave 645 miles west-southwest of the Cape Verde Islands. Tropical Storm Lisa formed on the 20 th of September from this depression and continued to move westward. A tropical wave formed east of Lisa and moved west toward the slow moving storm causing the two systems to loop around each other on the 22 nd and 23 rd until the other wave was absorbed into Lisa s circulation. Lisa then continued to move westward before making a northward turn on the 25 th of September in the central Atlantic. Lisa moved very slowly for several days and reached minimum hurricane strength on the 2 nd of October before weakening back to a tropical storm. Lisa became extratropical on the 3 rd of October about 300 miles north-northwest of the Northern Azores Islands and was finally absorbed by a large extra-tropical low moving through the Atlantic. 13. Tropical Storm MATTHEW 8-10 October 2004 A tropical wave interacting with an upper-level trough over the southwestern Gulf of Mexico resulted in the formation of Tropical Storm Matthew on the 8 th of October about 180 miles southeast of Brownsville, Texas. Matthew drifted slowly to the east and east-northeast before moving slowly northeast to north and making landfall near Cocodrie, Louisiana on October 10 th. The storm caused rainfall of over 10 inches in many locations in Louisiana, along with a 3 feet storm surge in portions of Lake Pontchartrain and surrounding areas. Matthew dissipated over Arkansas but not before causing flooding problems in southeastern Louisiana. 14. Sub-Tropical Storm NICOLE October 2004 Nicole was a short lived sub-tropical storm that formed from an extra-tropical low-pressure system near Bermuda. Nicole moved north and then northeast slowly to the northwest of Bermuda. The sub-tropical storm s intensity changed very little and it was absorbed by an extratropical low late on the 11 th.
10 15. Tropical Storm OTTO 30 November 2 December On November 30 th, the last day of the Atlantic Hurricane Season, Tropical Storm Otto formed from an area of low pressure located about 800 miles east of Bermuda. After drifting slowly north for only six hours, Otto turned to the southeast on the night of the 30 th. The next day Otto continued to drift slowly southeast and gradually turned towards the south. On the morning of December 2 nd unfavorable conditions caused Otto to weaken to a tropical depression and then dissipate into a remnant low over the open Atlantic. SAFFIR/SIMPSON DAMAGE POTENTIAL SCALE CATEGORY SPEED [] PRESSURE [MB] SURGE [FT] >135 <920 18
11 ALEX JULY / AUGUST 2004 Advisory # DATE TIME UTC LAT LONG GUSTS SPEED HEADING PRESSURE MB NW NNW NNW N E ENE NNE NE NE NE NE NE ENE ENE ENE ENE ENE ENE ENE ENE ENE ENE
12 BONNIE AUGUST 2004 Advisory # DATE TIME UTC LAT LONG GUSTS SPEED HEADING PRESSURE MB W W W W W W NW NW WNW NW N N N NNE NE NE NE NE NE
13 CHARLEY AUGUST 2004 Advisory # DATE TIME UTC LAT LONG GUSTS SPEED HEADING PRESSURE MB W W WNW WNW WNW WNW WNW WNW WNW WNW WNW NW NW NNW NNW NNW N N NNE NNE NNE NNE NNE NE NE NE
14 DANIELLE AUGUST 2004 Advisory # DATE TIME UTC LAT LONG GUSTS SPEED HEADING PRESSURE MB W W W WNW W WNW WNW W WNW WNW NW NW NW NNW NNW NNW NNW N N N NNE NNE NE NE E E NNE NW NW NW W W
15 EARL AUGUST 2004 Advisory # DATE TIME UTC LAT LONG GUSTS SPEED HEADING PRESSURE MB W W WNW WNW WNW WNW W W W W WNW
16
17 August/ FRANCES September 2004 Advisory # DATE TIME UTC LAT LONG GUSTS SPEED HEADING PRESSU RE MB W W W W W WNW WNW WNW WNW WNW WNW NW NW NW NW NW WNW WNW W W W W W W W W W W WNW WNW WNW WNW WNW WNW WNW NW WNW WNW NW WNW WNW NW WNW WNW WNW W WNW WNW WNW WNW NW NNW NNW
18 GASTON AUGUST/ SEPTEMBER 2004 Advisory # DATE TIME UTC LAT LONG GUSTS SPEED HEADING PRESSURE MB S W W NNW N N N NE ENE NE ENE ENE ENE
19 HERMINE AUGUST 2004 Advisory # DATE TIME UTC LAT LONG GUSTS SPEED HEADING PRESSURE MB NW NNW N N N N NE
20
21 IVAN SEPTEMBER 2004 Advisory # DATE TIME UTC LAT LONG GUSTS SPEED HEADING PRESSU RE MB W W W W WSW W W W W W W W W WNW WNW W W WNW W W W W W W WNW WNW WNW WNW WNW WNW WNW WNW WNW IVAN SEPTEMBER 2004 Advisory TIME GUSTS SPEED PRESSURE # DATE UTC LAT LONG HEADING MB WNW WNW WNW WNW WNW WNW WNW WNW WNW WNW WNW NW NNW NW NW NNW NNW NNW NNW N N N N N NNE NNE WNW WNW WNW NW NW NW NW
22
23 JEANNE SEPTEMBER 2004 Advisory # DATE TIME UTC LAT LONG GUSTS SPEED HEADING PRESSURE MB WNW WNW NW WNW WNW WNW WNW WNW WNW WNW NW W W WNW WNW WNW WNW WNW NW NNW NNW N NNW N N N N NNE NE E ENE ESE SE S S S WSW WSW W W WNW W W W W W W W W W W WNW NW N NNW N
24 KARL SEPTEMBER 2004 Advisory # DATE TIME UTC LAT LONG GUSTS SPEED HEADING PRESSURE MB W W W WNW NW NW NW NW WNW WNW WNW WNW WNW WNW WNW WNW NW NW NNW NNW NNW N N N NNE NNE NNE NNE N NNE N N N
25
26 LISA SEPTEMBER/ OCTOBER 2004 Advisory TIME GUSTS SPEED PRESSURE # DATE UTC LAT LONG HEADING MB W W W W W W W W WNW WNW WNW WNW WSW WSW W WSW WNW WNW W WNW WNW NW NW NW NNW NNW N NNW N N N NNW NNW N N N N N N N N NNW NNW NNW NNW N N NE NE NE NE ENE ENE ENE
27 MATTHEW OCTOBER 2004 GUSTS SPEED PRESSURE Advisory# DATE TIME UTC LAT LONG HEADING MB E ENE NE NNE NNE NNE NNE N
28 NICOLE OCTOBER 2004 Advisory # DATE TIME UTC LAT LONG GUSTS SPEED HEADING PRESSU RE MB NNW NNW ENE NE NE NNE
29 OTTO DECEMBER 2004 Advisory # DATE TIME UTC LAT LONG GUSTS SPEED HEADING PRESSURE MB N SE E SE SE SSE S S
30 Weather Research Center Houston Projects: WRC Weather Labs WRC Weather Camp WRC Weather Education Endowment Tours/Talks Weather Research Center
Monthly data generated on Wednesday, July 31, 2013 at 13:04 UTC
 MESONET CLIMATOLOGICAL DATA SUMMARY May 2013 Time Zone: Midnight-Midnight CST 1 82 40 63.9 NA 4 0 NA NA NA 0.01 28.18 29.90 N 19.2 46.3 24.90 66.6 71.4 77 66 2 54 36 43.5 NA 20 0 NA NA NA 0.05 28.67 30.42
MONTHLY CLIMATOLOGICAL SUMMARY for JAN NAME: WMREC CITY: STATE: ELEV: 600 ft LAT: 39 38' 31" N LONG: 77 44' 00" W
 MONTHLY CLIMATOLOGICAL SUMMARY for JAN. 2015 1 34.8 45.2 3:30p 22.1 5:30a 30.2 0.0 0.00 4.8 24.0 4:00p WSW 2 34.9 44.3 3:00p 24.0 12:00m 30.1 0.0 0.00 2.4 17.0 10:30a W 3 33.0 37.8 12:00m 23.3 1:00a 32.0
GoToBermuda.com. Q3 Arrivals and Statistics at September 30 th 2015
 Q3 Arrivals and Statistics at September 30 th 2015 1 Q3 Total Vacation Visitor Arrivals Q3 Arrivals 2014 2015 YTD 2014 YTD 2015 Air - Vacation 54,305 54,473 0.31% 168 117,639 116,700-0.80% (939) Cruise
R E S E RVAT I O N S
 RCI WEEKS RESORT R E S E RVAT I O N S As an RCI Points Member you are automatically an RCI Weeks subscribing member, with complete access to the RCI Weeks system. RCI Weeks has more than 3,700 resorts
LOCAL CLIMATOLOGICAL DATA Monthly Summary April 2012
 Deg. Days Precip Ty Precip Wind Solar Hu- Adj. to Sea Level mid- ity Avg Res Res Peak Minute 1 fog 2 hvy fog 3 thunder 4 ice plt 5 hail 6 glaze 7 duststm 8 smk, hz 9 blw snw 1 2 3 4A 4B 5 6 7 8 9 11 12
LOCAL CLIMATOLOGICAL DATA Monthly Summary April 2015
 Deg. Days Precip Ty Precip Wind Solar Hu- Adj. to Sea Level mid- ity Avg Res Res Peak 2 Minute 1 fog 2 hvy fog 3 thunder 4 ice plt 5 hail 6 glaze 7 duststm 8 smk, hz 9 blw snw 1 2 3 4A 4B 5 6 7 8 9 11
LOCAL CLIMATOLOGICAL DATA Monthly Summary April 2017
 Deg. Days Precip Ty Precip Wind Solar Hu- Adj. to Sea Level mid- ity Avg Res Res Peak 2 Minute 1 fog 2 hvy fog 3 thunder 4 ice plt 5 hail 6 glaze 7 duststm 8 smk, hz 9 blw snw 1 2 3 4A 4B 5 6 7 8 9 11
Design Criteria Data
 CHARLESTON/KANAWHA WV Latitude = 38.37 N WMO No. 72414 Longitude = 81.6 W Elevation = 981 feet Period of Record = 1973 to 1996 Average Pressure = 29. inches Hg Design Criteria Data Mean Coincident (Average)
Design Criteria Data
 MINOT AFB ND Latitude = 48.42 N WMO No. 727675 Longitude =11.3 W Elevation = 1667 feet Period of Record = 1967 to 1996 Average Pressure = 28.16 inches Hg Design Criteria Data Mean Coincident (Average)
Design Criteria Data
 MEDFORD/JACKSON CO. OR Latitude = 42.37 N WMO No. 72597 Longitude =122.8 W Elevation = 1329 feet Period of Record = 1973 to 1996 Average Pressure = 28.61 inches Hg Design Criteria Data Mean Coincident
2019 Western North Carolina Weather Calendar. Department of Atmospheric Sciences The University of North Carolina at Asheville
 209 Western North Carolina Weather Calendar Department of Atmospheric Sciences The University of North Carolina at Asheville www.atms.unca.edu 209 Western North Carolina Weather Calendar Climatological
Design Criteria Data
 OKLAHOMA CITY OK Latitude = 35.4 N WMO No. 72353 Longitude = 97.6 W Elevation = 133 feet Period of Record = 1973 to 1996 Average Pressure = 28.62 inches Hg Design Criteria Data Mean Coincident (Average)
Flood Response: Applying Hard Lessons from the Past, and Learning New Insights
 Flood Response: Applying Hard Lessons from the Past, and Learning New Insights John Kett CEO & President April 2018 2018 Insurance Auto Auctions, Inc. All rights reserved. 1 manner without the express
Appendix F. Ship Drift Analysis West Coast of North America: Alaska to Southern California HAZMAT Report ; April 2000
 Appendix F Ship Drift Analysis West Coast of North America: Alaska to Southern California HAZMAT Report 2000-2; April 2000 2.2 Drift Factors When its propulsion or steering device fails, a ship will drift
Design Criteria Data
 ANCHORAGE AK Latitude = 61.17 N WMO No. 7273 Longitude =15. W Elevation = 131 feet Period of Record = 1973 to 1996 Average Pressure = 29.6 inches Hg Design Criteria Data Mean Coincident (Average) Values
Design Criteria Data
 DES MOINES IA Latitude = 41.53 N WMO No. 72546 Longitude = 93.65 W Elevation = 965 feet Period of Record = 1973 to 1996 Average Pressure = 28.96 inches Hg Design Criteria Data Mean Coincident (Average)
Design Criteria Data
 RAPID CITY SD Latitude = 44.5 N WMO No. 72662 Longitude =3. W Elevation = 3169 feet Period of Record = 1973 to 1996 Average Pressure = 26.67 inches Hg Design Criteria Data Mean Coincident (Average) Values
Design Criteria Data
 MACON/LEWIS WILSON GA Latitude = 32.7 N WMO No. 72217 Longitude = 83.65 W Elevation = 361 feet Period of Record = 1973 to 1996 Average Pressure = 29.66 inches Hg Design Criteria Data Mean Coincident (Average)
Design Criteria Data
 PIERRE SD Latitude = 44.38 N WMO No. 726686 Longitude =1.2 W Elevation = 1742 feet Period of Record = 1973 to 1996 Average Pressure = 28.1 inches Hg Design Criteria Data Mean Coincident (Average) Values
Design Criteria Data
 BURLINGTON VT Latitude = 44.47 N WMO No. 72617 Longitude = 73.15 W Elevation = 341 feet Period of Record = 1973 to 1996 Average Pressure = 29.61 inches Hg Design Criteria Data Mean Coincident (Average)
Design Criteria Data
 HONOLULU/OAHU HI Latitude = 21.35 N WMO No. 91182 Longitude =157.9 W Elevation = 16 feet Period of Record = 1967 to 1996 Average Pressure = 29.96 inches Hg Design Criteria Data Mean Coincident (Average)
Design Criteria Data
 COLUMBIA SC Latitude = 33.95 N WMO No. 7231 Longitude = 81.12 W Elevation = 226 feet Period of Record = 1973 to 1996 Average Pressure = 29.8 inches Hg Design Criteria Data Mean Coincident (Average) Values
Design Criteria Data
 PHILADELPHIA PA Latitude = 39.88 N WMO No. 7248 Longitude = 75.25 W Elevation = 3 feet Period of Record = 1973 to 1996 Average Pressure = 29.98 inches Hg Design Criteria Data Mean Coincident (Average)
Design Criteria Data
 INDIANAPOLIS IN Latitude = 39.73 N WMO No. 72438 Longitude = 86.27 W Elevation = 87 feet Period of Record = 1973 to 1996 Average Pressure = 29.15 inches Hg Design Criteria Data Mean Coincident (Average)
Design Criteria Data
 DENVER/STAPLETON CO Latitude = 39.75 N WMO No. 72469 Longitude =14.8 W Elevation = 5332 feet Period of Record = 1973 to 1995 Average Pressure = 24.66 inches Hg Design Criteria Data Mean Coincident (Average)
Design Criteria Data
 JACKSONVILLE FL Latitude = 3.5 N WMO No. 7226 Longitude = 81.7 W Elevation = 3 feet Period of Record = 1973 to 1996 Average Pressure = 3.1 inches Hg Design Criteria Data Mean Coincident (Average) Values
Design Criteria Data
 LOUISVILLE/STANDIFORD KY Latitude = 38.18 N WMO No. 72423 Longitude = 85.73 W Elevation = 489 feet Period of Record = 1973 to 1996 Average Pressure = 29.49 inches Hg Design Criteria Data Mean Coincident
Design Criteria Data
 SPOKANE WA Latitude = 47.63 N WMO No. 72785 Longitude =117.5 W Elevation = 2366 feet Period of Record = 1973 to 1996 Average Pressure = 27.5 inches Hg Design Criteria Data Mean Coincident (Average) Values
Design Criteria Data
 LAS VEGAS/MCCARRAN NV Latitude = 36.8 N WMO No. 72386 Longitude =115.1 W Elevation = 2179 feet Period of Record = 1973 to 1996 Average Pressure = 27.67 inches Hg Design Criteria Data Mean Coincident (Average)
Design Criteria Data
 SPRINGFLD MO Latitude = 37.23 N WMO No. 7244 Longitude = 93.38 W Elevation = 127 feet Period of Record = 1973 to 1996 Average Pressure = 28.66 inches Hg Design Criteria Data Mean Coincident (Average) Values
Design Criteria Data
 DAYTON/JAMES M COX OH Latitude = 39.9 N WMO No. 72429 Longitude = 84.2 W Elevation = 14 feet Period of Record = 1973 to 1996 Average Pressure = 28.95 inches Hg Design Criteria Data Mean Coincident (Average)
Design Criteria Data
 BOSTON/LOGAN MA Latitude = 42.37 N WMO No. 7259 Longitude = 71.3 W Elevation = 3 feet Period of Record = 1967 to 1996 Average Pressure = 29.95 inches Hg Design Criteria Data Mean Coincident (Average) Values
Design Criteria Data
 PHOENIX/SKY HARBOR AZ Latitude = 33.43 N WMO No. 72278 Longitude =112. W Elevation = 116 feet Period of Record = 1973 to 1996 Average Pressure = 28.72 inches Hg Design Criteria Data Mean Coincident (Average)
Design Criteria Data
 BIRMINGHAM AL Latitude = 33.57 N WMO No. 72228 Longitude = 86.75 W Elevation = 63 feet Period of Record = 1973 to 1996 Average Pressure = 29.36 inches Hg Design Criteria Data Mean Coincident (Average)
Design Criteria Data
 MINNEAPOLIS-ST PAUL MN Latitude = 44.88 N WMO No. 72658 Longitude = 93.22 W Elevation = 837 feet Period of Record = 1973 to 1996 Average Pressure = 29.7 inches Hg Design Criteria Data Mean Coincident (Average)
Design Criteria Data
 NEW YORK/JOHN F KENNEDY NY Latitude = 4.65 N WMO No. 74486 Longitude = 73.78 W Elevation = 23 feet Period of Record = 1973 to 1996 Average Pressure = 29.98 inches Hg Design Criteria Data Mean Coincident
Design Criteria Data
 MIDLAND TX Latitude = 31.95 N WMO No. 72265 Longitude =2. W Elevation = 2861 feet Period of Record = 1973 to 1996 Average Pressure = 27.3 inches Hg Design Criteria Data Mean Coincident (Average) Values
Design Criteria Data
 WASHINGTON/DULLES VA Latitude = 38.95 N WMO No. 7243 Longitude = 77.45 W Elevation = 322 feet Period of Record = 1973 to 1996 Average Pressure = 29.68 inches Hg Design Criteria Data Mean Coincident (Average)
Design Criteria Data
 LANDER/HUNT WY Latitude = 42.82 N WMO No. 72576 Longitude =18.7 W Elevation = 5558 feet Period of Record = 1973 to 1996 Average Pressure = 24.44 inches Hg Design Criteria Data Mean Coincident (Average)
Design Criteria Data
 DULUTH MN Latitude = 46.83 N WMO No. 72745 Longitude = 92.18 W Elevation = 1417 feet Period of Record = 1973 to 1996 Average Pressure = 28.43 inches Hg Design Criteria Data Mean Coincident (Average) Values
Design Criteria Data
 ALBUQUERQUE NM Latitude = 35.5 N WMO No. 72365 Longitude =16.6 W Elevation = 5315 feet Period of Record = 1967 to 1996 Average Pressure = 24.72 inches Hg Design Criteria Data Mean Coincident (Average)
TRAFFIC VOLUME TRENDS
 Page 1 U. S. Department Transportation Federal Highway Administration Office Highway Policy Information TRAFFIC VOLUME TRENDS September Travel on all roads and streets changed by +2.5 (5.8 billion vehicle
Design Criteria Data
 MADISON/DANE CO. RGNL WI Latitude = 43.13 N WMO No. 72641 Longitude = 89.33 W Elevation = 866 feet Period of Record = 1973 to 1996 Average Pressure = 29.5 inches Hg Design Criteria Data Mean Coincident
Design Criteria Data
 CHICAGO/O HARE IL Latitude = 41.98 N WMO No. 7253 Longitude = 87.9 W Elevation = 673 feet Period of Record = 1967 to 1996 Average Pressure = 29.27 inches Hg Design Criteria Data Mean Coincident (Average)
Design Criteria Data
 RENO/CANNON INTL NV Latitude = 39.5 N WMO No. 72488 Longitude =119.7 W Elevation = 44 feet Period of Record = 1973 to 1996 Average Pressure = 25.57 inches Hg Design Criteria Data Mean Coincident (Average)
TRAFFIC VOLUME TRENDS July 2002
 TRAFFIC VOLUME TRENDS July 2002 Travel on all roads and streets changed by +2.3 percent for July 2002 as compared to July 2001. Estimated Vehicle-Miles of Travel by Region - July 2002 - (in Billions) West
Determination of Monthly Means of Daily Solar Radiation and its Variability: A Summary (continued)
") Introduction Section 5.3 MONTHLY MEANS OF DAILY SOLAR RADIATION AND ITS VARIABILITY R.E. Schulze, M. Maharaj and R.D. Chapman The maps and statistics of solar radiation in this Section supersede the ones
Introduction Section 5.3 MONTHLY MEANS OF DAILY SOLAR RADIATION AND ITS VARIABILITY R.E. Schulze, M. Maharaj and R.D. Chapman The maps and statistics of solar radiation in this Section supersede the ones
Local Climatological Data Summary Aurora, Illinois
 SWS Miscellaneous Publication 98-15 STATE OF ILLINOIS DEPARTMENT OF NATURAL RESOURCES Local Climatological Data Summary Aurora, Illinois 1901-1996 Herbert Hoffman 1, Audrey A. Bryan 2 and Wayne Wendland
Emerging Trends in Petroleum Markets
 Emerging Trends in Petroleum Markets For Defense Logistics Agency, Worldwide Energy Conference Washington, D.C. By T. Mason Hamilton, Petroleum Markets Analyst U.S. Energy Information Administration Independent
Experian Automotive Quarterly Briefing
 Experian Automotive Quarterly Briefing Second quarter 2017 automotive market share trends and registrations Marty Miller Senior Product Manager, Vehicles in Operation (VIO) Experian Public Today s presentation
SASKATOON STATION
 SRC CLIMATE REFERENCE STATION DAILY DATA REPORT SASKATOON STATION 45718 Saskatchewan 52 9' N 6 36' W 497 m asl Estab. 1963 JULY Preliminary 16 Day Temperature Degree-days Precipitation Relative Humidity
Secretary's Statistical Report Quarterly
 Date Sent: May 6, 200 Submitted by: G ALEXANDER BRYANT, SECRETARY ORGANIZATION ES COMPANIES NORTH AMERICAN DIVISION - Military Church ATLANTIC UNION CONFERENCE CANADA, SDA IN COLUMBIA UNION CONFERENCE
U.S. Ethanol Production, Imports and Stocks
 U.S. Ethanol Production, Imports and Stocks Daniel O Brien and Mike Woolverton, Extension Agricultural Economists K-State Research and Extension January 12, 29 Trends in production, imports and ending
XTERRA AMERICA TOUR RULES FOR AMATEURS How to win an XTERRA Regional Championship
 XTERRA AMERICA TOUR RULES FOR AMATEURS How to win an XTERRA Regional Championship Step 1: Identify your XTERRA Region as determined by the location of your primary residence at the time of your first race
Monthly Biodiesel Production Report
 Monthly Biodiesel Production Report With data for June 2017 August 2017 Independent Statistics & Analysis www.eia.gov U.S. Department of Energy Washington, DC 20585 This report was prepared by the U.S.
Week Ending: Oct. 25, 2018
 Week Ending: Oct. 25, 2018 Market Page 1. Thurs. Close Last Thurs. Close Weekly Change Week's High Week's Low Life of Contract High Life of Contract Low NEW YORK COTTON FUTURES (Cents/Lb.) December-18
Memorandum October 5, 2017
 614 Magnolia Avenue Ocean Springs, Mississippi 39564 228.818.9626 Memorandum October 5, 2017 To: Gary Miller, U.S. Environmental Protection Agency From: David Keith, John Laplante, Matt Henderson, and
PLANNED ENHANCEMENTS, NORTHEAST NATURAL GAS PIPELINE SYSTEMS (as of )
") PIPELINE SYSTEMS (as of 8-27-14) The Northeast Gas Association (NGA) has prepared this summary based on publicly-available information. NGA will strive to keep the information as updated as possible and
PIPELINE SYSTEMS (as of 8-27-14) The Northeast Gas Association (NGA) has prepared this summary based on publicly-available information. NGA will strive to keep the information as updated as possible and
Status of PNM s Completed Transmission Construction Projects 11/30/2017
 Status of s Completed Transmission Construction Projects Second Tah Ta Hey 115/345 kv Transformer Yah Ta Hey Switching Station On January 9, 2015, filed with the NMPRC under NMPRC Rule 440 information
2017 Meteorological and Oceanographic Summary for the Bocas del Toro Research Station. Prepared by: Steven Paton
 0 2017 Meteorological and Oceanographic Summary for the Bocas del Toro Research Station Prepared by: Steven Paton 1 Introduction This is the 5 th of a series of yearly reports summarising the past year
JOB CUT ANNOUNCEMENTS SURGE 45 PERCENT TO 76,835, HIGHEST MONTHLY TOTAL IN OVER THREE YEARS
 CONTACT Colleen Madden, Director of Public Relations Office: 312-422-5074 Mobile: 314-807-1568 colleenmadden@challengergray.com **EMBARGOED COPY** FOR RELEASE AT 7:30 A.M. ET, MARCH 7, 2019 JOB CUT ANNOUNCEMENTS
Week Ending: Dec. 8, 2016
 Week Ending: Dec. 8, 2016 Market Page 1. Thurs. Close Last Thurs. Close Weekly Change Week's High Week's Low Life of Contract High Life of Contract Low NEW YORK COTTON FUTURES (Cents/Lb.) March-17 71.42
2014 Meteorological and Oceanographic Summary for the Bocas del Toro Research Station. Prepared by: Steven Paton
 0 2014 Meteorological and Oceanographic Summary for the Bocas del Toro Research Station Prepared by: Steven Paton 1 Introduction This is the second of a series of yearly reports summarising the past year
The Changing Face of Global Refining
 The Changing Face of Global Refining OPIS National Supply Summit Las Vegas, Nevada October 24-26, 2010 John B. O Brien, Executive Chairman Baker & O Brien, Inc. All rights reserved. The Changing Face of
2016 Meteorological and Oceanographic Summary for the Bocas del Toro Research Station. Prepared by: Steven Paton
 0 2016 Meteorological and Oceanographic Summary for the Bocas del Toro Research Station Prepared by: Steven Paton 1 Introduction This is the forth of a series of yearly reports summarising the past year
2009 Migration Patterns traffic flow by state/province
 Interstate and Cross-Border 2009 Migration Patterns traffic flow by state/province Based on 71,474 Interstate Household Goods Moves from January 1, 2009 through December 31, 2009 UNITED STATES ALABAMA
8,975 7,927 6,552 6,764
 y = 0.1493x 4-23842x 3 + 1E+09x 2-4E+13x + 4E+17 R 2 = 0.9977 27,717 21,449 17,855 13,222 11,054 10,053 6/28/2009 6/24/2009 6/22/2009 6/20/2009 6/18/2009 6/16/2009 6/14/2009 6/8/2009 6/6/2009 6/4/2009
2010 Migration Patterns traffic flow by state/province
 Interstate and Cross-Border 2010 Migration Patterns traffic flow by state/province Based on 74,541 Interstate Household Goods Moves from January 1, 2010 through December 31, 2010 UNITED STATES ALABAMA
Marine Debris Regional Response Planning
 Regional Response Planning Marine Debris Regional Response Planning Caitlin Wessel Gulf of Mexico Regional Coordinator NOAA s Marine Debris Program Regional Response Team Region VI Meeting May 10-11, 2017
DEAL ER DATAVI EW. Digital Marketing Index October 2017
 DEAL ER DATAVI EW Digital Marketing Index October 2017 DATA DRIVES STRATEGY. Dealer DataView is a monthly automotive digital marketing index, based on Dealer.com s proprietary data, research and analytics.
Meteorology of Monteverde, Costa Rica 2005
 Meteorology of Monteverde, Costa Rica 2005 Technical Report submitted to the Monteverde Institute Andrew J. Guswa, Asst Professor, Picker Engineering Program Amy L. Rhodes, Asst Professor, Department of
DEAL ER DATAVI EW. Digital Marketing Index August 2018
 DEAL ER DATAVI EW Digital Marketing Index August 2018 DATA DRIVES STRATEGY. The DataView is a monthly automotive digital marketing index, based on Dealer.com s proprietary data, research and analytics.
Expansion Projects Description
 Expansion Projects Description The Turnpike expansion program was authorized by the Florida Legislature in 1990 to meet the State s backlog of needed highway facilities. The Legislature set environmental
NORTH CAROLINA HOMEOWNERS INSURANCE. SECTION F - INFORMATION REQUIRED BY N.C. GENERAL STATUTE (d2) and (d3)
 and (d3)") SECTION F - INFORMATION REQUIRED BY N.C. GENERAL STATUTE 58-36-15 (d2) and (d3) Portion of Rates Attributable to Wind and Non-Wind (G.S. 58-36-15 (d3))... F-2 Historical Hurricane Losses (G.S. 58-36-15
SECTION F - INFORMATION REQUIRED BY N.C. GENERAL STATUTE 58-36-15 (d2) and (d3) Portion of Rates Attributable to Wind and Non-Wind (G.S. 58-36-15 (d3))... F-2 Historical Hurricane Losses (G.S. 58-36-15
Westland No. 1 Mine (Bob Ciminel 2012)
") Westland No. 1 Mine (Bob Ciminel 2012) Westland Mine No. 1 was owned by the Pittsburgh Coal Company and located at the eastern (timetable) end of the Montour Railroad s Midland Spur/Westland Branch, just
Westland No. 1 Mine (Bob Ciminel 2012) Westland Mine No. 1 was owned by the Pittsburgh Coal Company and located at the eastern (timetable) end of the Montour Railroad s Midland Spur/Westland Branch, just
TRANSPACIFIC CUSTOMER ADVISORY Implementation of New BAF Formula Effective January 01, 2019
 December 7, 2018 TRANSPACIFIC CUSTOMER ADVISORY Implementation of New BAF Formula Effective January 01, 2019 Dear Valued Customer, Bunker is one of the important cost components for a container shipping
WIND MAP. United States
 Special Wind Region (Consult Local Authorities) LOCATION V mph (m/s) Hawaii 105 (47) Puerto Rico 145 (65) Guam 170 (76) Virgin Islands 145 (65) American Samoa 125 (56) Notes: 1. Values are nominal design
Xcel Energy sending crews to Puerto Rico to help with ongoing power restoration efforts Company trucks and equipment are en route
 Xcel Energy Media Relations 414 Nicollet Mall, 401-7 Minneapolis, MN 55401 (612) 215-5300 www.xcelenergy.com Xcel Energy sending crews to Puerto Rico to help with ongoing power restoration efforts Company
Joint Con Edison LIPA Offshore Wind Power Integration Project Feasibility Assessment
 Joint Con Edison LIPA Offshore Wind Power Integration Project Feasibility Assessment For NPCC Governmental / Regulatory Affairs Advisory Group May 21 st, 2009 ON IT Executive Summary Engineers from Con
Traffic Safety Facts 1996
 U.S. Department of Transportation National Highway Traffic Safety Administration Traffic Safety Facts 1996 Motorcycles In 1996, 2,160 motorcyclists were killed and an additional 56,000 were injured in
SCHOOLYARD WETLANDS: CREATING AQUATIC SPACES FOR LEARNING. C. A. Cole Penn State University
 SCHOOLYARD WETLANDS: CREATING AQUATIC SPACES FOR LEARNING C. A. Cole Penn State University cac13@psu.edu PA Academic Standards Environment and Ecology Environment and Ecology is grounded in the complexity
There. Need Them. When Hurricane Georges devastated. Rockwell Automation. Brings Chevron Refinery. Back From Disaster. Three Weeks Ahead of
 Chevron9/99pgs18-26 9/8/05 10:06 AM Page 18 There When You A-B Journal Staff When Hurricane Georges devastated its Pascagoula, Mississippi oil refinery, Chevron Corporation needed help fast. Rockwell Automation
Chart Discussion: Fri-02-Nov-2018 (Harvey Stern) Chart Discussion First 30+ Deg Day after winter in Melbourne
 Chart Discussion First 30+ Deg Day after winter in Melbourne") Chart Discussion First 30+ Deg Day after winter in Melbourne 1 Chart Discussion Latest Chart & SAT PIC 1 Consensus Forecast 9am Wind Direction & Speed [Days 1 to 14 for Melbourne Airport] D - 1 D - 2 D
Chart Discussion First 30+ Deg Day after winter in Melbourne 1 Chart Discussion Latest Chart & SAT PIC 1 Consensus Forecast 9am Wind Direction & Speed [Days 1 to 14 for Melbourne Airport] D - 1 D - 2 D
BACKGROUND. Dear Mr. Dietrich:
 Mr. Bren Dietrich, C.P.A. December 28, 2018 Chief Financial Officer, Florida s Turnpike Enterprise Florida Department of Transportation Florida s Turnpike, Milepost 263 Building 5315, Turkey Lake Service
2011 Soft Red Winter Wheat Quality Survey. Final
 2011 Soft Red Winter Wheat Quality Survey Final Survey Overview Illinois Indiana U.S. Wheat Class Production Areas Gulf Tributary SRW States and Areas Surveyed East Coast Tributary Weather and Harvest:
Sujit M. CanagaRetna The Council of State Governments (CSG) Southern Legislative Conference (SLC)
 Southern Legislative Conference (SLC)") The Drive to Move South: The Growing Role of the Automobile Industry in the South Sujit M. CanagaRetna The Council of State Governments (CSG) Southern Legislative Conference (SLC) Presentation Before the
The Drive to Move South: The Growing Role of the Automobile Industry in the South Sujit M. CanagaRetna The Council of State Governments (CSG) Southern Legislative Conference (SLC) Presentation Before the
Manufactured Home Shipments by Product Mix ( )
") Manufactured Home Shipments by Product Mix (1990-2014) Data Source: Institute for Building Technology and Safety (IBTS) * "Destination Pending" represents month-end finished home inventory at a plant.
Manufactured Home Shipments by Product Mix (1990-2014) Data Source: Institute for Building Technology and Safety (IBTS) * "Destination Pending" represents month-end finished home inventory at a plant.
EARTHQUAKE ACTIVITY IN THE YELLOWSTONE REGION. Preliminary Epicenters. January 1 March 31, 2014
 EARTHQUAKE ACTIVITY IN THE YELLOWSTONE REGION Preliminary Epicenters January 1 March 31, 2014 Prepared by the University of Utah Seismograph Stations and funded by the U.S. Geological Survey (Cooperative
FEB 2018 DEC 2017 JAN 2018 HOEP*
 Ontario Energy Report Q3 Electricity July September Electricity Prices Commodity Commodity cost comprises two components, the wholesale price (the Hourly Ontario Energy Price) and the Global Adjustment.
S WSW 67
 HANDOUT AT RS A FROM: RS A 909 133½ WSW REGULARITY SECTION A VIA: TO: TPA1, TPA2, TPA3 Test 2 via 843 250½ S and West Raynham map on page 12 of Roadbook. PROCEED AT 26.5 MPH for 5 MILES THEN AT 24.0 MPH
2008 Honda Civic EX. Vehicle Specifications. 4 Recalls. 22 events VIN: 2HGFG12888H Mid Range Car - Lower. Class 1.8L I4 MPI. Engine.
 2008 Honda Civic EX VIN: 2HGFG12888H563806 Vehicle Specs Accident Information 2008 Honda Civic EX 0 Records Found Title Information View Titles Vehicle Uses View Uses Events Odometer View Events 8 Records
One-Hundred-Year Storm Elevation Requirements for Habitable Structures Located Seaward of a Coastal Construction Control Line
 One-Hundred-Year Elevation Requirements for Habitable Structures Located Seaward of a Coastal Construction Control Line ELEVATION CERTIFICATE AND INSTRUCTIONS Prepared by: Florida Department of Environmental
U.S. GASOLINE AND DISTILLATE FUELS UPDATE - DECEMBER 20, 2017
 U.S. GASOLINE AND DISTILLATE FUELS UPDATE - DECEMBER 20, 2017 PRICE TRENDS Monday, December 18 According to the Energy Information Administration (EIA), the average U.S. retail price for regular grade
KINGDOM OF CAMBODIA NATION RELIGION KING 3
 KINGDOM OF CAMBODIA NATION RELIGION KING 3 TOURISM STATISTICS REPORT September 2017 MINISTRY OF TOURISM Statistics and Tourism Information Department No. A3, Street 169, Sangkat Veal Vong, Khan 7 Makara,
Downtown Lee s Summit Parking Study
 Downtown Lee s Summit Parking Study As part of the Downtown Lee s Summit Master Plan, a downtown parking and traffic study was completed by TranSystems Corporation in November 2003. The parking analysis
Solar Power. Demonstration Site. Annual Performance Report 2017
 Solar Power Demonstration Site Annual Performance Report 217 Version :1. July 12, 218 Solar Power Demonstration Site 217 Performance Report Introduction INTRODUCTION The Solar Power Demonstration Site
Pipeline: El Paso Natural Gas Updated: March 16, 2019, 11:58 am CDT
 Local Synoptic Briefing for today: United States and Canada: Troughs will be positioned over the northeastern United States with pockets of rain and interior snow likely. An associated cold front will
August 14, 2003 Outage Sequence of Events U.S./Canada Power Outage Task Force September 12, 2003
 August 14, 2003 Outage Sequence of Events U.S./Canada Power Outage Task Force September 12, 2003 This is an outline of significant physical and electrical events that occurred in a narrow window of time,
Challenges of DMS Control Centers in the Smart Grid. Gary Ockwell Efacec Advanced Control Systems Chief Technology Officer
 Challenges of DMS Control Centers in the Smart Grid Gary Ockwell Efacec Advanced Control Systems Chief Technology Officer June 5, 2013 Affected: 30 Million Inhabitants 800,000 in trapped subways 250 Flights
David W. Salter Collection
 Southern Museum of Civil War And Locomotive History Archives & Library David W. Salter Collection Norfolk & Western Railroad Photographs MS2010.014 P2010.014 Provenance: The David W. Salter Collection