Individual Certification Programs Status Update
|
|
|
- Darcy Bennett
- 5 years ago
- Views:
Transcription
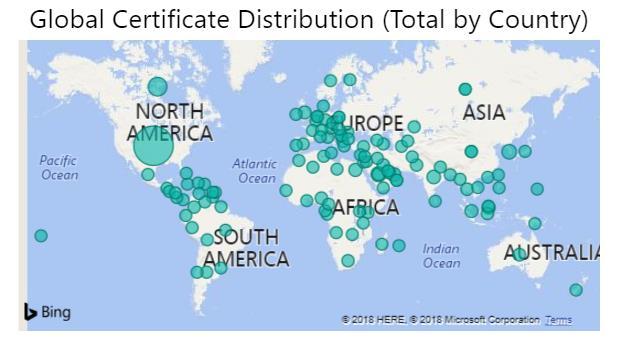
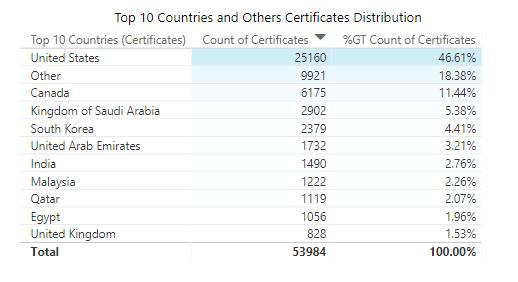
1 Individual Certification Programs Status Update Breakdown as of 10/01/2018 Andri Orphanides
2 Overall Program Growth API 510 API 570 API 653 Other Program 13-Apr 13-Nov 14-May 14-Oct 15-Apr 15-Nov 16-May 16-Nov 17-May 18-Apr 18-Nov API API API API TES API API API QUTE QUSE QUPA QUSE-PA SI - FE API SI-RE ACP SIEE TOTAL ,325 44,463 45,587 51,374 53,984 Seeing an uptick in number of people recertifying in the last year, and a small increase in number of applications from the same time last year. 1 P a g e


3 ICP currently has over 34,000 inspectors in 130 countries. 2 P a g e
4 Percentage Breakdown of Certified Inspectors Other countries Canada USA % 10.00% 20.00% 30.00% 40.00% 50.00% 60.00% 70.00% 80.00% Note: 2018 numbers are as of October 31, 2018 USA Canada Other Countries % % % % % % % % % % % % % % % % % % % % % % % % % % % % % % % % % % % % % % % 3 P a g e
5 4 P a g e

6 Member vs. Non-Member 5 P a g e

7 Demographic Breakdown of Certified Inspectors 6 P a g e
8 7 P a g e
9 Breakdown of Exams Administered 2500 Distribution of Exams per Window per exams are shown through completion of September 2018 window. Within the same time-period, the distribution of exams per window was as follows: Month January February March April May June July August September October TBD November TBD December TBD Total P a g e
10 Total Exams Distribution of Exams per Window 2017-Sept Exams 2017 Exams Windows Spike in numbers for February 2018 due to overlap of 1169 window into the month of February, combined with the numbers for 570 window in the same month. 9 P a g e
11 Top 20 Countries by Exams Administered Sep Country Top 20 Total USA Saudi Arabia 5033 Canada 4444 India 3835 South Korea 2666 Malaysia 1795 United Arab Emirates 1733 Singapore 1451 Egypt 1042 Qatar 757 Australia 682 Thailand 668 United Kingdom 632 Pakistan 596 Kuwait 537 South Africa 486 China 478 Colombia 457 Ghana 430 Taiwan 345 Total Between 2014 and September 2018, ICP administered 52,600 exams in 78 different countries. We have utilized over 400 of the 500 Prometric testing centers around the world. Above is a chart that shows the top 20 countries by growth since the introduction of computer-based testing centers in As you can see, over time, 49, 148 (93.4%) of our exams were delivered in those top 20 countries. 10 P a g e
12 Historical Exam Performance * Denotes introduction of pre-test items and change in overall cut score to 125 scored items. ** Exams delivered after September 2017 reflect pass rates with the new seat times implemented. ^ First administration with scaled scoring. 400 is the pass point for all exams except Auditors Certification Programs (ACP). Note: Report reflects completed exams as of September P a g e
13 Exam Administration API Pressure Vessel Inspectors CANDI- DATES PASS FAIL PASS % Pass Point 2011 June September December June September December * 2013 June September December May September / January /86 May /86 September / January /86 May /88 September / January /88 May /88 September / January* /88 May /90 September^ API Aboveground Storage Tanks Inspectors Exam CANDI- PASS FAIL PASS % PASS POINT administration DATES 2011 March September March September March September March July November March July November / March /87 July /87 November March July November* March July P a g e
14 Exam administratio n API Piping Inspectors CANDI- DATES PASS FAIL PASS % PASS POINT 2010 June September December June September December June September December * 2013 June September December June October February June October / February /90 June /90 October / February /92 June /92 October* / February June P a g e
15 YEAR EXAM ADMINISTRATI ON API TES Tank Entry Supervisors Exam administration CANDI- DATES PASS FAIL PASS % PASS POINT (out of 75) 2011 February June December June December June December April August December April August December April August December April August December* April August^ CANDI- DATES PASS FAIL PASS % PASS POINT (OUT OF 120) 2011 March September March September March September March July November March July November / March /74 July /74 November / March /74 July /74 November* March July API Refractory Personnel 14 P a g e
16 API Corrosion and Materials Professional September March September March September April August December April August December April August December April August December* April August^ API Risk Based Inspection Professional Exam CANDI- PASS FAIL PASS % PASS POINT administration DATES (out of 70) 2011 March Exam CANDI- PASS FAIL PASS % PASS POINT administration DATES (out of 70) 2011 March September March September March September April August December April August December April August December April August December* April August^ P a g e
17 API Welding Inspection and Metallurgy Professional Exam CANDI- PASS FAIL PASS % PASS POINT administration DATES (out of 70) 2011 March September March September March September April August December April August December April August December April August December* April August^ P a g e
18 Exam administrati on API SIFE - Source Inspector Fixed Equipment CANDI- DATES PASS FAIL PASS % PASS POINT (out of 100) 2013 November April August December April August December April August December March July September (Special) November* March July Exam administrati on API SIRE - Source Inspector Rotating Equipment CANDI- DATES PASS FAIL PASS % PASS POINT (out of 100) 2015 December April August December March July November* March July Exam administrati on API SIEE - Source Inspector Electrical Equipment CANDI- DATES PASS FAIL PASS % PASS POINT (out of 100) 2016 December March July November* March July P a g e
19 API ACP - Auditor Certification IAQ1 August March July November IAQ2 LAQ1 August December March July November March July LAQ2 Exam CANDI- PASS FAIL PASS % administration DATES 2016 March Exam CANDI- PASS FAIL PASS % administration DATES 2017 March July 0 November AQ1 Exam CANDI- PASS FAIL PASS % administration DATES 2016 March August December March July November March July Exam CANDI- PASS FAIL PASS % administration DATES 2016 March Exam CANDI- PASS FAIL PASS % administration DATES 2016 March August December March July November P a g e
20 API Pipeline Inspector YEAR EXAM ADMINISTRATION CANDI- DATES PASS FAIL PASS % PASS POINT 2014 November March July November March /70 June Special /70 July /70 November / January /70 April /71 August /71 September/October /71 December / January /71 April /71 June /71 August /71 19 P a g e
21 API QUTE Session # Exam administration CANDI-DATES PASS FAIL PASS % January January February February March May July August September November January March May July September November January February I February II March % 66 May July August September October November December January March June September November January March July Special Session November P a g e
22 January March May July September P a g e
23 API QUSE Session Exam CANDI- PASS FAIL PASS % administration DATES 2007 Pilot pilot December No applications 2011 July November March June November March September November January July September January February I February II March May July August September November December January March June September November January March July Special Session 87 November January March May July September P a g e
24 API QUPA Exam CANDI- PASS FAIL PASS % administration DATES 2007 pilot December No applications 2011 July November March June November March September November January July September January February I February II March May July August September November December January March June September November January March July Special Session 87 November January March May July September P a g e
25 API QUSE-PA Exam CANDI- PASS FAIL PASS % administration DATES 2017 pilot Special July Special Session 87 November January March May July September P a g e
Spain s imports by oil product group and country of origin
 Corporación de Reservas Estratégicas de Productos Petrolíferos Castellana, 79 28046 Madrid T. +34 91 360 09 10 Updated F. +34 91 420 on39 45 www.cores.es February 12 th 2018 Spain s imports by oil product
Spain s imports by oil product group and country of origin
 Corporación de Reservas Estratégicas de Productos Petrolíferos Castellana, 79 28046 Madrid T. +34 91 360 09 10 Updated F. +34 91 420 on39 45 www.cores.es July 12 th 2018 Spain s imports by oil product
Spain s exports by oil product group and country of destination
 Corporación de Reservas Estratégicas de Productos Petrolíferos Castellana, 79 28046 Madrid T. +34 91 360 09 10 Updated F. +34 91 420 on39 45 www.cores.es February 13 th 2017 Spain s exports by oil product
Global Threat Reduction Initiative Foreign Research Reactor Spent Nuclear Fuel Shipments
 FY1996 1. Sept. 22, 1996 280 assemblies in 8 casks to SRS [First East Coast Shipment] FY 1997 Sweden 64 Switzerland 42 Germany 125 Chile 28 Columbia 21 2. Dec. 15, 1996 41 spent fuel assemblies in one
Spain s exports by oil product group and country of destination. Year Corporación de Reservas Estratégicas de Productos Petrolíferos
 Corporación de Reservas Estratégicas de Productos Petrolíferos Castellana, 79 28046 Madrid T. +34 91 360 09 10 Updated F. +34 91 420 on39 45 www.cores.es July 13 th 2015 Spain s exports by oil product
Spain s imports by oil product group and country of origin
 Corporación de Reservas Estratégicas de Productos Petrolíferos Castellana, 79 28046 Madrid T. +34 91 360 09 10 Updated F. +34 91 420 on39 45 www.cores.es September 12 th 2018 Spain s imports by oil product
Kernel Wt. 533,229,317 1,005,999,479 1,539,228, ,964, ,947, ,911, Crop Year
 Almond Industry Position Report MAY 2015 2014-2015 Crop Year Salable Forecast Million Lbs. 2014-2015 Kernel Wt. 2013-2014 Kernel Wt. % Change 1. Carryin August 1, 2014 2. Crop Receipts to Date 3. [3% Loss
NZPork Monthly Import Report
 NZPork Monthly Import Report IW Barugh and EJ Neumann December 10, 2017 1 Data summary for October 2017 Data from January 2000 through October 2017 was downloaded from the Statistics NZ website (http://www.stats.govt.
EU Dairy Exports to Third countries
 Milk Market Observatory TRA.EU.Extr Latest update : 12.6.218 Source : Eurostat (COMEXT) EU Dairy Exports to Third countries (January-April) 16 14 12 1 8 6 4 2 BUTTER exports 1 Tonnes 162 135 137 12 94
Forecast Million Lbs. % Change 1. Carryin August 1, ,012, ,677, %
 Almond Industry Position Report SEPTEMBER 2018 2018-2019 Crop Year Salable Forecast Million Lbs. 2018-2019 08/01-09/30 Kernel Wt. 2017-2018 08/01-09/30 Kernel Wt. % Change 1. Carryin August 1, 2018 359.0
KINGDOM OF CAMBODIA NATION RELIGION KING 3
 KINGDOM OF CAMBODIA NATION RELIGION KING 3 TOURISM STATISTICS REPORT March 2015 MINISTRY OF TOURISM Statistics and Tourism Information Department No. A3, Street 169, Sangkat Veal Vong, Khan 7 Makara, Phnom
KINGDOM OF CAMBODIA NATION RELIGION KING 3
 KINGDOM OF CAMBODIA NATION RELIGION KING 3 TOURISM STATISTICS REPORT December 2015 MINISTRY OF TOURISM Statistics and Tourism Information Department No. A3, Street 169, Sangkat Veal Vong, Khan 7 Makara,
Inventory Levels - All Prices. Inventory Levels - By Price Range
 Inventory Levels - All Prices Idaho Falls Bonneville Total 3-Nov-17 198 128 326 2-Nov-18 155 134 289-11% Inventory Levels - By Price Range 3-Nov-17 2-Nov-18 0-100,000 17 11 100,001-125,000 15 9 125,001-150,000
KINGDOM OF CAMBODIA NATION RELIGION KING 3
 KINGDOM OF CAMBODIA NATION RELIGION KING 3 TOURISM STATISTICS REPORT March 2018 MINISTRY OF TOURISM Statistics and Tourism Information Department No. A3, Street 169, Sangkat Veal Vong, Khan 7 Makara, Phnom
KINGDOM OF CAMBODIA NATION RELIGION KING 3
 KINGDOM OF CAMBODIA NATION RELIGION KING 3 TOURISM STATISTICS REPORT February 2017 MINISTRY OF TOURISM Statistics and Tourism Information Department No. A3, Street 169, Sangkat Veal Vong, Khan 7 Makara,
KINGDOM OF CAMBODIA NATION RELIGION KING 3
 KINGDOM OF CAMBODIA NATION RELIGION KING 3 TOURISM STATISTICS REPORT October 2017 MINISTRY OF TOURISM Statistics and Tourism Information Department No. A3, Street 169, Sangkat Veal Vong, Khan 7 Makara,
KINGDOM OF CAMBODIA NATION RELIGION KING 3
 KINGDOM OF CAMBODIA NATION RELIGION KING 3 TOURISM STATISTICS REPORT September 2017 MINISTRY OF TOURISM Statistics and Tourism Information Department No. A3, Street 169, Sangkat Veal Vong, Khan 7 Makara,
KINGDOM OF CAMBODIA NATION RELIGION KING 3
 KINGDOM OF CAMBODIA NATION RELIGION KING 3 TOURISM STATISTICS REPORT May 2017 MINISTRY OF TOURISM Statistics and Tourism Information Department No. A3, Street 169, Sangkat Veal Vong, Khan 7 Makara, Phnom
Kernel Wt. 422,141, ,395,402 1,248,536, ,849, ,298, ,148, Crop Year
 Almond Industry Position Report 2014-2015 Crop Year Salable Forecast Million Lbs. 2014-2015 8/1-3/31 Kernel Wt. 2013-2014 8/1-3/31 Kernel Wt. MARCH 2015 % Change 1. Carryin August 1, 2014 2. Crop Receipts
Loss & Exempt Percentages & Crop Size History 1.94% 1.89%
 September 9, 2016 Dear Industry Members, Please note that the Beginning Inventory/Carry-in figure for 8/1/2016 reflects the actual Loss & Exempt (L&E) figure for the 2015/2016 crop year. The actual L&E
Kernel Wt. 545,210, ,900, ,973, ,642, ,616, Crop Year 8/1-1/31 291,689,267 38, ,757
 Almond Industry Position Report 2015-2016 Crop Year Salable Forecast Million Lbs. 2015-2016 8/1-1/31 Kernel Wt. 2014-2015 8/1-1/31 Kernel Wt. JANUARY 2016 % Change 1. Carryin August 1, 2015 2. Crop Receipts
265,796, ,447,255 1,021,243, ,522, ,349, ,871, Crop Year
 Almond Industry Position Report 2011-2012 Crop Year Salable Forecast Million Lbs. 2011-2012 8/1-01/31 Kernel Wt. 2010-2011 8/1-01/31 Kernel Wt. JANUARY 2012 % Change 1. Carryin August 1, 2011 2. Crop Receipts
Kernel Wt. 649,153, ,948, ,710, ,452, ,163, Crop Year 8/1-2/29 342,795,454 -2, ,935
 Almond Industry Position Report 2015-2016 Crop Year Salable Forecast Million Lbs. 2015-2016 8/1-2/29 Kernel Wt. FEBRUARY 2016 2014-2015 8/1-2/28 Kernel Wt. % Change 1. Carryin August 1, 2015 2. Crop Receipts
Inventory Levels - All Prices. Inventory Levels - By Price Range
 Inventory Levels - All Prices Idaho Falls Bonneville Total 7-Apr-17 154 111 265 6-Apr-18 113 91 204-23% Inventory Levels - By Price Range 7-Apr-17 6-Apr-18 0-100,000 36 10 100,001-125,000 13 9 125,001-150,000
Kernel Wt. 218,700, ,434, ,134, ,161, ,785, ,947, Crop Year
 Almond Industry Position Report 2010-2011 Crop Year Salable Forecast Million Lbs. 2010-2011 8/1-12/31 Kernel Wt. 2009-2010 8/1-12/31 Kernel Wt. December 2010 % Change 1. Carryin August 1, 2010 2. Crop
Kernel Wt. 368,369, ,245, ,557, ,911, ,469, Crop Year 8/1-11/30 203,876,451 36, ,936
 Almond Industry Position Report 2015-2016 Crop Year Salable Forecast Million Lbs. 2015-2016 8/1-11/30 Kernel Wt. NOVEMBER 2015 2014-2015 8/1-11/30 Kernel Wt. % Change 1. Carryin August 1, 2015 2. Crop
The July 2018 Carry-out from the July 2018 Position Report compared to actual:
 September 11, 2018 Dear Industry Members, Please note that the Beginning Inventory/Carry-in figure for 8/1/2018 reflects the actual Loss & Exempt (L&E) figure for the 2017/2018 crop year. The actual L&E
India & Asia. Steel Scrap Industry BY: VED PRAKASH GEMINI CORPORATION N. V., BELGIUM
 India & Asia Steel Scrap Industry BY: VED PRAKASH GEMINI CORPORATION N. V., BELGIUM 1 GEMINI CORPORATION N. V. Steel, Recyclable Plastics, Rubber and Engineered Wood Panels 2 Content How competitive are
BP Statistical Review of World Energy June 2017
 BP Statistical Review of World Energy June 217 Primary energy 8 Consumption 8 Consumption by fuel 9 66 th edition Primary energy Consumption* Growth rate per annum Million tonnes oil equivalent 26 27 28
World Air Conditioner Demand by Region
 World Air Conditioner Demand by Region April 2015 The Japan Refrigeration and Air Conditioning Industry Association 1 World Air Conditioner Demand by Region April 2015 The Japan Refrigeration and Air Conditioning
PET(S) FIRST & LAST NAME: January 2019
 FIRST & LAST NAME: January 2019") January 2019 1 2 3 4 5 New Year's Day 6 7 8 9 10 11 12 13 14 15 16 17 18 19 20 21 22 23 24 25 26 27 28 29 30 31 SPECIAL TE We will not have Doggie available during these dates: *3/29-4/7, 4/19-4/21, 5/24-5/27,
January 2019 1 2 3 4 5 New Year's Day 6 7 8 9 10 11 12 13 14 15 16 17 18 19 20 21 22 23 24 25 26 27 28 29 30 31 SPECIAL TE We will not have Doggie available during these dates: *3/29-4/7, 4/19-4/21, 5/24-5/27,
Citrus: World Markets and Trade
 United States Department of Agriculture Foreign Agricultural Service July 2015 Citrus: World Markets and Trade Oranges Global orange production for is estimated to decline 7 percent from the previous year
Primary energy. 8 Consumption 9 Consumption by fuel. 67 th edition
 Primary energy 8 Consumption 9 Consumption by fuel 67 th edition Primary energy Consumption* Growth rate per annum Million tonnes oil equivalent 27 28 29 2 211 212 213 214 215 216 217 217 26-16 Share 217
Citrus: World Markets and Trade
 United States Department of Agriculture Foreign Agricultural Service uary 2015 Citrus: World Markets and Trade Oranges Global orange production for is forecast to decline 4 percent from the previous year
UXC.COM A PUBLICATION OF. NPO Overview 1501 MACY DRIVE ROSWELL, GA PH FX
 2019 A PUBLICATION OF UXC.COM NPO Overview 1501 MACY DRIVE ROSWELL, GA 30076 PH +1 770 642-7745 FX +1 770 643-2954 NOTICE UxC, LLC ( UxC ) shall have title to, ownership of, and all proprietary rights
Inventory Levels - All Prices. Inventory Levels - By Price Range
 Inventory Levels - All Prices Idaho Falls Bonneville Total 3-Mar-17 152 108 260 2-Mar-18 109 78 187-28% Inventory Levels - By Price Range 3-Mar-17 2-Mar-18 0-100,000 41 6 100,001-125,000 19 8 125,001-150,000
RUBBER PRODUCTS STATISTICS September 2018 (Data up to July 2018)
") RUBBER PRODUCTS STATISTICS September 2018 (Data up to July 2018) Date: 20/09/2018 0 TABLE OF CONTENTS: Table 1: Profile of the Malaysian Rubber Products Manufacturing Industry... 2 Chart 1.1: Malaysian
RUBBER PRODUCTS STATISTICS September 2018 (Data up to July 2018) Date: 20/09/2018 0 TABLE OF CONTENTS: Table 1: Profile of the Malaysian Rubber Products Manufacturing Industry... 2 Chart 1.1: Malaysian
Total Production by Month (Acre Feet)
") Production by Month (acre-feet) 2008 2009 2010 2011 2012 2013 2014 2015 2016 January 25 339.10 228.90 249.50 297.99 243.06 327.14 247.66 212.37 February 234.00 218.80 212.10 241.52 245.82 279.08 234.16
Production by Month (acre-feet) 2008 2009 2010 2011 2012 2013 2014 2015 2016 January 25 339.10 228.90 249.50 297.99 243.06 327.14 247.66 212.37 February 234.00 218.80 212.10 241.52 245.82 279.08 234.16
Wheat Marketing Situation
 Wheat Marketing Situation Prepared by: Darrell L. Hanavan Executive Director Colorado Wheat Administrative Committee If you would like to receive an email when this report is updated, email gmostek@coloradowheat.org
Algebra II Pacing Guide
 Unit 13: Exploring a Business Venture (10 days) 8 May 13 - May 24 n/a MISD Pacing Guide Date Range Unit 01: Introduction to Functions in 15 Aug. 21 - Sept. 11 Sept. 12 Unit 02: Absolute Value Functions,,
KINGDOM OF CAMBODIA NATION RELIGION KING 3
 KINGDOM OF CAMBODIA NATION RELIGION KING 3 TOURISM STATISTICS REPORT September 2018 MINISTRY OF TOURISM Statistics and Tourism Information Department No. A3, Street 169, Sangkat Veal Vong, Khan 7 Makara,
Date Event or Holiday :Sun, 2:Mon North Orchard Delong Preschool North Orchard Delong Preschool
 2018 6 1 1:Sun, 2:Mon 2018-2019 Date Event or Holiday Aug 16 Board Meeting 6pm Aug 23 Open House June 2018 July 2018 August 2018 Sep 06 Board Meeting 6pm Su M Tu W Th F Sa Su M Tu W Th F Sa Su M Tu W Th
KINGDOM OF CAMBODIA NATION RELIGION KING 3
 KINGDOM OF CAMBODIA NATION RELIGION KING 3 TOURISM STATISTICS REPORT October 2018 MINISTRY OF TOURISM Statistics and Tourism Information Department No. A3, Street 169, Sangkat Veal Vong, Khan 7 Makara,
Units of Instruction MISD Pacing Guide Days Date Range Test Date
 MISD Pacing Guide Date Range Test Date Introduction: Processes of Investigations (1 day) Aug. 21 Unit 01: Matter (12 days) Aug. 22-Sept. 7 Sep. 10 Unit 02: Atomic Structure and the Periodic Table (15 days)
Global Dialysis - Cost per Dialysis Session
 Cost per session for dialysis where a cost has been entered for a dialysis centre. All costs have been converted to US Dollars as at 19 May 2006. Note that the costs do not state what is covered by a dialysis
China s Global Peanut Export Share Declines
 United States Department of Agriculture Foreign Agricultural Service Circular Series FOP 07-13 China s Global Peanut Export Share Declines U.S. 10% Others 19% Argentina 17% U.S. 11% Others 16% Argentina
INDONESIA EXPORT AND IMPORT, APRIL 2017
 No. 48/05/Th.XX, May, 15 th INDONESIA EXPORT AND IMPORT, APRIL Table 1. FOB Value of Indonesian Exports (Million US $) and Percentage of Change ( %) % Share Jan Apr March Jan Apr y-on-y m-on-m Jan Apr
Annex IV. True nationality of the 20 largest fleets by flag of registration, as at 1 January 2011 a
 194 Annex IV. True nationality of the 20 largest fleets by flag of registration, as at 1 January 2011 a Antigua and Barbuda Bahamas China Belgium 0 0-9 122 0.2 1 59 0.1 Bermuda 0 0-17 1 907 2.8 0 0 - Brazil
No. CONSUMER PRICE INDICES. Information bulletin. Moscow 2019
 No. January 209 CONSUMER PRICE INDICES Information bulletin Moscow 209 No. (87) January 209 Consumer prices by group of goods and services (per cent change month-on-month) Table Inflation Core inflation
EXECUTIVE SUMMARY ATLANTIC SALMON NO 03/06
 MARKET This table shows development in supply/consumption of Atlantic salmon in the main markets per month, in tonnes r.w The table contains preliminary figures and may diverge from same figures in the
Argentine Exporters Switch to Soybean Oil as Biodiesel Exports Fall
 United States Department of Agriculture Foreign Agricultural Service Circular Series FOP 08-13 Argentine Exporters Switch to Soybean Oil as Biodiesel Exports Fall Argentina s soybean oil exports have surged
Citrus: World Markets and Trade
 United States Department of Agriculture Foreign Agricultural Service January 2017 Citrus: World Markets and Trade Oranges Global orange production for 2016/17 is forecast up 2.4 million metric tons from
Sharp Decline in Vegetable Oil Stocks Leads to Steeply Higher Prices
 United States Department of Agriculture Foreign Agricultural Service Circular Series FOP 1-11 Sharp Decline in Vegetable Oil Leads to Steeply Higher Prices Commodity prices have been on an upward trend
Early-Season U.S. Soybean Meal Sales Surge
 United States Department of Agriculture Foreign Agricultural Service November 2014 Early-Season U.S. Soybean Meal Sales Surge U.S. soybean meal export commitments (accumulated exports plus outstanding
IOWA MOLD TOOLING CO., INC. BOX 189, GARNER, IA TEL: IMT PART NUMBER
 CRANE LOG CALENDAR YEAR CRANE MODEL Daily Inspections Weekly Inspections Monthly Inspections Lubrication Record Maintenance Record Damage & Repair Record Modification Record Reference Specifications CRANE
STATISTICS BOTSWANA. BOTSWANA international MONTHLY DIGEST NOVEMBER No. 2014/01
 BOTSWANA international merchandise trade STATISTICS No. 2014/01 MONTHLY DIGEST STATISTICS BOTSWANA Copyrights C Statistics Botswana 2014 NOVEMBER 2013 Contact Statistician: Keanewa Mandoze Email: kmandoze@gov.bw
IEA Analysis of Fossil-Fuel Subsidies for APEC
 211/SOM3/DIA/3 Session 2 IEA Analysis of Fossil-Fuel Subsidies for APEC Submitted by: IEA Policy Dialogue on Fossil Fuel Subsidy Reform San Francisco, United States 23 September 211 IEA analysis of fossil
Production (bbl/day)
") 1 of 5 14/09/2011 22:15 From Wikipedia, the free encyclopedia This is a list of countries by oil production mostly based on CIA World Factbook data. [1] Note that oil production refers to the sum of barrels
1 of 5 14/09/2011 22:15 From Wikipedia, the free encyclopedia This is a list of countries by oil production mostly based on CIA World Factbook data. [1] Note that oil production refers to the sum of barrels
MARKET NEWS for pig meat
 MARKET NEWS for pig meat Market analysis 4 July 2016 Week 27 MARKET SITUATION Europe: Trade in pork legs took place at slightly rising prices this week. Loins and collars as well as other cuts were traded
Indian Soybean Meal Exports Unlikely to Recover in 2015/16
 United States Department of Agriculture Foreign Agricultural Service November 2015 Indian Soybean Meal Exports Unlikely to Recover in Though once a significant regional exporter of soybean meal, India
MONTHLY NEW RESIDENTIAL CONSTRUCTION, NOVEMBER 2017
 FOR RELEASE AT 8:30 AM EST, TUESDAY, DECEMBER 19, MONTHLY NEW RESIDENTIAL CONSTRUCTION, NOVEMBER Release Number: CB17-206 December 19, - The U.S. Census Bureau and the U.S. Department of Housing and Urban
2011 Third Quarter Update 17 November 2011
 2011 Third Quarter Update 17 November 2011 Operations Highlights Group (In HK$ millions) 3Q11 3Q10 2011 2010 Sales 1,334 1,125 +19% 3,983 3,262 +22% Gross profit 767 638 +20% 2,348 1,875 +25% Gross margin
Toyota IMV Sales Reach Global 5 Million-unit Mark
 Apr. 06, 2012 Toyota IMV Sales Reach Global 5 Million-unit Mark Toyota City, Japan, April 6, 2012 Toyota Motor Corporation (TMC) announces that worldwide cumulative sales of its Innovative International
OUR WORLD OF POWER IS CHANGING
 23 March 2017 VALVE MANUFACTURERS ASSOCIATION OF AMERICA OUR WORLD OF POWER IS CHANGING LYLE WHITE VICE PRESIDENT LW15 29 June 2015 THERE ARE TRENDS CHANGING OUR WORLD OF ENERGY AND THE WAY WE USE TO DO
FOR IMMEDIATE RELEASE
 Article No. 7761 Available on www.roymorgan.com Roy Morgan Unemployment Profile Monday, 8 October 2018 Unemployment down to 9.4% in September off two-year high Australian employment has grown solidly over
M O T O R V E H I C L E S T A T I S T l C S
 M O T O R V E H I C L E S T A T I S T l C S of Japan 2017 JAPAN AUTOMOBILE MANUFACTURERS ASSOCIATlON, INC. C O N T E N T S Motor Vehicles in Use Cars, Trucks, Buses and Special Purpose Vehicles, 1945-2016
Price Category Breakdown - February 2010
 SINGLE FAMILY RESIDENTIAL BREAKDOWN ruary 21 ruary Sales and Average Price Increase Annually TORONTO - Wednesday, March 3, 21 7.3 % 24.6 % 1.8 % 7.3%.2%.1 % Greater Toronto REALTORS reported 7,291 sales
 Urchin 7 cflag.ifas.ufl.edu Page 1 of 2 Standard View Export All Visits Permalink Geo Location Jul 1, 2015 - Jul 31, 2015 First Date 2015 Compare to Past Jan Feb Mar Apr May Jun Jul Aug Sep Oct Nov Dec
Bulk Storage Containers
 UCSB AST SPCC SELF-INSPECTION CHECKLIST Year: Responsible Department: Tank Location: Tank ID: Bulk Storage Containers Total tank capacity: Petroleum type and amount: Secondary containment type: (diesel,
January 4, October 20, October 20, March 29, December 16, December 27, August 2, 2001.
 Treaty Countries Country Classification Effective Date Albania E-2 Argentina E-1 Argentina E-2 Armenia E-2 Australia E-1 Australia E-2 January 4, 1998 October 20, October 20, March 29, December 16, 1991
Treaty Countries. 1 of 6 4/13/13 10:46 PM. Country Classification Effective Date
 Treaty Countries Country Classification Effective Date Albania E-2 January 4, 1998 Argentina E-1 October 20, 1994 Argentina E-2 October 20, 1994 Armenia E-2 March 29, 1996 Australia E-1 December 16, 1991
Lifting Instructions for 1336 PLUS and FORCE D Frame Drives
 Installation Instructions Lifting Instructions for 1336 PLUS and FORCE D Frame Drives This publication will guide you through the steps needed to properly lift and mount the following drives: 1336 PLUS
CEO PROGRAM September 2018
 CEO PROGRAM September 2018 1 Sept 17th: ALL! CEO High Orientation (Kiva 6pm 7:30pm) 2 3 4 5 6 7 8 Sept 18th: ALL! CEO Orientation (Kiva 6pm 7:30pm) 9 10 11 12 13 14 15 *Parents please drop off/pick up
MONTHLY NEW RESIDENTIAL CONSTRUCTION, APRIL 2017
 FOR RELEASE AT 8:30 AM EDT, TUESDAY, MAY 16, MONTHLY NEW RESIDENTIAL CONSTRUCTION, APRIL Release Number: CB17-75 May 16, - The U.S. Census Bureau and the U.S. Department of Housing and Urban Development
67 th edition. Renewable energy. Appendices. 44 Other renewables consumption 45 Biofuels production
 Renewable energy 44 Other renewables consumption 45 Biofuels production Appendices A1 Solar Generation A2 Wind Generation A3 Geothermal, biomass and other Generation A4 Geothermal Cumulative installed
FEDERAL RESERVE statistical release
 FEDERAL RESERVE statistical release FOR IMMEDIATE RELEASE MARCH 16, 1992 E.U C1Z1, GEOGRAPHICAL r DISTRIBUTION n OF e ASSETS AND^LIABILITIES (IN MILLIONS OF DOLLARS) ASSETS COUNTRY OF CUSTOMER 12/31/90
Crane Inspection Log. Mailing Address: P.O. Box Tulsa, OK Phone: (918) Fax: (918)
 Fax: (918)") 999978000 Crane Inspection Log Mailing Address: P.O. Box 581510 Tulsa, OK 74158-1510 Physical Address: 4707 North Mingo Road Tulsa, OK 74117-5904 Phone: (918) 836-0463 Fax: (918) 834-5979 www.autocrane.com
999978000 Crane Inspection Log Mailing Address: P.O. Box 581510 Tulsa, OK 74158-1510 Physical Address: 4707 North Mingo Road Tulsa, OK 74117-5904 Phone: (918) 836-0463 Fax: (918) 834-5979 www.autocrane.com
Preliminary Steel Imports Increase 16% in January Highest Total Imports Since January 2009
 News Release FOR IMMEDIATE RELEASE February 23, 2010 CONTACT: NANCY GRAVATT 202.452.7115/ ngravatt@steel.org Preliminary Steel Imports Increase 16% in uary Highest Total Imports Since uary 2009 Washington,
Coconut Oil Prices Spike
 United States Department of Agriculture Foreign Agricultural Service Coconut Oil Prices Spike Coconut oil prices have surged over the past year in contrast to the general downward trend in other vegetable
Preliminary Steel Imports Decline 9% in September Import Market Share at 20%
 News Release FOR IMMEDIATE RELEASE October 25, 2011 CONTACT: NANCY GRAVATT 202.452.7115/ ngravatt@steel.org Preliminary Steel Imports Decline 9% in September Import Market Share at 20% Washington, D.C.
U.S. Soybean Prices Fall as Buyers Focus Turns to South America
 United States Department of Agriculture Foreign Agricultural Service Circular Series FOP 2-10 ruary 2010 U.S. Soybean Prices Fall as Buyers Focus Turns to South America $11.00 Daily U.S. Soybean Cash Price
International Olive Council. International Olive Council
 Advisory Committee on Olive Oil and Table Olives 29 June 29 1 115 CHANGES IN WORLD CROP AREA (thousand hectares) Bearing Non-bearing Irrigated Dry-farmed % change between years = 2% 11,52 9,137,867 1,21,39
up the formulas. You can copy/paste the formulas for the days within the same October 2017 Jan 1, 2 & 5 Student Christmas Break April 2018
 School Year Calendar Template 2013-2014 Vertex42 LLC INSTRUCTIONS Year: 2017 Beginning Month: 8 Start day: 1 1:Sunday, 2:Monday «Choose the year and beginning month Note: If you choose Monday as the start
Imports of seed for sowing by country Calendar year 2011 Source: ISF compilation based on official statistics and international seed trade reports
 USA 157,432 15,562 464 173,458 523 318 67 908 Germany 195,159 5,913 520 201,592 595 97 22 714 France 125,701 4,389 277 130,367 522 150 11 683 Netherlands 140,899 12,253 796 153,948 250 330 48 628 Italy
TECHNICAL SERVICE BULLETIN
 TECHNICAL SERVICE BULLETIN To: Minuteman Dealers and Customers From: Minuteman Technical Support Date: 1/12/2011 Subject: TSB for the KIT # K-FRSPEEDSWT. For the FR17115, FR17220, FR20115 and FR20220 models.
Hospitality & Tourism Management January 2015 Calendar Sunday Monday Tuesday Wednesday Thursday Friday Saturday 1 2 3
 Jan-14 Week 1 Week 2 January 2015 Calendar 1 2 3 New Year's Day - 4 5 6 7 8 9 10 New Intake-L4 (EFTH) Assign-Presentation L4 Assign-Presentation L5 Last Exam Reg- CTH Assign Marking Assign Marking Module-
Honda Financial Statement Changes. January Dear Accounting Customer:
 ADP, Inc. Dealer Services 5607 New King Street Troy, MI 48098 2010 Financial Statement Changes Honda January 2010 Dear Accounting Customer: There have been several changes requested by Honda for the 2010
increase of over four per cent compared to the average of $409,058 reported in January 2010.
 SINGLE FAMILY RESIDENTIAL BREAKDOWN uary 211 26.8 % 1.7 % 7.%.4%.1 % Good Start to 211 TORONTO - February 4, 211 Greater Toronto REALTORS reported 4,337 transactions through the TorontoMLS system in uary
Weak Real to Boost Brazil s Soybean Exports in 2016
 United States Department of Agriculture Foreign Agricultural Service October 2015 Weak Real to Boost Brazil s Soybean Exports in 2016 Brazil s exchange rate is having a significant impact on domestic and
Committee for the Common Organisation of Agricultural Markets. 26 April 2018 POINT 3.1 A. Information on the EU white sugar prices
 Committee for the Common Organisation of Agricultural Markets 26 April 2018 POINT 3.1 A Information on the EU white sugar prices Until January 2018 Regulation 1234/2007, Artide 9 OJ L 299 16,11,2007 р1
Recent Developments in International Seaborne Trade and Maritime Transport
 Recent Developments in International Seaborne Trade and Maritime Transport IFSPA, Hong Kong, 3-5 June 2013 Dr. Vincent F. Valentine Officer-in-Charge, Transport Section Division on Technology and Logistics
ELTS Researchers - Test taker performance 2012
 ELTS Researchers - Test taker performance 2012 Band score information IELTS is assessed on a 9-band scale and reports scores both overall and by individual skill. Overall band scores for Academic and General
September 2016 Water Production & Consumption Data
 September 2016 Water Production & Consumption Data September 2016 monthly water production (288.48 AF) was lowest in at least 17 years. Monthly water production has increased slightly each month since
Growing Soybean Oil Price Raises Oil s Contribution to Total Soybean Value
 United States Department of Agriculture Foreign Agricultural Service Circular Series FOP 10-07 October 2007 Growing Soybean Oil Price Raises Oil s Contribution to Total Soybean Value Relative Share Value:
The Great Transition: Shifting from Fossil Fuels to Solar and Wind Energy Supporting Data - Coal
 The Great Transition: Shifting from Fossil Fuels to Solar and Wind Energy Supporting Data - Coal Proved Coal Reserves, 213 GRAPH: Proved Coal Reserves in Top Countries, 213 Coal Production in Top Ten Countries
Pakistan Oilseed Processors Seize Opportunity to Crush Soybeans
 United States Department of Agriculture Foreign Agricultural Service December 2015 Pakistan Oilseed Processors Seize Opportunity to Crush Soybeans Pakistan, long an importer of soybean meal, is transitioning
Gas Insecurity: A Figment of the Imagination? Peter Davies. Chief Economist, BP EPRG. Cambridge. 19 May, 2006
 Gas Insecurity: A Figment of the Imagination? Peter Davies. Chief Economist, BP EPRG. Cambridge. 19 May, 2006 BP 2006 2 Gas Security What is it? Does the UK have it? What is going to change? What can we
M onthly arket. Jan Table of Contents. Monthly Highlights
 Table of Contents Market Inventory...2 www.gaar.com Monthly Highlights January 2014 had a 12.29% increase in the number of homes sales when compared to same time last year. The average sale price of single-family
Citrus: World Markets and Trade
 United States Department of Agriculture Foreign Agricultural Service y 2018 Citrus: World Markets and Trade Oranges Global orange production for is forecast to tumble 6.0 million metric tons (tons) from
JURISDICTIONS PARTICIPATING IN THE CONVENTION ON MUTUAL ADMINISTRATIVE ASSISTANCE IN TAX MATTERS
 JURISDICTIONS PARTICIPATING IN THE CONVENTION ON MUTUAL ADMINISTRATIVE ASSISTANCE IN TAX MATTERS COUNTRY/JURISDICTION * STATUS 10 NOVEMBER 2017 1. ALBANIA 01-03-2013 (AC) 08-08-2013 01-12-2013 2. ANDORRA