RUTGERS PAVEMENT RESOURCE CENTER RIDE QUALITY TOOLS
|
|
|
- Anne Zoe Perkins
- 5 years ago
- Views:
Transcription
 Rutgers, the State University of New Jersey 100 Brett Road Piscataway, NJ 08854 NJDOT Research Project Manager Sue Gresavage")
1 192-RU8485 RUTGERS PAVEMENT RESOURCE CENTER RIDE QUALITY TOOLS January 2011 Submitted by Ali Maher, Ph.D. Professor and Director Patrick Szary, Ph.D. Associate Director Nicholas Vitillo, Ph.D. Research Associate Thomas Bennert, Senior Research Scientist Nenad Gucunski, Ph.D. Professor Center for Advanced Infrastructure and Transportation (CAIT) Rutgers, the State University of New Jersey 100 Brett Road Piscataway, NJ NJDOT Research Project Manager Sue Gresavage In cooperation with New Jersey Department of Transportation Bureau of Research and U. S. Department of Transportation Federal Highway Administration
2 DISCLAIMER STATEMENT The contents of this report reflect the views of the authors, who are responsible for the facts and the accuracy of the data presented herein. The contents do not necessarily reflect the official views or policies of the New Jersey Department of Transportation or the Federal Highway Administration. This report does not constitute a standard, specification, or regulation. Such document is disseminated under the sponsorship of the Department of Transportation, University Transportation Centers Program, in the interest of information exchange. The U.S. Government assumes no liability for the contents or use thereof.
3 Report No. 192-RU8485 Government Accession No. Recipient s Catalog No. Title and Subtitle Rutgers Pavement Resource Center Ride Quality Tools Report Date January 2011 Performing Organization Code CAIT/Rutgers Author(s) Ali Maher, Patrick J. Szary, Nicholas Vitillo, Thomas Bennert, Nenad Gucunski Performing Organization Report No. 192-RU8485 Performing Organization Name and Address Center for Advanced Infrastructure & Transportation (CAIT) Rutgers, The State University of New Jersey 100 Brett Road Piscataway, NJ Sponsoring Agency Name and Address N.J. Department of Transportation (NJDOT) 1035 Parkway Avenue P.O. Box 600 Trenton, NJ Work Unit No. Contract or Grant No. Type of Report and Period Covered Final Report 01/01/2007 to 12/31/2010 Sponsoring Agency Code Supplementary Notes U.S. Department of Transportation/Research and Innovative Technology Administration (RITA) 1200 New Jersey Avenue, SE, Washington, DC Abstract The Pavement Technology Unit had been inundated with requests from contractors to provide International Roughness Index (IRI) testing during various construction phases. With the release of the NJDOT Ride Quality specification, contractors can receive a financial penalty or bonus depending on the IRI values of the pavement surface after the final surface course has been placed and compacted. However, many of these contractors have been asking for testing of the intermediate layers during construction, in an attempt to validate the smoothness of these layers prior to the placement of the final surface layer. In an effort to support these requests and improve the final pavement smoothness, the Pavement Technology Unit has requested the evaluation and implementation of portable walk-behind pavement surface profile measurement devices that can determine the IRI of intermediate units as requested. After evaluation, the selected portable walk-behind pavement surface profile measurement device were recommended and implemented by the NJDOT Regional offices to provide on-site support to the asphalt industry. The tasks performed include: Evaluation of current walk behind systems Purchase of four walk behind systems based on initial evaluation Training of central pavement and material engineers and region materials engineers on the walk-behind systems (data collection, maintenance, and analysis) Purchase a bare minimum high speed profile that contains texture lasers. o Modify the system to incorporate video, GPS, rut bar measurements and additional flexibility for future additions (tire/pavement noise) o Require shock mounting on racks because boards popping out may want to mount horizontally instead of vertically (more problems occurring on computers on top of racks) o Consolidate the digital cameras control and storage on one computer o Interview Pavement Tech. staff to discuss reoccurring mechanical problems with current technology o Prepare Specification for transport vehicle (e.g., Ford chateau van model). Key Words Pavement Management System, MEPDG, Darwin-ME, Non-Destructive Testing, Training Distribution Statement No Restrictions. Security Classification (of this report) Unclassified Security Classification (of this page) Unclassified No of Pages 87 Price Form DOT F
4 ACKNOWLEDGEMENTS The author(s) wish to thank the New Jersey Department of Transportation (NJDOT) for its support and assistance throughout the entire project.
5 TABLE OF CONTENTS EXECUTIVE SUMMARY... 1 INTRODUCTION... 1 Work Performed... 2 CONCLUSION... 4 APPENDIX A... 5 APPENDIX B... 6 APPENDIX C... 32
6 EXECUTIVE SUMMARY The primary objective of the 2006 RPRC program is to utilize the extensive laboratory and field pavement testing equipment and staff expertise of the Rutgers Pavement Resource Center to assist the NJ Department of Transportation in developing a pavement management strategy that optimizes network condition utilizing available capital resources. The two primary goals of the current program are: 1) retooling of the Pavement Management System and 2) development and implementation of advanced ground penetrating radar system and filling gaps in the database of state highway pavement structures. Ongoing support for implementation of Mechanistic-Empirical Pavement Design is also planned on an as needed basis to support the Department s $290 million fiscal year 2007 and later year s pavement investment. The condition of New Jersey s pavement investment has declined steadily over the past decade as available resources have been committed to other needs. The significant backlog of pavement maintenance has resulted in significant vehicle operating costs to NJ motorists, reportedly twice the national average. A fresh approach to pavement management utilizing the latest technology is needed to help restore New Jersey s highway infrastructure to a state of good repair with limited available resources. The Rutgers Pavement Resource Center is an extension of the NJDOT Pavement Technology Unit and functions as the primary research and technology arm. It is organized to rapidly respond to the Department s need for implementation of advanced pavement evaluation and asset management technologies. The products will include asset management tools, database architecture, material testing and evaluation, validation and implementation of new technologies, methodologies and materials. The program will work closely with DOT staff and its consultants to fulfill its mission. The proposed services to be provided by the joint NJDOT/Rutgers pavement engineering program will include field and laboratory testing and evaluation, development of advanced pavement information systems, and specialized training/educational programs for NJDOT and its consulting pavement engineers. This proposal addresses the evaluation and implementation of new pavement profile tools to enhance the ride quality and safety of the State s road network. INTRODUCTION The Pavement Technology Unit had been inundated with requests from contractors to provide International Roughness Index (IRI) testing during various construction phases. With the release of the NJDOT Ride Quality specification, 1
7 contractors can receive a financial penalty or bonus depending on the IRI values of the pavement surface after the final surface course has been placed and compacted. However, many of these contractors have been asking for testing of the intermediate layers during construction, in an attempt to validate the smoothness of these layers prior to the placement of the final surface layer. In an effort to support these requests and improve the final pavement smoothness, the Pavement Technology Unit has requested the evaluation and implementation of portable walk-behind pavement surface profile measurement devices that can determine the IRI of intermediate units as requested. After evaluation, the selected portable walk-behind pavement surface profile measurement device will be recommended and implemented by the NJDOT Regional offices to provide on-site support to the asphalt industry. The tasks performed include: Evaluation of current walk behind systems Purchase of four walk behind systems based on initial evaluation Training of central pavement and material engineers and region materials engineers on the walk-behind systems (data collection, maintenance, and analysis) Purchase a bare minimum high speed profile that contains texture lasers. Modify the system to incorporate video, GPS, rut bar measurements and additional flexibility for future additions (tire/pavement noise) Require shock mounting on racks because boards popping out may want to mount horizontally instead of vertically (more problems occurring on computers on top of racks) Consolidate the digital cameras control and storage on one computer Interview Pavement Tech. staff to discuss reoccurring mechanical problems with current technology Prepare Specification for transport vehicle (e.g., Ford chateau van model). Work Performed The Rutgers Pavement Resource Program began work on this task in the Summer of The team met several times with the Pavement management, Drainage, and Design group within the New Jersey Department of Transportation to go over the final products and tasks. At this time, an extensive literature search was also performed. Under the tasks, the team agreed to interview and evaluate walk-behind IRI units in preparation for recommendations in the future. (Appendix A) It became evident to the team that they were going to research and evaluate several walk-behind and portable pavement profiler units. They included the ICC SurPRO 200 and SSI Walking Profiler, model CS8800 in addition to the NJDOT s ARRB Walking Profiler. The PRP team would also evaluate the Dynatest Portable Road Surface Profilometer Mark IV, Roadware GRP ARAN Road 2
8 Profiler, and the ARRB Hawkeye 1000 series.(appendix B) After an initial review, the Research Team purchased the ICC SurPRO 2000 Walking Profiler for evaluation on pavement and bridge deck surfaces. The PRP team also worked with other vendors to demonstrate the Dynatest Portable Road Surface Profilometer Mark IV and the Roadware GRP ARAN RoadProfiler prior to purchase. Part of the process was the identification of a consistent test strip in order to validate the results with each piece of machinery. It was important that the pavements selected would be used, safe from traffic, and consistent. The Research Team worked with the New Jersey Department of Transportation to locate, evaluate, and secure a proper test site. Through the literature search and demonstration projects, the Research Team was able to develop a Pavement Profile Certification Procedures Manual for the NJDOT. Their work involved the coordination of a third party reviewer at the Federal Highway Administration and the NJDOT. The final quarter of 2008 was eventful for the Research Team. Using data delivered from the ICC SurPRO 2000 Walking Profiler and from the demonstrations from the Dynatest Mark III and Mark IV profilers, the Research Team began an evaluation of the data. The Research Team drew a comparison between the Roadware and Dynatest profilers and with this information; the Team developed a draft specification for the NJDOT to use for the purchase of a new full size profiler. Throughout much of 2009, the Research Team worked with the NJDOT to finalize the purchase of a reference walking profiler and portable profilers for the implementation of the ride quality specification. They also worked with the FHWA to finalize the Pavement Profile Certification Procedures Manual for use on the actual certification site on the New Jersey Turnpike and the training of operators. (Appendix C) Through the course of data manipulation and experimenting, the Research Team identified an issue with the integration of route, direction, and milepost information into the video images collected by the Dynatest imaging systems. After receiving a draft version of the Dynatest Viewer software (Pilot), the Research Team reviewed the poor image quality and returned the cameras to Dynatest for evaluation and repair. By the end of 2010, the Research Team completed the evaluation of the data collected by the SurPRO of the three regional and Trenton based staffs. The data was evaluated and returned to the NJDOT for its use. 3
9 CONCLUSION The Pavement Resource Program at the Center for Advanced Infrastructure and Transportation at Rutgers University was pleased to participate as an extension and partner with the New Jersey Department of Transportation to perform a variety of tasks put before them.
10 APPENDIX A EVALUATION AND IMPLEMENTATION OF PORTABLE IRI DEVICES FOR NJDOT PMS and Bridge ENGINEERS In the past year, the Pavement Technology Unit has been inundated with requests from contractors to provide International Roughness Index (IRI) testing during various construction phases. With the release of the NJDOT Ride Quality specification, contractors can receive a financial penalty or bonus depending on the IRI values of the pavement surface after the final surface course has been placed and compacted. However, many of these contractors have been asking for testing of the intermediate layers during construction, in an attempt to validate the smoothness of these layers prior to placement of the final surface layer. In an effort to support these request and improve the final pavement smoothness, the Pavement Technology Unit has requested the evaluation and implementation of portable walk-behind pavement surface profile measurement devices that can determine the IRI of intermediate layers as requested. After evaluation, the selected portable walk-behind pavement surface profile measurement device will be recommended and implemented by the NJDOT PMS offices to provide on-site support to the asphalt industry. In addition, portable walk-behind pavement surface profile measurement device can be used as the referee in addressing difference in the contractor payment/bonus for pavement smoothness. In past research studies, the walk behind systems have been used as the gold standard for profiler validation and would be used in NJ to correlate IRI values from various high speed profiler against the IRI measured with the golden profiler. This effort would reduce conflict that can occur between the contractor and the NJDOT due to differences in IRI measurements based on different profiler manufacturers. The portable walk-behind pavement surface profile measurement device will also be evaluated to assess the ride quality of Bridge deck structures. Since the device is pushed by hand, the assessment of bridge deck profile ride quality can be made soon after the bridge deck is constructed when corrective actions can be taken to improve the end results. For more information and pictures visit the ICC SurPRO 2000 website.
11 APPENDIX B Center for Advanced Infrastructure and Transportation -CAIT For: State of New Jersey Department of Transportation Profiler Comparison Prepared by: Nicolas Vitillo, Ph.D. Rutgers University CAIT 100 Brett Rd. Piscataway, NJ Phone: 732/ ext NVitillo@rci.Rutgers.edu
12 The following report provides a summary of the analysis performed on portable and full size pavement profilers. The figures provide a comparison between the portable and full size profiler, and the repeatability of the profilers on 14 test sites covering a range of pavement roughness levels. As can be seen in the graphic figures as well as the statistical analysis, the comparison between the profiles and IRI for the portable and full size profilers is very good. The R 2 correlations (>0.95) indicates a near perfect relationship between the portable and full size profilers. This is not surprising since the components (laser height sensors, accelerometers, distance measurement instruments) in the portable and full size profilers are the same and the analysis software is the same. The differences in the profiler data from this demo can be attributed to wander in the wheelpaths in the repeat runs, and the lack of auto start tape at the beginning of the test sites.
13 IRI Roadware Profilers IRI vs Distance - Left Wheelpath Rroadware Potable-LIRI Full Sie ARAN-LIRI Mileage, Miles
14 IRI left Full size Roadware Full Size vs Portable Profiler y = 1.097x R 2 = IRI left PP
15 IRI IRI Site 1-95M Mileage Site S Mileage
16 IRI IRI Site N Mileage Site E Mileage
17 IRI IRI Site E Distance Site 6-9N Distance
18 IRI IRI Site 7-9N Milage Site 8-9N Mileage
19 IRI IRI Site 9-33W Mileage Site 10-33W Mileage
20 IRI IRI Site S Milage Site S Mileage
21 IRI IRI Site 13-1N Mileage Site 14-1S Mileage
22 IRI, In/Mile Dynatest Profilers IRI vs Distance - Left Wheel Path Mark IV Portable Mark III Full Size Distance, miles
23 IRI, in/mile IRI vs Distance - Right Wheelpath Mark IV Portable Mark III Full Size Distance, miles
24 Mark III Full Size Mark III Full Size Left Wheelpath IRI Comparison - 28 Mile Loop y = 1.012x R 2 = Mark IV Portable Right Wheelpath IRI Comparison - 28 Mile Loop y = x R 2 = Mark IV Portable
25 Full Size IRI Portable vs. Full Size Average IRI y = x R 2 = Portable IRI
26 IRI IRI Site 1 AVG IRI Avg AM IRI 10 Avg MIDDAY IRI Avg PM IRI Mileage Site 2 AVG IRI Avg AM IRI Avg MIDDAY IRI Avg PM IRI Mileage
27 IRI Site 3 AVG IRI Avg AM IRI Avg MIDDAY IRI Avg PM IRI Mileage
28 IRI Site 4 AVG IRI Avg AM IRI 20 Avg MIDDAY IRI Avg PM IRI Mileage
29 IRI IRI Site 5 AVG IRI Avg AM IRI Avg MIDDAY IRI Avg PM IRI Mileage Site 6 AVG IRI Avg AM IRI Avg MIDDAY IRI Avg PM IRI Mileage
30 IRI Site 7 AVG IRI Avg AM IRI Avg MIDDAY IRI Avg PM IRI Mileage
31 IRI Site 8 AVG IRI Avg AM IRI 20 Avg MIDDAY IRI Avg PM IRI Mileage
32 IRI IRI Site 9 AVG IRI Avg AM IRI Avg MIDDAY IRI Avg PM IRI Mileage Site 10 AVG IRI Avg AM IRI Avg MIDDAY IRI Avg PM IRI Mileage
33 IRI Site 11 AVG IRI Avg AM IRI 20 Avg MIDDAY IRI Avg PM IRI Mileage
34 IRI Site 12 AVG IRI Avg AM IRI Avg MIDDAY IRI Avg PM IRI Mileage
35 IRI IRI Site 13 AVG IRI Avg AM IRI Avg MIDDAY IRI Avg PM IRI Mileage Site 14 AVG IRI Avg AM IRI 50 Avg MIDDAY IRI Avg PM IRI Mileage
36 Web Sites Dynatest Portable Profiler Dynatest Full size Profiler Roadware ARAN Full size Profiler Roadware Portable Profiler
37 APPENDIX C
38 Center for Advanced Infrastructure and Transportation NJDOT Pavement Profiler Operation and Certification For: State of New Jersey Department of Transportation Pavement and Drainage Management Systems and Technology Prepared by: Rutgers University CAIT 100 Brett Rd. Piscataway, NJ Phone: 732/ Fax: 732/
39 Table of Contents Topic Page Certification of Inertial Profiling Systems 1 PROFILER EQUIPMENT CALIBRATION VERIFICATION 2 Verification of Height Sensor Accuracy or Calibration 4 Bounce Test 7 Verification of Distance Measuring System 8 OPERATOR QUALIFICATION 10 EQUIPMENT 11 Testing Procedure and Analyses for Reference Profile and High Speed 12 Profilers (HSP) High Speed Profiler PROCEDURE 19 Profiler Operational Procedure 25 REFERENCED DOCUMENTS 29
40 Certification of Inertial Profiling Systems The following outlines the NJDOT Pavement Profiler Certification program. The program outlines the procedures used to verify the calibration of the subsystems on the inertial profiler, certify the profiler operator, set up verification test sites and perform cross correlations of pavement profiles from the reference profiler, lightweight, portable, and high speed profilers. (Comment: the accelerometer and the distance measuring instrument (DMI) in the profiler can be calibrated, but the operator can only perform a verification of the calibration of the height-sensor. Laser sensors are calibrated in the factory and cannot be calibrated by the user. During certification, we will verify these components are working satisfactorily.) This practice describes minimum performance requirements for inertial profilers to be used for quality control/quality assurance (QC/QA) of surface smoothness on NJDOT paving projects where the profile-based smoothness construction specification is applicable. The practice describes a certification procedure for test equipment used to measure a longitudinal surface profile based on an inertial reference system that is mounted on a transport vehicle. The minimum requirements stipulated herein are intended to address the need for accurate and repeatable profile measurements during construction and for Network Level IRI data collection to support the Department s Pavement Management System. 1
41 PROFILER EQUIPMENT CALIBRATION VERIFICATION GENERAL THIS PRACTICE DESCRIBES THE PROCEDURE FOR VERIFYING THE CALIBRATION OF AN INERTIAL PROFILER. THIS PRACTICE IS MEANT TO BE PERFORMED AS A QUALITY ASSURANCE (QA) TEST FOR USE WITH THE APPROPRIATE SMOOTHNESS SPECIFICATION FOR PAVING OPERATIONS. IT IS NOT MEANT TO BE REQUIRED AS A QUALITY CONTROL (QC) PROCEDURE TO MONITOR DAILY PAVING OPERATIONS; HOWEVER, THIS METHOD IS RECOMMENDED WHEN INERTIAL PROFILERS ARE USED FOR QC TESTING AND FOR NETWORK LEVEL DATA COLLECTION. This section refers to calibration or verification procedures for the following profiler subsystems: Height Sensor Accelerometer Distance Measuring Instrument (DMI) 2
42 DMI The block test is used to verify that the height sensor is functioning properly, the bounce test is used to check system stability to ensure that both the accelerometer and height sensor are functioning properly, and the distance test is used to verify that the distance measurement instrument (DMI) is recording distances accurately. (Comment: The block check is used to verify that the height sensor in the profiler is functioning properly. The bounce test is an overall check to see if the accelerometer is canceling out vehicle movement as measured by the height sensor, and this test will detect problems with both the height sensor and the accelerometer. If the system passes the block test and does not pass the bounce test the problem is likely to be in the accelerometer. It should be noted that the block check does not calibrate the height sensor and the bounce test does not calibrate the accelerometer. ) 3
43 It is highly recommended that operators calibrate the accelerometers and the DMI immediately prior to certification. (The operator should perform the block check and bounce test daily prior to data collection. They should calibrate the accelerometers and DMI at intervals recommended by the manufacturer.) The Profiler Certification must be performed annually prior to the paving season and before network level IRI measurement for the PMS. Note: For consistent pavement profile determination, maintain the cold air pressure on the wheels of the housing vehicle according to the manufacturer s specification. The housing vehicle and all system components shall be in good repair and proven to be within the manufacturer s specifications. The operator of the inertial profiler shall have all tools and components necessary to adjust and operate the inertial profiler according to the manufacturer s instructions. 4
44 Verification of Height Sensor Accuracy or Calibration: The Block Test is done to ensure the accuracy of each height sensor. The block test is performed after the profiler is turned on to warm up the equipment per the manufacture s recommendations. This test is performed on each height-sensor in the profiler. This test will be conducted with the inertial profiler on a relatively flat and level area. Its purpose is to check the height measurements (in inches) from the height sensor(s) using blocks of known heights. During the test, do not lean on the profiler or cause it to move in any way. Under windy conditions, it may be necessary to perform this test indoors. 5
45 6
46 The monthly test procedure consists of the following steps: Position a smooth base plate under the height sensor of the profiler and take ten height measurements. Position a 0.25-in. block underneath the height sensor on top of the base plate and take ten height measurements. Carefully remove the 0.25-in. block from the base plate and replace it with a 0.50-in. block. Make another set of ten height measurements. Carefully replace the 0.50-in. block with a 1.00-in. block and take another set of ten height measurements. Finally, carefully replace the 1.00-in. block with a 2.00-in. block and take the last set of ten height measurements. A daily test, used prior to operation, simplifies this procedure by adding and removing the 1.00 inch and 2.00 inch block Note: The thickness of the blocks should be measured to an accuracy of in using a suitable instrument. Measure the thickness of the gauge blocks at three different positions on each side of the block. For each block, an average thickness shall be determined from the measurements made which shall be used in checking the height sensors as described in this test. The average thickness shall be marked on each gauge block. The above procedure for determining the average block thickness must be performed every three months. The difference between each measurement on a gauge block and the average of the ten measurements on the base plate is determined to get the thickness of the gauge block as measured by the height sensor. This calculation is done for all ten measurements on the given gauge block. The absolute values of the differences between the computed thickness and the known average block thickness are then 7
47 determined. To pass the height sensor check test, the average of the absolute differences must be less than or equal to 0.01 inch for each gauge block. The heights will be recorded in a table as follows: 8
48 Format of the Data File for the Height Sensor Check Test Record Base Plate, BP(i) Height inch Block, H(i) Calculated Thickness, CT(i) =ABP-H(i) Abs Diff, Abs(D(i)=CT(i)-MT) 1 BP(1) H(1) CT(1)=ABP-H(1) Abs('D(1)=CT(1)-MT) 2 BP(2) H(2) CT(2)=ABP-H(2) Abs('D(2)=CT(2)-MT) 3 BP(3) H(3) CT(3)=ABP-H(3) Abs('D(3)=CT(3)-MT) 4 BP(4) H(4) CT(4)=ABP-H(4) Abs('D(4)=CT(4)-MT) 5 BP(5) H(5) CT(5)=ABP-H(5) Abs('D(5)=CT(5)-MT) 6 BP(6) H(6) CT(6)=ABP-H(6) Abs('D(6)=CT(6)-MT) 7 BP(7) H(7) CT(7)=ABP-H(7) Abs('D(7)=CT(7)-MT) 8 BP(8) H(8) CT(8)=ABP-H(8) Abs('D(8)=CT(8)-MT) 9 BP(9) H(9) CT(9)=ABP-H(9) Abs('D(9)=CT(9)-MT) 10 BP(10) H(10) CT(10)=ABP- H(10) Abs('D(10)=CT(10)- MT) Height 0.5-inch Block Calculated Thickness, CT(i) =ABP- H(i) Abs Diff, Abs(D(i)=CT(i)- MT) Height 1-inch Block Calculated Thickness, CT(i) =ABP- H(i) Abs Diff, Abs(D(i)=CT(i)- MT) Height 2-inch Block Calculated Thickness, CT(i) =ABP- H(i) Abs Diff, Abs(D(i)=CT(i)- MT) Avg ABP MT AVG Diff MT AVG Diff MT AVG Diff MT AVG Diff 9
49 BP(i) = Base Plate height measurements ABP = Average of Base Plate Heights CT(i) = Calculated Thickness of the gage block CT(i) = Difference between Average Base Plate Height and the individual block heights * MT=Average of the measured thickness of the gauge blocks Abs Diff= Absolute difference between the individual measured thickness and the average measured thickness of the gage block. AVG Diff = Average of Absolute difference Diff * For each block, an average thickness shall be determined from the measurements made which shall be used in checking the height sensors as described in this test. The average thickness shall be marked on each gauge block. To pass the height sensor check test, the average of the absolute differences must be less than or equal to 0.01 inch for each gauge block. 10
50 Bounce Test The bounce test is performed to verify the system stability and checks that both the height sensor and the accelerometer are functioning properly. To perform the bounce test the vehicle is stationary but the electronics are provided an internal signal so that travel at normal data collection speeds is simulated (50 mph). The equipment is placed on level, smooth pavement. Place a clipboard or other nonreflective surface on the pavement under each laser sensor so that the texture of the pavement will not affect the test. The first step is to collect IRI data with the vehicle as motionless as possible. Simulate the IRI data collection for the time it takes to collect data on several 0.1-mile (528 feet) segments. The observed IRI value for a 528 ft long segment should be below 3 in. per mile. Next, the sensor(s) should be moved vertically for a total displacement of approximately 2 in. (a yardstick may be helpful until the operator gets used to the procedure). The typical approach is to push the mounting system (bumper) at the center of the vehicle down an inch or so and let the vehicle suspension rebound to create the total travel of 1 in The operator must be able to observe and maintain a consistent rocking motion exceeding two inches for the time required to simulate 528 ft of travel for a simulated speed of 60 mph. The software shall calculate IRI for 528 ft of simulated travel. The observed IRI values should be below 8 in. per mile for a 0.1-mile segment. The theoretical value for both phases of the bounce test is 0, and newer equipment should provide lower numbers. 11
 Error in the Left Accelerometer or height sensor.")
51 Elevation (mm) CENTER FOR ADVANCED INFRASTRUCTURE Static Test Dynamic Bounce 6 4 LEFT RIGHT Distance (m) Error in the Left Accelerometer or height sensor. Verification of Distance Measuring System: 12
52 This test is used to verify the calibration of the distance measuring instrument system in the profiler by comparing the distance measured by the DMI in the vehicle to that established by a steel surveying tape. Adjust the cold tire pressure to the manufacturer s recommended value. Because tire pressures increase as the air inside them warms up to operating temperature causing the tire diameter to expand, drive around the site for at least 5 miles to warm up the tires prior to collecting data for this test. (Comment: The manufacturers recommended tire pressure will vary with type of vehicle. Hence, it is not appropriate to specify a tire pressure. The best procedure to calibrate the DMI is to first check the cold tire pressure, warm the tire and then calibrate the DMI. This calibration factor will be valid for the hot tire pressure at the time of calibration. Thereafter, when you make measurements, if you check the cold tire pressure and warm the tires the tire pressure should be at the hot tire pressure that correspond to the value when the DMI was calibrated.) Test Section: The DMI verification section shall be a straight and level roadway at least 528 ft in length. Measure the length of the section accurately to within 0.05 percent (3 inch) using a steel survey measurement tape since the distance to be measured is the travel length the wheels encounter. Clearly mark the starting and ending points of the test section with reflective tape or a cone with a reflective tape. Use the profiler s auto-start trigger to activate the start and end of the data collection. Run the profiler at a constant speed that matches the proposed testing speed. Test Procedure: Check the tire air pressure on the wheels of the housing vehicle and maintain according to the manufacturer s recommendations. Allow electronic equipment to warm-up in accordance with the manufacturer s recommendations. Prior to running the test site, warm of the tires by driving for 5 to 10 13
53 miles. Perform three runs over the test section, initiating and terminating data collection at the test section using the auto-trigger. Either a cone with a reflective tape placed on the side of the road or a reflective tape placed on the pavement surface can be used to auto-trigger at the start and the end of the section. At the end of each run, the reading from the profiler s DMI is recorded. After completion of three runs, the absolute difference between the DMI readings and the known distance of the path tested shall be computed for each run. The average of the three absolute differences must be less than or equal to within 0.15 percent of the length of the test section to pass the test. For 528 ft test sections, the average of the three absolute differences must be less than or equal to 9 inches. The DMI may be calibrated at the test section prior to performing the three runs. If the profiler s DMI does not meet this requirement, the operator of the profiler shall calibrate the DMI based on the known distance of the test section. After entering the new calibration factor, the operator shall again make three runs over the delineated path and measure the distance with the profiler s DMI on each run. The average of the absolute differences between the known distance and the DMI readings after calibration shall be computed to check if it is within the specified tolerance of 0.15 percent of the length of the test section or 9 inch for a 528 ft test section. If the profiler s DMI does not meet this requirement, a second calibration shall be made. If after the second calibration the profiler still fails to meet the specified tolerance, no further testing will be conducted and the profiler shall be considered to have failed certification. The DMI shall be calibrated monthly during the construction or Network PMS testing season. 14
54 OPERATOR QUALIFICATION Operators of inertial profilers used for QA testing of pavement ride quality must pass a proficiency test and be certified to operate an inertial profiler. Applicants for certification will be tested on the following: NJDOT ride smoothness specification, Operating inertial profilers, Collection of profile data, and Evaluating quality of data collected and IRI value calculated. Applicants for certification shall undergo both written and practical examinations. They must pass both portions of the test to be certified. Prior to taking the proficiency test, applicants should have completed a profile training course such as NHI Course and must have undergone training on the use of the specific inertial profiler they will be operating in the field. Applicants must know how to calibrate the accelerometers and the distance measuring system, perform a verification of the calibration of the height sensor (block check), perform the bounce test, and collect profile data with the inertial profiler. Upon passing the proficiency test, successful applicants will be given an identification card, which will verify that they are certified to operate the inertial profiler for QA testing on paving projects. The card shall identify the specific type or brand of inertial profiler that the operator is certified to operate. This card will be valid for a period of 12 months from the date of issue unless revoked because of misuse. The agency will maintain records of operator and profiler certification 15
55 EQUIPMENT DYNAMIC TESTING TESTS SHALL BE CONDUCTED AT A SITE APPROVED BY THE NJDOT, WHICH INVOLVE TEST SECTIONS, REFERENCE PROFILES, AND DEVICES USED TO ESTABLISH REFERENCE PROFILES AS DESCRIBED IN THE FOLLOWING: The certification of the profilers is conducted in two steps. The first step is to assess the repeatability of the High Speed Profilers, and the second step is to assess the accuracy of High Speed Profilers Repeatability refers to the assessment of a single profiler s ability to repeatedly measure the overall roughness as well as the spatial distribution of roughness along a single profile trace. Accuracy refers to the assessment of the Portable or High Speed Profiler s ability to reproduce the profile trace measured by the Reference profiler which is deemed to be correct. Minimum Requirements: The profiler must have passed the block test, bounce test, and DMI verification test. The inertial profiling system must meet all requirements and specification found in AASHTO MP 11-07, Standard Equipment Specification for Inertial Profiler. Operating Parameters - The inertial profiler must be capable of providing relative elevation measurements that meet the following requirements: Reporting Interval - the interval at which relative profile elevations are reported must be less than or equal to two inches. 16
56 Cutoff Wavelength - the algorithm for filtering the profile data should use a cutoff wavelength of 300 feet. Certification Test Sections Selection Perform dynamic certification testing on a smooth and medium-smooth section. As determined from a reference profiler, the smooth section shall have a mean IRI within the range of 30 to 75 in. per mile while the medium-smooth section shall have a mean IRI within the range of 95 to 135 in. per mile. For Network level PMS testing a third site with a mean IRI between 150 and 250 in. per mile shall be used. Test surface macro texture should reflect common NJDOT new pavement surfaces. Additional sites may be established for coarse textured mixtures as needed. Each test section will be at least 528 ft in length with a lead-in distance of at least 300 ft and a safe stopping distance. Test sections should be tangent sections with no significant grade (>3%) or grade change, and shall be free of cracks in the traveled wheel paths. The reference site will be painted with a dot every 10 feet or a continuous stripe in the wheel paths and the beginning and end of the test section will be marked with reflective tape to prompt the auto start trigger of the high speed profile data collection. The distance between the wheel paths should be 67 inches between (65 and 70) inches. Testing Procedure and Analyses for Reference Profile, Portable, and High Speed Profilers (HSP) Reference Profiles 17
57 The reference profile for each test section shall be measured using the ICC SurPRO 2000 in accordance with ASTM E 2133 Standard Test Method for Using a Rolling Inclinometer to Measure Longitudinal and Transverse Profiles of a Traveled Surface (Comment: The (1) the average IRI of the multiple runs will be used if IRI of the reference profiler is being compared with the HSP profiler IRI, (2) a representative reference profile (for each wheel path) will be selected to perform cross correlation with the profiles from the portable or high speed profiler if the cross correlation method is being used.) Eleven runs of the ICC SurPRO 2000 reference profile (for each wheel path) will be used to perform cross correlation of the reference profiler and representative profiles of the reference profile (for each wheel path) will be used to perform cross correlation with the portable and high speed profiler, if the cross correlation method is being used. This representative profiles will be based on the reference profile that represents the best cross correlation rating. (Comment: The repeatability of the cross correlation for the reference profiles must be higher than 0.95). 18
58 The eleven repeat runs will be viewed for repeatability. The ProVAL Profiler Certification Analysis screen will be setup to analyze the reference profiler data. The minimum repeatability will be set to 95% and the minimum accuracy will be set to 90%. Each of the eleven profiles will be evaluated as the base profile compared to the other 10 runs. * The Sample interval of the reference profiler must be less than 2.75 inch. 19

59 The analysis report will summarize the repeatability and accuracy results as shown below. 20
60 21


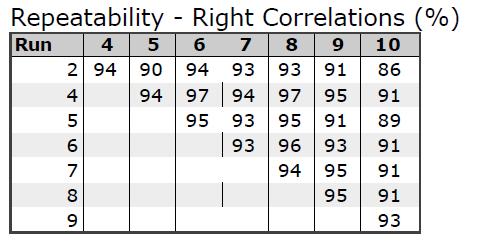
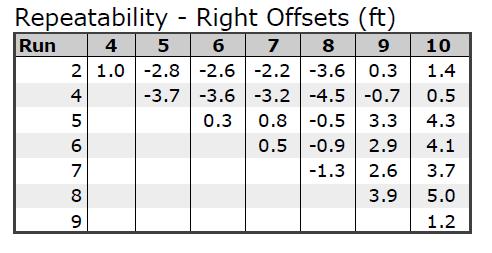
61 Left File Profile IRI (in/mi) Mean Rep Right File Profile IRI (in/mi) Mean Rep MRI 1 20MY0844 Left MY1108 Right MY0858 Left MY1119 Right MY0910 Left MY1130 Right MY0921 Left MY1140 Right
62 5 20MY0938 Left MY1151 Right MY0949 Left MY1201 Right MY1001 Left MY1212 Right MY1014 Left MY1222 Right MY1025 Left MY1233 Right MY1035 Left MY1243 Right MY1058 Left MY1254 Right average STDEV The highlighted profiles will be used in the cross correlation with the portable and high speed profilers. The Mean repeatability scores represent the score when that profile was used as the basis for comparison. Portable and High Speed Profiler (HSP) The distance between the wheel paths should be located at 67 inches depending on the profiler (Comment: The laser should be between (65 and 70) inches.) The portable and high speed profilers will perform ten data collection runs in the direction of travel. The profiler shall start and terminate data collection using the auto-trigger 23
63 Test Data Analyses After loading the profile traces (ERD files) from the portable and the High Speed Profilers into ProVAL, visually inspect the profile traces in each wheel path to ensure that no visible profile anomalies exist in the data. If visual anomalies are present, additional runs shall be performed to replace the runs with anomalies or 10 additional runs of the portable or high speed profilers will be performed. 24

64 Test data will be analyzed in accordance with the Profile Certification Analysis option in the ProVAL program which performs Cross Correlation Analysis Method A as described in the following to establish the repeatability and accuracy of the test equipment: 25

65 Cross Correlation: Cross correlation is superior to direct comparison of IRI index values because it compares the overall roughness and its spatial distribution. The method yields ratings of agreement under a given set of test conditions that do not reward compensating error. (Karamihas, 2002) Equipment Repeatability Evaluate repeatability using cross correlation of IRI filtered output. On each wheel path, cross correlate each of the ten profiles to each of the remaining nine. A total of 45 comparisons will be made. The repeatability Grade for each wheel path is the average of all 45 values. A score of 0.92 or greater is required on all wheel paths. For PMS Network site, an additional two values will be determined for the rough section with a score of Checking the ten runs for the portable and high speed profilers in the Comparison column and pressing the analysis button will check the profilers ability to repeatedly measure the profile trace in each wheel path. RESULTS The results provide summary of the input targets and analyses. 26
66 27
67 28

68 Equipment Accuracy 29
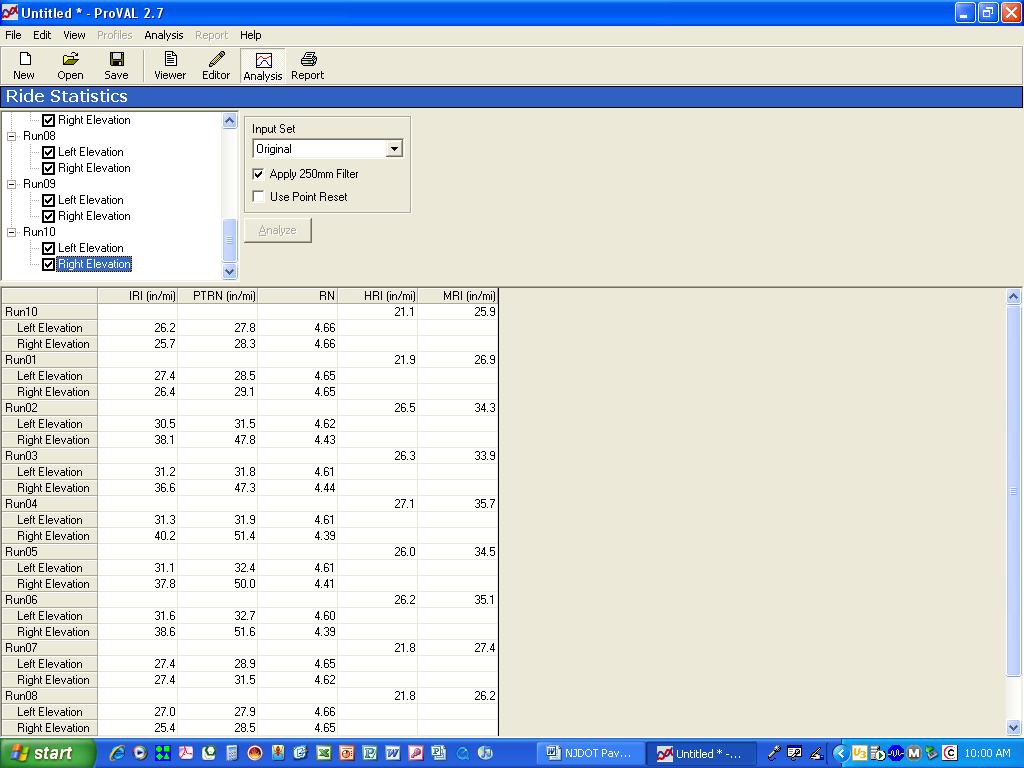
69 Choose a representative profile (represents the best cross correlation rating) from the ten runs of the reference profile to act as the reference or base profile. This profile will act as the true profile to assess the accuracy of the portable and high speed profiles. Evaluate accuracy using cross correlation of IRI filtered output. On each wheel paths, cross correlate each of the ten profiles to the reference profile. The accuracy Grade for each wheel paths is the average of the ten individual cross correlation values. A score of 0.90 or greater is required on all traces. Calculate the accuracy score of each profile trace. For dual-path profilers, four scores will be determined, two for each test section. For PMS Network site, an additional two will be determined for the rough section. Ride Statistic Verification After the portable or high speed profilers have passed the repeatability and accuracy test, the next step is to verify the IRI values. The IRI will be determined for each profile run for each 528 ft section in each wheel path using the latest version of ProVAL Ride Statistics. The IRI data can be exported to Excel by copying the results table to the clipboard. The average, standard deviation and Coefficient of Variation (COV) of the ten runs can be determined in Excel. 30

70 LIRI (in/mi) RIRI (in/mi) MRI (in/mi) Run Run Run Run Run Run Run Run Run Run Avg Std Dev COV Coefficient of Variation = STDEV/Mean*100 Acceptable COV < 3% A standard deviation of the ten runs will be determined for each 528 ft section for each wheel path. The standard deviations for each 528 ft section for each wheel path shall not exceed 5% of the average IRI value based on the reference profile. If the standard deviation exceed 3.0 in/mile, the ten runs shall be repeated. 31
71 32
72 High Speed Profiler PROCEDURE Colorado Certification Acceptance The high speed profiler operator shall perform ten runs in the intended direction of travel. The high speed profile operator shall generate digital reports for each run indicating the left & right wheel path profile trace for each 528 ft section in an ERD file format for use in ProVAL. ACCEPTANCE DETERMINATION An average and standard deviation of the MRI (Average of the wheel path IRIs) of the ten runs will be determined for each 528 ft section for each wheel path. The high speed profile will be considered acceptable when the standard deviation for each 528 ft section does not exceed 3.0 in/mile and the average MRI does not vary from the MRI of the reference profiler values by more than 6.0 in/mile. After a high speed profile is determined to be acceptable, a Certificate will be issued listing: high speed profile serial number high speed profile VIN number high speed profile Make & Model Height sensor serial numbers Accelerometer serial numbers Certification Date Expiration Date The certification will expire after one year 33
73 VERIFYING CALIBRATION THE FOLLOWING VERIFICATION PROCEDURE IS REQUIRED FOR QA TESTING AND IS RECOMMENDED WHEN AN INERTIAL PROFILER IS TO BE USED AS A QC INSTRUMENT ON A DAILY BASIS. Verification of Computed Ride Statistics (IRI) The test equipment software must be capable of computing and reporting the IRI of each profile trace tested. The repeatability of these ride statistics shall be determined in the following manner: 1. Ten IRI values are computed using the profiles from the ten repeat runs made on a given profile trace. 2. For each test profile trace, the coefficients of variation of the IRIs is computed. For dual-sensor profilers, four coefficients of variation are computed one per trace per test section. Coefficient of Variation This is the ratio of the standard deviation to the mean: coefficien t of var iation s tan dard deviation mean x To pass the repeatability test based on the computed ride statistics, each coefficient of variation of the IRIs determined in step 2 must not exceed 3 percent. Note The value of 3 percent for coefficient of variation is based on a 528-ft test section length. 34
74 The accuracy of the IRI statistic shall be determined in the following manner: Determine the IRI values for each of the ten repeat runs made on a given profile trace. There will be a total of 20 values for dual-sensor profiles. Determine the absolute difference between the profiler IRI 20 values and the corresponding reference IRI value(s). 4. Determine the average of the absolute differences determined in step 2. Two values will result for a dual-sensor profiler. 5. Determine the percentage difference between the average of the absolute differences and the corresponding reference IRI by dividing the average absolute difference(s) determined in step 3 by the reference IRI and multiplying by The percentage difference determined in step 5 must not exceed 5 percent for any profile trace. IRI COMPARISONS For comparison purposes, the IRI from the high speed profile can be correlated to the IRI of the Reference profiler using the following procedure. Calculate the average of the MRI (average of the LIRI and RIRI) from the ten runs for the Reference and high speed profile for each test site. 35
75 36
Profiler Certification Process at the Virginia Smart Road
 Pavement Surface Properties Consortium Profiler Certification Process at the Virginia Smart Road Center for Sustainable Transportation Infrastructure Outline Introduction Objectives Profiler Certification
Ride Smoothness Measurement and Specification Issues. Nicholas Vitillo, Ph. D. Manager, Bureau of Research New Jersey Department of Transportation
 Ride Smoothness Measurement and Specification Issues Nicholas Vitillo, Ph. D. Manager, Bureau of Research New Jersey Department of Transportation Components of Pavement Smoothness Surface Tolerance deviations
MICHIGAN DEPARTMENT OF TRANSPORTATION SPECIAL PROVISION FOR PAVEMENT RIDE QUALITY (MEAN ROUGHNESS INDEX ACCEPTANCE CRITERIA)
") MICHIGAN DEPARTMENT OF TRANSPORTATION SPECIAL PROVISION FOR PAVEMENT RIDE QUALITY (MEAN ROUGHNESS INDEX ACCEPTANCE CRITERIA) CFS:TEH 1 of 10 APPR:KPK:JFS:07-07-16 FHWA:APPR:07-15-16 a. Description. This
MICHIGAN DEPARTMENT OF TRANSPORTATION SPECIAL PROVISION FOR PAVEMENT RIDE QUALITY (MEAN ROUGHNESS INDEX ACCEPTANCE CRITERIA) CFS:TEH 1 of 10 APPR:KPK:JFS:07-07-16 FHWA:APPR:07-15-16 a. Description. This
MICHIGAN DEPARTMENT OF TRANSPORTATION SPECIAL PROVISION FOR PAVEMENT RIDE QUALITY (IRI ACCEPTANCE CRITERIA)
") MICHIGAN DEPARTMENT OF TRANSPORTATION 03SP502(P) SPECIAL PROVISION FOR PAVEMENT RIDE QUALITY (IRI ACCEPTANCE CRITERIA) C&T:TEH 1 of 8 C&T:APPR:JFS:MJE:01-28-08 FHWA:APPR:02-01-08 a. Description. Provide
MICHIGAN DEPARTMENT OF TRANSPORTATION 03SP502(P) SPECIAL PROVISION FOR PAVEMENT RIDE QUALITY (IRI ACCEPTANCE CRITERIA) C&T:TEH 1 of 8 C&T:APPR:JFS:MJE:01-28-08 FHWA:APPR:02-01-08 a. Description. Provide
Table Standardized Naming Convention for ERD Files
 S-1 (2399) PAVEMENT SURFACE SMOOTHNESS (2013 version) DO NOT REMOVE THIS. IT NEEDS TO STAY IN FOR THE CONTRACTORS. Always use with SP2005-111 (CONCRETE PAVING MIX SPECIFICATIONS PAVEMENT) and SP2005-140
DESCRIPTION This work consists of measuring the smoothness of the final concrete or bituminous surface.
 2399 PAVEMENT SURFACE SMOOTHNESS 2399.1 DESCRIPTION This work consists of measuring the smoothness of the final concrete or bituminous surface. A Definitions The Department defines Smoothness as the Mean
ITEM 585 RIDE QUALITY FOR PAVEMENT SURFACES Description. Measure and evaluate the ride quality of pavement surfaces.
 ITEM 585 RIDE QUALITY FOR PAVEMENT SURFACES 585.1. Description. Measure and evaluate the ride quality of pavement surfaces. 585.2. Equipment. A. Surface Test Type A. Provide a 10-ft. straightedge. B. Surface
THE USE OF PERFORMANCE METRICS ON THE PENNSYLVANIA TURNPIKE
 Wilke, P.W.; Hatalowich, P.A. 1 THE USE OF PERFORMANCE METRICS ON THE PENNSYLVANIA TURNPIKE Paul Wilke, P.E. Principal Engineer Corresponding Author Applied Research Associates Inc. 3605 Hartzdale Drive
SECTIO N 610 PAVEMENT SMO O THNESS
 SECTIO N 610 PAVEMENT SMO O THNESS 610.1 Description. This work shall consist of measuring the smoothness of the final pavement surface. Smoothness shall be measured using the International Roughness Index
Profiler Certification Program at the NCAT Pavement Test Track. R. Buzz Powell Jason Nelson
 Profiler Certification Program at the NCAT Pavement Test Track R. Buzz Powell Jason Nelson Background Certification startup costs via ALDOT project Satisfy requirements for Quality Assurance Leverage cooperative
CATEGORY 500 PAVING SECTION 535 PAVEMENT SURFACE PROFILE
 CATEGORY 500 PAVING 1 of 9 SECTION 535.01 DESCRIPTION. This work shall consist of measuring the roughness of the final surface of hot mix asphalt (HMA) or portland cement concrete (PCC) pavements. The
Section 6. Ride Specification Special Provisions Step-by-Step Ride Guide for Inspectors and Project Engineers
 Section 6 Ride Specification 2399 Special Provisions Step-by-Step Ride Guide for Inspectors and Project Engineers 2 2399 PAVEMENT SURFACE SMOOTHNESS 2399.1 DESCRIPTION This work consists of measuring the
REPORT NUMBER: 111SB-MGA SAFETY COMPLIANCE TESTING FOR FMVSS NO. 111SB SCHOOL BUS REARVIEW MIRRORS
 REPORT NUMBER: 111SB-MGA-2009-001 SAFETY COMPLIANCE TESTING FOR FMVSS NO. 111SB SCHOOL BUS REARVIEW MIRRORS THOMAS BUILT BUSES 2009 THOMAS MINOTOUR SCHOOL BUS NHTSA NO.: C90901 PREPARED BY: MGA RESEARCH
EFFECT OF PAVEMENT CONDITIONS ON FUEL CONSUMPTION, TIRE WEAR AND REPAIR AND MAINTENANCE COSTS
 EFFECT OF PAVEMENT CONDITIONS ON FUEL CONSUMPTION, TIRE WEAR AND REPAIR AND MAINTENANCE COSTS Graduate of Polytechnic School of Tunisia, 200. Completed a master degree in 200 in applied math to computer
DIVISION V SURFACINGS AND PAVEMENTS
 36-3.01 GENERAL DIVISION V SURFACINGS AND PAVEMENTS 36 GENERAL 04-20-18 Replace section 36-3 with: 36-3 PAVEMENT SMOOTHNESS 36-3.01A Summary Section 36-3 includes specifications for measuring the smoothness
MnDOT s Experience with IRI Specifications
 MnDOT s Experience with IRI Specifications Spring 2013 NCC Meeting April 4, 2013 Philadelphia, PA Maria Masten, P.E. MnDOT Concrete Engineer Evolution of Smoothness No Equipment Certification 2002 Profiler
NCDOT Rideability and IRI Special Provision. Nilesh Neel Surti, PE North Carolina DOT State Pavement Construction Engineer
 NCDOT Rideability and IRI Special Provision Nilesh Neel Surti, PE North Carolina DOT State Pavement Construction Engineer RPUG 2011 NCDOT - Ride Quality Background Fall 1995 Rideability addressed in Asphalt
REPORT NUMBER: 111-MGA SAFETY COMPLIANCE TESTING FOR FMVSS NO. 111 SCHOOL BUS REARVIEW MIRRORS
 REPORT NUMBER: 111-MGA-05-002 SAFETY COMPLIANCE TESTING FOR FMVSS NO. 111 SCHOOL BUS REARVIEW MIRRORS Girardin Minibus Inc. 2005 Minibus NHTSA No. C50902 PREPARED BY: MGA RESEARCH CORPORATION 5000 WARREN
PN 420-7/18/ SURFACE SMOOTHNESS REQUIREMENTS FOR PAVEMENTS
 PN 420-7/18/2014 - SURFACE SMOOTHNESS REQUIREMENTS FOR PAVEMENTS DESCRIPTION: The surface tolerance specification requirements are modified as follows for all mainline lanes and collector-distributor road
SAFETY COMPLIANCE TESTING FOR FMVSS NO. 104 WINDSHIELD WIPING AND WASHING SYSTEMS
 REPORT NUMBER 104-GTL-07-003 SAFETY COMPLIANCE TESTING FOR FMVSS NO. 104 WINDSHIELD WIPING AND WASHING SYSTEMS HONDA MOTOR CO. 2007 HONDA FIT, PASSENGER CAR NHTSA NO. C75300 GENERAL TESTING LABORATORIES,
a road is neither cheap nor fast.
 TECHNOLOGY Speaker phone By David Grimmer Contributing Author New app tells you degree of road roughness Getting roughness information for a road is neither cheap nor fast. Many cities and counties don
SAFETY COMPLIANCE TESTING FOR FMVSS NO. 104 WINDSHIELD WIPING AND WASHING SYSTEMS
 REPORT NUMBER 104-GTL-07-002 SAFETY COMPLIANCE TESTING FOR FMVSS NO. 104 WINDSHIELD WIPING AND WASHING SYSTEMS NISSAN MOTOR CO., LTD. 2007 NISSAN VERSA, PASSENGER CAR NHTSA NO. C75201 GENERAL TESTING LABORATORIES,
Control of Pavement Smoothness in Kansas
 Report No. FHWA-KS-8-5 Final REPORT Control of Pavement Smoothness in Kansas William H. Parcells, Jr., P.E. Kansas Department of Transportation Topeka, Kansas May 29 KANSAS DEPARTMENT OF TRANSPORTATION
The INDOT Friction Testing Program: Calibration, Testing, Data Management, and Application
 The INDOT Friction Testing Program: Calibration, Testing, Data Management, and Application Shuo Li, Ph.D., P.E. Transportation Research Engineer Phone: 765.463.1521 Email: sli@indot.in.gov Office of Research
REPORT NUMBER: 111-MGA SAFETY COMPLIANCE TESTING FOR FMVSS NO. 111 SCHOOL BUS REARVIEW MIRRORS
 REPORT NUMBER: 111-MGA-05-003 SAFETY COMPLIANCE TESTING FOR FMVSS NO. 111 SCHOOL BUS REARVIEW MIRRORS Les Entreprises Michel Corbeil Inc. 2004 Corbeil 30 Passenger School Bus NHTSA No. C40902 PREPARED
REPORT NUMBER: 120-MGA
 REPORT NUMBER: 120-MGA-2011-001 SAFETY COMPLIANCE TESTING FOR FMVSS NO. 120 TIRE SELECTION AND RIMS FOR MOTOR VEHICLES WITH A GVWR OF MORE THAN 4,536 kg FOREST RIVER, INC. / STARCRAFT DIVISION 2011 STARCRAFT
Heating Comparison of Radial and Bias-Ply Tires on a B-727 Aircraft
 'S Heating Comparison of Radial and Bias-Ply Tires on a B-727 Aircraft November 1997 DOT/FAA/AR-TN97/50 This document is available to the U.S. public through the National Technical Information Service
FHWA/IN/JTRP-2000/23. Final Report. Sedat Gulen John Nagle John Weaver Victor Gallivan
 FHWA/IN/JTRP-2000/23 Final Report DETERMINATION OF PRACTICAL ESALS PER TRUCK VALUES ON INDIANA ROADS Sedat Gulen John Nagle John Weaver Victor Gallivan December 2000 Final Report FHWA/IN/JTRP-2000/23 DETERMINATION
REPORT NUMBER: 120-MGA
 REPORT NUMBER: 120-MGA-2011-004 SAFETY COMPLIANCE TESTING FOR FMVSS NO. 120 TIRE SELECTION AND RIMS FOR MOTOR VEHICLES WITH A GVWR OF MORE THAN 4,536 kg STARTRANS 2010 MFSAB NHTSA NO.: CA0900 PREPARED
KENTUCKY TRANSPORTATION CENTER
 Research Report KTC-08-10/UI56-07-1F KENTUCKY TRANSPORTATION CENTER EVALUATION OF 70 MPH SPEED LIMIT IN KENTUCKY OUR MISSION We provide services to the transportation community through research, technology
REPORT NUMBER: 111SB-MGA SAFETY COMPLIANCE TESTING FOR FMVSS NO. 111SB SCHOOL BUS REARVIEW MIRRORS
 REPORT NUMBER: 111SB-MGA-2011-005 SAFETY COMPLIANCE TESTING FOR FMVSS NO. 111SB SCHOOL BUS REARVIEW MIRRORS 2012 IC CORP. CE SCHOOL BUS NHTSA NO.: CC0900 PREPARED BY: MGA RESEARCH CORPORATION 5000 WARREN
Field Verification of Smoothness Requirements for Weigh-In-Motion Approaches
 Field Verification of Smoothness Requirements for Weigh-In-Motion Approaches by Dar-Hao Chen, Ph.D., P.E. and Feng Hong, Ph.D. Report DHT-48 Construction Division Texas Department of Transportation May
PN /21/ SURFACE SMOOTHNESS REQUIREMENTS FOR PAVEMENTS
 PN 420-10/21/2016 - SURFACE SMOOTHNESS REQUIREMENTS FOR PAVEMENTS DESCRIPTION: The surface tolerance specification requirements are modified as follows for all pavements of constant width with at least
RUNWAY ROUGHNESS CONSIDERATIONS. SWIFT 2013 Chris Olidis, P.Eng.
 RUNWAY ROUGHNESS CONSIDERATIONS SWIFT 2013 Chris Olidis, P.Eng. PRESENTATION OUTLINE A general overview of runway roughness Assessing roughness for new construction Assessing roughness of in service runways
REPORT NUMBER: 111SB-MGA SAFETY COMPLIANCE TESTING FOR FMVSS NO. 111SB SCHOOL BUS REARVIEW MIRRORS
 REPORT NUMBER: 111SB-MGA-2011-001 SAFETY COMPLIANCE TESTING FOR FMVSS NO. 111SB SCHOOL BUS REARVIEW MIRRORS 2011 STARCRAFT QUEST SCHOOL BUS NHTSA NO.: CB0902 PREPARED BY: MGA RESEARCH CORPORATION 5000
Development of Turning Templates for Various Design Vehicles
 Transportation Kentucky Transportation Center Research Report University of Kentucky Year 1991 Development of Turning Templates for Various Design Vehicles Kenneth R. Agent Jerry G. Pigman University of
SAFETY COMPLIANCE TESTING FOR FMVSS NO. 103 WINDSHIELD DEFROSTING AND DEFOGGING SYSTEMS
 REPORT NUMBER 103-GTL-07-001 SAFETY COMPLIANCE TESTING FOR FMVSS NO. 103 WINDSHIELD DEFROSTING AND DEFOGGING SYSTEMS HYUNDAI MOTOR COMPANY 2007 HYUNDAI ELANTRA, PASSENGER CAR NHTSA NO. C70502 GENERAL TESTING
An Update on Smoothness Specifications at ODOT
 An Update on Smoothness Specifications at ODOT Brian L. Schleppi ODOT Pavement Engineering Ohio Asphalt Paving Conference Tuesday February 7, 2004 Overview Review Major Points from 2 yrs ago Smoothness
CHARACTERIZATION AND DEVELOPMENT OF TRUCK LOAD SPECTRA FOR CURRENT AND FUTURE PAVEMENT DESIGN PRACTICES IN LOUISIANA
 CHARACTERIZATION AND DEVELOPMENT OF TRUCK LOAD SPECTRA FOR CURRENT AND FUTURE PAVEMENT DESIGN PRACTICES IN LOUISIANA LSU Research Team Sherif Ishak Hak-Chul Shin Bharath K Sridhar OUTLINE BACKGROUND AND
SECTION 602 PORTLAND CEMENT CONCRETE PAVEMENT SMOOTHNESS
 SECTION 602 PORTLAND CEMENT CONCRETE PAVEMENT SMOOTHNESS 602.01 General 1. This specification establishes a standard for Portland cement concrete pavement smoothness, and defines defective pavement smoothness.
SAFETY COMPLIANCE TESTING FOR FMVSS 202a Head Restraints
 FINAL REPORT NUMBER 202a-MGA-10-003 SAFETY COMPLIANCE TESTING FOR FMVSS 202a FORD MOTOR COMPANY 2010 Lincoln MKT MPV NHTSA No. CA0213 MGA RESEARCH CORPORATION 446 Executive Drive Troy, Michigan 48083 Test
Impact of Overweight Traffic on Pavement Life Using WIM Data and Mechanistic- Empirical Pavement Analysis
 Impact of Overweight Traffic on Pavement Life Using WIM Data and Mechanistic- Empirical Pavement Analysis HAO WANG, PhD, Assistant Professor JINGNAN ZHAO and ZILONG WANG, Graduate Research Assistant RUTGERS,
SAFETY COMPLIANCE TESTING FOR FMVSS NO. 401 INTERIOR TRUNK RELEASE
 REPORT NUMBER 401-STF-09-002 SAFETY COMPLIANCE TESTING FOR FMVSS NO. 401 INTERIOR TRUNK RELEASE HYUNDAI MOTOR COMPANY 2009 HYUNDAI GENESIS FOUR-DOOR PASSENGER CAR NHTSA NO. C90501 U.S. DOT SAN ANGELO TEST
SAFETY COMPLIANCE TESTING FOR FMVSS NO. 103 WINDSHIELD DEFROSTING AND DEFOGGING SYSTEMS
 REPORT NUMBER 103-GTL-09-005 SAFETY COMPLIANCE TESTING FOR FMVSS NO. 103 WINDSHIELD DEFROSTING AND DEFOGGING SYSTEMS TOYOTA MOTOR CORPORATION 2009 LEXUS ES 350, PASSENGER CAR NHTSA NO. C95104 GENERAL TESTING
SAFETY COMPLIANCE TESTING FOR FMVSS NO. 103 WINDSHIELD DEFROSTING AND DEFOGGING SYSTEMS
 REPORT NUMBER 103-GTL-11-002 SAFETY COMPLIANCE TESTING FOR WINDSHIELD DEFROSTING AND DEFOGGING SYSTEMS NISSAN MOTOR CO., LTD. 2011 NISSAN LEAF, PASSENGER CAR NHTSA NO. CB5200 GENERAL TESTING LABORATORIES,
SAFETY COMPLIANCE TESTING FOR FMVSS NO. 401 INTERIOR TRUNK RELEASE
 REPORT NUMBER 401-STF-09-001 SAFETY COMPLIANCE TESTING FOR FMVSS NO. 401 INTERIOR TRUNK RELEASE GENERAL MOTORS CORPORATION 2009 CHEVROLET IMPALA FOUR-DOOR PASSENGER CAR NHTSA NO. C90100 U.S. DOT SAN ANGELO
SAFETY COMPLIANCE TESTING FOR FMVSS NO. 214S SIDE IMPACT PROTECTION (STATIC)
") REPORT NUMBER 214-GTL-09-002 SAFETY COMPLIANCE TESTING FOR S SIDE IMPACT PROTECTION (STATIC) MAZDA MOTOR CORPORATION 2009 MAZDA 3, PASSENGER CAR NHTSA NO. C95400 GENERAL TESTING LABORATORIES, INC. 1623
REPORT NUMBER 214-GTL-09-002 SAFETY COMPLIANCE TESTING FOR S SIDE IMPACT PROTECTION (STATIC) MAZDA MOTOR CORPORATION 2009 MAZDA 3, PASSENGER CAR NHTSA NO. C95400 GENERAL TESTING LABORATORIES, INC. 1623
This is a new permit condition titled, "2D.1111 Subpart ZZZZ, Part 63 (Existing Non-Emergency nonblack start CI > 500 brake HP)"
") This is a new permit condition titled, "2D.1111 Subpart ZZZZ, Part 63 (Existing Non-Emergency nonblack start CI > 500 brake HP)" Note to Permit Writer: This condition is for existing engines (commenced
This is a new permit condition titled, "2D.1111 Subpart ZZZZ, Part 63 (Existing Non-Emergency nonblack start CI > 500 brake HP)" Note to Permit Writer: This condition is for existing engines (commenced
Additional Transit Bus Life Cycle Cost Scenarios Based on Current and Future Fuel Prices
 U.S. Department Of Transportation Federal Transit Administration FTA-WV-26-7006.2008.1 Additional Transit Bus Life Cycle Cost Scenarios Based on Current and Future Fuel Prices Final Report Sep 2, 2008
Research Update Construction Conference Charles Holzschuher, P.E. February 3, Florida Department of Transportation
 Research Update 2017 Construction Conference Charles Holzschuher, P.E. February 3, 2017 Laser Based Sensor Evaluation Goals: Evaluate Laser Based Sensors for Profilers Support RN and IRI Smoothness Specifications
REPORT NUMBER: 114-CAL SAFETY COMPLIANCE TESTING FOR FMVSS No. 114 THEFT PROTECTION AND ROLLOWAY PREVENTION
 REPORT NUMBER: 114-CAL-08-06 SAFETY COMPLIANCE TESTING FOR FMVSS No. 114 THEFT PROTECTION AND ROLLOWAY PREVENTION FORD MOTOR COMPANY 2008 FORD RANGER REGULAR CAB PICKUP NHTSA NUMBER: C80205 CALSPAN TEST
SAFETY COMPLIANCE TESTING FOR FMVSS NO. 103 WINDSHIELD DEFROSTING AND DEFOGGING SYSTEMS
 REPORT NUMBER 103-GTL-06-002 SAFETY COMPLIANCE TESTING FOR FMVSS NO. 103 WINDSHIELD DEFROSTING AND DEFOGGING SYSTEMS FORD MOTOR CO. 2006 FORD MUSTANG, PASSENGER CAR NHTSA NO. C60203 GENERAL TESTING LABORATORIES,
Vehicle Systems Engineering and Integration Activities - Phase 4
 Vehicle Systems Engineering and Integration Activities - Phase 4 Interim Technical Report SERC-2012-TR-015-4 March 31, 2012 Principal Investigator: Dr. Walter Bryzik, DeVlieg Chairman and Professor Mechanical
REPORT NUMBER: 114-CAL SAFETY COMPLIANCE TESTING FOR FMVSS No. 114 THEFT PROTECTION AND ROLLOWAY PREVENTION
 REPORT NUMBER: 114-CAL-08-08 SAFETY COMPLIANCE TESTING FOR FMVSS No. 114 THEFT PROTECTION AND ROLLOWAY PREVENTION SUZUKI MOTOR CORPORATION 2008 SUZUKI SX4 4-DOOR SEDAN NHTSA NUMBER: C80512 CALSPAN TEST
Vehicle Systems Engineering and Integration Activities - Phase 3
 Vehicle Systems Engineering and Integration Activities - Phase 3 Interim Technical Report SERC-2011-TR-015-3 December 31, 2011 Principal Investigator: Dr. Walter Bryzik, DeVlieg Chairman and Professor
REPORT NUMBER: 114-CAL SAFETY COMPLIANCE TESTING FOR FMVSS No. 114 THEFT PROTECTION AND ROLLOWAY PREVENTION
 REPORT NUMBER: 114-CAL-08-07 SAFETY COMPLIANCE TESTING FOR FMVSS No. 114 THEFT PROTECTION AND ROLLOWAY PREVENTION GENERAL MOTORS CORPORATION 2008 CHEVROLET MALIBU HYBRID FOUR-DOOR SEDAN NHTSA NUMBER: C80110
Lowering Pavement Evaluation Costs Using Big Data
 SOLVING PROBLEMS OF GLOBAL IMPORTANCE www.ara.com Lowering Pavement Evaluation Costs Using Big Data Bill Buttlar UIUC Bill Vavrik ARA T.H.E. 2016 www.ara.com 2015 2014 Applied Research Associates, Inc.
REPORT NUMBER: 114-CAL SAFETY COMPLIANCE TESTING FOR FMVSS No. 114 THEFT PROTECTION AND ROLLOWAY PREVENTION
 REPORT NUMBER: 114-CAL-08-02 SAFETY COMPLIANCE TESTING FOR FMVSS No. 114 THEFT PROTECTION AND ROLLOWAY PREVENTION MAZDA MOTOR CORPORATION 2008 MAZDA CX-9 MPV NHTSA NUMBER: C85401 CALSPAN TEST NUMBER: 8858-F114-02
SAFETY COMPLIANCE TESTING FOR FMVSS NO. 114 THEFT PROTECTION
 REPORT NUMBER 114-GTL-10-007 SAFETY COMPLIANCE TESTING FOR FMVSS NO. 114 THEFT PROTECTION TOYOTA MOTOR CORPORATION 2010 SCION tc PASSENGER CAR NHTSA NO. CA5106 GENERAL TESTING LABORATORIES, INC. 1623 LEEDSTOWN
Measuring Pavement Condition Data for a Long-term Pavement Performance Study on New Zealand Roads. D Brown
 Measuring Pavement Condition Data for a Long-term Pavement Performance Study on New Zealand Roads. D Brown Measuring Pavement Condition Data for a Long-term Pavement Performance Study Background Measurement
Thomas Bennert, Ph.D. Rutgers University Center for Advanced Infrastructure and Transportation (CAIT)
") Thomas Bennert, Ph.D. Rutgers University Center for Advanced Infrastructure and Transportation (CAIT) Rutgers University working on putting together a set of performance tests (rutting and cracking) that
Thomas Bennert, Ph.D. Rutgers University Center for Advanced Infrastructure and Transportation (CAIT) Rutgers University working on putting together a set of performance tests (rutting and cracking) that
(2111) Digital Test Rolling REVISED 07/22/14 DO NOT REMOVE THIS. IT NEEDS TO STAY IN FOR THE CONTRACTORS. SP
 Digital Test Rolling REVISED 07/22/14 DO NOT REMOVE THIS. IT NEEDS TO STAY IN FOR THE CONTRACTORS. SP") S-xx (2111) Digital Test Rolling REVISED 07/22/14 DO NOT REMOVE THIS. IT NEEDS TO STAY IN FOR THE CONTRACTORS. SP2014-54.2 The Veda Software and Digital Test Rolling forms are available on the MnDOT Advanced
S-xx (2111) Digital Test Rolling REVISED 07/22/14 DO NOT REMOVE THIS. IT NEEDS TO STAY IN FOR THE CONTRACTORS. SP2014-54.2 The Veda Software and Digital Test Rolling forms are available on the MnDOT Advanced
TRAFFIC SIMULATION IN REGIONAL MODELING: APPLICATION TO THE INTERSTATEE INFRASTRUCTURE NEAR THE TOLEDO SEA PORT
 MICHIGAN OHIO UNIVERSITY TRANSPORTATION CENTER Alternate energy and system mobility to stimulate economic development. Report No: MIOH UTC TS41p1-2 2012-Final TRAFFIC SIMULATION IN REGIONAL MODELING: APPLICATION
National Center for Statistics and Analysis Research and Development
 U.S. Department of Transportation National Highway Traffic Safety Administration DOT HS 809 271 June 2001 Technical Report Published By: National Center for Statistics and Analysis Research and Development
SAFETY COMPLIANCE TESTING FOR FMVSS NO. 114 THEFT PROTECTION
 REPORT NUMBER 114-GTL-10-002 SAFETY COMPLIANCE TESTING FOR FMVSS NO. 114 THEFT PROTECTION CHRYSLER GROUP LLC 2010 DODGE CHARGER SE, PASSENGER CAR NHTSA NO. CA0302 GENERAL TESTING LABORATORIES, INC. 1623
Non-Destructive Pavement Testing at IDOT. LaDonna R. Rowden, P.E. Pavement Technology Engineer
 Non-Destructive Pavement Testing at IDOT LaDonna R. Rowden, P.E. Pavement Technology Engineer Bureau of Materials and Physical Research Physical Research Section Bridge Investigations Unit Pavement Technology
Evaluation of Digital Refractometers for Field Determination of FSII Concentration in JP-5 Fuel
 Evaluation of Digital Refractometers for Field Determination of FSII Concentration in JP-5 Fuel NAVAIRSYSCOM REPORT 441/13-011 Prepared By: JOHN KRIZOVENSKY Chemist AIR 4.4.5 NAVAIR Public Release 2013-867
Remote Combination Adaptive Driving Equipment Investigation Dynamic Science, Inc. (DSI), Case Number G 1990 Ford Bronco Arizona October
, Case Number G 1990 Ford Bronco Arizona October") Remote Combination Adaptive Driving Equipment Investigation Dynamic Science, Inc. (DSI), Case Number 2007-76-131G 1990 Ford Bronco Arizona October 2007 This document is disseminated under the sponsorship
Remote Combination Adaptive Driving Equipment Investigation Dynamic Science, Inc. (DSI), Case Number 2007-76-131G 1990 Ford Bronco Arizona October 2007 This document is disseminated under the sponsorship
SAFETY COMPLIANCE TESTING FOR FMVSS NO. 202 HEAD RESTRAINTS STATIC REQUIREMENTS
 REPORT NUMBER 202-GTL-08-004 SAFETY COMPLIANCE TESTING FOR FMVSS NO. 202 HEAD RESTRAINTS STATIC REQUIREMENTS HYUNDAI MOTOR MANUFACTURING ALABAMA, LLC 2008 HYUNDAI SONATA, PASSENGER CAR NHTSA NO. C80507
FMVSS 121 Brake Performance and Stability Testing
 FMVSS 121 Brake Performance and Stability Testing FINAL REPORT - Revision A SwRI Project No. 03-05190 Prepared for Mr. Bill Washington Air Brake Systems 4356 E. Valley Road Mount Pleasant, MI 48804-0293
City of Storm Lake Fire Department Heavy Rescue Specifications
 INTENT OF SPECIFICATIONS City of Storm Lake Fire Department Heavy Rescue Specifications It shall be the intent of these specifications to provide a complete apparatus equipped as hereinafter specified.
REPORT NUMBER: NCAP305I-MGA NEW CAR ASSESSMENT PROGRAM (NCAP) FMVSS No. 305 Indicant Test
 FMVSS No. 305 Indicant Test") REPORT NUMBER: NCAP305I-MGA-2012-008 NEW CAR ASSESSMENT PROGRAM (NCAP) FMVSS No. 305 Indicant Test GENERAL MOTORS LLC 2013 Chevrolet Malibu ECO4-Dr Hybrid Sedan NHTSA NUMBER: MD0101 MGA RESEARCH CORPORATION
REPORT NUMBER: NCAP305I-MGA-2012-008 NEW CAR ASSESSMENT PROGRAM (NCAP) FMVSS No. 305 Indicant Test GENERAL MOTORS LLC 2013 Chevrolet Malibu ECO4-Dr Hybrid Sedan NHTSA NUMBER: MD0101 MGA RESEARCH CORPORATION
REPORT NUMBER: 301-MGA SAFETY COMPLIANCE TESTING FOR FMVSS 301R FUEL SYSTEM INTEGRITY REAR IMPACT
 REPORT NUMBER: 301-MGA-2011-008 SAFETY COMPLIANCE TESTING FOR FMVSS 301R FUEL SYSTEM INTEGRITY REAR IMPACT MAZDA MOTOR CORPORATION 2011 MAZDA 2 SPORT MT NHTSA NUMBER: CB5400 PREPARED BY: MGA RESEARCH CORPORATION
REPORT NUMBER: 301-CAL SAFETY COMPLIANCE TESTING FOR FMVSS 301 FUEL SYSTEM INTEGRITY HONDA MOTOR COMPANY 2007 HONDA ACCORD 4-DOOR SEDAN
 REPORT NUMBER: 301-CAL-07-05 SAFETY COMPLIANCE TESTING FOR FMVSS 301 FUEL SYSTEM INTEGRITY HONDA MOTOR COMPANY 2007 HONDA ACCORD 4-DOOR SEDAN NHTSA NUMBER: C75304 CALSPAN TEST NUMBER: 8832-F301-05 CALSPAN
Asphalt Pavement Construction Update
 Asphalt Pavement Construction Update 2013 FTBA Construction Conference Richard Hewitt, PE State Construction Pavement Engineer Smoothness Developmental Specification Smoothness Developmental Specification
GENERAL TESTING LABORATORIES, INC LEEDSTOWN ROAD COLONIAL BEACH, VIRGINIA 22443
 REPORT NUMBER 202a-GTL-10-004 SAFETY COMPLIANCE TESTING FOR S HEAD RESTRAINTS STATIC REQUIREMENTS VOLVO CAR CORPORATION 2010 VOLVO S40, PASSENGER CAR NHTSA NO. CA5900 GENERAL TESTING LABORATORIES, INC.
REPEATABILITY OF CPX TYRE/ROAD NOISE MEASUREMENTS. Gillian Adams, Frits Kamst and Stephen Pugh ASK Consulting Engineers, Brisbane, Australia
 ICSV14 Cairns Australia 9-12 July, 2007 REPEATABILITY OF CPX TYRE/ROAD NOISE MEASUREMENTS Gillian Adams, Frits Kamst and Stephen Pugh ASK Consulting Engineers, Brisbane, Australia frits@askce.com ABSTRACT
FIGURE 15. MANUAL RUT DEPTH
 FIGURE 15. MANUAL RUT DEPTH Flexible Pavement Condition Survey Handbook, March 2012 Page 31 Ride Rating The longitudinal profile of each wheel path is measured at highway speeds by an ASTM E-950 Class
VEHICLE FLEET MANAGEMENT AT THE IDAHO NATIONAL ENGINEERING AND ENVl RONMENTAL LABORATORY
 VEHICLE FLEET MANAGEMENT AT THE IDAHO NATIONAL ENGINEERING AND ENVl RONMENTAL LABORATORY March 1999 DISCLAIMER Portions of this document may be illegible in electronic image products. Images are produced
SAFETY COMPLIANCE TESTING FOR FMVSS NO. 202 HEAD RESTRAINTS STATIC REQUIREMENTS
 REPORT NUMBER 202-GTL-08-005 SAFETY COMPLIANCE TESTING FOR FMVSS NO. 202 HEAD RESTRAINTS STATIC REQUIREMENTS KIA MOTORS CORPORATION 2008 KIA SPORTAGE, MPV NHTSA NO. C80506 GENERAL TESTING LABORATORIES,
Exhibit F - UTCRS. 262D Whittier Research Center P.O. Box Lincoln, NE Office (402)
") UTC Project Information Project Title University Principal Investigator PI Contact Information Funding Source(s) and Amounts Provided (by each agency or organization) Exhibit F - UTCRS Improving Safety
UTC Project Information Project Title University Principal Investigator PI Contact Information Funding Source(s) and Amounts Provided (by each agency or organization) Exhibit F - UTCRS Improving Safety
DEPARTMENT OF TRANSPORTATION. National Highway Traffic Safety Administration. [Docket No. NHTSA ] Notice of Buy America Waiver
![DEPARTMENT OF TRANSPORTATION. National Highway Traffic Safety Administration. [Docket No. NHTSA ] Notice of Buy America Waiver](/thumbs/85/92873617.jpg "DEPARTMENT OF TRANSPORTATION. National Highway Traffic Safety Administration. [Docket No. NHTSA ] Notice of Buy America Waiver") This document is scheduled to be published in the Federal Register on 09/16/2014 and available online at http://federalregister.gov/a/2014-21992, and on FDsys.gov DEPARTMENT OF TRANSPORTATION National
This document is scheduled to be published in the Federal Register on 09/16/2014 and available online at http://federalregister.gov/a/2014-21992, and on FDsys.gov DEPARTMENT OF TRANSPORTATION National
2011 NDIA GROUND VEHICLE SYSTEMS ENGINEERING AND TECHNOLOGY SYMPOSIUM POWER AND MOBILITY (P&M) MINI-SYMPOSIUM AUGUST 9-11 DEARBORN, MICHIGAN
 MINI-SYMPOSIUM AUGUST 9-11 DEARBORN, MICHIGAN") 211 NDIA GROUND VEHICLE SYSTEMS ENGINEERING AND TECHNOLOGY SYMPOSIUM POWER AND MOBILITY (P&M) MINI-SYMPOSIUM AUGUST 9-11 DEARBORN, MICHIGAN Electrode material enhancements for lead-acid batteries Dr. William
211 NDIA GROUND VEHICLE SYSTEMS ENGINEERING AND TECHNOLOGY SYMPOSIUM POWER AND MOBILITY (P&M) MINI-SYMPOSIUM AUGUST 9-11 DEARBORN, MICHIGAN Electrode material enhancements for lead-acid batteries Dr. William
PFI Quality Assurance/Quality Control (QA/QC) Program for Residential/Commercial Densified Fuels
 Program for Residential/Commercial Densified Fuels") PFI Quality Assurance/Quality Control (QA/QC) Program for Residential/Commercial Densified Fuels Scope: This program must be utilized by participating pellet fuel manufacturers to assure consistent quality
PFI Quality Assurance/Quality Control (QA/QC) Program for Residential/Commercial Densified Fuels Scope: This program must be utilized by participating pellet fuel manufacturers to assure consistent quality
HAS MOTORIZATION IN THE U.S. PEAKED? PART 9: VEHICLE OWNERSHIP AND DISTANCE DRIVEN, 1984 TO 2015
 SWT-2017-4 FEBRUARY 2017 HAS MOTORIZATION IN THE U.S. PEAKED? PART 9: VEHICLE OWNERSHIP AND DISTANCE DRIVEN, 1984 TO 2015 MICHAEL SIVAK SUSTAINABLE WORLDWIDE TRANSPORTATION HAS MOTORIZATION IN THE U.S.
Joint Oil Analysis Program Spectrometer Standards VHG Labs Inc. Qualification Report For D19-0, D3-100 and D12-XXX Series Standards
 Joint Oil Analysis Program Spectrometer Standards VHG Labs Inc. Qualification Report For D19-0, D3-100 and D12-XXX Series Standards NF&LCFT REPORT 441/13-010 Prepared By: MICHAEL PERETICH, PhD Oil Analysis
REPORT NUMBER: 301-MGA SAFETY COMPLIANCE TESTING FOR FMVSS 301R FUEL SYSTEM INTEGRITY REAR IMPACT
 REPORT NUMBER: 301-MGA-2010-005 SAFETY COMPLIANCE TESTING FOR FMVSS 301R FUEL SYSTEM INTEGRITY REAR IMPACT NISSAN MOTOR COMPANY LTD 2010 NISSAN CUBE NHTSA NUMBER: CA5201 PREPARED BY: MGA RESEARCH CORPORATION
Southern California Edison Rule 21 Storage Charging Interconnection Load Process Guide. Version 1.1
 Southern California Edison Rule 21 Storage Charging Interconnection Load Process Guide Version 1.1 October 21, 2016 1 Table of Contents: A. Application Processing Pages 3-4 B. Operational Modes Associated
Headlight Test and Rating Protocol (Version I)
") Headlight Test and Rating Protocol (Version I) February 2016 HEADLIGHT TEST AND RATING PROTOCOL (VERSION I) This document describes the Insurance Institute for Highway Safety (IIHS) headlight test and
Headlight Test and Rating Protocol (Version I) February 2016 HEADLIGHT TEST AND RATING PROTOCOL (VERSION I) This document describes the Insurance Institute for Highway Safety (IIHS) headlight test and
2018 NDE Pupil Transportation Reminders
 2018 NDE Pupil Transportation Reminders Effective January 1, 2019, DMV will no longer issue school bus permits per LB347. At that time, the Nebraska Safety Center will be begin handling the qualification
REPORT NUMBER: 301-MGA SAFETY COMPLIANCE TESTING FOR FMVSS 301R FUEL SYSTEM INTEGRITY REAR IMPACT
 REPORT NUMBER: 301-MGA-2010-007 SAFETY COMPLIANCE TESTING FOR FMVSS 301R FUEL SYSTEM INTEGRITY REAR IMPACT NISSAN MOTOR COMPANY LTD 2010 NISSAN CUBE NHTSA NUMBER: CA5205 PREPARED BY: MGA RESEARCH CORPORATION
Jon Konings Former CEM Coordinator
 Jon Konings Former CEM Coordinator Not covering every detail of these QA topics. There is such a wide variation in the configuration of hardware out there, and I can t cover everything, so I will address
SAFETY COMPLIANCE TESTING FOR FMVSS 124 ACCELERATOR CONTROL SYSTEMS
 REPORT NUMBER 124-GTL-07-001 SAFETY COMPLIANCE TESTING FOR FMVSS 124 ACCELERATOR CONTROL SYSTEMS HYUNDAI MOTOR COMPANY 2007 HYUNDAI ELANTRA 4-DOOR PASSENGER CAR NHTSA NO. C70502 GENERAL TESTING LABORATORIES,
HAS MOTORIZATION IN THE U.S. PEAKED? PART 10: VEHICLE OWNERSHIP AND DISTANCE DRIVEN, 1984 TO 2016
 SWT-2018-2 JANUARY 2018 HAS MOTORIZATION IN THE U.S. PEAKED? PART 10: VEHICLE OWNERSHIP AND DISTANCE DRIVEN, 1984 TO 2016 MICHAEL SIVAK SUSTAINABLE WORLDWIDE TRANSPORTATION HAS MOTORIZATION IN THE U.S.
Act 229 Evaluation Report
 R22-1 W21-19 W21-20 Act 229 Evaluation Report Prepared for Prepared by Table of Contents 1. Documentation Page 3 2. Executive Summary 4 2.1. Purpose 4 2.2. Evaluation Results 4 3. Background 4 4. Approach
REPORT NUMBER: 301-MGA SAFETY COMPLIANCE TESTING FOR FMVSS 301R FUEL SYSTEM INTEGRITY REAR IMPACT
 REPORT NUMBER: 301-MGA-2007-002 SAFETY COMPLIANCE TESTING FOR FMVSS 301R FUEL SYSTEM INTEGRITY REAR IMPACT NISSAN MOTOR CO., LTD. 2006 NISSAN PATHFINDER LE 4X2 NHTSA NUMBER: C65200 PREPARED BY: MGA RESEARCH
REPORT NO. TR-P NC SAFETY COMPLIANCE TESTING FOR FMVSS 223 REAR IMPACT GUARDS 2007 TRANSFREIGHT TECHNOLOGY NHTSA NO.
 REPORT NO. SAFETY COMPLIANCE TESTING FOR FMVSS 223 REAR IMPACT GUARDS 2007 TRANSFREIGHT TECHNOLOGY NHTSA NO. RIG 009 PREPARED BY: KARCO ENGINEERING, LLC. 9270 HOLLY ROAD ADELANTO, CALIFORNIA 92301 SEPTEMBER
Impact of Environment-Friendly Tires on Pavement Damage
 Impact of Environment-Friendly Tires on Pavement Damage Hao Wang, PhD Assistant Professor, Dept. of CEE Rutgers, the State University of New Jersey The 14th Annual NJDOT Research Showcase 10/18/2012 Acknowledgement
The attached pre-qualification application should be submitted with your bid, in a separate sealed envelope.
 BL098-17 October 9, 2017 INSPECTION, MAINTENANCE AND REPAIR OF HOISTS AND CRANES ON AN ANNUAL CONTRACT ADDENDUM #1 BL098-17 The following should be added to the above-referenced bid. The attached pre-qualification
Project Title: Using Truck GPS Data for Freight Performance Analysis in the Twin Cities Metro Area Prepared by: Chen-Fu Liao (PI) Task Due: 9/30/2013
 Task Due: 9/30/2013") MnDOT Contract No. 998 Work Order No.47 213 Project Title: Using Truck GPS Data for Freight Performance Analysis in the Twin Cities Metro Area Prepared by: Chen-Fu Liao (PI) Task Due: 9/3/213 TASK #4:
MnDOT Contract No. 998 Work Order No.47 213 Project Title: Using Truck GPS Data for Freight Performance Analysis in the Twin Cities Metro Area Prepared by: Chen-Fu Liao (PI) Task Due: 9/3/213 TASK #4: