Report. Traffic Impact Study for the Proposed Mixed-Use Development at 555 Pacific Avenue. In The City of Santa Cruz.
|
|
|
- Louisa McDowell
- 6 years ago
- Views:
Transcription


1 TJKM Transportation Consultants Report Traffic Impact Study for the Proposed Mixed-Use Development at 555 Pacific Avenue In The City of Santa Cruz February 11, 2014 Pleasanton Fresno Sacramento Santa Rosa TJKM
2 TJKM Transportation Consultants Report Traffic Impact Study for the Proposed Mixed-Use Development at 555 Pacific Avenue In The City of Santa Cruz February 11, 2014 TJKM Prepared by: TJKM Transportation Consultants 4305 Hacienda Drive Suite 550 Pleasanton, CA Tel: Fax: J:\JURISDICTION\S\Santa Cruz\ Pacific Ave TIS\Report\R docx
3 TJKM Transportation Consultants Table of Contents Introduction and Summary... 1 Introduction... 1 Summary... 1 Intersection Analysis Methodology... 4 Intersection Analysis Methodology... 4 Level of Service Analysis Methodology... 4 Significant Impact Criteria... 4 Signalized and Unsignalized Intersections... 4 Existing Traffic Conditions... 6 Existing Roadway Network... 6 Existing Transit Systems... 6 Existing Bicycle and Pedestrian Facilities in Project Vicinity... 7 Level of Service Analysis... 8 Existing plus Project Conditions Project Trip Generation Project Trip Distribution and Assignment Level of Service Analysis Project Access and Internal Circulation Parking Requirements Cumulative (General Plan 2030) with Project Conditions Level of Service Analysis Conclusions Study Participants and References TJKM Personnel Others References List of Appendices Appendix A Level of Service Analysis Methodology Appendix B Raw Traffic Data and Study Area Transit Maps Appendix C Level of Service Worksheets: Existing Conditions Appendix D Level of Service Worksheets: Existing plus Project Conditions Appendix E Level of Service Worksheets: Cumulative (General Plan 2030) with Project Conditions
4 TJKM Transportation Consultants List of Figures Figure 1: Vicinity Map...2 Figure 2: Proposed Site Plan...3 Figure 3: Existing Turning Movement Volumes...9 Figure 4: Existing Lane Geometry Figure 5: Proposed Project Trip Distribution and Assignment Assumptions Figure 6: Existing plus Project Turning Movement Volumes Figure 7: Cumulative (General Plan 2030) with Project Turning Movement Volumes List of Tables Table I: Intersection LOS Existing Conditions...8 Table II: Project Trip Generation Table III: Intersection LOS Existing plus Project Conditions Table IV: Summary of Parking Requirements Table V: Intersection LOS Cumulative (General Plan 2030) with Project Conditions... 17
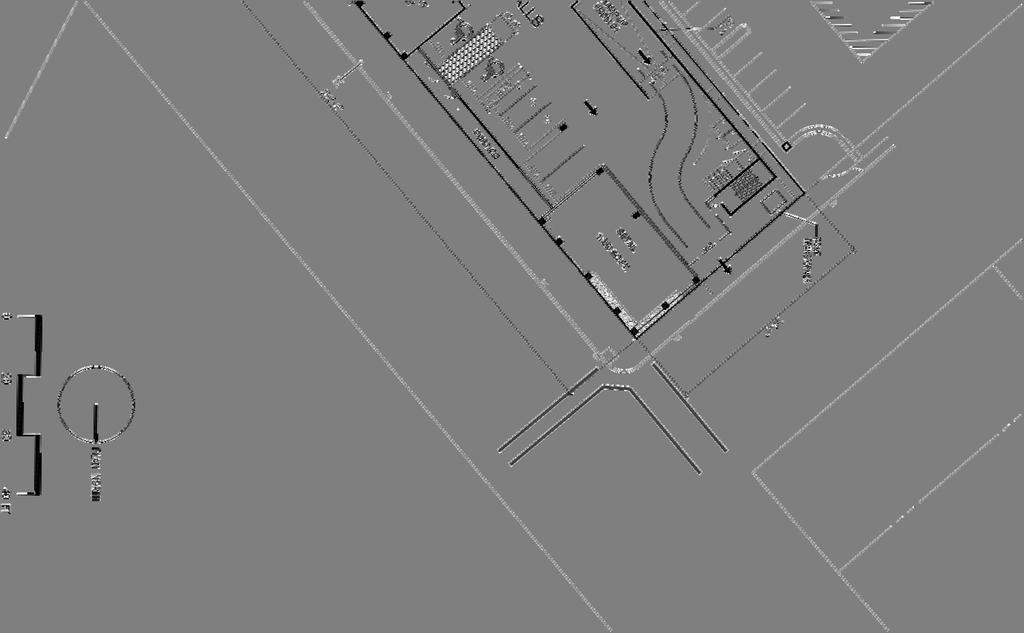
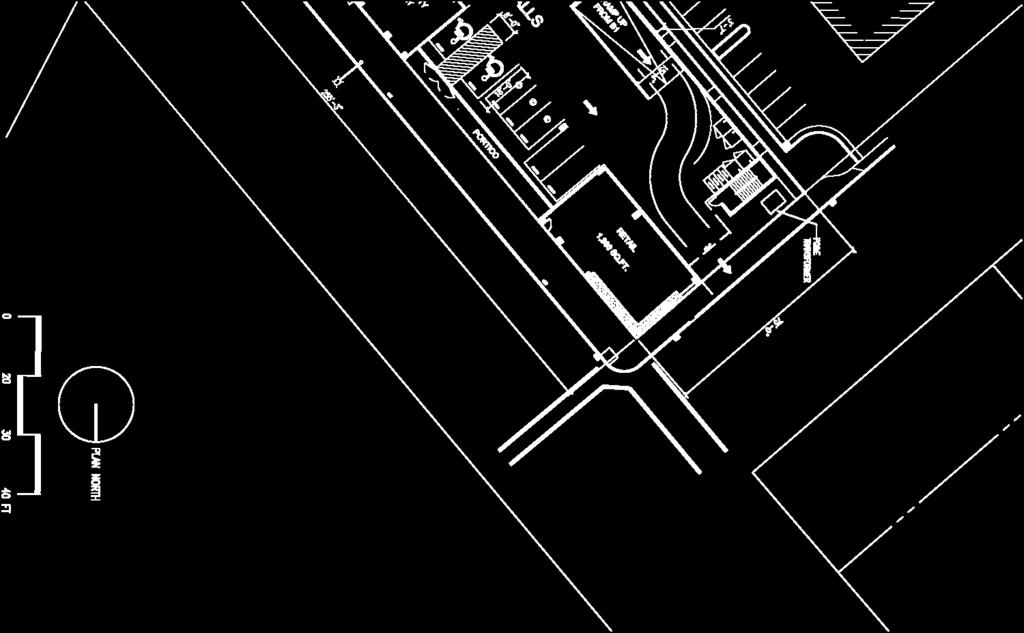
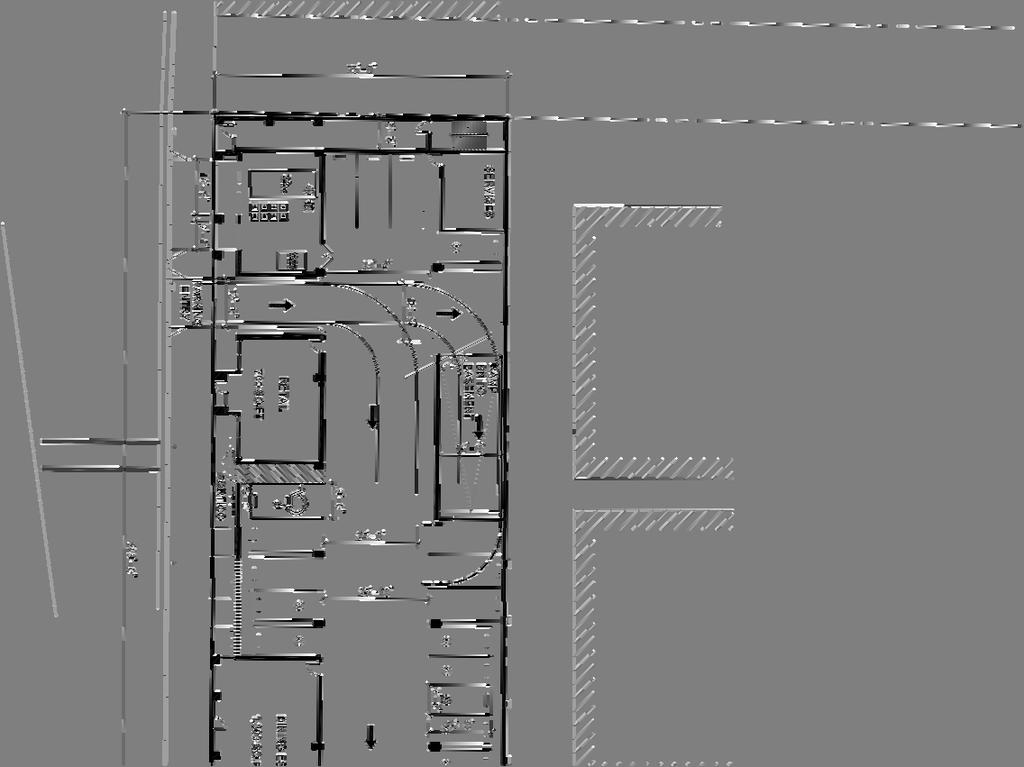
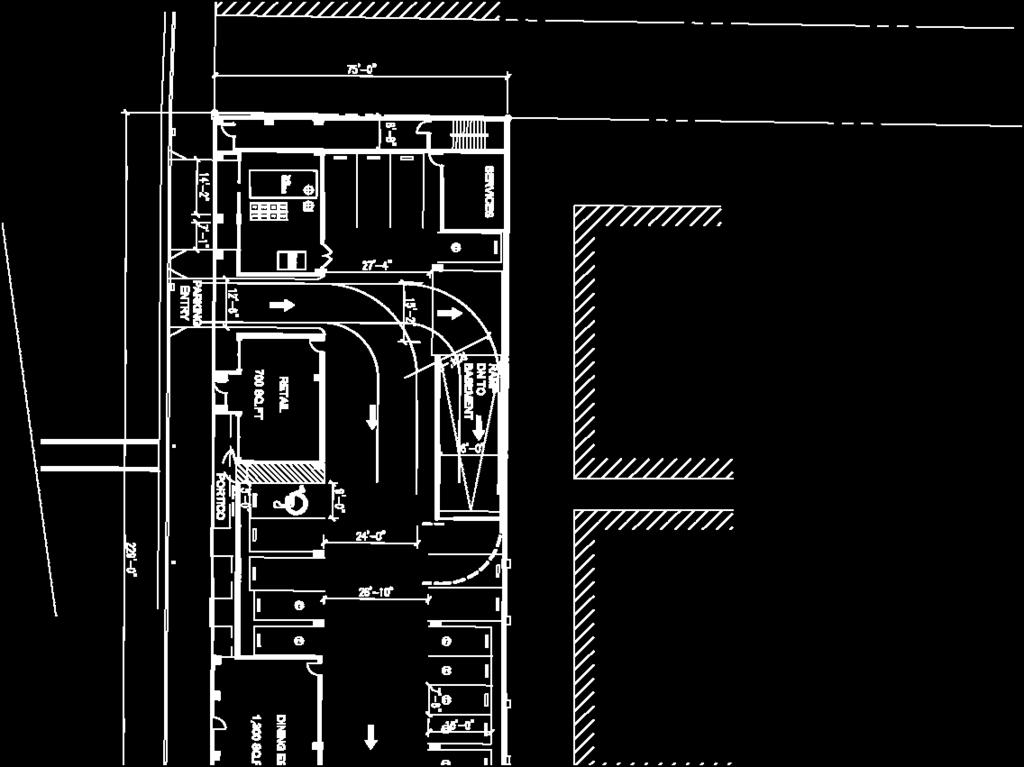
5 TJKM Transportation Consultants Introduction and Summary Introduction This report presents the results of TJKM's traffic impact analysis for the proposed mixed-use development located at 555 Pacific Avenue in the City of Santa Cruz, California. Currently, the project site is a vacant lot surrounded by commercial and residential land uses to the west and fronted by Pacific Avenue to the east. The project sponsor is proposing to build 94 Single Room Occupancy (SRO) residential units, 2,600 square feet of restaurant land use (on two pads) and 2,455 square feet of retail land use. According to the project applicant, the single room occupancy units proposed at the project site are small ownership units (SOU) that are rented out initially and in the future based on the market potential, these residential units may be sold individually. The proposed building consists of four levels above the ground and a basement level of private parking for the residential units. The first level (i.e., the ground level) consists of restaurants and retail land use as proposed by the project applicant, Barry Swenson Builder. Levels two through four would consist of studio and one-bedroom apartment SRO units. Figure 1 illustrates the project location and its vicinity. Figure 2 represents the proposed site plan. Summary The proposed project is expected to generate 847 weekday daily trips, including 83 trips (51 inbound and 32 outbound) during the weekday p.m. peak hour. All study intersections are expected to operate at an acceptable level of service of LOS C or better under Existing and Existing plus Project Conditions. Under future Cumulative with Project Conditions, all study intersections are expected to continue to operate at acceptable level of service conditions. Under Cumulative Conditions, at the intersection of Pacific Avenue/Front Street, TJKM recommends that the City should consider striping the southbound approach to provide a separate southbound left-turn and right-turn lanes. TJKM also recommends re-designing this acute angled intersection with right angular approaches to shorten the pedestrian crosswalks and thereby reducing the walk time. TJKM recommends stop sign control and pavement markings on the upward ramp from the basement level where it intersects the ground level egress driveway, and on the egress driveway itself where it intersects Sycamore Street, to improve turn safety at the project site. To improve the pedestrian safety at the parking exit on Sycamore Street, TJKM recommends installation of CAUTION VEHICLE EXITING LED display sign to warn pedestrians of approaching vehicles. It is also recommended to install a reflective speed bump at the exit to slow down the vehicles and install an illuminated sign WATCH FOR PEDESTRIANS at the parking egress. In addition, a convex mirror should be considered at the egress to address line of sight issue. Report Traffic Impact Study for the proposed mixed-use development at 555 Pacific Avenue, Santa Cruz, CA Page 1 February 11, 2014
6

7
8 TJKM Transportation Consultants Intersection Analysis Methodology Intersection Analysis Methodology The following eight intersections were selected by the City staff for the weekday p.m. peak hour traffic analysis: 1. Front Street and Pacific Avenue (One-way Stop Control) 2. Pacific Avenue and Laurel Street (Signal) 3. Front Street and Soquel Avenue (Signal) 4. Front Street and Laurel Street (Signal) 5. Broadway and San Lorenzo Boulevard (Signal) 6. Broadway and Ocean Street (Signal) 7. Pacific Avenue and Sycamore Street (One-way Stop Control) 8. Project Driveway/Sycamore Street (One-way Stop Control) a future intersection The following three study scenarios were addressed in this traffic impact study: 1. Existing Conditions 2. Existing Plus Project Conditions 3. Cumulative (General Plan 2030) with Project Conditions Level of Service Analysis Methodology The operating conditions at all of the study intersections were evaluated using the 2000 Highway Capacity Manual (HCM) Operations Method contained in TRAFFIX software. Peak hour intersection conditions are reported as average delay in seconds per vehicle with corresponding levels of service (LOS). A level of service rating is a qualitative description of intersection operations, which is reported using an A through F letter rating system to describe travel delay and congestion. Level of Service A indicates free flow conditions with little or no delay and LOS F indicates jammed conditions with excessive delays and long back-ups. The methodology is described in detail in Appendix A. Significant Impact Criteria Signalized and Unsignalized Intersections In brief, the City s level of service standard is LOS D for both signalized and unsignalized intersections. Intersections that are expected to operate below LOS D are considered as impacted and should be considered for mitigation. In accordance with the California Environmental Quality Act (CEQA), State CEQA Guidelines, City of Santa Cruz plans and policies, Caltrans guidelines and agency and professional standards, a project impact would be considered significant if: The project would conflict with an applicable plan, ordinance or policy establishing measures of effectiveness for the performance of the circulation system, taking into account all modes of transportation including mass transit and non-motorized travel and relevant components of the circulation system, including but not limited to intersections, streets, highways and freeways, pedestrian and bicycle paths, and mass transit OR the project traffic when added to existing conditions would result in the level of service deteriorating below the City standard or would substantially worsen an intersection operating below level of Report Traffic Impact Study for the proposed mixed-use development at 555 Pacific Avenue, Santa Cruz, CA Page 4 February 11, 2014
9 TJKM Transportation Consultants service D. The City s current level of service standard is LOS D, although the General Plan policies consider accepting a LOS below D at major regional intersections where improvements would be prohibitively costly or result in significant, unacceptable environmental impacts; The project traffic would change the peak hour level of service of a State Highway roadway segment from acceptable operation to deficient operation with the addition of projectgenerated traffic; If the project substantially increases hazards due to a design feature (e.g., sharp curves or dangerous intersections) or incompatible uses (e.g., farm equipment); The project results in inadequate emergency access; The project conflicts with adopted policies, plans or programs regarding public transit, bicycle, or pedestrian facilities, or otherwise decrease the performance or safety of such facilities) Report Traffic Impact Study for the proposed mixed-use development at 555 Pacific Avenue, Santa Cruz, CA Page 5 February 11, 2014
10 TJKM Transportation Consultants Existing Traffic Conditions Existing Roadway Network The proposed project is located at 555 Pacific Avenue in the City of Santa Cruz, and the regional access to the project site is via Highway 1 and Highway 17. Streets near the project site, such as Front Street, Ocean Street, Soquel Avenue and Water Street, connect with Pacific Avenue. The following is the description of roadways of relevance to the project site: Highway 1 is a north-south state highway within Santa Cruz County, connecting the coastal communities of Santa Cruz, Live Oak, Davenport, Capitola, Aptos and Watsonville. Highway 1 continues northward into San Mateo County and City of San Francisco, and continues southward into Monterey County towards Seaside and Monterey Bay. In Santa Cruz area, Highway 1 is a fourto-six lane freeway east of River Street, a four-lane expressway between River Street and Mission Street, and a four-lane arterial along Mission Street. Highway 17 is a state highway connecting the cities of San Jose and Santa Cruz. In the project vicinity, Highway 17 is a six-lane freeway between Highway 1 and Pasatiempo Drive, and a four-lane freeway north of Pasatiempo Drive. The speed limit on this highway is 55 miles per hour (mph) between Highway 1 and Pasatiempo Drive, and 65 mph north of Pasatiempo Drive. Broadway is a two-lane, east-west arterial within eastern Santa Cruz that provides access primarily to residential land uses. This roadway has bike lanes on both the sides along its entirety. The posted speed limit on Broadway is 25 mph. Ocean Street is a three-to-four lane, north-south arterial in eastern Santa Cruz. It serves as a regional gateway into the beach front from Highway 1 and Highway 17. Ocean Street is a four-lane section for most of its length, with a three lane section between Cliff Drive and Barson Street. The speed limit on this roadway is 25 mph to the south and 30 mph to the north of Water Street. Soquel Avenue is an east-west arterial that provides regional community access to the City of Santa Cruz downtown area. To the east, this roadway provides regional access to the City via Highway 1. Soquel Drive in the vicinity of the project is primarily fronted by commercial and moderate-size shopping centers. Soquel Avenue is four-lane wide roadway with a speed limit of 25 mph. Pacific Avenue is a two-lane north-south local street that provides access to the beachfront area located on the southern end. This roadway runs between Mission Street/Water Street to the north and Beach Street to the south. The speed limit on this roadway is 25 mph between Laurel Street and Beach Street and 15 mph between Mission Street and Laurel Street. Front Street is a two lane north-south roadway that runs between Mission Street to the north and Pacific Avenue to the south. This road primarily fronts commercial and retail land uses with a posted speed limit of 25 mph. Existing Transit Systems The public transit provider in Santa Cruz County is the Santa Cruz Metropolitan Transit District (SCMTD). SCMTD operates from four key transit centers and they are located in Santa Cruz, Capitola, Watsonville, and Scotts Valley. Each of these centers operates as a hub for local area transit routes, providing easy connection and quick transfer to multiple transit routing. Report Traffic Impact Study for the proposed mixed-use development at 555 Pacific Avenue, Santa Cruz, CA Page 6 February 11, 2014

11 TJKM Transportation Consultants SCMTD currently provides regular transit service in the vicinity of the project site. Four transit routes that travel within two blocks of the project site are bus routes 3, 3W, 19 and 20. These routes traverse between various locations throughout Santa Cruz County, including downtown Santa Cruz, the University of California at Santa Cruz (UCSC), Capitola, Aptos, and Watsonville. Bus route 3 and 3W (weekend service) runs along the project site frontage between the route s Downtown Metro center (Pacific Station) and Natural Bridges terminals. Example Transit Route SCMTD Bus Route 3 (Source: Bus route 19 runs between the UCSC campus and the Metro center (Pacific Station) via Bay Street, and Bus Route 20 runs between the UCSC campus and the Metro Center via Delaware Avenue through the Westside. In general, the bus routes generally operate between 7:00 AM and late evenings on weekdays. SCMTD bus route maps and schedules related to the project vicinity are provided in Appendix B of this report. The nearest bus stop to the project site is located along Pacific Avenue south of Front Street. Bus stops are also located on both directions of Laurel Street and Broadway (i.e., three blocks north of the project site). Existing Bicycle and Pedestrian Facilities in Project Vicinity There are three basic types of bicycle facilities. Each type is described below: Bike path (Class I) - A completely separate right-of-way designed for the exclusive use of cyclists and pedestrians, with minimal crossings for motorists. These paths should have a minimum width of 8 feet when two-way travel is required and 5 feet in width to accommodate one-way movement. Report Traffic Impact Study for the proposed mixed-use development at 555 Pacific Avenue, Santa Cruz, CA Page 7 February 11, 2014
12 TJKM Transportation Consultants Bike lane (Class II) - A lane on a regular roadway, separated from the motorized vehicle right-of-way by paint striping, designated for the exclusive or semi-exclusive use of bicycles. This type of bike lane allows one-way travel. A minimum width of 5 feet should be provided and adjacent curbside parking avoided where feasible; where curbside parking is allowed adjoining a bike lane, the combined width of the parking and adjacent bike lane should be not less than 13 feet. Bike route (Class III) - Provides shared use of the roadway, designated by signs or permanent markings and shared with motorists. Front Street has Class II bicycle lanes on both sides of the street along its entirety, i.e. between downtown Santa Cruz and Pacific Avenue, which continue along Pacific Avenue from Front Street to Beach Street. Ocean Street has bicycle lanes north of Soquel Avenue, but not near the project site. Soquel Avenue, parallel to and one block north of Broadway, also has bicycle lanes along its entirety, i.e. between downtown Santa Cruz and the east side city limits. Sidewalks are present along most streets in the vicinity of the project site, including Pacific Avenue, Front Street, Broadway, Ocean Street, and Soquel Avenue. The street and bicycle network near the site and within the City of Santa Cruz as a whole would sufficiently accommodate all pedestrian and bicycle travel to and from the project site. No additional improvements to the pedestrian or bicycle network appear to be necessary as a result of this project. Level of Service Analysis The p.m. peak hour turning movement counts at the study intersections were conducted during the first half of November Figure 3 illustrates the p.m. peak hour turning movement volumes for the study intersections and Figure 4 illustrates the existing lane configurations. The raw traffic counts are provided in Appendix B. Table I summarizes the results of the intersection analysis under Existing Conditions. The detailed LOS calculations (TRAFFIX Output) are contained in Appendix C. Under Existing Conditions, all study intersections operate at an acceptable service level (LOS C or better). No improvements appear to be necessary at any of the study intersections. Table I: Intersection LOS Existing Conditions ID Intersection Control P.M. Peak Hour Average Delay LOS (sec/veh) 1 Pacific Avenue/Front Street One-way Stop 12.5 B 2 Pacific Avenue/Laurel Street Signal 10.3 B 3 Front Street/Soquel Avenue Signal 17.7 B 4 Front Street/Laurel Street Signal 25.3 C 5 Broadway/San Lorenzo Boulevard Signal 15.6 B 6 Broadway/Ocean Street Signal 25.2 C 7 Pacific Avenue/Sycamore Street One-way Stop 9.7 A 8 Sycamore Street/Project Driveway Future* NA NA Note: Delay = Overall average intersection delay in seconds for Signalized, or minor street (worst approach) delay for One-way Stop Control intersections; LOS = Level of Service; NA = Not Available Report Traffic Impact Study for the proposed mixed-use development at 555 Pacific Avenue, Santa Cruz, CA Page 8 February 11, 2014
13
14
15 TJKM Transportation Consultants Existing plus Project Conditions This Scenario is identical to the Existing Conditions, but with traffic added to Existing Conditions from the proposed mixed-use development. The project sponsor is proposing to build 94 single room occupancy residential (SRO) units, 2,600 square feet of restaurant land use (on two pads) and 2,455 square feet of retail land use. The proposed building consists of four levels above the ground and a basement level of private parking for the residential units. The first level (i.e., the ground level) consists of restaurants and retail land use as proposed by the project applicant, Barry Swenson Builder. Levels two through four would consist of studio and one-bedroom apartment SRO units. Project Trip Generation The trip generation was estimated based on the City of Santa Cruz trip generation rates that generally utilize data from Trip Generation, published by the Institute of Transportation Engineers (ITE). Table II shows the project trip generation estimates for the proposed development. The proposed project is expected to generate a total of 847 daily trips, including 83 trips (51 inbound and 32 outbound) during the p.m. peak hour. It should be noted that a previously proposed project at the same location was a hotel land use, which was expected to generate 779 daily trips and 48 p.m. peak hour trips. Based on the City staff s recommendation, all of the current proposed project trips were used for the Existing plus Project Conditions traffic analysis. For the Cumulative (General Plan 2030) Conditions, the net difference in p.m. peak hour trips between the current and the previously proposed project were used for traffic impact analysis. Table II: Project Trip Generation Current Proposed Project Land Use (ITE Code) Single Room Occupancy - SRO Units (220) High-Turnover Restaurant (932) Size Weekday Daily Rate Trips Rate PM Peak Hour (between 4 and 6 p.m.) In % Out % In Out Total 94 units ksf Retail (814) ksf Pass-by Trip Reduction (10%) Internal Trip Reduction (5%) Net Total Previously Proposed Project Notes: Hotel (310) 82 Rooms Source: City of Santa Cruz typical generation rates which are based on ITE Trip Generation Manual. Pass-by trip reduction of 10% in addition to 15% already included in City of Santa Cruz trip generation rates; ksf = Thousand square feet Report Traffic Impact Study for the proposed mixed-use development at 555 Pacific Avenue, Santa Cruz, CA Page 11 February 11, 2014
16 TJKM Transportation Consultants Project Trip Distribution and Assignment Trip distribution assumptions for the proposed project were developed based on existing travel patterns, knowledge of the study area and input from the City staff. Traffic from the proposed project is expected to travel to and from the site according to the distribution assumptions shown on Figure 5 and described below: 10 percent will travel to/from the north via Pacific Avenue 10 percent will travel to/from the north via Front Street 20 percent will travel to/from the west via Laurel Street 15 percent will travel to/from the east via Broadway 15 percent will travel to/from the north via Ocean Street 15 percent will travel to/from the east via San Lorenzo Boulevard 15 percent will travel to/from the south via Pacific Avenue Figure 5 also shows the assignment of current proposed project trips to the study intersections. Level of Service Analysis Figure 6 illustrates the Existing plus Project turning movement volumes. The results of the LOS analysis are summarized in Table III and detailed calculations are provided in Appendix D. With the addition of project trips, all the study intersections are expected to continue to operate at acceptable levels of service (LOS C or better). No improvements appear to be necessary at any of the study intersections. Table III: Intersection LOS Existing plus Project Conditions ID Intersection Control 1 Pacific Avenue/Front Street One-way Stop Control Existing Conditions P.M. Peak Hour Average Delay (sec/veh) LOS Existing + Project Conditions P.M. Peak Hour Average Delay LOS (sec/veh) 12.5 B 13.2 C 2 Pacific Avenue/Laurel Street Signal 10.3 B 11.0 B 3 Front Street/Soquel Avenue Signal 17.7 B 17.8 B 4 Front Street/Laurel Street Signal 25.3 C 25.7 C 5 Broadway/San Lorenzo Boulevard Signal 15.6 B 15.6 B 6 Broadway/Ocean Street Signal 25.2 C 25.4 C One-way Stop 7 Pacific Avenue/Sycamore Street 9.7 A 10.1 B Control Sycamore Street/Project One-way Stop 8 NA NA 8.5 A Driveway Control Note: Delay = Overall average intersection delay in seconds for Signalized, or minor street (worst approach) delay for One-way Stop Control intersections; LOS = Level of Service; NA = Not Available Report Traffic Impact Study for the proposed mixed-use development at 555 Pacific Avenue, Santa Cruz, CA Page 12 February 11, 2014
17
18
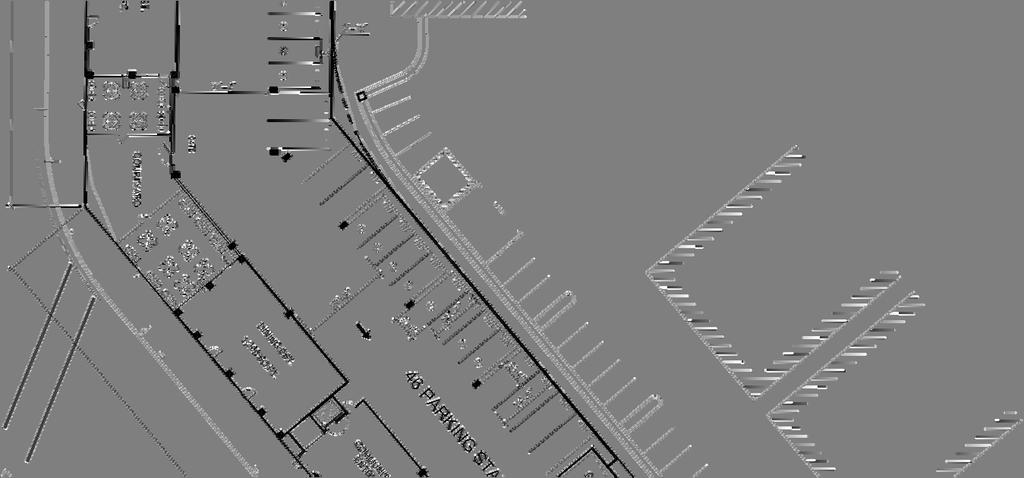
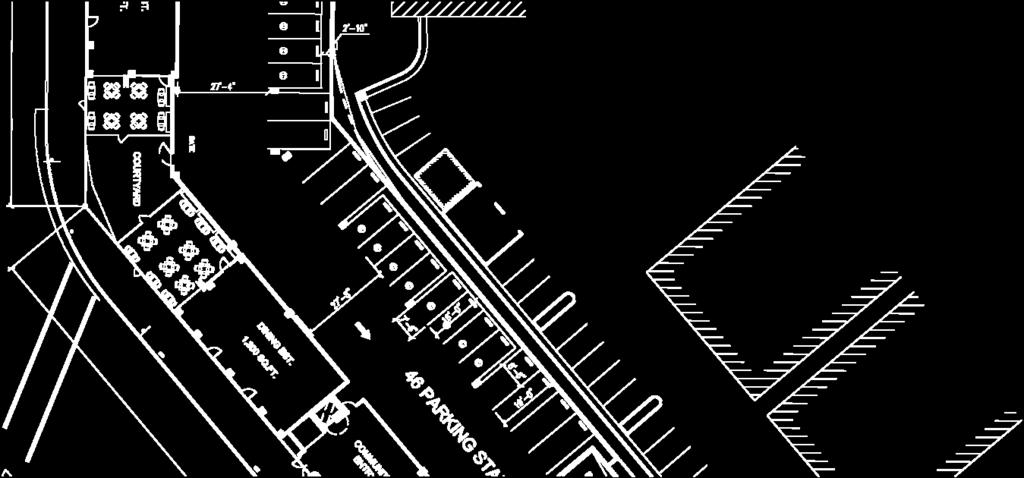
19 TJKM Transportation Consultants Project Access and Internal Circulation The proposed vehicular access to the project site is via a right-in/left-in access (ingress) on Pacific Avenue and an egress only driveway on to Sycamore Street. The parking layout at the ground level and the basement level allows one-way circulation as shown on the project site plan. Considering the peak hour trips, the number of parking spaces and the number of parking levels for the project site, TJKM does not anticipate any access issues such as vehicle delay and/or queuing. Pedestrian access to the site will be via existing sidewalks along the project frontage. Based on review of the proposed site plan, TJKM recommends stop sign control and pavement markings on the upward ramp from the basement level where it intersects the ground level egress driveway, and on the egress driveway itself where it intersects Sycamore Street, to improve turn safety at the project site. To improve the pedestrian safety at the parking exit on Sycamore Street, TJKM recommends installation of CAUTION VEHICLE EXITING LED display sign to warn pedestrians of approaching vehicles. It is also recommended to install a reflective speed bump at the exit to slow down the exiting vehicles and install an illuminated sign WATCH FOR PEDESTRIANS at the egress location. In addition, a convex mirror should be considered at the egress to address line of sight issue. As per AASHTO guidelines, a minimum design turning radius for a passenger car is 24 feet and the site plan shows a turn radius of a minimum 24 feet at every turn path within the parking lot at both the ground and basement levels. In addition, the entry and exit turn radii also meets the basic turn requirements for a passenger car. Based on the information provided by the project applicant, the delivery trucks to the project site are expected to use street level curbside zone as the vertical clearance to the parking lot entrance is approximately 11 feet. Parking Requirements The project applicant currently proposes 46 public use parking spaces (ground level) generally meant for the patrons of commercial/retail land uses and 83 private parking spaces (basement level) for the residential land use, for a total inventory of 129 on-site parking spaces available within the project development. Table IV provides a summary of the City of Santa Cruz parking requirements as established per municipal code. The City municipal code requires a minimum of 125 parking spaces and the project applicant proposes a combined total of 129 off-street parking spaces. Table IV: Summary of Parking Requirements Land Use Type Single Room Occupancy (SRO) Units square feet or more Project Size Unit City of Santa Cruz Parking Requirement City Required Parking Spaces 94 d.u. 1.0 per d.u. 94 Restaurant 2,600 sq. ft. 1 per 120 sq. ft. 22 Retail 2,455 sq. ft. 1 per 250 sq. ft 10 Total required per municipal code 125 Total proposed by the project applicant 129 Notes: d.u. = dwelling units; sq. ft. = square feet Source: The City also requires that any new development provide bike racks that would potentially reduce the peak hour trips as part of its Transportation Demand Management (TDM) program. Based on the City s municipal code requirement, a minimum of seven (= % of auto parking requirement) Report Traffic Impact Study for the proposed mixed-use development at 555 Pacific Avenue, Page 15 Santa Cruz, CA February 11, 2014
20 TJKM Transportation Consultants bike parking spaces for the retail portion and 94 bike parking spaces for the residential portion, a total of 101 spaces are required at the project site. The project applicant plans to provide 113 bike parking spaces within the project site. Report Traffic Impact Study for the proposed mixed-use development at 555 Pacific Avenue, Santa Cruz, CA Page 16 February 11, 2014
21 TJKM Transportation Consultants Cumulative (General Plan 2030) with Project Conditions The traffic forecasts for the Cumulative Conditions were developed by modeling the traffic generated by approved and pending developments in the City of Santa Cruz, and planned growth at the University of California Santa Cruz (UCSC) campus. The Cumulative projects would generate approximately 11,550 trips during the weekday p.m. peak hour. Cumulative with Project traffic volumes are the sum of Cumulative Conditions (baseline) turning movement volume as provided by the City staff for the study intersections and the net increase in peak hour trips (current versus previously proposed land use) at the project site. Level of Service Analysis Figure 7 illustrates the Cumulative Conditions with the Project turning movement volumes. The results of the LOS analysis are summarized in Table V and detailed calculations are provided in Appendix E. Under Cumulative with Project Conditions, all study intersections are expected to continue to operate at acceptable level of service conditions. Table V: Intersection LOS Cumulative (General Plan 2030) with Project Conditions P.M. Peak Hour ID Intersection Control Average Delay LOS (sec/veh) One-way Stop 1 Pacific Avenue/Front Street 15.8 C Control 2 Pacific Avenue/Laurel Street Signal 15.9 B 3 Front Street/Soquel Avenue Signal 21.9 C 4 Front Street/Laurel Street Signal 25.2 C 5 Broadway/San Lorenzo Boulevard Signal 15.9 B 6 Broadway/Ocean Street Signal 40.2 D 7 8 Note: Pacific Avenue/Sycamore Street Sycamore Street/Project Driveway One-way Stop Control 10.1 B Future* 8.5 A Delay = Overall average intersection delay in seconds for Signalized, or minor street (worst approach) delay for One-way Stop Control intersections; LOS = Level of Service At the intersection of Pacific Avenue/Front Street, TJKM recommends that the City should consider striping the southbound approach to provide a separate southbound left-turn and rightturn lanes. TJKM also recommends re-designing this acute angled intersection with right angular approaches to shorten the pedestrian crosswalks and thereby reducing the walk time. It should be noted that, even with an approximate increase of 17% in traffic volume on Pacific Avenue under Cumulative Conditions from the baseline Existing Conditions, the minor street stop control delay at Sycamore Street remains at 10.1 seconds/vehicle during the p.m. peak hour. Report Traffic Impact Study for the proposed mixed-use development at 555 Pacific Avenue, Santa Cruz, CA Page 17 February 11, 2014
22
23 TJKM Transportation Consultants Conclusions TJKM has reached the following conclusions regarding the mixed-use development at 555 Pacific Avenue in the City of Santa Cruz: The proposed project is expected to generate 847 weekday daily trips, including 83 trips (51 inbound and 32 outbound) during the weekday p.m. peak hour. All study intersections are expected to operate at an acceptable level of service of LOS C or better under Existing and Existing plus Project Conditions. Under future Cumulative with Project Conditions, all study intersections are expected to continue to operate at acceptable level of service conditions. Under Cumulative Conditions, at the intersection of Pacific Avenue/Front Street, TJKM recommends that the City should consider striping the southbound approach to provide a separate southbound left-turn and right-turn lanes. TJKM also recommends re-designing this acute angled intersection with right angular approaches to shorten the pedestrian crosswalks and thereby reducing the walk time. TJKM recommends stop sign control and pavement markings on the upward ramp from the basement level where it intersects the ground level egress driveway, and on the egress driveway itself where it intersects Sycamore Street, to improve turn safety at the project site. To improve the pedestrian safety at the parking exit on Sycamore Street, TJKM recommends installation of CAUTION VEHICLE EXITING LED display sign to warn pedestrians of approaching vehicles. It is also recommended to install a reflective speed bump at the exit to slow down the vehicles and install an illuminated sign WATCH FOR PEDESTRIANS at the parking egress. In addition, a convex mirror should be considered at the egress to address line of sight issue. Report Traffic Impact Study for the proposed mixed-use development at 555 Pacific Avenue, Santa Cruz, CA Page 19 February 11, 2014
24 TJKM Transportation Consultants Study Participants and References TJKM Personnel Rich Haygood, P.E., T.E. Vishnu Gandluru Prashanth Dullu Kim Goodrich Project Manager Project Engineer Graphic Designer Word Processor Others Christophe Schneiter, P.E. Ron Marquez, P.E. Jon Lee Adam Mayberry City Engineer, City of Santa Cruz Marquez Transportation Engineering, Aptos, California Barry Swenson Builder Barry Swenson Builder References City of Santa Cruz, Transportation Impact Study Guidelines, May 1, 2009 ITE Trip Generation, 9 th Edition, 2012 San Diego Association of Governments (SANDAG) Trip Generation Manual, 2008 Traffic Level of Service Analysis Guidelines: Congestion Management Program, Santa Clara Valley Transportation Authority, 2003 Report Traffic Impact Study for the proposed mixed-use development at 555 Pacific Avenue, Santa Cruz, CA Page 20 February 11, 2014
25 TJKM Transportation Consultants Appendix A Level of Service Analysis Methodology
26 DESCRIPTION OF SIGNALIZED INTERSECTION CAPACITY ANALYSIS Updated 2000 HCM METHOD Background The operations method of intersection capacity analysis found in Chapter 16, Signalized Intersections, of the Highway Capacity Manual 2000, Transportation Research Board, was used for this study. This method is used in most analyses of existing conditions or of future situations in which traffic, geometric, and control parameters were well established by projections and trial designs. This method addresses the capacity and level of service of intersection approaches, and the level of service of the intersection as a whole. In this method, capacity and level of service are evaluated separately, and are not related to each other in a simple one-to-one fashion. Capacity is evaluated in terms of the ratio of demand flow rate to capacity (volume-to-capacity ratio), while level of service is evaluated on the basis of control delay per vehicle (sec/veh). The capacity of the intersection as a whole is not addressed by this method; the design and signalization of intersections focuses on the accommodation of the major movements and approaches comprising the intersection. Capacity is, therefore, only meaningful as applied to these major movements and approaches. Capacity analysis results in the computation of volumeto-capacity ratios for individual movements and a composite volume-to-capacity ratio for the sum of critical movements or lane groups within the intersection. The volume-to-capacity ratio is the actual or projected rate of flow on an approach or designated group of lanes during a peak 15- minute interval divided by the capacity of the approach or designated group of lanes. Level of Service Level of service is based on the control delay per vehicle for various movements within the intersection. While volume-to-capacity affects delay, there are other parameters that more strongly affect it, such as the quality of progression, length of green phases, cycle lengths, and others. Thus for any given volume-to-capacity ratio, a range of delay values my result, and viceversa. See the table Level of Service Criteria for Signalized Intersections for the relationship between the level of service and stopped delay per vehicle. Because delay is a complex measure, its relationship to capacity is also complex. It is possible, for example, to have delays in the range of Level of Service F while the volume-to-capacity ratios is below 1.00, perhaps as slow as Very high delays can occur at such volume-tocapacity ratios when some combination of the following conditions exists: the cycle length is long; the lane group in question has a long red time; and/or the signal progression for the subject movement is poor. The reverse is also possible. A saturated approach or lane group with a volume-to-capacity equal to 1.00 may have low delays if the cycle length is short, and/or the signal progression is favorable for the subject movement. Acceptable delay levels do not automatically ensure that capacity is sufficient. The analysis must consider the results of the capacity analysis module and the level of service module to obtain a complete picture of existing or projected intersection operations. c:\tjkm\templates\appendices-pleasanton office\sign. method 2000.doc 07/17/02
27 Thus, the designation of Level of Service does not automatically imply that the intersection, approach, or lane group is overloaded, nor does a level of service in the A to E range automatically imply that there is unused capacity available. The procedures of this methodology require the analysis of both capacity and level of service conditions to fully evaluate the operation of a signalized intersection. Input Data The input data necessary to use this methodology are: Lane geometrics Traffic volumes Signal timing Vehicle type distribution Percent grade Pedestrians Peak hour factors Parking activity Arrival type per approach Reference: Highway Capacity Manual, Special Report No. 209, Transportation Research Board, c:\tjkm\templates\appendices-pleasanton office\sign. method 2000.doc 07/17/02
28 Table A-1: Level of Service Criteria for Signalized Intersections Level of Service Type of Flow Delay Maneuverability A B Stable Flow Stable Flow Very slight delay. Progression is very favorable, with most vehicles arriving during the green phase and not stopping at all. Good progression and/or short cycle lengths. More vehicles stop than for LOS A, causing higher levels of average delay. C Stable Flow Higher delays resulting from fair progression and/or longer cycle lengths. Individual cycle failures may begin to appear at this level. The number of vehicles stopping is significant, although many still pass through the intersection without stopping. D Approaching Unstable Flow The influence of congestion becomes more noticeable. Longer delays may result in some combination of unfavorable progression, long cycle lengths, or high volume-to-capacity ratios. Many vehicles stop, and the proportion of vehicles not stopping declines. Individual cycle failures are noticeable. E Unstable Flow Generally considered to be the limit of acceptable delay. Indicative of poor progression, long cycle lengths, and high volume-to-capacity ratios. Individual cycle failures are frequent occurrences. F Forced Flow Generally considered to be unacceptable to most drivers. Often occurs with oversaturation. May also occur at high volume-to-capacity ratios. There are many individual cycle failures. Poor progression and long cycle lengths may also be major contributing factors. Turning movements are easily made, and nearly all drivers find freedom of operation. Vehicle platoons are formed. Many drivers begin to feel somewhat restricted within groups of vehicles. Back-ups may develop behind turning vehicles. Most drivers feel somewhat restricted. Maneuverability is severely limited during short periods due to temporary back ups. There are typically long queues of vehicles waiting upstream of the intersection. Jammed conditions. Back ups from other locations restrict or prevent movement. Volumes may vary widely, depending principally on the downstream back-up conditions. Control Delay/ Vehicle (s/veh) < 10.0 > > > > > 80 References: Highway Capacity Manual, Special Report No. 209, Transportation Research Board, Highway Capacity Manual, Special Report No. 87, Highway Research Board, TJKM. c:\tjkm\templates\appendices-pleasanton office\los criteria 2000.doc 07/17/02
29 DESCRIPTION OF INTERSECTION CAPACITY ANALYSIS UNSIGNALIZED 2000 METHOD Background The method of unsignalized intersection capacity analysis used in this study is from Chapter 17, Unsignalized Intersections of the Highway Capacity Manual, Special report No. 209, Transportation Research Board, updated October This method applies to two-way STOP sign or YIELD sign controlled intersections (or one-way STOP sign or YIELD sign controlled intersections at three-way intersections). At such intersections, drivers on the minor street are forced to use judgement when selecting gaps in the major flow through which to execute crossings or turning maneuvers. Thus, the capacity of the controlled legs of an intersection is based on three factors: 1. The distribution of gaps in the major street traffic stream. 2. Driver judgement in selecting gaps through which to execute their desired maneuvers. 3. Follow-up time required to move into the front-of-queue position. It is assumed that gaps in the traffic stream are randomly distributed. For this reason, the methodology will be less reliable in situations in which the conflicting flows are strongly platooned, as would be the case at many urban intersections where the major street is part of a signalized network. This method assumes that major street traffic is not affected by minor street flows. This assumption is generally good for periods when the operation is smooth and uncongested. (When congestion occurs, it is likely that major street traffic will experience some impedance due to minor street traffic.) Left turns from the major street are assumed to be affected by the opposing major street flow, and minor street traffic is affected by all conflicting movements. Input Data The general procedure to calculate the level of service is as follows: 1. Define existing geometric and volume conditions for the intersection under study. 2. Determine the conflicting traffic through which each minor street movement and the major street left-turn must cross. 3. Determine the size of the gap in the conflicting traffic stream needed by vehicles in each movement crossing the conflicting traffic stream. 4. Determine the capacity of the gaps in the major traffic stream to accommodate each of the subject movements that will utilize these gaps. 5. Adjust the capacities found to account for impedance and the use of shared lanes. 6. Estimate the average total delay for each of the subject movements and determine the level of service for each movement and for the intersection. Gaps are utilized by vehicles in the following priority order: c:\tjkm\templates\appendices-pleasanton office\unsig. method 2000.doc 07/17/2002
30 1. Right turns from the minor street 2. Left turns from the major street 3. Through movements from the minor street 4. Left turns from the minor street For example, if a left-turning vehicle on the major street and a through vehicle from the minor street are waiting to cross the major traffic stream, the first available gap of acceptable size would be taken by the left-turning vehicle. The minor street through vehicle must wait for the second available gap. In aggregate terms, a large number of such left-turning vehicles could use up so many of the available gaps that minor street through vehicles are severely impeded or unable to make safe crossing movements. Level of Service See the following table Level of Service Criteria for Unsignalized Intersections for the relationship between delay and level of service. LEVEL OF SERVICE CRITERIA FOR UNSIGNALIZED ITNERSECTIONS Control Delay (s/veh) Level of Service Delays 0-10 A Little or no delay > s/veh B Short traffic delays > s/veh C Average traffic delays > s/veh D Long traffic delays >35-50 s/veh E Very long traffic delays > 50 s/veh F Extreme traffic delay The level of service criteria for Two-Way STOP controlled intersections is somewhat different from the criteria used in Chapter 16 for signalized intersections. The primary reason for this is the difference that drivers expect a signalized intersection to carry higher traffic volumes than unsignalized intersections. Additionally, several driver behavior conditions combine to make delays at signalized intersections less onerous than at unsignalized intersections. Reference: Highway Capacity Manual, Special Report 209, Transportation Research Board, Update October c:\tjkm\templates\appendices-pleasanton office\unsig. method 2000.doc 07/17/2002
31 TJKM Transportation Consultants Appendix B Raw Traffic Data and Study Area Transit Maps
32 I N T E R S E C T I O N T U R N I N G M O V E M E N T S U M M A R Y PROJECT: PM TRAFFIC COUNTS IN SANTA CRUZ SURVEY DATE: 11/13/2012 DAY: TUESDAY N-S APPROACH: PACIFIC AVENUE SURVEY TIME: 4:00 PM TO 6:00 PM E-W APPROACH: FRONT STREET JURISDICTION: SANTA CRUZ FILE: PEAK HOUR ARRIVAL / DEPARTURE VOLUMES 4:45 PM to 5:45 PM PACIFIC AVENUE NORTH PHF = PHF = PACIFIC AVENUE PHF = FRONT STREET PHF = #DIV/0! TIME PERIOD NORTHBOUND SOUTHBOUND PACIFIC AV FRONT ST WESTBOUND TOTAL From To U-TURN LEFT THRU RIGHT U-TURN LEFT THRU RIGHT LEFT THRU LEFT THRU U-TURN LEFT THRU RIGHT S U R V E Y D A T A 4:00 PM to 4:15 PM :15 PM to 4:30 PM :30 PM to 4:45 PM :45 PM to 5:00 PM :00 PM to 5:15 PM :15 PM to 5:30 PM :30 PM to 5:45 PM :45 PM to 6:00 PM T O T A L B Y P E R I O D 4:00 PM to 4:15 PM :15 PM to 4:30 PM :30 PM to 4:45 PM :45 PM to 5:00 PM :00 PM to 5:15 PM :15 PM to 5:30 PM :30 PM to 5:45 PM :45 PM to 6:00 PM H O U R L Y T O T A L S 4:00 PM to 5:00 PM :15 PM to 5:15 PM :30 PM to 5:30 PM :45 PM to 5:45 PM :00 PM to 6:00 PM TEL: (510) FAX: (510) SYNCHRO CVS FILE FORMAT NBU NBL NBT NBR SBU SBL SBT SBR EBU EBL EBT EBR WBU WBL WBT WBR TOTAL VOLUME PEDESTRIAN BICYCLE PHF BY MOVEMENT #DIV/0! #DIV/0! #DIV/0! #DIV/0! #DIV/0! 0.33 #DIV/0! #DIV/0! #DIV/0! OVERALL PHF BY APPROACH #DIV/0!
33 B I C Y C L E M O V E M E N T S U M M A R Y PROJECT: PM TRAFFIC COUNTS IN SANTA CRUZ SURVEY DATE: 11/13/2012 DAY: TUESDAY N-S APPROACH: PACIFIC AVENUE SURVEY TIME: 4:00 PM TO 6:00 PM E-W APPROACHFRONT STREET JURISDICTION: SANTA CRUZ FILE: PEAK HOUR ARRIVAL / DEPARTURE VOLUMES 4:45 PM TO 5:45 PM PACIFIC AVENUE NORTH N-LEG TOTAL NORTH - LEG WEST - LEG EAST - LEG E-LEG TOTAL W-LEG TOTAL FRONT STREET 52 TIME PERIOD SOUTH - LEG S-LEG TOTAL 0 NB (SOUTH - LEG) SB (NORTH - LEG) EB (WEST - LEG) WB (EAST - LEG) TOTAL From To LEFT THRU RIGHT LEFT THRU RIGHT LEFT THRU RIGHT LEFT THRU RIGHT S U R V E Y D A T A 4:00 PM to 4:15 PM :15 PM to 4:30 PM :30 PM to 4:45 PM :45 PM to 5:00 PM :00 PM to 5:15 PM :15 PM to 5:30 PM :30 PM to 5:45 PM :45 PM to 6:00 PM T O T A L B Y P E R I O D 4:00 PM to 4:15 PM :15 PM to 4:30 PM :30 PM to 4:45 PM :45 PM to 5:00 PM :00 PM to 5:15 PM :15 PM to 5:30 PM :30 PM to 5:45 PM :45 PM to 6:00 PM H O U R L Y T O T A L S 4:00 PM to 5:00 PM :15 PM to 5:15 PM :30 PM to 5:30 PM :45 PM to 5:45 PM :00 PM to 6:00 PM TEL: (510) FAX: (510) BICYCLE NBT SBT EBT WBT TOTAL
34 P E D E S T R I A N M O V E M E N T S U M M A R Y PROJECT: PM TRAFFIC COUNTS IN SANTA CRUZ SURVEY DATE: 11/13/2012 N-S APPROACH: PACIFIC AVENUE DAY: TUESDAY E-W APPROACH: FRONT STREET JURISDICTION: SANTA CRUZ SURVEY PERIOD 4:00 PM TO 6:00 PM FILE: PEAK HOUR PEAK HOUR 04:45 PM TO 05:45 PM TOTAL PEDESTRIAN VOLUMES 24 N-LEG B 10 A&B A 6 W-LEG G&H 0 H C G D FRONT STREET C&D 0 E 0 E-LEG 0 F E&F S-LEG PACIFIC AVENUE TIME PERIOD NORTH X-WALK EAST X-WALK SOUTH X-WALK WEST X-WALK From To A B C D E F G H TOTAL S U R V E Y D A T A 04:00 PM :15 PM :15 PM :30 PM :30 PM :45 PM :45 PM :00 PM :00 PM :15 PM :15 PM :30 PM :30 PM :45 PM :45 PM :00 PM T O T A L B Y P E R I O D 04:00 PM :15 PM :15 PM :30 PM :30 PM :45 PM :45 PM :00 PM :00 PM :15 PM :15 PM :30 PM :30 PM :45 PM :45 PM :00 PM H O U R L Y T O T A L S 04:00 PM :00 PM :15 PM :15 PM :30 PM :30 PM :45 PM :45 PM :00 PM :00 PM Tel : (510) Fax: (510) PEDESTRIAN N-LEG S-LEG E-LEG W-LEG TOTAL
35 B. A. Y. M. E. T. R. I. C. S. I N T E R S E C T I O N T U R N I N G M O V E M E N T S U M M A R Y PROJECT: PM TRAFFIC COUNTS IN SANTA CRUZ SURVEY DATE: 11/13/2012 DAY: TUESDAY N-S APPROACH: PACIFIC AVENUE SURVEY TIME: 4:00 PM TO 6:00 PM E-W APPROACH: LAUREL STREET JURISDICTION: SANTA CRUZ FILE: PEAK HOUR ARRIVAL / DEPARTURE VOLUMES 4:45 PM to 5:45 PM NORTH PHF = PHF = PHF = LAUREL STREET PACIFIC AVENUE PHF = 0.95 TIME PERIOD NORTHBOUND SOUTHBOUND EASTBOUND WESTBOUND TOTAL From To U-TURN LEFT THRU RIGHT U-TURN LEFT THRU RIGHT U-TURN LEFT THRU RIGHT U-TURN LEFT THRU RIGHT S U R V E Y D A T A 4:00 PM to 4:15 PM :15 PM to 4:30 PM :30 PM to 4:45 PM :45 PM to 5:00 PM :00 PM to 5:15 PM :15 PM to 5:30 PM :30 PM to 5:45 PM :45 PM to 6:00 PM T O T A L B Y P E R I O D 4:00 PM to 4:15 PM :15 PM to 4:30 PM :30 PM to 4:45 PM :45 PM to 5:00 PM :00 PM to 5:15 PM :15 PM to 5:30 PM :30 PM to 5:45 PM :45 PM to 6:00 PM H O U R L Y T O T A L S 4:00 PM to 5:00 PM :15 PM to 5:15 PM :30 PM to 5:30 PM :45 PM to 5:45 PM :00 PM to 6:00 PM TEL: (510) FAX: (510) SYNCHRO CVS FILE FORMAT NBU NBL NBT NBR SBU SBL SBT SBR EBU EBL EBT EBR WBU WBL WBT WBR TOTAL VOLUME PEDESTRIAN BICYCLE PHF BY MOVEMENT #DIV/0! #DIV/0! #DIV/0! #DIV/0! OVERALL PHF BY APPROACH
36 B. A. Y. M. E. T. R. I. C. S. B I C Y C L E M O V E M E N T S U M M A R Y PROJECT: PM TRAFFIC COUNTS IN SANTA CRUZ SURVEY DATE: 11/13/2012 DAY: TUESDAY N-S APPROACH: PACIFIC AVENUE SURVEY TIME: 4:00 PM TO 6:00 PM E-W APPROACH:LAUREL STREET JURISDICTION: SANTA CRUZ FILE: PEAK HOUR ARRIVAL / DEPARTURE VOLUMES 4:45 PM TO 5:45 PM NORTH N-LEG TOTAL NORTH - LEG 3 7 WEST - LEG EAST - LEG E-LEG TOTAL W-LEG TOTAL LAUREL STREET 51 SOUTH - LEG S-LEG TOTAL PACIFIC AVENUE 21 TIME PERIOD NB (SOUTH - LEG) SB (NORTH - LEG) EB (WEST - LEG) WB (EAST - LEG) TOTAL From To LEFT THRU RIGHT LEFT THRU RIGHT LEFT THRU RIGHT LEFT THRU RIGHT S U R V E Y D A T A 4:00 PM to 4:15 PM :15 PM to 4:30 PM :30 PM to 4:45 PM :45 PM to 5:00 PM :00 PM to 5:15 PM :15 PM to 5:30 PM :30 PM to 5:45 PM :45 PM to 6:00 PM T O T A L B Y P E R I O D 4:00 PM to 4:15 PM :15 PM to 4:30 PM :30 PM to 4:45 PM :45 PM to 5:00 PM :00 PM to 5:15 PM :15 PM to 5:30 PM :30 PM to 5:45 PM :45 PM to 6:00 PM H O U R L Y T O T A L S 4:00 PM to 5:00 PM :15 PM to 5:15 PM :30 PM to 5:30 PM :45 PM to 5:45 PM :00 PM to 6:00 PM TEL: (510) FAX: (510) BICYCLE NBT SBT EBT WBT TOTAL
37 B. A. Y. M. E. T. R. I. C. S. P E D E S T R I A N M O V E M E N T S U M M A R Y PROJECT: PM TRAFFIC COUNTS IN SANTA CRUZ SURVEY DATE: 11/13/2012 N-S APPROACH: PACIFIC AVENUE DAY: TUESDAY E-W APPROACH: LAUREL STREET JURISDICTION: SANTA CRUZ SURVEY PERIOD: 4:00 PM TO 6:00 PM FILE: PEAK HOUR PEAK HOUR 04:45 PM TO 05:45 PM TOTAL PEDESTRIAN VOLUMES 460 N-LEG B 27 A&B A 41 W-LEG G&H 161 H C G D LAUREL STREET C&D 55 E 121 E-LEG 66 F E&F S-LEG PACIFIC AVENUE TIME PERIOD NORTH X-WALK EAST X-WALK SOUTH X-WALK WEST X-WALK From To A B C D E F G H TOTAL S U R V E Y D A T A 04:00 PM :15 PM :15 PM :30 PM :30 PM :45 PM :45 PM :00 PM :00 PM :15 PM :15 PM :30 PM :30 PM :45 PM ,015 05:45 PM :00 PM ,062 T O T A L B Y P E R I O D 04:00 PM :15 PM :15 PM :30 PM :30 PM :45 PM :45 PM :00 PM :00 PM :15 PM :15 PM :30 PM :30 PM :45 PM :45 PM :00 PM H O U R L Y T O T A L S 04:00 PM :00 PM :15 PM :15 PM :30 PM :30 PM :45 PM :45 PM :00 PM :00 PM Tel : (510) Fax: (510) PEDESTRIAN N-LEG S-LEG E-LEG W-LEG TOTAL
38 B. A. Y. M. E. T. R. I. C. S. I N T E R S E C T I O N T U R N I N G M O V E M E N T S U M M A R Y PROJECT: PM TRAFFIC COUNTS IN SANTA CRUZ SURVEY DATE: 11/13/2012 DAY: TUESDAY N-S APPROACH: FRONT STREET SURVEY TIME: 4:00 PM TO 6:00 PM E-W APPROACH: SOQUEL AVENUE JURISDICTION: SANTA CRUZ FILE: PEAK HOUR ARRIVAL / DEPARTURE VOLUMES 4:00 PM to 5:00 PM NORTH PHF = PHF = PHF = SOQUEL AVENUE FRONT STREET PHF = 0.95 TIME PERIOD NORTHBOUND SOUTHBOUND EASTBOUND WESTBOUND TOTAL From To U-TURN LEFT THRU RIGHT U-TURN LEFT THRU RIGHT U-TURN LEFT THRU RIGHT U-TURN LEFT THRU RIGHT S U R V E Y D A T A 4:00 PM to 4:15 PM :15 PM to 4:30 PM :30 PM to 4:45 PM :45 PM to 5:00 PM :00 PM to 5:15 PM :15 PM to 5:30 PM :30 PM to 5:45 PM :45 PM to 6:00 PM T O T A L B Y P E R I O D 4:00 PM to 4:15 PM :15 PM to 4:30 PM :30 PM to 4:45 PM :45 PM to 5:00 PM :00 PM to 5:15 PM :15 PM to 5:30 PM :30 PM to 5:45 PM :45 PM to 6:00 PM H O U R L Y T O T A L S 4:00 PM to 5:00 PM :15 PM to 5:15 PM :30 PM to 5:30 PM :45 PM to 5:45 PM :00 PM to 6:00 PM TEL: (510) FAX: (510) SYNCHRO CVS FILE FORMAT NBU NBL NBT NBR SBU SBL SBT SBR EBU EBL EBT EBR WBU WBL WBT WBR TOTAL VOLUME PEDESTRIAN BICYCLE PHF BY MOVEMENT #DIV/0! #DIV/0! #DIV/0! #DIV/0! OVERALL PHF BY APPROACH
39 B. A. Y. M. E. T. R. I. C. S. B I C Y C L E M O V E M E N T S U M M A R Y PROJECT: PM TRAFFIC COUNTS IN SANTA CRUZ SURVEY DATE: 11/13/2012 DAY: TUESDAY N-S APPROACH: FRONT STREET SURVEY TIME: 4:00 PM TO 6:00 PM E-W APPROACH:SOQUEL AVENUE JURISDICTION: SANTA CRUZ FILE: PEAK HOUR ARRIVAL / DEPARTURE VOLUMES 4:00 PM TO 5:00 PM NORTH N-LEG TOTAL NORTH - LEG WEST - LEG EAST - LEG E-LEG TOTAL W-LEG TOTAL SOQUEL AVENUE 42 SOUTH - LEG S-LEG TOTAL FRONT STREET 39 TIME PERIOD NB (SOUTH - LEG) SB (NORTH - LEG) EB (WEST - LEG) WB (EAST - LEG) TOTAL From To LEFT THRU RIGHT LEFT THRU RIGHT LEFT THRU RIGHT LEFT THRU RIGHT S U R V E Y D A T A 4:00 PM to 4:15 PM :15 PM to 4:30 PM :30 PM to 4:45 PM :45 PM to 5:00 PM :00 PM to 5:15 PM :15 PM to 5:30 PM :30 PM to 5:45 PM :45 PM to 6:00 PM T O T A L B Y P E R I O D 4:00 PM to 4:15 PM :15 PM to 4:30 PM :30 PM to 4:45 PM :45 PM to 5:00 PM :00 PM to 5:15 PM :15 PM to 5:30 PM :30 PM to 5:45 PM :45 PM to 6:00 PM H O U R L Y T O T A L S 4:00 PM to 5:00 PM :15 PM to 5:15 PM :30 PM to 5:30 PM :45 PM to 5:45 PM :00 PM to 6:00 PM TEL: (510) FAX: (510) BICYCLE NBT SBT EBT WBT TOTAL
40 B. A. Y. M. E. T. R. I. C. S. P E D E S T R I A N M O V E M E N T S U M M A R Y PROJECT: PM TRAFFIC COUNTS IN SANTA CRUZ SURVEY DATE: 11/13/2012 N-S APPROACH: FRONT STREET DAY: TUESDAY E-W APPROACH: SOQUEL AVENUE JURISDICTION: SANTA CRUZ SURVEY PERIOD: 4:00 PM TO 6:00 PM FILE: PEAK HOUR PEAK HOUR 04:00 PM TO 05:00 PM TOTAL PEDESTRIAN VOLUMES 350 N-LEG B 50 A&B A 53 W-LEG G&H 62 H C G D SOQUEL AVENUE C&D 37 E 102 E-LEG 65 F E&F S-LEG FRONT STREET TIME PERIOD NORTH X-WALK EAST X-WALK SOUTH X-WALK WEST X-WALK From To A B C D E F G H TOTAL S U R V E Y D A T A 04:00 PM :15 PM :15 PM :30 PM :30 PM :45 PM :45 PM :00 PM :00 PM :15 PM :15 PM :30 PM :30 PM :45 PM :45 PM :00 PM T O T A L B Y P E R I O D 04:00 PM :15 PM :15 PM :30 PM :30 PM :45 PM :45 PM :00 PM :00 PM :15 PM :15 PM :30 PM :30 PM :45 PM :45 PM :00 PM H O U R L Y T O T A L S 04:00 PM :00 PM :15 PM :15 PM :30 PM :30 PM :45 PM :45 PM :00 PM :00 PM Tel : (510) Fax: (510) PEDESTRIAN N-LEG S-LEG E-LEG W-LEG TOTAL
41 B. A. Y. M. E. T. R. I. C. S. I N T E R S E C T I O N T U R N I N G M O V E M E N T S U M M A R Y PROJECT: PM TRAFFIC COUNTS IN SANTA CRUZ SURVEY DATE: 11/13/2012 DAY: TUESDAY N-S APPROACH: FRONT STREET SURVEY TIME: 4:00 PM TO 6:00 PM E-W APPROACH: LAUREL STREET JURISDICTION: SANTA CRUZ FILE: PEAK HOUR ARRIVAL / DEPARTURE VOLUMES 4:45 PM to 5:45 PM NORTH PHF = PHF = PHF = LAUREL STREET FRONT STREET PHF = 0.94 TIME PERIOD NORTHBOUND SOUTHBOUND EASTBOUND WESTBOUND TOTAL From To U-TURN LEFT THRU RIGHT U-TURN LEFT THRU RIGHT U-TURN LEFT THRU RIGHT U-TURN LEFT THRU RIGHT S U R V E Y D A T A 4:00 PM to 4:15 PM :15 PM to 4:30 PM :30 PM to 4:45 PM :45 PM to 5:00 PM :00 PM to 5:15 PM :15 PM to 5:30 PM :30 PM to 5:45 PM :45 PM to 6:00 PM T O T A L B Y P E R I O D 4:00 PM to 4:15 PM :15 PM to 4:30 PM :30 PM to 4:45 PM :45 PM to 5:00 PM :00 PM to 5:15 PM :15 PM to 5:30 PM :30 PM to 5:45 PM :45 PM to 6:00 PM H O U R L Y T O T A L S 4:00 PM to 5:00 PM :15 PM to 5:15 PM :30 PM to 5:30 PM :45 PM to 5:45 PM :00 PM to 6:00 PM TEL: (510) FAX: (510) SYNCHRO CVS FILE FORMAT NBU NBL NBT NBR SBU SBL SBT SBR EBU EBL EBT EBR WBU WBL WBT WBR TOTAL VOLUME PEDESTRIAN BICYCLE PHF BY MOVEMENT #DIV/0! #DIV/0! #DIV/0! #DIV/0! OVERALL PHF BY APPROACH
42 B. A. Y. M. E. T. R. I. C. S. B I C Y C L E M O V E M E N T S U M M A R Y PROJECT: PM TRAFFIC COUNTS IN SANTA CRUZ SURVEY DATE: 11/13/2012 DAY: TUESDAY N-S APPROACH: FRONT STREET SURVEY TIME: 4:00 PM TO 6:00 PM E-W APPROACH:LAUREL STREET JURISDICTION: SANTA CRUZ FILE: PEAK HOUR ARRIVAL / DEPARTURE VOLUMES 4:45 PM TO 5:45 PM NORTH N-LEG TOTAL NORTH - LEG WEST - LEG EAST - LEG E-LEG TOTAL W-LEG TOTAL LAUREL STREET 49 SOUTH - LEG S-LEG TOTAL FRONT STREET 51 TIME PERIOD NB (SOUTH - LEG) SB (NORTH - LEG) EB (WEST - LEG) WB (EAST - LEG) TOTAL From To LEFT THRU RIGHT LEFT THRU RIGHT LEFT THRU RIGHT LEFT THRU RIGHT S U R V E Y D A T A 4:00 PM to 4:15 PM :15 PM to 4:30 PM :30 PM to 4:45 PM :45 PM to 5:00 PM :00 PM to 5:15 PM :15 PM to 5:30 PM :30 PM to 5:45 PM :45 PM to 6:00 PM T O T A L B Y P E R I O D 4:00 PM to 4:15 PM :15 PM to 4:30 PM :30 PM to 4:45 PM :45 PM to 5:00 PM :00 PM to 5:15 PM :15 PM to 5:30 PM :30 PM to 5:45 PM :45 PM to 6:00 PM H O U R L Y T O T A L S 4:00 PM to 5:00 PM :15 PM to 5:15 PM :30 PM to 5:30 PM :45 PM to 5:45 PM :00 PM to 6:00 PM TEL: (510) FAX: (510) BICYCLE NBT SBT EBT WBT TOTAL
43 B. A. Y. M. E. T. R. I. C. S. P E D E S T R I A N M O V E M E N T S U M M A R Y PROJECT: PM TRAFFIC COUNTS IN SANTA CRUZ SURVEY DATE: 11/13/2012 N-S APPROACH: FRONT STREET DAY: TUESDAY E-W APPROACH: LAUREL STREET JURISDICTION: SANTA CRUZ SURVEY PERIOD: 4:00 PM TO 6:00 PM FILE: PEAK HOUR PEAK HOUR 04:45 PM TO 05:45 PM TOTAL PEDESTRIAN VOLUMES 243 N-LEG B 21 A&B A 15 W-LEG G&H 50 H C G D LAUREL STREET C&D 56 E 122 E-LEG 66 F E&F S-LEG FRONT STREET TIME PERIOD NORTH X-WALK EAST X-WALK SOUTH X-WALK WEST X-WALK From To A B C D E F G H TOTAL S U R V E Y D A T A 04:00 PM :15 PM :15 PM :30 PM :30 PM :45 PM :45 PM :00 PM :00 PM :15 PM :15 PM :30 PM :30 PM :45 PM :45 PM :00 PM T O T A L B Y P E R I O D 04:00 PM :15 PM :15 PM :30 PM :30 PM :45 PM :45 PM :00 PM :00 PM :15 PM :15 PM :30 PM :30 PM :45 PM :45 PM :00 PM H O U R L Y T O T A L S 04:00 PM :00 PM :15 PM :15 PM :30 PM :30 PM :45 PM :45 PM :00 PM :00 PM Tel : (510) Fax: (510) PEDESTRIAN N-LEG S-LEG E-LEG W-LEG TOTAL
44 B. A. Y. M. E. T. R. I. C. S. I N T E R S E C T I O N T U R N I N G M O V E M E N T S U M M A R Y PROJECT: PM TRAFFIC COUNTS IN SANTA CRUZ SURVEY DATE: 11/13/2012 DAY: TUESDAY N-S APPROACH: SAN LORENZO BOULEVARD - BROADWAY SURVEY TIME: 4:00 PM TO 6:00 PM E-W APPROACH: BROADWAY JURISDICTION: SANTA CRUZ FILE: PEAK HOUR ARRIVAL / DEPARTURE VOLUMES 4:45 PM to 5:45 PM BROADWAY NORTH PHF = PHF = #DIV/0! PHF = BROADWAY SAN LORENZO BOULEVARD PHF = 0.89 TIME PERIOD NORTHBOUND SOUTHBOUND EASTBOUND WESTBOUND TOTAL From To U-TURN LEFT THRU RIGHT U-TURN LEFT THRU RIGHT U-TURN LEFT THRU RIGHT U-TURN LEFT THRU RIGHT S U R V E Y D A T A 4:00 PM to 4:15 PM :15 PM to 4:30 PM :30 PM to 4:45 PM :45 PM to 5:00 PM :00 PM to 5:15 PM :15 PM to 5:30 PM :30 PM to 5:45 PM :45 PM to 6:00 PM T O T A L B Y P E R I O D 4:00 PM to 4:15 PM :15 PM to 4:30 PM :30 PM to 4:45 PM :45 PM to 5:00 PM :00 PM to 5:15 PM :15 PM to 5:30 PM :30 PM to 5:45 PM :45 PM to 6:00 PM H O U R L Y T O T A L S 4:00 PM to 5:00 PM :15 PM to 5:15 PM :30 PM to 5:30 PM :45 PM to 5:45 PM :00 PM to 6:00 PM TEL: (510) FAX: (510) SYNCHRO CVS FILE FORMAT NBU NBL NBT NBR SBU SBL SBT SBR EBU EBL EBT EBR WBU WBL WBT WBR TOTAL VOLUME PEDESTRIAN BICYCLE PHF BY MOVEMENT #DIV/0! #DIV/0! #DIV/0! #DIV/0! #DIV/0! 0.83 #DIV/0! 0.94 #DIV/0! 0.95 #DIV/0! #DIV/0! #DIV/0! #DIV/0! OVERALL PHF BY APPROACH #DIV/0! 0.95
45 B. A. Y. M. E. T. R. I. C. S. B I C Y C L E M O V E M E N T S U M M A R Y PROJECT: PM TRAFFIC COUNTS IN SANTA CRUZ SURVEY DATE: 11/13/2012 DAY: TUESDAY N-S APPROACH: SAN LORENZO BOULEVARD - BROADWAY SURVEY TIME: 4:00 PM TO 6:00 PM E-W APPROACH:BROADWAY JURISDICTION: SANTA CRUZ FILE: PEAK HOUR ARRIVAL / DEPARTURE VOLUMES 4:45 PM TO 5:45 PM BROADWAY NORTH N-LEG TOTAL NORTH - LEG 9 32 WEST - LEG EAST - LEG E-LEG TOTAL W-LEG TOTAL BROADWAY 53 SOUTH - LEG S-LEG TOTAL SAN LORENZO BOULEVARD 28 TIME PERIOD NB (SOUTH - LEG) SB (NORTH - LEG) EB (WEST - LEG) WB (EAST - LEG) TOTAL From To LEFT THRU RIGHT LEFT THRU RIGHT LEFT THRU RIGHT LEFT THRU RIGHT S U R V E Y D A T A 4:00 PM to 4:15 PM :15 PM to 4:30 PM :30 PM to 4:45 PM :45 PM to 5:00 PM :00 PM to 5:15 PM :15 PM to 5:30 PM :30 PM to 5:45 PM :45 PM to 6:00 PM T O T A L B Y P E R I O D 4:00 PM to 4:15 PM :15 PM to 4:30 PM :30 PM to 4:45 PM :45 PM to 5:00 PM :00 PM to 5:15 PM :15 PM to 5:30 PM :30 PM to 5:45 PM :45 PM to 6:00 PM H O U R L Y T O T A L S 4:00 PM to 5:00 PM :15 PM to 5:15 PM :30 PM to 5:30 PM :45 PM to 5:45 PM :00 PM to 6:00 PM TEL: (510) FAX: (510) BICYCLE NBT SBT EBT WBT TOTAL
46 B. A. Y. M. E. T. R. I. C. S. P E D E S T R I A N M O V E M E N T S U M M A R Y PROJECT: PM TRAFFIC COUNTS IN SANTA CRUZ SURVEY DATE: 11/13/2012 N-S APPROACH: SAN LORENZO BOULEVARD - BROADWAY DAY: TUESDAY E-W APPROACH: BROADWAY JURISDICTION: SANTA CRUZ SURVEY PERIOD: 4:00 PM TO 6:00 PM FILE: PEAK HOUR PEAK HOUR 04:45 PM TO 05:45 PM BROADWAY TOTAL PEDESTRIAN VOLUMES 145 BROADWAY B A C A & B A C 19 E C & D 5 D 68 F 24 E & F 29 E F B D SAN LORENZO BOULEVARD TIME PERIOD NORTH X-WALK EAST X-WALK SOUTH X-WALK WEST X-WALK From To A B C D E F G H TOTAL S U R V E Y D A T A 04:00 PM :15 PM :15 PM :30 PM :30 PM :45 PM :45 PM :00 PM :00 PM :15 PM :15 PM :30 PM :30 PM :45 PM :45 PM :00 PM T O T A L B Y P E R I O D 04:00 PM :15 PM :15 PM :30 PM :30 PM :45 PM :45 PM :00 PM :00 PM :15 PM :15 PM :30 PM :30 PM :45 PM :45 PM :00 PM H O U R L Y T O T A L S 04:00 PM :00 PM :15 PM :15 PM :30 PM :30 PM :45 PM :45 PM :00 PM :00 PM Tel : (510) Fax: (510) PEDESTRIAN N-LEG S-LEG E-LEG W-LEG TOTAL
47 B. A. Y. M. E. T. R. I. C. S. I N T E R S E C T I O N T U R N I N G M O V E M E N T S U M M A R Y PROJECT: PM TRAFFIC COUNTS IN SANTA CRUZ SURVEY DATE: 11/13/2012 DAY: TUESDAY N-S APPROACH: OCEAN STREET SURVEY TIME: 4:00 PM TO 6:00 PM E-W APPROACH: BROADWAY JURISDICTION: SANTA CRUZ FILE: PEAK HOUR ARRIVAL / DEPARTURE VOLUMES 4:30 PM to 5:30 PM NORTH PHF = PHF = PHF = BROADWAY OCEAN STREET PHF = 0.97 TIME PERIOD NORTHBOUND SOUTHBOUND EASTBOUND WESTBOUND TOTAL From To U-TURN LEFT THRU RIGHT U-TURN LEFT THRU RIGHT U-TURN LEFT THRU RIGHT U-TURN LEFT THRU RIGHT S U R V E Y D A T A 4:00 PM to 4:15 PM :15 PM to 4:30 PM :30 PM to 4:45 PM :45 PM to 5:00 PM :00 PM to 5:15 PM :15 PM to 5:30 PM :30 PM to 5:45 PM :45 PM to 6:00 PM T O T A L B Y P E R I O D 4:00 PM to 4:15 PM :15 PM to 4:30 PM :30 PM to 4:45 PM :45 PM to 5:00 PM :00 PM to 5:15 PM :15 PM to 5:30 PM :30 PM to 5:45 PM :45 PM to 6:00 PM H O U R L Y T O T A L S 4:00 PM to 5:00 PM :15 PM to 5:15 PM :30 PM to 5:30 PM :45 PM to 5:45 PM :00 PM to 6:00 PM TEL: (510) FAX: (510) SYNCHRO CVS FILE FORMAT NBU NBL NBT NBR SBU SBL SBT SBR EBU EBL EBT EBR WBU WBL WBT WBR TOTAL VOLUME PEDESTRIAN BICYCLE PHF BY MOVEMENT #DIV/0! #DIV/0! #DIV/0! #DIV/0! OVERALL PHF BY APPROACH
48 B. A. Y. M. E. T. R. I. C. S. B I C Y C L E M O V E M E N T S U M M A R Y PROJECT: PM TRAFFIC COUNTS IN SANTA CRUZ SURVEY DATE: 11/13/2012 DAY: TUESDAY N-S APPROACH: OCEAN STREET SURVEY TIME: 4:00 PM TO 6:00 PM E-W APPROACH:BROADWAY JURISDICTION: SANTA CRUZ FILE: PEAK HOUR ARRIVAL / DEPARTURE VOLUMES 4:30 PM TO 5:30 PM NORTH N-LEG TOTAL NORTH - LEG 1 0 WEST - LEG EAST - LEG E-LEG TOTAL W-LEG TOTAL BROADWAY 26 SOUTH - LEG S-LEG TOTAL OCEAN STREET 2 TIME PERIOD NB (SOUTH - LEG) SB (NORTH - LEG) EB (WEST - LEG) WB (EAST - LEG) TOTAL From To LEFT THRU RIGHT LEFT THRU RIGHT LEFT THRU RIGHT LEFT THRU RIGHT S U R V E Y D A T A 4:00 PM to 4:15 PM :15 PM to 4:30 PM :30 PM to 4:45 PM :45 PM to 5:00 PM :00 PM to 5:15 PM :15 PM to 5:30 PM :30 PM to 5:45 PM :45 PM to 6:00 PM T O T A L B Y P E R I O D 4:00 PM to 4:15 PM :15 PM to 4:30 PM :30 PM to 4:45 PM :45 PM to 5:00 PM :00 PM to 5:15 PM :15 PM to 5:30 PM :30 PM to 5:45 PM :45 PM to 6:00 PM H O U R L Y T O T A L S 4:00 PM to 5:00 PM :15 PM to 5:15 PM :30 PM to 5:30 PM :45 PM to 5:45 PM :00 PM to 6:00 PM TEL: (510) FAX: (510) BICYCLE NBT SBT EBT WBT TOTAL
49 B. A. Y. M. E. T. R. I. C. S. P E D E S T R I A N M O V E M E N T S U M M A R Y PROJECT: PM TRAFFIC COUNTS IN SANTA CRUZ SURVEY DATE: 11/13/2012 N-S APPROACH: OCEAN STREET DAY: TUESDAY E-W APPROACH: BROADWAY JURISDICTION: SANTA CRUZ SURVEY PERIOD: 4:00 PM TO 6:00 PM FILE: PEAK HOUR PEAK HOUR 04:30 PM TO 05:30 PM TOTAL PEDESTRIAN VOLUMES 87 N-LEG B 6 A&B A 7 W-LEG G&H 33 H C G D BROADWAY C&D 16 E 25 E-LEG 9 F E&F S-LEG OCEAN STREET TIME PERIOD NORTH X-WALK EAST X-WALK SOUTH X-WALK WEST X-WALK From To A B C D E F G H TOTAL S U R V E Y D A T A 04:00 PM :15 PM :15 PM :30 PM :30 PM :45 PM :45 PM :00 PM :00 PM :15 PM :15 PM :30 PM :30 PM :45 PM :45 PM :00 PM T O T A L B Y P E R I O D 04:00 PM :15 PM :15 PM :30 PM :30 PM :45 PM :45 PM :00 PM :00 PM :15 PM :15 PM :30 PM :30 PM :45 PM :45 PM :00 PM H O U R L Y T O T A L S 04:00 PM :00 PM :15 PM :15 PM :30 PM :30 PM :45 PM :45 PM :00 PM :00 PM Tel : (510) Fax: (510) PEDESTRIAN N-LEG S-LEG E-LEG W-LEG TOTAL
50 B. A. Y. M. E. T. R. I. C. S. I N T E R S E C T I O N T U R N I N G M O V E M E N T S U M M A R Y PROJECT: PM TRAFFIC COUNTS IN SANTA CRUZ SURVEY DATE: 11/13/2012 DAY: TUESDAY N-S APPROACH: PACIFIC AVENUE SURVEY TIME: 4:00 PM TO 6:00 PM E-W APPROACH: SYCAMORE STREET JURISDICTION: SANTA CRUZ FILE: PEAK HOUR ARRIVAL / DEPARTURE VOLUMES 4:45 PM to 5:45 PM NORTH PHF = PHF = #DIV/0! PHF = SYCAMORE STREET PACIFIC AVENUE PHF = 0.86 TIME PERIOD NORTHBOUND SOUTHBOUND EASTBOUND WESTBOUND TOTAL From To U-TURN LEFT THRU RIGHT U-TURN LEFT THRU RIGHT U-TURN LEFT THRU RIGHT U-TURN LEFT THRU RIGHT S U R V E Y D A T A 4:00 PM to 4:15 PM :15 PM to 4:30 PM :30 PM to 4:45 PM :45 PM to 5:00 PM :00 PM to 5:15 PM :15 PM to 5:30 PM :30 PM to 5:45 PM :45 PM to 6:00 PM T O T A L B Y P E R I O D 4:00 PM to 4:15 PM :15 PM to 4:30 PM :30 PM to 4:45 PM :45 PM to 5:00 PM :00 PM to 5:15 PM :15 PM to 5:30 PM :30 PM to 5:45 PM :45 PM to 6:00 PM H O U R L Y T O T A L S 4:00 PM to 5:00 PM :15 PM to 5:15 PM :30 PM to 5:30 PM :45 PM to 5:45 PM :00 PM to 6:00 PM TEL: (510) FAX: (510) SYNCHRO CVS FILE FORMAT NBU NBL NBT NBR SBU SBL SBT SBR EBU EBL EBT EBR WBU WBL WBT WBR TOTAL VOLUME PEDESTRIAN BICYCLE PHF BY MOVEMENT #DIV/0! #DIV/0! #DIV/0! #DIV/0! #DIV/0! 0.70 #DIV/0! 0.63 #DIV/0! #DIV/0! #DIV/0! #DIV/0! OVERALL PHF BY APPROACH #DIV/0! 0.95
51 B. A. Y. M. E. T. R. I. C. S. B I C Y C L E M O V E M E N T S U M M A R Y PROJECT: PM TRAFFIC COUNTS IN SANTA CRUZ SURVEY DATE: 11/13/2012 DAY: TUESDAY N-S APPROACH: PACIFIC AVENUE SURVEY TIME: 4:00 PM TO 6:00 PM E-W APPROACH:SYCAMORE STREET JURISDICTION: SANTA CRUZ FILE: PEAK HOUR ARRIVAL / DEPARTURE VOLUMES 4:45 PM TO 5:45 PM NORTH N-LEG TOTAL NORTH - LEG WEST - LEG EAST - LEG E-LEG TOTAL W-LEG TOTAL SYCAMORE STREET 5 SOUTH - LEG S-LEG TOTAL PACIFIC AVENUE 26 TIME PERIOD NB (SOUTH - LEG) SB (NORTH - LEG) EB (WEST - LEG) WB (EAST - LEG) TOTAL From To LEFT THRU RIGHT LEFT THRU RIGHT LEFT THRU RIGHT LEFT THRU RIGHT S U R V E Y D A T A 4:00 PM to 4:15 PM :15 PM to 4:30 PM :30 PM to 4:45 PM :45 PM to 5:00 PM :00 PM to 5:15 PM :15 PM to 5:30 PM :30 PM to 5:45 PM :45 PM to 6:00 PM T O T A L B Y P E R I O D 4:00 PM to 4:15 PM :15 PM to 4:30 PM :30 PM to 4:45 PM :45 PM to 5:00 PM :00 PM to 5:15 PM :15 PM to 5:30 PM :30 PM to 5:45 PM :45 PM to 6:00 PM H O U R L Y T O T A L S 4:00 PM to 5:00 PM :15 PM to 5:15 PM :30 PM to 5:30 PM :45 PM to 5:45 PM :00 PM to 6:00 PM TEL: (510) FAX: (510) BICYCLE NBT SBT EBT WBT TOTAL
52 B. A. Y. M. E. T. R. I. C. S. P E D E S T R I A N M O V E M E N T S U M M A R Y PROJECT: PM TRAFFIC COUNTS IN SANTA CRUZ SURVEY DATE: 11/13/2012 N-S APPROACH: PACIFIC AVENUE DAY: TUESDAY E-W APPROACH: SYCAMORE STREET JURISDICTION: SANTA CRUZ SURVEY PERIOD: 4:00 PM TO 6:00 PM FILE: PEAK HOUR PEAK HOUR 04:45 PM TO 05:45 PM TOTAL PEDESTRIAN VOLUMES 70 N-LEG B 3 A&B A 9 W-LEG G&H 50 H C G D SYCAMORE STREET C&D 5 E 8 E-LEG 3 F E&F S-LEG PACIFIC AVENUE TIME PERIOD NORTH X-WALK EAST X-WALK SOUTH X-WALK WEST X-WALK From To A B C D E F G H TOTAL S U R V E Y D A T A 04:00 PM :15 PM :15 PM :30 PM :30 PM :45 PM :45 PM :00 PM :00 PM :15 PM :15 PM :30 PM :30 PM :45 PM :45 PM :00 PM T O T A L B Y P E R I O D 04:00 PM :15 PM :15 PM :30 PM :30 PM :45 PM :45 PM :00 PM :00 PM :15 PM :15 PM :30 PM :30 PM :45 PM :45 PM :00 PM H O U R L Y T O T A L S 04:00 PM :00 PM :15 PM :15 PM :30 PM :30 PM :45 PM :45 PM :00 PM :00 PM Tel : (510) Fax: (510) PEDESTRIAN N-LEG S-LEG E-LEG W-LEG TOTAL
 425-8600 3 Mission / Beach Departs Santa Cruz Metro Lane 2 Departs Bay & Mission Departs Grandview & Arroyo Seco Departs De Anza Mobile Home Park All METRO buses are")
53 3 SCMTD.COM Customer Service (831) Mission / Beach Departs Santa Cruz Metro Lane 2 Departs Bay & Mission Departs Grandview & Arroyo Seco Departs De Anza Mobile Home Park All METRO buses are wheelchair accessible, while some bus stops on this route may not be. NOTA: Todos los autobuses de METRO son accesibles en silla de ruedas, pero algunas paradas en ésta ruta no son accesibles. Departs Beach & Pacific Arrives Santa Cruz Metro Center A B C D E A MONDAY - FRIDAY 6:50AM 6:58 7:02 7:10 7:20 7:35 7:50 7:58 8:02 8:10 8:20 8:35 8:50 8:58 9:02 9:10 9:20 9:35 9:50 9:58 10:02 10:10 10:20 10:35 10:50 10:58 11:02 11:10 11:20 11:35 11:50 11:58 12:02PM 12:10 12:20 12:35 12:50 12:58 1:02 1:10 1:20 1:35 1:50 1:58 2:02 2:10 2:20 2:35 2:50 2:58 3:02 3:10 3:20 3:35 3:50 3:58 4:02 4:10 4:20 4:35 4:50 4:58 5:02 5:10 5:20 5:35 5:50 5:58 6:02 6:10 6:20 6:35 All METRO buses are equipped with front bicycle racks that can carry up to three bicycles at a time. NOTA: Todos los autobuses están equipados con portabicicletas en frente que pueden portar hasta tres a la vez. Local Santa Cruz Service Effective / Vigente: Sep. 13, 2012
 425-8600 3W Mission Weekend Departs Santa Cruz Metro Lane 2 Departs Bay & Mission Departs Grandview & Arroyo Seco Departs De Anza Mobile Home Park All METRO buses are")
54 3W SCMTD.COM Customer Service (831) W Mission Weekend Departs Santa Cruz Metro Lane 2 Departs Bay & Mission Departs Grandview & Arroyo Seco Departs De Anza Mobile Home Park All METRO buses are wheelchair accessible, while some bus stops on this route may not be. NOTA: Todos los autobuses de METRO son accesibles en silla de ruedas, pero algunas paradas en ésta ruta no son accesibles. Departs Bay & Mission Arrives Santa Cruz Metro Center A B C D B A SATURDAY - SUNDAY 9:50AM 9:58 10:02 10:10 10:18 10:35 11:50 11:58 12:02PM 12:10 12:18 12:35 1:50 1:58 2:02 2:10 2:18 2:35 3:50 3:58 4:02 4:10 4:18 4:35 5:50 5:58 6:02 6:10 6:18 6:35 All METRO buses are equipped with front bicycle racks that can carry up to three bicycles at a time. NOTA: Todos los autobuses están equipados con portabicicletas en frente que pueden portar hasta tres a la vez. Local Santa Cruz Service Effective / Vigente: Sep. 13, 2012
 425-8600 19 UCSC via via Lower Bay Bay Departs Departs Departs Departs Departs Departs Departs Departs Departs DepartsArrives Arrives Santa Santa Cruz Cruz Bay & Bay")
55 19 19 SCMTD.COM Customer Service (831) UCSC via via Lower Bay Bay Departs Departs Departs Departs Departs Departs Departs Departs Departs DepartsArrives Arrives Santa Santa Cruz Cruz Bay & Bay Mission & Mission Science Science Hill Hill Bay & Bay Mission & Mission Beach Beach & & Santa Cruz Santa Cruz Metro Metro Lane Lane 1 1 Pacific PacificMetro Center Metro Center A A B B C C B B D D A A MONDAY - FRIDAY MONDAY - FRIDAY All METRO buses are wheelchair accessible, while some bus stops on this route may not be. NOTA: Todos los autobuses de METRO son accesibles en silla de ruedas, pero algunas paradas en ésta ruta no son accesibles. 7:30AM 7:37 7:49 7: :17 8:307:30AM 8:377:37 8:49 7:49 8:59 7: :17 8:17 9:008:30 9:078:37 9:19 8:49 9:29 8: :47 9:17 9:309:00 9:379:07 9:49 9:19 9:59 9: :17 9:47 10:009:30 10:079:37 10:19 9:49 10:29 9: :47 10:17 10:30 10:00 10:37 10:07 10:4910:19 10:5910: :17 10:47 11:00 10:30 11:07 10:37 11:1910:49 11:2910: :47 11:17 11:30 11:00 11:37 11:07 11:4911:19 11:5911: :17PM 11:47 12:00 11:30 12:07 11:37 12:1911:49 12:2911: :47 12:17PM 12:30 12:00 12:37 12:07 12:4912:19 12:5912: :17 12:47 1:00 12:30 1:07 12:37 1:1912:49 1:2912: :47 1:17 1:301:00 1:371:07 1:49 1:19 1:59 1: :17 1:47 2:001:30 2:071:37 2:19 1:49 2:29 1: :47 2:17 2:30 2:37 2:49 2: :17 3:002:00 3:072:07 3:19 2:19 3:29 2: :47 2:47 3:302:30 3:372:37 3:49 2:49 3:59 2: :17 3:17 4:00 3:00 4:07 3:07 4:19 3:19 4:29 3: :47 3:47 3:30 3:37 3:49 3: :17 4:30 4:37 4:49 4: :17 5:00 4:00 5:07 4:07 5:19 4:19 5:29 4: :47 4:47 5:304:30 5:374:37 5:49 4:49 5:59 4: :17 5:17 6:005:00 6:075:07 6:19 5:19 6:29 5: :47 5:47 6:305:30 6:375:37 6:49 5:49 6:59 5: :17 6:17 7:306:00 7:376:07 7:49 6:19 7:59 6: :17 6:47 8:306:30 8:376:37 8:49 6:49 8:59 6: :17 7:17 ST 9:307:30 9:397:37 9:51 7:49 10:01 7:59 10: :14 8:17 ST 10:308:30 10:398:37 10:51 8:49 11:01 8:59 11: :14 9:17 ST 11:30 11:39 11:51 12:01 12:07 12:14 ST 9:30Trips marked 9:39 "ST" adhere 9:51 to the UCSC School 10:01Term Calendar 10:07 10:14 STViajes 10:30 marcados "ST" 10:39 se adhieren 10:51 al calendario del 11:01 término escolar 11:07 de UCSC 11:14 ST 11:30 11:39 11:51 12:01 12:07 12:14 Trips marked "ST" adhere to the UCSC School Term Calendar Viajes marcados "ST" se adhieren al calendario del término escolar de UCSC UCSC School Term Calendar is provided on a separate sticker. El calendario del término escolar de UCSC está en una calcomanía separada. All METRO buses are equipped with front bicycle racks that can carry up to three bicycles at a time. NOTA: Todos SCMTD.COM los UCSC Customer & Westside All METRO Service buses are wheelchair ac autobuses están equipados con portabicicletas en frente que bus stops on this route may not be. Effective Service pueden portar hasta tres a la vez. / Vigente: autobuses Sep. 13, de METRO 2012 son accesibl (831) pero algunas paradas en ésta ruta n UCSC via Lower Bay Departs Santa Cruz Metro Lane 1 Departs Bay & Mission Departs Science Hill Departs Bay & Mission Departs Beach & Pacific Arrives Santa Cruz Metro Center A B C B D A SATURDAY - SUNDAY 10:00AM 10:09 10:21 10:31 10:37 10:50 10:30 10:39 10:51 11:01 11:07 11:20 11:00 11:09 11:21 11:31 11:37 11:50 11:30 11:39 11:51 12:01PM 12:07 12:20 12:00 12:09 12:21 12:31 12:37 12:50 12:30 12:39 12:51 1:01 1:07 1:20 1:00 1:09 1:21 1:31 1:37 1:50 1:30 1:39 1:51 2:01 2:07 2:20 2:00 2:09 2:21 2:31 2:37 2:50 2:30 2:39 2:51 3:01 3:07 3:20 3:00 3:09 3:21 3:31 3:37 3:50 3:30 3:39 3:51 4:01 4:07 4:20 4:00 4:09 4:21 4:31 4:37 4:50 4:30 4:39 4:51 5:01 5:07 5:20 5:00 5:09 5:21 5:31 5:37 5:50 5:30 5:39 5:51 6:01 6:07 6:20 6:00 6:09 6:21 6:31 6:37 6:50 6:30 6:39 6:51 7:01 7:07 7:20 7:00 7:09 7:21 7:31 7:37 7:50 During the summer (mid-june through mid-september) this weekend trip will not serve the Beach-Boardwalk area. For exact dates call SCMTD Customer Service (831) NOTA: Durante el verano (mediados de junio hasta mediados de septiembre) éste viaje de fin de semana no servirá a la zona de Beach-Boardwalk. Para fechas exactas llame al Servicio al Cliente de SCMTD (831)
 425-8600 20 UCSC via Westside Departs Santa Cruz Metro Lane 1 Departs Delaware & Swift Departs Pacific Shores Departs Bay & High All METRO buses are wheelchair accessible,")
56 20 SCMTD.COM Customer Service (831) UCSC via Westside Departs Santa Cruz Metro Lane 1 Departs Delaware & Swift Departs Pacific Shores Departs Bay & High All METRO buses are wheelchair accessible, while some bus stops on this route may not be. NOTA: Todos los autobuses de METRO son accesibles en silla de ruedas, pero algunas paradas en ésta ruta no son accesibles. Departs Science Hill Departs Bay & High Departs Pacific Shores Departs Delaware & Swift Arrives Santa Cruz Metro Center A B C D E D C B A MONDAY - FRIDAY 7:20AM 7: :40 7: :57 8:03 8:18 8:20 8:30 8:33 8:43 8: :00 9:08 9:20 ST 8:50 9: :10 9:20 9: :20 9: :40 9: :03 10:15 10:20 10: :40 10: :03 11:15 11:20 11: :40 11: :03PM 12:15 12:20 12: :40 12: :03 1:15 1:20 1:30 1:33 1:43 1: :00 2:08 2:20 2:20 2: :40 2: :03 3:15 3:20 3: :40 3: :03 4:15 4:20 4:30 4:33 4:43 4: :00 5:08 5:20 ST :05 5: :28 5:40 5:20 5:30 5:33 5:43 5: :00 6:08 6:20 6:20 6: :40 6: :03 7:15 7:20 7: :40 7: :03 8:15 8:20 8: :40 8: :03 9:15 Trips marked "ST" adhere to the UCSC School Term Calendar Viajes marcados "ST" se adhieren al calendario del término escolar de UCSC Route 20D buses run with these trips during the school term to handle overloads. NOTA: Autobúses de ruta de 20D corren con éstos viajes durante el término escolar para manejar las sobrecargas UCSC via Westside Departs Santa Cruz Metro Lane 1 Departs Delaware & Swift Departs Bay & High Departs Science Hill Departs Delaware & Swift Arrives Santa Cruz Metro Center A B D E B A SATURDAY - SUNDAY 8:20AM 8:30 8:40 8:50 9:03 9:15 9:20 9:30 9:40 9:50 10:03 10:15 10:20 10:30 10:40 10:50 11:03 11:15 11:20 11:30 11:40 11:50 12:03PM 12:15 12:20 12:30 12:40 12:50 1:03 1:15 1:20 1:30 1:40 1:50 2:03 2:15 2:20 2:30 2:40 2:50 3:03 3:15 3:20 3:30 3:40 3:50 4:03 4:15 4:20 4:30 4:40 4:50 5:03 5:15 5:20 5:30 5:40 5:50 6:03 6:15 6:20 6:30 6:40 6:50 7:03 7:15 7:20 7:30 7:40 7:50 8:03 8:15 8:20 8:30 8:40 8:50 9:03 9:15 UCSC School Term Calendar is provided on a separate sticker. El calendario del término escolar de UCSC está en una calcomanía separada. All METRO buses are equipped with front bicycle racks that can carry up to three bicycles at a time. NOTA: Todos los autobuses están equipados con portabicicletas en frente que pueden portar hasta tres a la vez. UCSC & Westside Service Effective / Vigente: Sep. 13, 2012
EXECUTIVE SUMMARY. The following is an outline of the traffic analysis performed by Hales Engineering for the traffic conditions of this project.
 EXECUTIVE SUMMARY This study addresses the traffic impacts associated with the proposed Shopko redevelopment located in Sugarhouse, Utah. The Shopko redevelopment project is located between 1300 East and
L1TILE BEARS DAY CARE TRANSPORTATION IMPACT STUDY FORT COLLINS, COLORADO MAY Prepared for:
 L1TILE BEARS DAY CARE TRANSPORTATION IMPACT STUDY FORT COLLINS, COLORADO MAY 2012 Prepared for: Hillside Construction, Inc. 216 Hemlock Street, Suite B Fort Collins, CO 80534 Prepared by: DELICH ASSOCIATES
Oakbrook Village Plaza City of Laguna Hills
 Oakbrook Village Plaza City of Laguna Hills Traffic Impact Analysis Prepared by: HDR Engineering 3230 El Camino Real, Suite 200 Irvine, CA 92602 October 2012 Revision 3 D-1 Oakbrook Village Plaza Laguna
ZINFANDEL LANE / SILVERADO TRAIL INTERSECTION TRAFFIC ANALYSIS
 ZINFANDEL LANE / SILVERADO TRAIL INTERSECTION TRAFFIC ANALYSIS UPDATED TRAFFIC STUDY FOR THE PROPOSED RAYMOND VINEYARDS WINERY USE PERMIT MODIFICATION #P11-00156 AUGUST 5, 2014 PREPARED BY: OMNI-MEANS,
Bennett Pit. Traffic Impact Study. J&T Consulting, Inc. Weld County, Colorado. March 3, 2017
 Bennett Pit Traffic Impact Study J&T Consulting, Inc. Weld County, Colorado March 3, 217 Prepared By: Sustainable Traffic Solutions, Inc. http://www.sustainabletrafficsolutions.com/ Joseph L. Henderson,
APPENDIX C1 TRAFFIC ANALYSIS DESIGN YEAR TRAFFIC ANALYSIS
 APPENDIX C1 TRAFFIC ANALYSIS DESIGN YEAR TRAFFIC ANALYSIS DESIGN YEAR TRAFFIC ANALYSIS February 2018 Highway & Bridge Project PIN 6754.12 Route 13 Connector Road Chemung County February 2018 Appendix
Alpine Highway to North County Boulevard Connector Study
 Alpine Highway to North County Boulevard Connector Study prepared by Avenue Consultants March 16, 2017 North County Boulevard Connector Study March 16, 2017 Table of Contents 1 Summary of Findings... 1
One Harbor Point Residential
 Residential Gig Harbor, WA Transportation Impact Analysis January 23, 2017 Prepared for: Neil Walter Company PO Box 2181 Tacoma, WA 98401 Prepared by: TENW Transportation Engineering NorthWest 11400 SE
TRAFFIC IMPACT ANALYSIS FOR. McDONALD S RESTAURANT IN CARMICAEL Sacramento County, CA. Prepared For:
 TRAFFIC IMPACT ANALYSIS FOR McDONALD S RESTAURANT IN CARMICAEL Sacramento County, CA Prepared For: McDonald s USA, LLC Pacific Sierra Region 2999 Oak Road, Suite 900 Walnut Creek, CA 94597 Prepared By:
Traffic Impact Analysis 5742 BEACH BOULEVARD MIXED USE PROJECT
 Traffic Impact Analysis 5742 BEACH BOULEVARD MIXED USE PROJECT CITY OF BUENA PARK Prepared by Project No. 14139 000 April 17 th, 2015 DKS Associates Jeffrey Heald, P.E. Rohit Itadkar, T.E. 2677 North Main
APPENDIX B Traffic Analysis
 APPENDIX B Traffic Analysis Rim of the World Unified School District Reconfiguration Prepared for: Rim of the World School District 27315 North Bay Road, Blue Jay, CA 92317 Prepared by: 400 Oceangate,
TRAFFIC IMPACT ANALYSIS
 TRAFFIC IMPACT ANALYSIS Emerald Isle Commercial Development Prepared by SEPI Engineering & Construction Prepared for Ark Consulting Group, PLLC March 2016 I. Executive Summary A. Site Location The Emerald
Traffic Impact Analysis. Alliance Cole Avenue Residential Site Dallas, Texas. Kimley-Horn and Associates, Inc. Dallas, Texas.
 Traffic Impact Analysis Alliance Cole Avenue Residential Site Dallas, Texas February 15, 2018 Kimley-Horn and Associates, Inc. Dallas, Texas Project #064524900 Registered Firm F-928 Traffic Impact Analysis
King County Metro. Columbia Street Transit Priority Improvements Alternative Analysis. Downtown Southend Transit Study. May 2014.
 King County Metro Columbia Street Transit Priority Improvements Alternative Analysis Downtown Southend Transit Study May 2014 Parametrix Table of Contents Introduction... 1 Methodology... 1 Study Area...
Quantitative analyses of weekday a.m. and p.m. commuter hour conditions have been conducted for the following five scenarios:
 6.1 TRANSPORTATION AND CIRCULATION 6.1.1 INTRODUCTION This section of the EIR presents the results of TJKM s traffic impact analysis of the proposed Greenbriar Development. The analysis includes consideration
Traffic Impact Analysis West Street Garden Plots Improvements and DuPage River Park Garden Plots Development Naperville, Illinois
 Traffic Impact Analysis West Street Garden Plots Improvements and DuPage River Park Garden Plots Development Naperville, Illinois Submitted by April 9, 2009 Introduction Kenig, Lindgren, O Hara, Aboona,
Table of Contents. Traffic Impact Analysis Capital One Building at Schilling Place
 Traffic Impact Analysis Capital One Building at Schilling Place Table of Contents Executive Summary... 1 1. Introduction... 4 2. Project Description... 4 3. Background Information... 4 4. Study Scope...
LAWRENCE TRANSIT CENTER LOCATION ANALYSIS 9 TH STREET & ROCKLEDGE ROAD / 21 ST STREET & IOWA STREET LAWRENCE, KANSAS
 LAWRENCE TRANSIT CENTER LOCATION ANALYSIS 9 TH STREET & ROCKLEDGE ROAD / 21 ST STREET & IOWA STREET LAWRENCE, KANSAS TRAFFIC IMPACT STUDY FEBRUARY 214 OA Project No. 213-542 TABLE OF CONTENTS 1. INTRODUCTION...
Revised Report. Traffic Study for Safeway Fuel Center at Washington Square Shopping Center. In The City of Petaluma.
 Revised Report Traffic Study for Safeway Fuel Center at Washington Square Shopping Center In The Pleasanton Fresno Sacramento Santa Rosa TJKM www.tjkm.com Revised Report Traffic Study for Safeway Fuel
Date: February 7, 2017 John Doyle, Z-Best Products Robert Del Rio. T.E. Z-Best Traffic Operations and Site Access Analysis
 Memorandum Date: February 7, 07 To: From: Subject: John Doyle, Z-Best Products Robert Del Rio. T.E. Z-Best Traffic Operations and Site Access Analysis Introduction Hexagon Transportation Consultants, Inc.
TRAFFIC IMPACT STUDY FOR SONIC DRIVE-IN RESTAURANT. Vallejo, CA. Prepared For:
 TRAFFIC IMPACT STUDY FOR SONIC DRIVE-IN RESTAURANT Vallejo, CA Prepared For: ELITE DRIVE-INS, INC. 2190 Meridian Park Blvd, Suite G Concord, CA 94520 Prepared By: KD Anderson & Associates 3853 Taylor Road,
Escondido Marriott Hotel and Mixed-Use Condominium Project TRAFFIC IMPACT ANALYSIS REPORT
 Escondido Marriott Hotel and Mixed-Use Condominium Project TRAFFIC IMPACT ANALYSIS REPORT Prepared for Phelps Program Management 420 Sixth Avenue, Greeley, CO 80632 Prepared by 5050 Avenida Encinas, Suite
Ingraham High School Parking and Traffic Analysis
 Parking and Traffic Analysis Seattle, WA Prepared for: URS Corporation 1501 4th Avenue, Suite 1400 Seattle, WA 98101-1616 Mirai Transportation Planning & Engineering 11410 NE 122nd Way, Suite 320 Kirkland,
 Traffic Analysis For Approved Uses within the St. Lucie West DRI Aldi Port St. Lucie, FL Prepared for: Bohler Engineering, LLC 1000 Corporate Drive Suite 250 Fort Lauderdale, FL 33334 Prepared by: 10795
TRAFFIC SIGNAL DESIGN REPORT KING OF PRUSSIA ROAD & RAIDER ROAD RADNOR TOWNSHIP PENNSYLVANIA
 TRAFFIC SIGNAL DESIGN REPORT KING OF PRUSSIA ROAD & RAIDER ROAD RADNOR TOWNSHIP PENNSYLVANIA PREPARED FOR: UNIVERSITY OF PENNSYLVANIA HEALTH SYSTEM 34 CIVIC CENTER BOULEVARD PHILADELPHIA, PA 1987 (61)
Downtown One Way Street Conversion Technical Feasibility Report
 Downtown One Way Street Conversion Technical Feasibility Report As part of the City s Transportation Master Plan, this report reviews the technical feasibility of the proposed conversion of the current
Volume 1 Traffic Impact Analysis Turtle Creek Boulevard Dallas, Texas. Kimley-Horn and Associates, Inc. Dallas, Texas.
 Volume 1 Traffic Impact Analysis 2727 Dallas, Texas June 18, 2018 Kimley-Horn and Associates, Inc. Dallas, Texas Project #064523000 Registered Firm F-928 Traffic Impact Analysis 2727 Dallas, Texas Prepared
Table 1 - Land Use Comparisons - Proposed King s Wharf Development. Retail (SF) Office (SF) 354 6,000 10, Land Uses 1
 Office (SF) 354 6,000 10, Land Uses 1") Ref. No. 171-6694 Phase 2 November 23, 217 Mr. David Quilichini, Vice President Fares & Co. Developments Inc. 31 Place Keelson Sales Centre DARTMOUTH NS B2Y C1 Sent Via Email to David@faresinc.com RE:
Ref. No. 171-6694 Phase 2 November 23, 217 Mr. David Quilichini, Vice President Fares & Co. Developments Inc. 31 Place Keelson Sales Centre DARTMOUTH NS B2Y C1 Sent Via Email to David@faresinc.com RE:
King Soopers #116 Thornton, Colorado
 Traffic Impact Study King Soopers #116 Thornton, Colorado Prepared for: Galloway & Company, Inc. T R A F F I C I M P A C T S T U D Y King Soopers #116 Thornton, Colorado Prepared for Galloway & Company
Traffic Engineering Study
 Traffic Engineering Study Bellaire Boulevard Prepared For: International Management District Technical Services, Inc. Texas Registered Engineering Firm F-3580 November 2009 Executive Summary has been requested
INTERSECTION ANALYSIS PARK AVENUE AND BRADDOCK ROAD (FROSTBURG, MD) FOR LENHART TRAFFIC CONSULTING, INC.
 FOR LENHART TRAFFIC CONSULTING, INC.") INTERSECTION ANALYSIS FOR PARK AVENUE AND BRADDOCK ROAD (FROSTBURG, MD) Prepared for: City of Frostburg, Maryland & Allegany County Commissioners Prepared by: LENHART TRAFFIC CONSULTING, INC. TRAFFIC ENGINEERING
INTERSECTION ANALYSIS FOR PARK AVENUE AND BRADDOCK ROAD (FROSTBURG, MD) Prepared for: City of Frostburg, Maryland & Allegany County Commissioners Prepared by: LENHART TRAFFIC CONSULTING, INC. TRAFFIC ENGINEERING
2.0 Development Driveways. Movin Out June 2017
 Movin Out June 2017 1.0 Introduction The proposed Movin Out development is a mixed use development in the northeast quadrant of the intersection of West Broadway and Fayette Avenue in the City of Madison.
Existing Traffic Conditions
 May 14, 2014 Ms. Lorraine Weiss City of San Mateo 330 West 20 th Avenue San Mateo, CA 94403 Subject: Traffic Operational Study for the Proposed Tilton Avenue Residential Development in San Mateo, California
INDUSTRIAL DEVELOPMENT
 INDUSTRIAL DEVELOPMENT Traffic Impact Study Plainfield, Illinois August 2018 Prepared for: Seefried Industrial Properties, Inc. TABLE OF CONTENTS Executive Summary 2 Introduction 3 Existing Conditions
Proposed Hotel and Restaurant Development
 Traffic Impact Study Proposed Hotel and Restaurant Development Marbledale Road Tuckahoe, NY PREPARED FOR BILLWIN DEVELOPMENT AFFILIATES, LLC 365 WHITE PLAINS ROAD EASTCHESTER, NY. 10709 PREPARED BY Engineering
The major roadways in the study area are State Route 166 and State Route 33, which are shown on Figure 1-1 and described below:
 3.5 TRAFFIC AND CIRCULATION 3.5.1 Existing Conditions 3.5.1.1 Street Network DRAFT ENVIRONMENTAL IMPACT REPORT The major roadways in the study area are State Route 166 and State Route 33, which are shown
MONTEREY BAY AQUARIUM RESEARCH INSTITUTE (MBARI) MASTER PLAN UPDATE MOSS LANDING, CALIFORNIA
 MASTER PLAN UPDATE MOSS LANDING, CALIFORNIA") MONTEREY BAY AQUARIUM RESEARCH INSTITUTE (MBARI) MASTER PLAN UPDATE MOSS LANDING, CALIFORNIA TRAFFIC IMPACT ANALYSIS Administrative Draft Report Prepared For Monterey Bay Aquarium Research Institute Moss
MONTEREY BAY AQUARIUM RESEARCH INSTITUTE (MBARI) MASTER PLAN UPDATE MOSS LANDING, CALIFORNIA TRAFFIC IMPACT ANALYSIS Administrative Draft Report Prepared For Monterey Bay Aquarium Research Institute Moss
CHAPTER 9: VEHICULAR ACCESS CONTROL Introduction and Goals Administration Standards
 9.00 Introduction and Goals 9.01 Administration 9.02 Standards 9.1 9.00 INTRODUCTION AND GOALS City streets serve two purposes that are often in conflict moving traffic and accessing property. The higher
Appendix C. Traffic Study
 Appendix C Traffic Study TABLE OF CONTENTS SECTION Executive Summary PAGE 1.0 Introduction... 1 1.1 Scope of Work... 1 1.2 Study Area... 2 2.0 Project Description... 3 2.1 Site Access... 4 2.2 Pedestrian
Bay Terrace Apartments
 Bay Terrace Apartments Traffic Impact Analysis Prepared for: City of San Mateo September 16, 2011 Hexagon Office: 111 W. St. John Street, Suite 850 San Jose, CA 95113 Hexagon Job Number: 10MH08 Phone:
TRANSPORTATION STUDY FOR THE 8899 BEVERLY BOULEVARD PROJECT
 DRAFT TRANSPORTATION STUDY FOR THE 8899 BEVERLY BOULEVARD PROJECT WEST HOLLYWOOD, CALIFORNIA NOVEMBER 2013 PREPARED FOR BEVERLY BOULEVARD ASSOCIATION PREPARED BY DRAFT TRANSPORTATION STUDY FOR THE 8899
Traffic Impact Analysis Update
 Willow Bend Traffic Impact Analysis Update TABLE OF CONTENTS Page I. INTRODUCTION -------------------------------------------------------------------------------------------- 1 II. EXISTING CONDITIONS
Traffic Impact Study Hudson Street Parking Garage MC Project No.: A Table of Contents
 Traffic Impact Study Hudson Street Parking Garage MC Project No.: 15001714A Table of Contents Table of Contents I. INTRODUCTION... 1 II. EXISTING CONDITIONS... 4 III. 2015 EXISTING TRAFFIC CONDITIONS...
Appendix H: Construction Impacts H-2 Transportation
 Appendix H: Construction Impacts H-2 Transportation \ AECOM 71 W. 23 rd Street New York, NY 10010 www.aecom.com 212 366 6200 tel 212 366 6214 fax Memorandum To CC Subject Robert Conway Donald Tone Construction
D & B COMMERCIAL TRAFFIC IMPACT ANALYSIS
 D & B COMMERCIAL TRAFFIC IMPACT ANALYSIS TABLE OF CONTENTS I. Introduction...3 II. Project Description...3 III. Existing Conditions...3 IV. Future Traffic Conditions...8 V. Conclusions and Mitigation...14
County State Aid Highway 30 (Diffley Road) and Dodd Road Intersection Study
 and Dodd Road Intersection Study") County State Aid Highway 30 (Diffley Road) and Dodd Road Intersection Study City of Eagan, Dakota County, Minnesota Date: March 2012 Project No. 14957.000 444 Cedar Street, Suite 1500 Saint Paul, MN 55101
County State Aid Highway 30 (Diffley Road) and Dodd Road Intersection Study City of Eagan, Dakota County, Minnesota Date: March 2012 Project No. 14957.000 444 Cedar Street, Suite 1500 Saint Paul, MN 55101
886 March Road McDonald's Transportation Study
 McDonald's Restaurants of Canada Limited March 2013 886 March Road McDonald's Transportation Study Submitted by: HDR Corporation 100 York Boulevard, Suite 300 Richmond Hill, ON L4B 1J8 (905) 882-4100 www.hdrinc.com
TIMBERVINE TRANSPORTATION IMPACT STUDY FORT COLLINS, COLORADO JANUARY Prepared for:
 TIMBERVINE TRANSPORTATION IMPACT STUDY FORT COLLINS, COLORADO JANUARY 2014 Prepared for: Hartford Companies 1218 W. Ash Street Suite A Windsor, Co 80550 Prepared by: DELICH ASSOCIATES 2272 Glen Haven Drive
4.14 TRANSPORTATION AND CIRCULATION
 4.14 TRANSPORTATION AND CIRCULATION 4.14.1 Summary Table 4.14-1 summarizes the identified environmental impacts, proposed mitigation measures, and residual impacts of the proposed project with regard to
TRAFFIC DATA. Existing Derousse Ave./River Rd. AM LOS Analysis Existing Derousse Ave./River Rd. PM LOS Analysis
 Appendix E NJ TRANSIT Pennsauken Junction Transit Center and Park & Ride RiverLINE and Atlantic City Line Pennsauken Township, Camden County, New Jersey TRAFFIC DATA Background Traffic Information for
APPENDIX E. Traffic Analysis Report
 APPENDIX E Traffic Analysis Report THIS PAGE INTENTIONALLY BLANK EAGLE RIVER TRAFFIC MITIGATION PHASE I OLD GLENN HIGHWAY/EAGLE RIVER ROAD INTERSECTION IMPROVEMENTS TRAFFIC ANALYSIS Eagle River, Alaska
Traffic Impact Statement (TIS)
") Traffic Impact Statement (TIS) Vincentian PUDA Collier County, FL 10/18/2013 Prepared for: Global Properties of Naples Prepared by: Trebilcock Consulting Solutions, PA 2614 Tamiami Trail N, Suite 615 1205
Traffic Impact Statement (TIS) Vincentian PUDA Collier County, FL 10/18/2013 Prepared for: Global Properties of Naples Prepared by: Trebilcock Consulting Solutions, PA 2614 Tamiami Trail N, Suite 615 1205
RE: A Traffic Impact Statement for a proposed development on Quinpool Road
 James J. Copeland, P.Eng. GRIFFIN transportation group inc. 30 Bonny View Drive Fall River, NS B2T 1R2 May 31, 2018 Ellen O Hara, P.Eng. Project Engineer DesignPoint Engineering & Surveying Ltd. 200 Waterfront
Transportation & Traffic Engineering
 Transportation & Traffic Engineering 1) Project Description This report presents a summary of findings for a Traffic Impact Analysis (TIA) performed by A+ Engineering, Inc. for the Hill Country Family
Re: Cyrville Road Car Dealership
 1223 Michael Street, Suite 100, Ottawa, ON K1J 7T2 Tel: 613.738.4160 Fax: 613.739.7105 www.delcan.com February 25, 2013 OUR REF: TO3098TOE Mark Motors of Ottawa 611 Montreal Road Ottawa, ON K1K 0T8 Attention:
TABLE OF CONTENTS 1.0 INTRODUCTION AND SUMMARY Purpose of Report and Study Objectives... 2
 TABLE OF CONTENTS 1.0 INTRODUCTION AND SUMMARY 1 1.1 Purpose of Report and Study Objectives... 2 1.2 Executive Summary... 3 1.2.1 Site Location and Study Area... 3 1.2.2 Development Description... 3 1.2.3
2. Valley Circle Boulevard/Andora Avenue/Baden Avenue and Lassen Street
 IV.J TRANSPORTATION 1. INTRODUCTION This section presents an overview of the existing traffic and circulation system in and surrounding the project site. This section also discusses the potential impacts
INTERCHANGE OPERTIONS STUDY Interstate 77 / Wallings Road Interchange
 INTERCHANGE OPERTIONS STUDY Interstate 77 / Wallings Road Interchange City of Broadview Heights, Cuyahoga County, Ohio Prepared For: City of Broadview Heights Department of Engineering 9543 Broadview Road
Table Existing Traffic Conditions for Arterial Segments along Construction Access Route. Daily
 5.8 TRAFFIC, ACCESS, AND CIRCULATION This section describes existing traffic conditions in the project area; summarizes applicable regulations; and analyzes the potential traffic, access, and circulation
MEMORANDUM. Figure 1. Roundabout Interchange under Alternative D
 MEMORANDUM Date: To: Liz Diamond, Dokken Engineering From: Subject: Dave Stanek, Fehr & Peers Western Placerville Interchanges 2045 Analysis RS08-2639 Fehr & Peers has completed a transportation analysis
MILLERSVILLE PARK TRAFFIC IMPACT ANALYSIS ANNE ARUNDEL COUNTY, MARYLAND
 MILLERSVILLE PARK TRAFFIC IMPACT ANALYSIS ANNE ARUNDEL COUNTY, MARYLAND Prepared for: Department of Public Works Anne Arundel County Prepared by: URS Corporation 4 North Park Drive, Suite 3 Hunt Valley,
MEMORANDUM. Date: November 4, Cheryl Burrell, Pebble Beach Company. Rob Rees, P.E. Inclusionary Housing Transportation Analysis WC
 MEMORANDUM Date: November 4, 2013 To: From: Subject: Cheryl Burrell, Pebble Beach Company Rob Rees, P.E. Inclusionary Housing Transportation Analysis As requested, Fehr & Peers is providing clarification
The key roadways in the project vicinity are described below. Exhibit displays the existing number of lanes on the study roadways.
 4.2 TRAFFIC AND CIRCULATION This section presents the key assumptions, methods, and results of analysis for the transportation and circulation impacts of the proposed project. This section is based on
Lacey Gateway Residential Phase 1
 Lacey Gateway Residential Phase Transportation Impact Study April 23, 203 Prepared for: Gateway 850 LLC 5 Lake Bellevue Drive Suite 02 Bellevue, WA 98005 Prepared by: TENW Transportation Engineering West
TRAFFIC AND TRANSPORTATION TECHNICAL MEMORANDUM
 TRAFFIC AND TRANSPORTATION TECHNICAL MEMORANDUM for ENVIRONMENTAL ASSESSMENT US 460 Bypass Interchange and Southgate Drive Relocation State Project No.: 0460-150-204, P101, R201, C501, B601; UPC 99425
APPENDIX A LEVEL OF SERVICE CONCEPTS, ANALYSIS METHODOLOGIES,STANDARDS OF SIGNIFICANCE
 APPENDIX A LEVEL OF SERVICE CONCEPTS, ANALYSIS METHODOLOGIES,STANDARDS OF SIGNIFICANCE Roadway Segment Level of Service Definitions LOS V/C Congestion/Delay Traffic Description (Used for surface streets,
Craig Scheffler, P.E., PTOE HNTB North Carolina, P.C. HNTB Project File: Subject
 TECHNICAL MEMORANDUM To Kumar Neppalli Traffic Engineering Manager Town of Chapel Hill From Craig Scheffler, P.E., PTOE HNTB North Carolina, P.C. Cc HNTB Project File: 38435 Subject Obey Creek TIS 2022
Final. Traffic Impact Study For 1200 Ashby Avenue Mixed-Use Development. In City of Berkeley. November 26, TJKM Transportation Consultants
 TJKM Transportation Consultants Final Traffic Impact Study For 1200 Ashby Avenue Mixed-Use Development In City of Berkeley Pleasanton Fresno Sacramento Santa Rosa www.tjkm.com TJKM Transportation Consultants
Traffic Impact Study Speedway Gas Station Redevelopment
 Traffic Impact Study Speedway Gas Station Redevelopment Warrenville, Illinois Prepared For: Prepared By: April 11, 2018 Table of Contents 1. Introduction... 1 2. Existing Conditions... 4 Site Location...
TABLE OF CONTENTS SECTION PAGE. Executive Summary... xii
 TABLE OF CONTENTS SECTION PAGE Executive Summary... xii 1.0 Introduction... 1 1.1 Study Area... 2 1.2 Traffic Impact Analysis Scenarios... 4 1.3 Study Area - City of Orange... 4 2.0 Project Description
Re: Residential Development - Ogilvie/Cummings Transportation Overview
 1223 Michael Street, Suite 100, Ottawa, ON K1J 7T2 Tel: 613.738.4160 Fax: 613.739.7105 www.delcan.com March 28, 2012 OUR REF: TO3088TOY Barry J. Hobin & Architects 63 Pamilla Street Ottawa, ON K1S 3K7
Appendix I: The Project Traffic Impact Study report by TJKM Transportation Consultants
 Appendix I: The Project Traffic Impact Study report by TJKM Transportation Consultants TJKM Transportation Consultants Draft Report Traffic Impact Study for the Residential Development at 4659 Proctor
Appendix Q Traffic Study
 Appendices Appendix Q Traffic Study Crummer Site Subdivision Draft EIR City of Malibu Appendices This page intentionally left blank. The Planning Center April 2013 TRAFFIC IMPACT ANALYSIS Photo z here
MURRIETA APARTMENTS TRAFFIC IMPACT ANALYSIS CITY OF MURRIETA, CALIFORNIA
 MURRIETA APARTMENTS TRAFFIC IMPACT ANALYSIS CITY OF MURRIETA, CALIFORNIA SEPTEMBER 20, 2012 Prepared for: Golden Eagle Multi-Family Properties, LLC 6201 Oak Canyon Rd., Suite 250 Irvine, CA 92618 Prepared
Weaver Road Senior Housing Traffic Impact Analysis
 Gibson Traffic Consultants, Inc. 2813 Rockefeller Avenue Suite B Everett, WA 9821 425.339.8266 Weaver Road Senior Housing Traffic Impact Analysis Jurisdiction: City of Snohomish January 218 GTC #17-37
Traffic Feasibility Study
 Traffic Feasibility Study Town Center South Robbinsville Township, Mercer County, New Jersey December 19, 2017 Prepared For Robbinsville Township Department of Community Development 2298 Route 33 Robbinsville,
APPENDIX C-2. Traffic Study Supplemental Analysis Memo
 APPENDIX C-2 Traffic Study Supplemental Analysis Memo The Mobility Group Transportation Strategies & Solutions Memorandum To: From: Subject: Tomas Carranza, LADOT Matthew Simons Traffic Review - Revised
MEMO VIA . Ms. Amy Roth DPS Director, City of Three Rivers. To:
 MEMO To: Ms. Amy Roth DPS Director, City of Three Rivers VIA EMAIL From: Michael J. Labadie, PE Julie M. Kroll, PE, PTOE Brandon Hayes, PE, P.Eng. Fleis & VandenBrink Date: January 5, 2017 Re: Proposed
LOST LAKE CORRIDOR REVIEW
 LOST LAKE CORRIDOR REVIEW Prepared for: Prepared by: Broadview Developments Inc. c/o Westbrook Consulting Watt Consulting Group Our File: 2064.B01 Date: October 31, 2016 TABLE OF CONTENTS 1.0 INTRODUCTION...
City of Pacific Grove
 Regional Study Utilizing Caltrans Intersection Evaluation Section 7: City of Pacific Grove s: FIRST STREET AT CENTRAL AVENUE Transportation Agency for Monterey County Prepared by Transportation Agency
Parking/Traffic Assessment Study
 Brock Road Industrial Mall 985 Brock Road South City of Pickering Parking/Traffic Assessment Study Prepared by: Tranplan Associates, Toronto Toronto 416-670-2005 Sudbury 705-522-0272 Peterborough 705-874-3638
City of Marina. Regional Roundabout Study Utilizing Caltrans Intersection Control Evaluation Section 4: Transportation Agency for Monterey County
 Regional Roundabout Study Utilizing Caltrans Intersection Control Evaluation Section 4: City of Marina Study Intersections: RESERVATION ROAD AT BEACH ROAD RESERVATION ROAD AT DEFOREST ROAD CARDOZA AVENUE
TRAFFIC IMPACT STUDY FOR
 TRAFFIC IMPACT STUDY FOR YUBA CROSSINGS MIXED USE DEVELOPMENT Yuba City, CA Prepared For: Yuba Crossings LLC 1825 Del Paso Blvd Sacramento, CA 95815 Prepared By: KDAnderson & Associates, Inc. 3853 Taylor
TALMONT TOWNHOMES MADISON KENNETH SPA TRAFFIC IMPACT STUDY. Sacramento, CA. Prepared For: MBK Homes. Prepared By:
 TALMONT TOWNHOMES MADISON KENNETH SPA TRAFFIC IMPACT STUDY Sacramento, CA Prepared For: MBK Homes Prepared By: KD Anderson & Associates 3853 Taylor Road, Suite G Loomis, California 95650 (916) 660-1555
HUMC/Mountainside Hospital Redevelopment Plan
 Traffic and Parking Analysis HUMC/Mountainside Hospital Redevelopment Plan in Glen Ridge Borough and Montclair Township PREPARED FOR H2M 119 Cherry Hill Road, Suite 110 Parsippany, NJ 07054 862.207.5900
TRAFFIC IMPACT STUDY. USD #497 Warehouse and Bus Site
 TRAFFIC IMPACT STUDY for USD #497 Warehouse and Bus Site Prepared by: Jason Hoskinson, PE, PTOE BG Project No. 16-12L July 8, 216 145 Wakarusa Drive Lawrence, Kansas 6649 T: 785.749.4474 F: 785.749.734
Sugarland Crossing Gwinnett County, Georgia
 Sugarland Crossing Gwinnett County, Georgia S IGNAL W ARRANT A NALYSIS For the Intersection of: Sugarloaf Parkway / Richards Middle School Driveway / Sugarland Crossing Main Site Driveway Prepared for:
RESPONSE TO TRAFFIC IMPACT STUDY COMMENTS
 RESPONSE TO TRAFFIC IMPACT STUDY COMMENTS Proposed Gas Station 40 Arthur Street (Highway 26), Town of the Blue Mountains (Thornbury), County of Grey, Ontario AUGUST 2013 August 27, 2013 MR. REG RUSSWURM
KUM & GO 6400 WESTOWN PARKWAY WEST DES MOINES, IOWA 50266
 KUM & GO #300 PECOS STREET & 88 TH AVENUE THORNTON, COLORADO TRAFFIC IMPACT STUDY REVISION 1 PREPARED FOR KUM & GO 6400 WESTOWN PARKWAY WEST DES MOINES, IOWA 50266 JANUARY 23, 2014 OA PROJECT NO. 013-1721
Provide an overview of the development proposal including projected site traffic volumes;
 December 19, 2013 File: 163600935 Attention: Troy Elliott Carl Elliott Limited 15-1831 Robertson Road PO Box 11117 Nepean, Ontario K1H 7T8 Dear Mr. Elliott, Reference: 2235 and 2265 Robertson Road Transportation
County State Aid Highway 32 (Cliff Road) and Dodd Road Intersection Study
 and Dodd Road Intersection Study") County State Aid Highway 32 (Cliff Road) and Dodd Road Intersection Study City of Eagan, Dakota County, Minnesota Date: March 2012 Project No. 14957.000 444 Cedar Street, Suite 1500 Saint Paul, MN 55101
County State Aid Highway 32 (Cliff Road) and Dodd Road Intersection Study City of Eagan, Dakota County, Minnesota Date: March 2012 Project No. 14957.000 444 Cedar Street, Suite 1500 Saint Paul, MN 55101
Vanier Parkway and Presland Road Residential Development Transportation Impact Study
 Vanier Parkway and Presland Road Residential Development Transportation Impact Study Final Report (Revised) March 2011 Submitted to: Groupe Lépine Ottawa Project No. 09-1613 Submitted by: Groupe Lépine
PROJECT: Wilkinson Road Corridor Improvement Traffic Management Planning Project SUBJECT: Traffic Analysis
 TECHNICAL MEMORANDUM DATE: September 10, 2014 PROJECT 5861.03 NO: PROJECT: Wilkinson Road Corridor Improvement Traffic Management Planning Project SUBJECT: Traffic Analysis TO: Steve Holroyd - District
Lakeside Terrace Development
 Lakeside Terrace Development City of Barrie, County of Simcoe Traffic Brief for: Type of Document: Final Report Project Number: JDE 1617 Date Submitted: April 29 th, 216 4/29/16 John Northcote, P.Eng.
830 Main Street Halifax Regional Municipality
 830 Main Street Halifax Regional Municipality Traffic Impact Statement Final Report Prepared by: GRIFFIN transportation group inc. 30 Bonny View Drive Fall River, NS B2T 1R2 www.griffininc.ca Prepared
Prepared For: Toronto Transit Commission 1138 Bathurst Street Toronto, Ontario M5R 3H2. Prepared By:
 TRAFFIC IMPACT STUDY FOR THE TTC MCNICOLL BUS GARAGE CITY OF TORONTO Prepared For: Toronto Transit Commission 1138 Bathurst Street Toronto, Ontario M5R 3H2 Prepared By: Canada Inc. 4th Floor, 3 Leek Crescent
ARVADA TRIANGLE REDEVELOPMENT TRAFFIC IMPACT ANALYSIS
 ARVADA TRIANGLE REDEVELOPMENT TRAFFIC IMPACT ANALYSIS Prepared for: Arvada Urban Renewal Authority 5601 Olde Wadsworth Boulevard, Suite 210 Arvada, Colorado 80002 (720) 898-7062 Prepared by: Felsburg Holt
STANDARD LIMITATIONS
 STANDARD LIMITATIONS This report was prepared by MMM Group (MMM) for the account of Spire Construction Inc. (the Client). The disclosure of any information contained in this report is the sole responsibility
Section 5.0 Traffic Information
 Section 5.0 Traffic Information 10.0 TRANSPORTATION MDM Transportation Consultants, Inc. (MDM) has prepared an evaluation of transportation impacts for the proposed evaluation for the expansion of the
RICHMOND OAKS HEALTH CENTRE 6265 PERTH STREET OTTAWA, ONTARIO TRANSPORTATION BRIEF. Prepared for: Guycoki (Eastern) Limited.
 Limited.") RICHMOND OAKS HEALTH CENTRE 6265 PERTH STREET OTTAWA, ONTARIO TRANSPORTATION BRIEF Prepared for: Guycoki (Eastern) Limited June 16, 2016 116-638 Brief_1.doc D. J. Halpenny & Associates Ltd. Consulting
RICHMOND OAKS HEALTH CENTRE 6265 PERTH STREET OTTAWA, ONTARIO TRANSPORTATION BRIEF Prepared for: Guycoki (Eastern) Limited June 16, 2016 116-638 Brief_1.doc D. J. Halpenny & Associates Ltd. Consulting