THE FLORIDA TRANSPORTATION COMMISSION HIGHWAY SAFETY REPORT
|
|
|
- Victor Holland
- 6 years ago
- Views:
Transcription
1 THE FLORIDA TRANSPORTATION COMMISSION HIGHWAY SAFETY REPORT CALENDAR YEAR 2007
2 A REPORT BY THE FLORIDA TRANSPORTATION COMMISSION 605 Suwannee Street, Mail Station 9 Tallahassee, Florida Phone: Fax:
3 HIGHWAY SAFETY REPORT FOR CALENDAR YEAR 2007 January 13, 2009

4 2
5 TABLE OF CONTENTS INTRODUCTION 5 STRATEGIC HIGHWAY SAFETY PLAN (SHSP) 1. Aggressive Driving 2. Intersection-Related Crashes 3. Lane Departures THE 4 E S: 1. Engineering 2. Education 3. Enforcement 4. Emergency Services BEST PRACTICES 14 SUMMARY OF FLORIDA S HIGHWAY SAFETY PERFORMANCE FOR SECONDARY PERFORMANCE MEASURE - FLORIDA FATALITY RATE - PERFORMANCE INDICATORS I. CAR AND TRUCK OCCUPANTS FATALITY RATE II. MOTORCYCLISTS FATALITY RATE III. PEDESTRIANS FATALITY RATE IV. BICYCLISTS/PEDALCYCLISTS FATALITY RATE V. OCCUPANT PROTECTION USAGE AND FATALITY RATE VI. YOUNG DRIVERS FATAL CRASH RATE VII. ALCOHOL-RELATED FATAL CRASH RATE APPENDIX HIGHWAY SAFETY GRANTS PROGRAM 41 3
6 4
7 INTRODUCTION The Department of Transportation has identified Safety as the single most important recurring, underlying theme throughout its programs. Secretary Stephanie Kopelousos has included Safety among her Vital 4 Vision of Safety, Mobility, Service, and Funding. Safety permeates throughout the design, construction, maintenance, and operations programs of the Department. In addition to the funds committed to safety as part of those programs, a separate Safety program provides funding for: Hazard Elimination Rail-Highway Grade Crossings Traffic Safety Grants Motor Carrier Safety Assistance Pedestrian/Bicycle Safety Community Traffic Safety Teams However, given the state s national ranking in fatalities and fatality rates, a greater emphasis on measuring the effectiveness of the Department s safety program is warranted. The Performance Measures Working Group convened in 2005 with one objective being to develop and adopt a new safety performance measure. After several meetings, the Working Group concluded that a separate report was needed to convey a more comprehensive overview of the Department s highway safety program. The safety performance measure as presented in the annual Performance and Production Review of the Department was revised and a series of highway safety indicators were identified to aid in assessing the condition of highway safety in Florida. The Florida Transportation Commission advocates elevating the visibility of these statistics, which will serve as a catalyst for action by the Department and its highway safety partners in reducing, where possible, the incidence of highway fatalities and fatal crashes. The purpose of this report is to provide an update on the new Secondary Performance Measure and several safety indicators to assist the Department in assessing the outcomes derived from investments in the safety programs it administers. The Florida Transportation Commission recognizes that there are many factors that are beyond the Department s control that contribute to highway fatalities. These include, but are not limited to: Driver skill levels and impairment; Use of safety equipment; Vehicle condition; and Road and weather conditions. 5
8 Safety Office Mission Continually improve the safety of users of Florida's highway system, the safety of Department employees, and the Department's preparation for, response to, and recovery from natural and manmade emergencies. S a f e t y O f f i c e G o a l s 1. Decrease the frequency, rate, and severity of, and potential for, crashes involving motor vehicles, pedestrians, and bicycles on public roads in Florida through the implementation of comprehensive safety programs involving engineering, enforcement, education and/or emergency services. 2. Provide procedures, training, and awareness activities that foster safe work practices and workplaces for Department employees. 3. Provide plans and procedures to guide, direct, and improve the Department's preparedness for, response to, and recovery from workplace, local, and state emergency events. 6
9 Florida Department of Transportation (Department) 2006 Strategic Highway Safety Plan (SHSP) The purpose of the SHSP is to strategically focus funding and other resources on those problem areas where the opportunity for improvement is greatest, as measured by reductions in fatalities and serious injuries. Improving the safety of Florida s surface transportation system for residents and visitors is the unifying goal of Florida s safety community and the overarching goal of the SHSP. The SHSP identifies strategic safety priorities in both public and private agencies and organizations at national, state, regional and local levels. The federal transportation act of 2005, Safe, Accountable, Flexible, and Efficient Transportation Equity Act: A Legacy for Users (SAFETEA-LU), places more emphasis on funding for highway safety than prior acts. Each state transportation department is required to develop and implement a SHSP after consultation with major safety stakeholders (metropolitan planning organizations, traffic enforcement officials, motor vehicle administration officials, motor carrier safety officials, and other state and local safety stakeholders). The resulting state SHSP must: Address all of the 4E s (Engineering, Enforcement, Education and Emergency Services) as key factors in evaluating highway projects; Identify and analyze safety problems and opportunities; Include a crash data system that can perform problem identification and countermeasure analysis; Establish strategic and performance-based goals that focus resources on areas of greatest need; Advance state traffic records data collection, analysis and integration with other safety data sources; and Establish an evaluation process to assess results. A Memorandum of Understanding (MOU) was completed and transmitted as a part of the SHSP that was approved in September The MOU was executed by the following organizations: Florida Department of Transportation FDOT Motor Carrier Compliance Federal Highway Administration Federal Motor Carrier Safety Administration Florida Department of Highway Safety and Motor Vehicles Florida Highway Patrol Florida Department of Education Florida Department of Health Florida Sheriffs Association Florida Police Chiefs Association Metropolitan Planning Organization Advisory Council Florida Operation Lifesaver 7
10 Florida Department of Transportation (Department) 2006 Strategic Highway Safety Plan (SHSP) Florida s Strategic Highway Safety Plan is focusing on four Emphasis Areas that are targeted towards reducing the rate of fatalities and serious injuries. The goal of the SHSP is to improve the safety of Florida s surface transportation system by achieving a five percent annual reduction in the rate of fatalities and serious injuries beginning in The Department achieved its goal of a 5% reduction in fatalities in 2007 (see page 18). 1. Aggressive Driving: Enhance and promote effective law enforcement programs to reduce aggressive driving; Increase education and training to address aggressive driving behaviors; and, Identify and mitigate roadway features that may cause aggressive driving. 2. Intersection Crashes: Increase the safety of intersections for all users; Strengthen traffic enforcement at intersections; and, Increase educational efforts concerning intersection behavior, design and engineering. 3. Vulnerable Road Users Provide local and state agencies with data, skills, and tools to identify effective safety counter measures for pedestrians, cyclists, and motorcyclists in the areas of engineering, education, enforcement, and emergency response; and, Establish consistent mobility strategies. 4. Lane Departure Crashes Improve public education, engineering and law enforcement practices to reduce lane departure crashes on limited access and rural two-lane roadways. 8
11 Fatalities Highway Safety Report for Calendar Year 2007 AGGRESSIVE DRIVING Aggressive driving behaviors include any event of: speeding, failure to yield the right-of-way, improper lane change, following too closely, improper passing or disregarding other traffic control devices. The Department funds Aggressive Driving programs utilizing National Highway Traffic Safety Administration (NHTSA) Highway Safety Program Funds and has expended over $13 million since 2003 to reduce the incidence of aggressive driving. Effective law enforcement and increased training and education are the main strategies employed to curb aggressive driving. Aggressive Driving Performance Indicator: Percent of Aggressive Driving fatalities to total fatalities Aggressive Driving Fatalities n/a n/a n/a 1,111 1,254 1,264 1,219 1,260 Total Fatalities n/a n/a n/a 3,169 3,244 3,543 3,365 3,221 % of Aggressive Driving Fatalities to Total Fatalities n/a n/a n/a 35.1% 38.7% 35.7% 36.2% 39.1% Performance Indicator: Change in Florida's Aggressive Driving rate compared to the previous year's rate Aggressive Driving Fatalities n/a n/a n/a 1,111 1,254 1,264 1,219 1,260 Rate Change From Prior Year n/a n/a n/a 0.0% 3.6% -3.0% 0.5% 2.9% n/ % Change From Prior Year n/a n/a a 0.0% 10.3% -7.7% 1.5% 8.0% Florida's Aggressive Driving Fatalities Compared to Florida's Total Fatalities % 35.7% 35.1% 36.2% 39.1% % 35.0% % Aggressive Driving Fatalities Total Fatalities % of Aggressive Driving to Total 9
12 Fatalities Highway Safety Report for Calendar Year 2007 INTERSECTION-RELATED CRASHSES Reducing intersection crashes involves engineering solutions as well as educational efforts. The Department has invested over $47 million since 2003, with all but $500 thousand being utilized in infrastructure improvements. Improving intersection design and operation is a key strategy for addressing this issue. Enforcement of obeying traffic devices, speed and laws governing intersections, coupled with education are also effective strategies. Intersection Crashes Performance Indicator: Percent of Intersection-related fatalities to all fatalities Intersection Related n/a n/a n/a , All Florida Fatalities n/a n/a n/a 3,169 3,244 3,543 3,365 3,221 % of Intersection Related Fatalities to All Florida Fatalities n/a n/a n/a 29.3% 29.8% 28.5% 29.2% 30.4% Performance Indicator: Intersection-Related Change in Florida's Intersection-related crash rate compared to the previous year's rate Fatalities n/a n/a n/a , Rate Change From Prior Year n/a n/a n/a 29.3% 0.5% -1.2% 0.6% 1.1% % Change From Prior Year n/a n/a n/a 0.0% 1.6% -3.9% 2.2% 3.8% Florida's Intersection-Related Fatalities Compared to Florida's Total Fatalities % 28.5% 29.8% 29.2% 30.4% 31.9% % Intersection Related Fatalities Total Fatalities % of Intersection Related to Total 10
13 Fatalities Highway Safety Report for Calendar Year 2007 LANE DEPARTURES Lane departure crashes include running off the road, crossing the center median into an oncoming lane of traffic, and sideswipe crashes. Running off the road may also involve a rollover or hitting a fixed object. To reduce the incidence of fatalities, efforts are being made to: (1) keep vehicles from leaving the road or crossing the median; (2) reduce the likelihood of vehicles overturning or crashing into roadside objects; and (3) minimize the severity of an overturn. Engineering is a key strategy with enhanced education of motorists also being an effective strategy. Lane Departures Performance Indicator: Percent of Lane Departure fatalities to total fatalities Lane Departure Fatalities n/a n/a n/a 2,806 2,885 3,280 3,125 2,974 Total Fatalities n/a n/a n/a 3,169 3,244 3,543 3,365 3,221 % of Lane Departure Fatalities to Total Fatalities n/a n/a n/a 88.5% 88.9% 92.6% 92.9% 92.3% Performance Indicator: Change in Florida's Lane Departure rate compared to the previous year's rate Lane Departure Fatalities n/a n/a n/a 2,806 2,885 3,280 3,125 2,974 Rate Change From Prior Year n/a n/a n/a 88.5% 0.4% 3.9% 0.0% -0.5% n/a % Change From Prior Year n/a n/a n/a 0.0% 0.4% 4.4% 0.0% -0.6% Florida's Lane Departure Fatalities Compared to Florida's Total Fatalities % 88.9% 92.9% 88.5% 92.3% 95.8% % % Lane Departure Fatalities Total Fatalities % of Lane Departures to Total 11


14 Highway Safety Report for Calendar Year
15 THE FOUR E S Engineering: This aspect of safety involves the design and maintenance of the roadway, intersections, and shoulders and clear recovery areas. Improving signalization, signage, guardrail, slope, geometry, audibility and visibility of lane delineation are some of the engineering tools employed. The Department also removes obstructions and installs canal protection devices to reduce the severity of injury if a lane departure occurs. Enforcement: Enforcement of Florida s traffic laws on all public roads (state, county, and city) is the responsibility of the following law enforcement agencies: FDOT Office of Motor Carrier Compliance; Florida Highway Patrol (FHP); Florida Wildlife Conservation Commission; County Sheriffs, within their county boundaries; and, City police, within their city limits. Education: Traffic safety education of the public ranges from programs for young children to those tailored for elders, and it includes such topics as vehicle operator skills and vehicle safety, use of safety restraints, operator impairment (drugs or alcohol), emergency preparedness, pedestrian and bicycle safety, information on new laws or technologies, etc.. Many agencies educate or train in highway safety-related areas. Emergency Services: This category includes first responders and support agencies that prepare for, respond to, and assist in recovery efforts from natural disasters and other emergencies. Some agencies respond to individual crashes with medical and other services. Other agencies operate traffic and incident management systems using intelligent transportation systems (ITS) technology during traffic incidents, emergencies, and planned events to inform and re-route traffic, prevent secondary incidents and coordinate rapid emergency response. 13
16 Best Practices and Legislative Proposals: Best Practices for Motorcyclists: Wear appropriate attire, including a DOT approved helmet, a jacket, gloves, and boots while riding. Complete a Florida Rider Training Program to acquire an official endorsement Share the Road (all motorists) Never ride impaired Motorcycle Safety Legislation: Effective July 1, 2008, all first-time applicants for licensure to operate a motorcycle must provide proof of completion of a motorcycle safety course (Florida Rider Training Course). Section (5)(a), Florida Statutes. Possible Legislative Proposals: Reinstate the helmet law. Impose stronger penalties for repeat offenders. Best Practices for Impaired Driving: High-visibility enforcement coupled with wide-spread media messages and DUI checkpoints are popular practices that bring mixed results. As in many safety programs, a combined enforcement and media campaign is generally more effective than either component alone. Potential Department Legislative Proposal: Although a reduction of the blood alcohol limit, triggering enhanced penalties from 0.20 to 0.15 was enacted in 2008, a glitch in the bill continues to keep the state from relying on it as a criteria to qualify for impaired driving monies, which totaled $6.4 million in
17 Best Practices and Legislative Proposals (cont d) Best Practices for Occupant Protection: According to the Emergency Nurses Association 2008 Annual Scorecard on State Roadway Laws, the most effective evidence-based strategy for attaining and sustaining high safety belt use is strong laws, enforcement and publicity (primary laws, high-visibility enforcement and high-publicity to raise awareness). Possible Legislative Proposals: Enact a primary safety belt law that will entitle the state to receive over $35 million in safety funding. If legislation is passed, a bill must be enacted by June 30, 2009 and enforcement must occur by September 30, Enact a booster seat law which would qualify the state for funding in this area, for which Florida has not previously been able to qualify. Best Practices to address Aggressive Driving and Speeding: As in other safety program areas, high-visibility enforcement waves coupled with strong media messages are popular and often effective in deterring aggressive driving and speeding. An example is the Florida Highway Patrol s 4 on 4 Campaign, which focused on speeding and aggressive driving along Interstate 4 in four counties. However, long term results from education and changes in driving behavior are mixed. Legislation related to Speeding: In 2005, legislation was enacted to create Enhanced Penalty Zones to reduce speeding related crashes. Zones are established in Brevard, Duval, and Palm Beach Counties along Interstate 95 as a pilot program. These zones are highly visible with appropriate signage and were preceded by a comprehensive media campaign and a one month adjustment period. Enforcement efforts in the zones began May 1, 2007, and the program will sunset July 1, 2010, if not re-enacted by the legislature. Drivers detained for speeding in an enhanced penalty zone are required to pay an additional $50 fine, which has been dedicated by the legislature as half to the Agency for Health Care Administration and half to the Department of Health Administrative Trust Fund. [Sections , (3)(e), (15), Florida Statutes]. 15


18 Best Practices and Legislative Proposals (concluded) Best Practices for Teen Drivers: Limit the number of passengers under the age of 18 riding with teen drivers. Never drive impaired [38.6% of traffic fatalities and 8.9% of traffic crashes in 2007 were alcohol related]. Increase driver education and continually improve driving skills courses. Make sure everyone in the car is properly secured by a seatbelt before operating your vehicle. Never drive aggressively. Always drive defensively. Be alert at all times [Distractions such as cell phones could cost you your life]. Possible Legislative Proposals: Establish a limit on the number of passengers under the age of 18 that can ride with a driver age 18 or younger. Increase the number of hours a restricted licensed driver must have prior to applying for an operator s license from 50 to 75. Increase the length of time a learner s permit is held. Require all public high schools to provide mandatory drivers education classes for all students and provide necessary funding. Impose stronger penalties for repeat offenders under the age of 21. Establish a primary safety belt law in Florida. 16
19 SUMMARY OF FLORIDA S HIGHWAY SAFETY PERFORMANCE FOR 2007 Motor vehicle travel is the primary means of transportation in the United States, providing an unprecedented degree of mobility. However, this exceptional degree of mobility comes at a significant cost in terms of fatalities and injuries. According to the National Highway Transportation Safety Administration (NHTSA) motor vehicle crashes are the leading cause of death for persons of every age from 3 through 33. Traffic fatalities account for more than 90 percent of transportation related fatalities. Florida traffic crash statistics are gathered on a calendar year basis and are reported to NHTSA in the following calendar year. The data is generally available during the fall of the year following the statistical year. (2007 data available in the fall of 2008). For Calendar Year 2007: Total Highway Fatalities: State mileage death rate decreased to 1.57 deaths per 100 million vehicle miles traveled (VMT) in 2007 (lowest in state history). Traffic fatalities in 2007 decreased approximately 4.3% (144 fatalities) from 2006 when 3,365 died on Florida highways. This was the second consecutive year that traffic fatalities have decreased. Car and Truck Occupants: The fatality rate fell to.98 per 100 million VMT and is 3.1% below the national average of Motorcyclists: The fatality rate declined slightly to per 100,000 registered motorcycles, exceeding the national average of by 31.1%. Pedestrians: The fatality rate declined by 6.0% to 2.84 per 100,000 population, however, the Florida rate is 83.9% above the national average of Bicyclists/Pedalcyclists: The fatality rate declined to.65 per 100,000 population (from.70 in 2006) but rose to 179.9% above the national average of.23. Occupant Protection: Although the use of occupant safety restraints decreased to 79.1%, the fatality rate of those unrestrained decreased (to.58 per 100 million VMT). Young Drivers: The fatal crash rate for drivers under age 25 declined slightly to 4.93 per 10,000 licensed drivers, but rose to 116% above the national average. Alcohol-Related: The fatal crash rate rose by 10.2% to 1,119 fatal crashes. Alcohol-related crashes account for 38.0% of all Florida fatal crashes. 17
20 FLORIDA S FATALITY RATE COMPARED TO THE NATIONAL RATE This secondary performance measure is statewide in scope and covers the key areas of safety performance on all public roads in Florida. Although not under the full control of the Department of Transportation, this measure brings attention to the necessity for comprehensive statewide solutions. This secondary performance measure is also reported in the Commission s Performance and Production Review of the Florida Department of Transportation. Secondary Measure: Florida s highway fatality rate per 100 million vehicle miles traveled (VMT) compared to the national highway fatality rate. Objective: Bring Florida s fatality rate to within 5% of the national rate by FY Secondary Measure: Florida's highway fatality rate per 100 million vehicle miles traveled (VMT) compared to the national highway fatality rate Florida Fatality Rate National Fatality Rate % Florida over National Rate 16.8% 15.2% 14.7% 19.9% 16.0% 14.6% Secondary Measure: Florida's highway fatality rate per 100 million vehicle miles traveled (VMT) compared to the previous year s rate. Florida Fatality Rate Rate Change from Prior Year % Change from Prior Year -0.2% -2.8% -3.3% 6.0% -5.7% -5.0% 18
21 Fatality Rate Per 100 Million VMT Fatality Rate Per 100 Million VMT Highway Safety Report for Calendar Year 2007 PERFORMANCE MEASURE An important measure for gauging progress is the change in fatality rate from year to year. Although the Department does not have full control of all factors relating to this measure, the funding commitments the Department makes to safety programs should have an impact on reducing the fatality rate over the previous year. Total Highway Fatalties Florida Rate Compared to National Rate (Objective: within 5% of National Rate) % 16.7% 15.2% 14.2% 16.0% 14.6% % 20.0% 15.0% 10.0% % % Florida Fatality Rate National Fatality Rate % Over National Average Total Highway Fatalities - Fatality Rate Change From Prior Year % -0.2% % -5.7% -5.0% -2.8% 8.0% 6.0% 4.0% 2.0% 0.0% -2.0% -4.0% -6.0% -8.0% Florida Fatality Rate % Change from Prior Year 19
22 HIGHWAY SAFETY PERFORMANCE INDICATORS The following indicators were developed and approved by the Florida Transportation Commission s Performance Measures Working Group as a tool to assess the Department s ability, through its safety program funding and management, to affect the various demographic components that comprise the overall fatality rate. CAR AND TRUCK OCCUPANTS FATALITY RATE FLORIDA RATE COMPARED TO NATIONAL RATE Safety Indicator: Florida's car and truck occupant fatality rate per 100 million vehicle miles traveled (VMT) compared to the national car and truck occupant fatality rate. Florida Fatality Rate National Fatality Rate % Florida over National Rate 3.8% 1.4% -0.7% 4.6% -3.6% -3.1% Short Range Objective: By 2011, reduce Florida's car and truck occupant highway fatality rate on all public roads to 10% below the national car and truck fatality rate. Safety Indicator: Florida's car and truck occupant fatality rate per 100 million vehicle miles traveled (VMT) compared to the previous year s rate. Florida Fatality Rate Rate Change from Prior Year % Change from Prior Year 0.8% -4.8% -5.7% 4.0% -10.7% -4.8% Short Range Objective: By 2011, reduce Florida's car and truck occupant highway fatality rate on all public roads to or below 0.7 per 100 million VMT. 20
23 Fatality Rate Per 100 Million VMT Fatality Rate Per 100 Million VMT Highway Safety Report for Calendar Year 2007 FLORIDA S CAR AND TRUCK FATALITY RATE The Car and Truck Occupant Fatality Rate, and the change in rate over the previous year, have been fluctuating over the past several years. After a significant increase in 2005, the fatality rate has declined in both 2006 and 2007 and remains below the national average. Florida's Car and Truck Occupant Fatality Rate Per 100 Million VMT (Objective: 10% below National Rate) % 1.4% -0.7% 4.6% % -3.1% % 4.0% 2.0% 0.0% -2.0% -4.0% -6.0% Florida Fatality Rate National Fatality Rate % Over National Average Florida's Car and Truck Occupant Fatality Rate - Change From Prior Year % % 2.0% % % 4.0% -5.7% % % % -2.0% -4.0% -6.0% -8.0% -10.0% % Florida Fatality Rate % Change from Prior Year 21
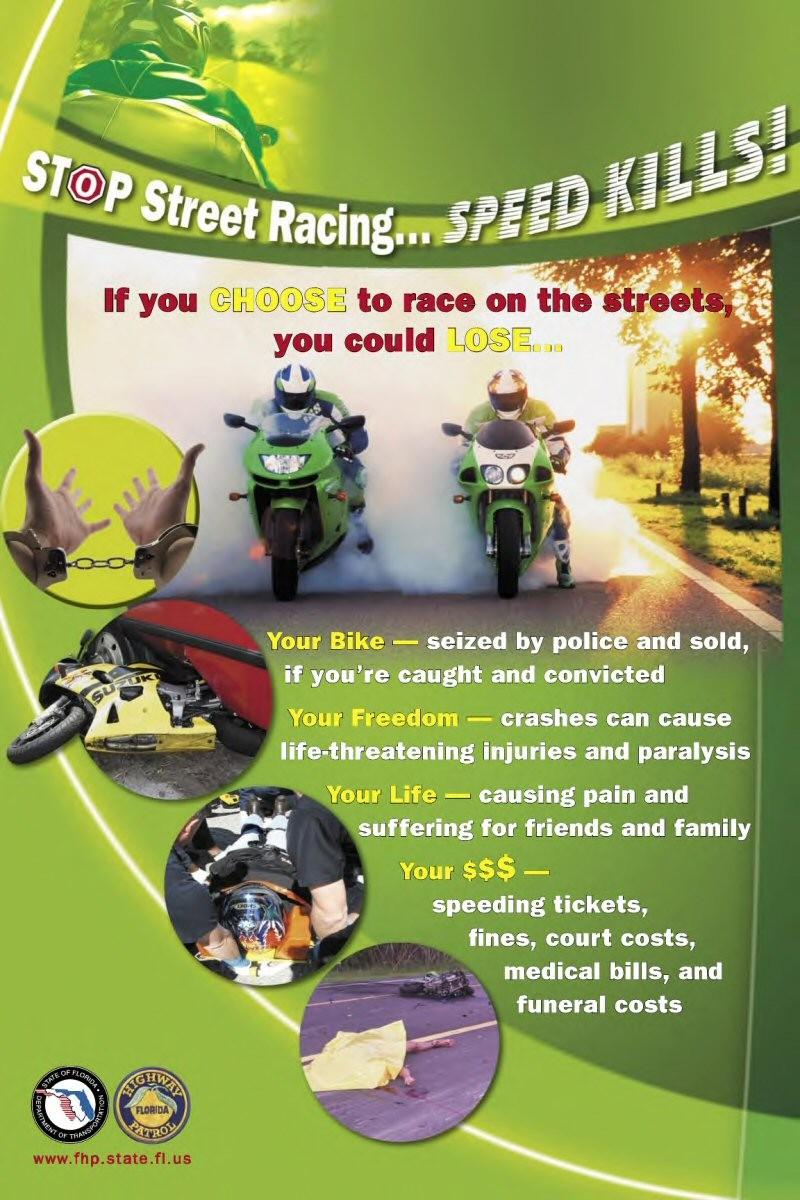
24 MOTORCYCLISTS FATALITY RATE OVERVIEW: Motorcycle fatalities in 2007 remained the same (550) as those reported in The fatality rate fell slightly due to a 2.2% increase in registrations. Continuing motorcycle safety research has identified technology and safety countermeasures that could reduce the probability of casualties and fatalities. Helmets and personal protective equipment worn by motorcyclists provide the primary defense against injury in a crash. Research consistently demonstrates that helmets are the most effective piece of safety gear for motorcycle riders, estimating that helmets are 37% effective in preventing fatal injuries to motorcyclists. A study, Evaluation of the Repeal of the All Rider Motorcycle Helmet Law in Florida, reported that observational surveys and crash reports indicate that helmet use dropped substantially following the repeal and as a result, motorcyclist fatalities increased by 81% in the three years following the law change. BEST PRACTICES: Wear appropriate attire including a DOT approved helmet, protective and conspicuous clothing in the form of jackets, gloves and boots and protective eyewear while riding. Studies indicate that helmets reduce motorcycle rider fatalities by 37% and brain injuries by 65%. Complete a Florida Rider Training Program effective July 1, 2008 all first time applicants for a license to operate a motorcycle, regardless of age (now only required for those under 21) must complete a training course. Implement SAFETEA-LU Section 2010 recommendation for outreach programs to enhance driver awareness of motorcyclists, such as SHARE THE ROAD safety messages. Use DUI checkpoints (a higher percentage of motorcycle operators had blood alcohol levels of.08 or higher than any other motor vehicle drivers). Highly publicize enforcement, using officers trained in identifying impaired motorcyclists as well as other vehicle drivers, with offender sanctions including vehicle impoundment or forfeiture. 22
25 MOTORCYCLISTS FATALITY RATE Florida s motorcycle fatality rate remains well above the national average. Factors contributing to this high rate of fatalities are the repeal of the motorcycle helmet law and a sharp increase in motorcycle sales to the baby boomer generation. FLORIDA RATE COMPARED TO NATIONAL RATE Safety Indicator: Florida's motorcyclist fatality rate per 100,000 registered motorcycles compared to the national motorcyclist fatality rate. Florida Fatality Rate National Fatality Rate % Florida over National Rate 41.3% 34.5% 33.9% 32.3% 33.5% 31.1% Short Range Objective: By 2011, reduce Florida's motorcyclist fatality rate on all public roads to within 10% of the national motorcyclist fatality rate. Safety Indicator: Florida's motorcyclist fatality rate per 100,000 registered motorcycles compared to the previous year s rate. Florida Fatality Rate Rate Change from Prior Year % Change from Prior Year -1.7% 0.7% 0.5% 2.2% 1.0% -2.2% Short Range Objective: By 2011, reduce Florida's motorcyclist fatality rate on all public roads to or below 70.0 fatalities per 100,000 registered motorcycles. 23
26 Fatality Rate Per 100,000 Registered Motorcycles Fatalalities Per 100,000 Registered Motorcycles Highway Safety Report for Calendar Year 2007 MOTORCYCLISTS FATALITY RATE Although the number of fatalities remained unchanged from 2006, the fatality rate declined in 2007 and the difference in the Florida rate and the national rate narrowed slightly. Florida Motorcyclist Fatalities Per 100,000 Registered Motorcycles - National and State Highway System (Objective: Within 10% of National Rate) % 33.9% 34.5% 32.3% 33.5% 31.1% % 40.0% 35.0% 30.0% 25.0% 20.0% 15.0% 10.0% 5.0% 0.0% F lo rida F atality R ate N atio nal F atality R ate % Over N atio nal A verage Florida's Motorcycle Fatality Rate Change From Prior Year % 2.2% -1.7% 0.5% 1.0% -2.2% % 2.0% 1.5% 1.0% 0.5% 0.0% -0.5% -1.0% -1.5% -2.0% -2.5% F lo rida F atality R ate C o lumn 2 % C hange fro m P rio r Year 24
27 PEDESTRIANS FATALITY RATE OVERVIEW: Pedestrian fatalities decreased in 2007 by 6.0% from those reported in 2006 (530 compared to 546, a decrease of 16). Most pedestrian fatalities occur in urban areas, at non-intersection locations, in normal weather conditions, and at night. In addition, alcohol involvement, either for the driver or the pedestrian, was reported in 44% of traffic crashes that involved pedestrians. Of the 530 pedestrians killed in traffic crashes in 2007, 218 (41.1%) had been drinking (an increase of 17.2% over 2006). BEST PRACTICES: Examples of effective education, enforcement, and engineering practices : Santa Ana, California created a Pedestrian Safety Toolkit that included a safety video (with discussion guide), a safety solutions guidebook and neighborhood safety survey. Combined with crosswalk enforcement and school zone enforcement, the 5-12 age group showed a steady decline in injuries and deaths. In conjunction with the federal Safe Routes to School Program, Florida is encouraging the use of the Safe Ways to School Toolkit, which includes information on safe school crossing and safe walk to school programs. Enforcement of pedestrian duty to yield at mid-block locations without crosswalks. Enforcement of motorists duty to yield to pedestrians in crosswalks. Sending warning letters to drivers was associated with a 4% reduction in crashes and a 6% reduction in violations. The Department created tip cards reminding pedestrians in the downtown Tampa area of the need for pedestrian safety and the amount of the fine for jay-walking. These were handed out by local law enforcement. The use of Count Down pedestrian signals are an effective intersection enhancement. Florida uses these signals as well as installing median refuges or islands at larger intersections. 25
28 PEDESTRIANS FATALITY RATE Florida is second in the nation in pedestrian deaths with 530 fatalities in 2007 and a fatality rate of 2.84 per 100,000 population. Though the Florida rate declined in 2007 it remained well above the national average. FLORIDA RATE COMPARED TO NATIONAL RATE Safety Indicator: Florida's pedestrian fatality rate per 100,000 population compared to the national pedestrian fatality rate. Florida Fatality Rate National Fatality Rate % Florida over National Rate 71.9% 77.4% 76.8% 94.8% 88.5% 83.9% Short Range Objective: By 2011, reduce Florida's pedestrian fatality rate on all public roads to within 20% of the national pedestrian fatality rate. Safety Indicator: Florida's pedestrian fatality rate per 100,000 population compared to the previous year's rate. Florida Fatality Rate Rate Change from Prior Year % % Change from Prior Year -2.5% 0.3% -3.9% 14.2% -6.1% -6.0% Short Range Objective: By 2011, reduce Florida's pedestrian fatality rate on all public roads to or below 1.6 fatalities per 100,000 population. 26
29 Fatality Rate Per 100,000 Population Fatalities Per 100,000 Population Highway Safety Report for Calendar Year 2007 PEDESTRIANS FATALITY RATE Florida Pedestrian Fatalities Per 100,000 Population - National and State Highway System (Objective: Within 20% of National Rate) % % % % % % % 80.0% 60.0% % 20.0% 0 0.0% Florida Fatality Rate National Fatality Rate % Over National Average Florida Pedestrian Fatality Rate - Change From Prior Year % -2.5% 0.3% -6.0% -3.9% -6.1% % 15.0% 10.0% 5.0% 0.0% -5.0% % Florida Fatality Rate % Change from Prior Year 27
30 BICYCLISTS/PEDALCYCLISTS FATALITY RATE OVERVIEW: Bicyclist fatalities declined by 7.0% in 2007 from those reported in 2006 (from 126 to 121, a decrease of 5). Fatal bicycle crashes exhibit the same patterns as pedestrian fatal crashes in that most (60%) occur in conditions other than daylight. Road users have failed to appreciate the magnitude of the problem and cyclists have failed to appreciate the benefits of reflective gear or lights. Recent work suggests that educational interventions can increase road users awareness of the need to be conspicuous and can demonstrate behaviors that increase nighttime safety. BEST PRACTICES: Education and enforcement appear to be the most effective means for reducing bicyclist fatalities. Engineering improvements would include adding bicycle lanes when constructing or reconstructing highways. Examples of education and enforcement activities include: Share the Road awareness campaigns. Educational programs focusing on riding with traffic, not against traffic. Educational programs emphasizing the benefits of wearing a helmet and reflective clothing and using reflectors and lights at night. Enforcement programs that provide warnings or tickets to bicyclists that violate traffic regulations related to riding in the wrong direction, running red lights, making illegal turns, or riding at night without functioning lights. All of the identified educational programs are currently being used in Florida. 28
31 BICYCLISTS/PEDALCYCLISTS FATALITY RATE The Department s impact on this indicator is limited to the planning and designing of bikeways in new construction and the widening of highway projects. Education for drivers and bicyclists along with enforcement of traffic laws will also have an impact on reducing this fatality rate. Although the fatality rate declined in 2007, it has continued to remain well above the national average. Bicyclists Fatality Rate Florida Rate Compared to National Rate Safety Indicator: Florida's bicyclist fatality rate per 100,000 population compared to the national bicyclist fatality rate. Florida Fatality Rate National Fatality Rate % Florida over National Rate 183.3% 171.9% 184.6% 151.1% 169.8% 179.9% Short Range Objective: By 2011, reduce Florida's bicycle fatality rate on all public roads to within 50% of the national bicyclist fatality rate. Safety Indicator: Florida's bicyclist fatality rate per 100,000 population compared to the previous year s rate. Florida Fatality Rate Rate Change from Prior Year % Change from Prior Year -15.2% -10.3% 17.7% -4.6% 4.9% -7.0% Short Range Objective: By 2011, reduce Florida's bicyclist fatality rate on all public roads to or below 0.4 fatalities per 100,000 population. 29
32 Fatality Rate Per 100,000 Population Fatalities Per 100,000 Population Highway Safety Report for Calendar Year 2007 BICYCLISTS/PEDACYCLISTS FATALITY RATE Florida Bicyclist Fatalities Per 100,000 Population - National and State Highway System % (Objective: Within 20% of National Rate) 171.9% 184.6% 151.1% 169.8% 179.9% % 180.0% 160.0% 140.0% 120.0% 100.0% 80.0% 60.0% 40.0% 20.0% 0.0% Florida Fatality Rate National Fatality Rate % Over National Average Florida Bicyclist Fatality Rate - Change From Prior Year % -10.3% 17.7% -4.6% 4.9% -7.0% 30.0% 15.0% 0.0% % -30.0% Florida Fatality Rate % Change from Prior Year 30
33 OCCUPANT PROTECTION USAGE AND FATALITY RATE OVERVIEW: Fatalities for unrestrained car and truck occupants decreased by 7.7% in 2007 as compared to 2006 (from 1301 to 1201 a decrease of 100). Safety belt usage decreased to 79.1% (from 80.7% in 2006). Usage of safety belts varies widely from state to state, reflecting factors such as differences in public attitudes, enforcement practices, legal provisions, and public information and education programs. In fatal crashes, 75% of passenger vehicle occupants who were totally ejected from vehicles were killed. Only 1% of occupants reported to have been using safety belts were totally ejected compared to 30% of the unrestrained occupants. BEST PRACTICES: An overall program that includes a public awareness campaign, increased enforcement and a primary safety belt law has proven to be the best strategy to both increase safety belt usage and decrease the number of injuries and fatalities attributed to not wearing safety belts. Examples of effective campaigns: North Carolina s Click It or Ticket campaign, which Florida has adopted, increased safety belt usage from 62% before the campaign to over 80% afterwards, thereby reducing fatal and serious traffic-related injuries by 14%. Washington State passed its primary seat belt law in Prior to the effective date of the law, Washington participated in the national Memorial Day Click It or Ticket campaign and continued the efforts into the summer. Safety belt usage increased across all drivers, with the largest increase (20.9%) in the under age 20 category. Click It or Ticket awareness waves that are sustained and that do not occur only during media campaign blitzes are effective. 31
34 OCCUPANT PROTECTION USAGE AND FATALITY RATE The Department s participation in such programs as Click It or Ticket are indicative of the partnerships that can have an impact on these rates. FLORIDA USAGE AND FATALITY RATES Safety Indicator: Florida Occupant Protection Usage Percentage % of Usage 75.1% 72.6% 76.3% 73.9% 80.7% 79.1% Performance Indicator: Florida's car and truck unrestrained occupant fatality rate per 100 million vehicle miles traveled (VMT) compared to Florida s car and truck all occupant fatality rate. Florida Unrestrained Car & Truck Occupant Fatality Rate Florida Car & Truck Occupant Fatality Rate % Unrestrained to All 63% 59.7% 61.1% 55.1% 61.9% 59.5% Safety Indicator: Florida's car and truck occupant fatality rate compared to the previous year's rate. Florida Unrestrained Car & Truck Occupant Fatality Rate Rate Change From Prior Year % Change From Prior Year 1.4% -10.7% -4.5% 0.0% 0.0% -0.05% 32
35 Fatality Rate Per 100 Million VMT Fatalities Per 100 Million VMT Percentage Highway Safety Report for Calendar Year 2007 OCCUPANT PROTECTION USAGE AND FATALITY RATE Florida Occupant Protection Usage Percentage 100% 75.1% 72.6% 76.3% 73.9% 80.7% 79.1% 50% 0% Usage Percentage Florida's Car and Truck Unrestrained Fatality Rate Compared to Florida's All Occupant Rate % 63.0% 59.7% % % % 58.0% % 60.0% 55.0% % 2001 Unrestrained Rate All Occupant Rate % of Unrestrained to All 2.00 Florida Unrestrained Occupant Fatality Rate - Change From Prior Year 5.0% % % % % % % % -5.0% -10.0% -15.0% Unrestrained Occupant Rate % Change from Prior Year 33
36 YOUNG DRIVERS FATAL CRASH RATE OVERVIEW: Fatal crashes involving young drivers (under the age of 25) decreased by 4.9% in 2007 compared to 2006 (from 1,081 to 1,036, a decrease of 45). Young drivers are more likely to engage in risky driving behaviors, such as speeding and tailgating, and lacking experience, they are the least able to cope with hazardous situations. Focus group studies indicate that teens do not see anything wrong with underage drinking, only buckle up with safety belts from fear of enforcement, are distracted by too many occupants (particularly other teens), and feel the need to speed. BEST PRACTICES: Limit the number of passengers under the age of 18 riding with teen drivers. The risk of a crash involving a teen driver increases with each additional teen passenger in the vehicle. Improve the process of testing young drivers to obtain a drivers license. Enhance the Graduated Drivers License (GDL) program and enforce compliance. Enhancements could include requiring more driving hours with a restricted license before being eligible for a license; requiring more adult supervisory hours; limiting eligible nighttime hours of driving; and limiting the number of teens allowed as passengers for a longer period. Enhance driver education opportunities. Enhance enforcement of driver license restrictions and safety belt usage, and increase DUI checkpoint opportunities. In Florida, drivers under 17 years of age, when operating a motor vehicle after 11 p.m. and before 6 a.m., must be accompanied by a driver who holds a valid driver s license and is at least 21 years of age, unless that person is driving directly to or from work. Also, drivers who are 17 years of age have the same requirement during the hours after 1 a.m. and before 5 a.m., unless driving directly to or from work. Safety belt usage for all drivers and occupants under the age of 18 is mandatory. 34
37 YOUNG DRIVERS FATAL CRASH RATE Drivers under the age of 25 are more than twice as likely to be involved in a fatal crash than a driver 25 years of age or older. The Department has limited ability to affect this indicator. FLORIDA FATAL CRASH RATES Safety Indicator: Rate per 10,000 licensed drivers of young drivers (under age 25) involved in fatal crashes compared to drivers aged 25 or older. Rate of Young Drivers Involved in Fatal Crashes Rate of Drivers 25 and Older Involved in Fatal Crashes % of Young Drivers versus Drivers Aged 25 and Older 92.4% 101.4% 102.8% 106.1% 114.5% 116.0% Safety Indicator: Rate per 10,000 licensed drivers of young drivers (under age 25) involved in fatal crashes compared to previous year s rate. Rate of Young Drivers Involved in Fatal Crashes Rate Change From Prior Year % Change From Prior Year -1.1% 2.3% 1.4% 8.8% -1.8% -4.9% 35
38 Fatal Crashes Per 10,000 Licensed Drivers Fatal Crashes per 10,000 Licensed Drivers Highway Safety Report for Calendar Year 2007 YOUNG DRIVERS FATAL CRASH RATE Florida's Fatal Crash Rate of Young Drivers (under age 25) Compared to Older Drivers (over age 25) % % 106.1% 102.8% % % % 120.0% 100.0% 80.0% 60.0% 40.0% % % Rate of Young Drivers Rate of Older Drivers % Of Young Drivers to Older Drivers Florida's Young Drivers Fatal Crash Rate - Change From Prior Year % -1.1% 2.3% -1.8% 1.4% -4.9% % 10.0% 8.0% 6.0% 4.0% 2.0% 0.0% -2.0% -4.0% -6.0% Young Drivers % Change from Prior Year 36
39 ALCOHOL-RELATED FATAL CRASH RATE OVERVIEW: Alcohol-related fatal crashes increased by 10.2% in 2007 compared to 2006, with an increase of 112 fatal crashes. Alcohol-related fatal crashes are not just restricted to passenger vehicles; fatal crashes also involve impaired motorcyclists, bicyclists, and pedestrians. Efforts over the past 20 years have had significant impacts on the reduction in alcohol-related fatal crashes. Legislation lowering the allowable blood alcohol limit, DUI checkpoints and saturation waves along with public service announcements and public education have contributed to the reduction in alcohol-related fatal crashes. However, the most recent data indicates not only an increase in the absolute numbers of fatal crashes, but also an increase in the fatal crash rate associated with impaired driving. BEST PRACTICES: Starting January 1, 2009, all high Blood Alcohol Content (BAC) and repeat offenders will be required, by law, to have Ignition Interlock Devices (IID s) installed in Florida. Checkpoints: frequent, highly publicized DUI checkpoints are one of the best ways to reduce impaired driving crashes and fatalities. While saturation patrols produce more DUI arrests, checkpoints have proven to produce more of a deterrent effect (at least 400 checkpoints are conducted in Florida each year). Checkpoint Brevard (Brevard County, Florida): The 25 checkpoints produced 113 arrests and 40 drug arrests, resulting in the lowest number of people killed in alcohol-related crashes in 20 years. Alcohol-related crashes have increased since the program was discontinued. Education and public service announcements are somewhat effective. Enforcement of strict DUI laws and driver license suspensions can be very effective. 37
40 ALCOHOL-RELATED FATAL CRASH RATE More than one-third (38%) of all Florida fatal crashes involve alcohol. The fatal crash rate increased by 10.2% and is the highest it has been in six years. Of drinking drivers in crashes, 21 year old drivers had the highest involvement rate in all crashes and in fatal crashes. CRASH RATE Safety Indicator: Percent of alcohol-related fatal crashes to all fatal crashes. Florida Alcohol-Related Fatal Crashes ,112 1,007 1,119 All Florida Fatal Crashes 2,816 2,880 2,936 3,205 3,084 2,947 % Alcohol-Related Fatal Crashes 31.7% 34.6% 34.0% 34.7% 32.7% 38.0% Safety Indicator: Florida's alcohol-related crash rate per 100 million vehicle miles traveled (VMT) compared to the previous year's rate. Florida Alcohol-Related Fatal Crash Rate Rate Change From Prior Year % Change From Prior Year -4.0% 7.2% -5.5% 7.8% -10.7% 10.2% 38
41 Alcohol-Ralted Crash Rate Per 100 Million VMT Fatal Crashes Highway Safety Report for Calendar Year 2007 ALCOHOL-RELATED FATAL CRASH RATE Florida's Alcohol-Related Fatal Crash Rate % 34.6% 34.0% 34.7% 32.7% % % 35.0% 31.0% 27.0% 23.0% 19.0% 15.0% 11.0% 7.0% 3.0% -1.0% Alcohol-Related Crash Rate All Fatal Crashes % of Alcohol-Related Fatal Crashes 2.00 Alcohol-Related Crashes - Change From Prior Year 7.2% 7.8% 10.2% 15.0% 10.0% 5.0% % -5.5% -10.7% % -5.0% -10.0% -15.0% Alcohol-Related Crash Rate % Change from Prior Year 39
42 References For National Statistics: NHTSA s National Center for Statistics and Analysis, 2007 NHTSA s Annual Assessment of Motor Vehicle Crashes, 2007 For Florida Statistics: Florida Department of Highway Safety and Motor Vehicles Annual Performance Report Florida Department of Transportation Safety Office 40
43 Appendix Florida Department of Transportation Highway Safety Grants Program 41
44 Highway Safety Grant Program (December 2008) The Department of Transportation (Department) is responsible for the administration of the Highway Safety Grant Program which awards federal grants to not-for-profit organizations and state and local agencies to implement specific traffic safety programs. These safety programs relate to traffic enforcement, public information, education, and emergency services. For federal fiscal year , the Department anticipates receiving approximately $10,000,000 to be awarded to address a variety of traffic safety issues such as: speed enforcement, alcohol countermeasures, pedestrian/bicycle safety, motorcycle safety, promotion and enforcement of safety belt and child safety seat usage, and support of local Community Traffic Safety Teams. The Grant Program also promotes safety through ongoing information and educational activities statewide. The Department s safety office has applied for and has been advised that it has qualified for and will receive additional grant funding in certain program areas including the improvement of crash data systems, motorcycle safety, and impaired driving. On the other hand, the Department continues to be ineligible for certain grant funding because Florida has been unable to pass either a primary safety belt law or the federally required level of statutory safeguards for child booster seats for funding purposes. Passage of a qualifying primary safety belt law would result in a one time allocation to the state of over $35,000, is Florida s last opportunity to receive these funds. Qualifying legislation must be in effect by June 30, 2008, and the law must be enforced by September 30, 2008, to receive the funding. In 2008, Florida passed legislation that reduced the hard core drunk driving limit from 0.20 to However, it was enacted too late and failed to contain required language that would enable the Department to utilize the law to qualify for impaired driving grant funds in FY Fortunately, because the Department identified and met other qualifying criteria, the Department received $6.4 million in federal funds to address impaired driving issues in FY An attempt will be made to rework the 2008 legislation to qualify for FY funding. 42
Florida Strategic Highway Safety Planning Florida Strategic Highway Safety Plan (SHSP) Update and Performance Overview
 Update and Performance Overview") Session 1 Florida Strategic Highway Safety Planning Florida Strategic Highway Safety Plan (SHSP) Update and Performance Overview Joe Santos, PE, FDOT, State Safety Office October, 23, 2013 Florida Statistics
Session 1 Florida Strategic Highway Safety Planning Florida Strategic Highway Safety Plan (SHSP) Update and Performance Overview Joe Santos, PE, FDOT, State Safety Office October, 23, 2013 Florida Statistics
COUNTERMEASURES THAT WORK:
 COUNTERMEASURES THAT WORK: A HIGHWAY SAFETY COUNTERMEASURE GUIDE FOR STATE HIGHWAY SAFETY OFFICES NINTH EDITION, 2017 AT A GLANCE SUMMARY DOCUMENT ACCESS THE FULL REPORT HERE: Richard, C. M., Magee, K.,
Collect and analyze data on motorcycle crashes, injuries, and fatalities;
 November 2006 Highway Safety Program Guideline No. 3 Motorcycle Safety Each State, in cooperation with its political subdivisions and tribal governments and other parties as appropriate, should develop
DEPARTMENT OF TRANSPORTATION OVERVIEW OF SAFETY PROGRAMS
 DEPARTMENT OF TRANSPORTATION OVERVIEW OF SAFETY PROGRAMS SAFETY PROGRAMS Federal Motor Carrier Safety Administration (FMCSA) Commercial Vehicle Safety Federal Highway Administration (FHWA ) Highway Safety
Target Zero: Underutilized Strategies in Traffic Safety That Work
 Target Zero: Underutilized Strategies in Traffic Safety That Work James C. Fell National Opinion Research Center (NORC) at the University of Chicago, Bethesda, MD Office The Problem In 2015, 35,092 people
DOT HS April 2013
 TRAFFIC SAFETY FACTS 2011 Data DOT HS 811 753 April 2013 Overview Motor vehicle travel is the primary means of transportation in the United States, providing an unprecedented degree of mobility. Yet for
TRAFFIC SAFETY FACTS. Overview Data
 TRAFFIC SAFETY FACTS 2009 Data Overview Motor vehicle travel is the primary means of transportation in the United States, providing an unprecedented degree of mobility. Yet for all its advantages, injuries
NHTSA / ANSTSE. Traffic Safety for Teen Drivers Presenter:
 NHTSA / ANSTSE Traffic Safety for Teen Drivers Presenter: Presentation Topics NHTSA s Support for Driver Education The Stakeholder Association - ANSTSE Young Motor Vehicle Crashes NHTSA Initiatives Vermont
NEW JERSEY LAW ENFORCEMENT LIAISON NEWSLETTER
 NEW JERSEY LAW ENFORCEMENT LIAISON NEWSLETTER JUNE 2018/21 WWW..ORG NJ DIVISION OF HIGHWAY TRAFFIC SAFETY DRIVE SOBER OR GET PULLED OVER 2018 MOBILIZATION The mission of the Division of The Drive Sober
AAA ON THE ISSUES
 AAA ON THE ISSUES 2 0 1 7 TABLE OF CONTENTS Introduction Safety on Our Roadways Occupant Protection Child Passenger Safety Senior Mobility Teen Driving Motorcycle Helmets Recreational Marijuana Transportation
Where are the Increases in Motorcycle Rider Fatalities?
 Where are the Increases in Motorcycle Rider Fatalities? Umesh Shankar Mathematical Analysis Division (NPO-121) Office of Traffic Records and Analysis National Center for Statistics and Analysis National
Motorcycle Safety Program Assessments
 2015 s Conference 2015 ASK 1 Andrew Krajewski Project Manager, SMSA What is a state motorcycle safety program assessment? An independent review of a state s motorcycle safety efforts NHTSA facilitates
Highway Safety Update
 Highway Safety Update January 26, 2018 Karin Mongeon, Safety Division Bryon Fuchs, Local Government NDDOT Safety Division The Traffic Records Program Collect and analyze crash data to identify traffic
Road fatalities in 2012
 Lithuania 1 Inhabitants Vehicles/1 000 inhabitants Road fatalities in 2012 Fatalities /100 000 inhabitants in 2012 2.98 million 751 301 10.1 1. Road safety data collection Definitions Road fatality: person
TRAFFIC SAFETY CONFERENCE. John A. Barton, P.E. Deputy Executive Director
 TRAFFIC SAFETY CONFERENCE John A. Barton, P.E. Deputy Executive Director June 9, 2015 Introduction TxDOT Mission Work with others to provide safe and reliable transportation solutions for Texas 2 Fatalities
IMPAIRED DRIVING TASK FORCE
 IMPAIRED DRIVING TASK FORCE Statewide Impaired Driving Plan For Federal Fiscal Year 2016 Senator Jody Amedee, Chairman Governor s Task Force on DWI - Vehicular Homicide Lt. Colonel John A. LeBlanc, Executive
Federal Motor Carrier Safety Administration
 Federal Motor Carrier Safety Administration Earl Hardy Senior Policy Advisor Office of the Assistant Administrator and Chief Safety Officer 2 Who We Are FMCSA Regulates 551,000 active motor carriers 13,000
Chris Luebbert. Commercial Motor Vehicle Program Manager MoDOT Traffic and Highway Safety Division
 Chris Luebbert Commercial Motor Vehicle Program Manager MoDOT Traffic and Highway Safety Division The primary goal of the Highway Safety Office is to reduce fatal and serious injury crashes on Missouri
Enhancing School Bus Safety and Pupil Transportation Safety
 For Release on August 26, 2002 (9:00 am EDST) Enhancing School Bus Safety and Pupil Transportation Safety School bus safety and pupil transportation safety involve two similar, but different, concepts.
NEW JERSEY LAW ENFORCEMENT LIAISON NEWSLETTER
 NEW JERSEY LAW ENFORCEMENT LIAISON NEWSLETTER MAY 2018/20 WWW.NJSACOP.ORG NJ DIVISION OF HIGHWAY TRAFFIC SAFETY 2017 Click It Or Ticket & Border 2 Border Seatbelt Mobilizations The mission of the Division
Illinois State Police Enforcement Initiatives. Commander Robert W. Haley Statewide Patrol Support Command
 Illinois State Police Enforcement Initiatives Commander Robert W. Haley Statewide Patrol Support Command Speed Motorcycle Enforcement Bureau Total Citations 5000 4500 4000 3500 3000 2500 2000 1500 1000
MOTORCYCLE SAFETY. FY 14 Motorcycle Safety Assessment
 MOTORCYCLE SAFETY FY 14 Motorcycle Safety Assessment Introduction Texas Motorcycle Safety Assessment The assessment program offers States a tool to use over time to review their motorcycle safety program,
ITSMR Research Note. Motorcyclists and Impaired Driving ABSTRACT INTRODUCTION KEY FINDINGS. September 2013
 September 2013 KEY FINDINGS F&PI CRASHES INVOLVING IMPAIRED MOTORCYCLISTS 27% of the fatal MC crashes over the five year period, 2008-2012, were alcohol-related. 48% of the alcohol-related F&PI MC crashes
Recommendations of the Expert Group on Preventing Motorcycle Injuries in Children
 Recommendations of the Expert Group on Preventing Motorcycle Injuries in Children All Member States in the WHO South-East Asia (SEA) Region are low- and middle-income countries. In the SEA Region, the
National Center for Statistics and Analysis Research and Development
 U.S. Department of Transportation National Highway Traffic Safety Administration DOT HS 809 271 June 2001 Technical Report Published By: National Center for Statistics and Analysis Research and Development
12/2/2010. The Florida Department of Transportation (FDOT) funded the Observational Survey of Motorcyclists through the use of highway safety funds.
 funded the Observational Survey of Motorcyclists through the use of highway safety funds.") Chanyoung Lee, Ph.D., PTP Center for Urban Transportation Research (CUTR) University of South Florida The Florida Department of Transportation (FDOT) funded the Observational Survey of Motorcyclists through
Chanyoung Lee, Ph.D., PTP Center for Urban Transportation Research (CUTR) University of South Florida The Florida Department of Transportation (FDOT) funded the Observational Survey of Motorcyclists through
The National Association of State Motorcycle Safety Administrators (SMSA) Strategic Plan
 Strategic Plan") The National Association of State Motorcycle Safety Administrators (SMSA) Strategic Plan PURPOSE This Strategic Plan will serve as a roadmap to define the future of the National Association of State Motorcycle
The National Association of State Motorcycle Safety Administrators (SMSA) Strategic Plan PURPOSE This Strategic Plan will serve as a roadmap to define the future of the National Association of State Motorcycle
Alberta Speeding Convictions and Collisions Involving Unsafe Speed
 Alberta Speeding Convictions and Collisions Involving Unsafe Speed 2004-2008 Overview This document was prepared under the Alberta Traffic Safety Plan, Strategic Research Plan for 2008-2010, with the objective
Regional Safety Action Plan and Safety Investigation Program
 Regional Safety Action Plan and Safety Investigation Program Technical Advisory Committee Meeting #3 Insert image credit here (or delete) April 17, 2018 Number of Serious Injuries New York State Serious
BRANDON POLICE SERVICE th Street Brandon, Manitoba R7A 6Z3 Telephone: (204)
") BRANDON POLICE SERVICE 1340-10th Street Brandon, Manitoba R7A 6Z3 Telephone: (204) 729-2345 www.brandon.ca 2010-02-24 Canadian Council of Motor Transport Administrators 2323 St. Laurent Blvd. Ottawa, Ontario
BRANDON POLICE SERVICE 1340-10th Street Brandon, Manitoba R7A 6Z3 Telephone: (204) 729-2345 www.brandon.ca 2010-02-24 Canadian Council of Motor Transport Administrators 2323 St. Laurent Blvd. Ottawa, Ontario
MICHIGAN TRAFFIC SAFETY MATERIALS CATALOG
 MICHIGAN TRAFFIC SAFETY MATERIALS CATALOG 2007 Not paid for with state funds. Paid for with funding from the U.S. Department of Transportation. ALCOHOL CHILD PASSENGER SAFETY UNDER 21? BROCHURE It is illegal
Stronger road safety. in South Australia. Presented by Tamra Fedojuk Senior Statistician Road Safety Policy
 Stronger road safety performance monitoring in South Australia Presented by Tamra Fedojuk Senior Statistician Road Safety Policy Outline Introduction Challenges for road safety in South Australia Current
Michigan State Police (MSP) Post 21 - Metro North
 Post 21 - Metro North") October 2017 2016 Reporting Criteria Please pay particular attention to the wording when interpreting the three levels of data gathered for this report. Crash The Crash Level analyzes data related to crash
October 2017 2016 Reporting Criteria Please pay particular attention to the wording when interpreting the three levels of data gathered for this report. Crash The Crash Level analyzes data related to crash
SEGMENT 2 DRIVER EDUCATION Risk Awareness
 Fact Sheet 1 Why Should Young Drivers Be Concerned? Risk is the chance of death, injury, damage, or loss. Approximately 1 out of 11 (9%) of 16-year-old drivers will have a serious crash before his/her
Objectives. Understand defensive driving techniques. Increase awareness of safe driving behaviors
 Defensive Driving Objectives Understand defensive driving techniques Increase awareness of safe driving behaviors Provide insight into identifying and anticipating hazards encountered while driving Why
Course Syllabus. Time Requirements. Course Timeline. Grading Policy. Contact Information Online classroom Instructor: Kyle Boots
 Course Syllabus Course Overview This course is designed to meet the classroom requirement of your driver s education experience. It is approved by the State of Indiana. Time Requirements The State of Indiana
NEW MEXICO S EFFORTS AGAINST DWI
 NEW MEXICO S EFFORTS AGAINST DWI WINNING THROUGH COORDINATION FRANKLIN GARCIA NEW MEXICO DEPARTMENT OF TRANSPORTATION TRAFFIC SAFETY BUREAU Presentation to Transportation Safety Research Board September
Michigan State Police (MSP) Post 21 - Metro North
 Post 21 - Metro North") June 2018 Revised 8/3/2018 2017 Reporting Criteria Please pay particular attention to the wording when interpreting the three levels of data gathered for this report. Crash The Crash Level analyzes data
June 2018 Revised 8/3/2018 2017 Reporting Criteria Please pay particular attention to the wording when interpreting the three levels of data gathered for this report. Crash The Crash Level analyzes data
Delaware Information and Analysis Center
 Delaware Information and Analysis Center 2015 DELAWARE THERE WERE 684,731 LICENSED DRIVERS, 892,508 REGISTERED MOTOR VEHICLES, AND 9,761,000,000 VEHICLE MILES DRIVEN*. THERE WERE 24,066 TRAFFIC CRASHES
Traffic Research & Data Center
 Traffic Research & Data Center Traffic Safety Commission, 1000 S. Cherry St., Olympia 98504 SAFETY BELT USE RATES I A PRIMARY LAW STATE COMPARED TO A EIGHBORIG SECODARY LAW STATE Philip M. Salzberg and
Road Safety. Background Information. Motor Vehicle Collisions
 Background Information Motor Vehicle Collisions For many Canadians, the riskiest part of their job is their time spent on the road driving. Motor vehicle collisions are the leading cause of injury and
Pupil Transportation Safety
 Highway Safety Program Guideline No. 3 March 2009 Highway Safety Program Guideline No. 17 Pupil Transportation Safety Each State, in cooperation with its political subdivisions and tribal governments,
ROAD SAFETY ANNUAL REPORT 2018 LITHUANIA
 ROAD SAFETY ANNUAL REPORT 2018 LITHUANIA LITHUANIA In 2017, 192 persons lost their lives in traffic crashes. Lithuania is one of the IRTAD countries that has achieved the strongest reduction in the number
Traffic Safety Network Huron Valley
 June 2018 Revised 8/3/2018 2017 Reporting Criteria Please pay particular attention to the wording when interpreting the three levels of data gathered for this report. Crash The Crash Level analyzes data
Occupational Driving Safety Programs: The Driver
 Occupational Driving Safety Programs: The Driver Karen Puckett Director, Workplace Safety Texas Department of Insurance, Division of Workers Compensation (DWC) 1 Driving in Texas No deathless days in 2014
STUDIES ON THE EFFECTIVENESS OF IGNITION INTERLOCKS
 STUDIES ON THE EFFECTIVENESS OF IGNITION INTERLOCKS Updated: January 2017 McGinty, Emma E. American Journal of Preventative Medicine, Ignition Interlock Laws: Effects on Fatal Motor Vehicle Crashes, 1982
4/4/2014. Law Enforcement felt this report was unacceptable. Increasing Impaired Driving Enforcement Visibility Tuesday, April 29, 2014.
 Increasing Impaired Driving Enforcement Visibility Tuesday, April 29, 2014 Case Study Southeast Wisconsin Drunk Driving Task Force STOP, TEST AND ARREST On November 20, 2007 a MADD (Mothers Against Drunk
2017 MDTSEA Manual - How it Corresponds to the ADTSEA 3.0 Curriculum for Segment 1 and 2 Classroom Education
 2017 MDTSEA - How it Corresponds to the ADTSEA 3.0 Curriculum for Segment 1 and 2 Classroom Education Section 5A Segment 1 Classroom Content, Objectives, and Resources 1 Introduction to Novice Driver Responsibilities
A) New zero tolerance drug presence laws for young and novice drivers. Create a new regulation to define and permit the use of federally
 New zero tolerance drug presence laws for young and novice drivers. Create a new regulation to define and permit the use of federally") Proposed Regulatory Amendments to Support Implementation of Schedule 4 of the Cannabis, Smoke-Free Ontario and Road Safety Statute Law Amendment Act, 2017 Background: For the last 16 years, Ontario has
Proposed Regulatory Amendments to Support Implementation of Schedule 4 of the Cannabis, Smoke-Free Ontario and Road Safety Statute Law Amendment Act, 2017 Background: For the last 16 years, Ontario has
ABATE of Indiana, Incorporated
 May is Motorcycle Safety and Awareness Month in Indiana It is May and Spring is officially here. Of course May also brings Motorcycle Safety and Awareness Month. This is proclaimed by Indiana Governor
I-95 Corridor-wide safety data analysis and identification of existing successful safety programs. Traffic Injury Research Foundation April 22, 2010
 I-95 Corridor-wide safety data analysis and identification of existing successful safety programs Traffic Injury Research Foundation April 22, 2010 Overview Background Methodology Purpose Crash analysis
COMMUNITY ENGAGEMENT STRATEGIES
 COMMUNITY ENGAGEMENT STRATEGIES for Teen Driver Safety Parent Awareness Programs Chief Steve Mortenson Elko New Market Police Department Trooper Joe Dellwo Minnesota State Patrol Gordy Pehrson DPS Office
Safe and Sober Transport Alcohol Interlock Seminar. Marko Sillanpää Director General, Transport System
 Safe and Sober Transport Alcohol Interlock Seminar Marko Sillanpää Director General, Transport System 15.3.2012 The National Road Safety Programme Ministry of Transport and Communications published the
Safety in a Snapshot: 2014
 Safety in a Snapshot Safety in a Snapshot: 2014 A report on roadway safety in Pennsylvania: Where we are, where we are going, and where we need to focus our efforts State Transportation Innovation Council
TTI TRAFFIC SAFETY CONFERENCE. John A. Barton, P.E.
 TTI TRAFFIC SAFETY CONFERENCE John A. Barton, P.E. Introduction TxDOT Mission Work with others to provide safe and reliable transportation solutions for Texas. 2 Mission Zero Is a Journey toward: Zero
Rates of Motor Vehicle Crashes, Injuries, and Deaths in Relation to Driver Age, United States,
 RESEARCH BRIEF This Research Brief provides updated statistics on rates of crashes, injuries and death per mile driven in relation to driver age based on the most recent data available, from 2014-2015.
HOUSTON-GALVESTON AREA COUNCIL METROPOLITAN PLANNING ORGANIZATION
 HOUSTON-GALVESTON AREA COUNCIL METROPOLITAN PLANNING ORGANIZATION Regional Collaboration Transportation Planning Multimodal Mobility Table of Contents Introduction...2 Regional Crashes...3 Bicyclists...4
2015 Community Report White Rock
 5 White Rock Produced for the New Mexico Department of Transportation, Traffic Safety Division, Traffic Records Bureau, Under Contract 58 by the University of New Mexico, Geospatial and Population Studies,
2016 Community Report Los Alamos County
 6 Los Alamos County Produced for the New Mexico Department of Transportation, Traffic Safety Division, Traffic Records Bureau, Under Contract 58 by the University of New Mexico, Geospatial and Population
Fleet Safety Initiative Status Summary
 Fleet Safety Initiative Status Summary Deborah Majeski DTE Energy Company October 7, 2008 DTE Energy s Primary Subsidiaries are Gas and Electric Utilities 2 Non-Utility Energy Related Businesses 3 Impact
2015 Community Report Grants
 5 Grants Produced for the New Mexico Department of Transportation, Traffic Safety Division, Traffic Records Bureau, Under Contract 58 by the University of New Mexico, Geospatial and Population Studies,
TOWARD SAFE AND RELIABLE ROADWAYS. Jill Ryan, MPH Eagle County Commissioner
 TOWARD SAFE AND RELIABLE ROADWAYS Jill Ryan, MPH Eagle County Commissioner Where Does CDOT Money Go? FY2012 (in CDOT millions) Expenditures $1,104,588,163* $684.3 [63%] MAINTAIN What We Have 15% 14% 5%
Parking Management Element
 Parking Management Element The State Transportation Planning Rule, adopted in 1991, requires that the Metropolitan Planning Organization (MPO) area implement, through its member jurisdictions, a parking
2016 Community Report Santa Fe County
 26 Santa Fe County Produced for the New Mexico Department of Transportation, Traffic Safety Division, Traffic Records Bureau, Under Contract 58 by the University of New Mexico, Geospatial and Population
INJURY PREVENTION POLICY ANALYSIS
 INJURY PREVENTION POLICY ANALYSIS Graduated Driver Licensing for Passenger Vehicles in Atlantic Canada Introduction Motor vehicle collisions (MVC) are a leading cause of death for young Atlantic Canadians.
Chapter 6 Drinking & Drugs
 Chapter 6 Drinking & Drugs Effects of Alcohol Alcohol is a drug that affects overall driving ability. Just one drink may effect a drivers driving ability. Driving Under the Influence (DUI) of intoxicating
2015 Community Report Doña Ana County
 25 Doña Ana County Produced for the New Mexico Department of Transportation, Traffic Safety Division, Traffic Records Bureau, Under Contract 58 by the University of New Mexico, Geospatial and Population
A R T I C L E S E R I E S
 Comprehensive Safety Analysis Initiative A R T I C L E S E R I E S BASIC 1: UNSAFE DRIVING Staying on top of safety and compliance under the CSA 2010 initiative will mean getting back to the BASICs. This
Transportation Demand Management Element
 Transportation Demand Management Element Over the years, our reliance on the private automobile as our primary mode of transportation has grown substantially. Our dependence on the automobile is evidenced
Final Administrative Decision
 Final Administrative Decision Date: August 30, 2018 By: David Martin, Director of Planning and Community Development Subject: Shared Mobility Device Pilot Program Operator Selection and Device Allocation
Act 229 Evaluation Report
 R22-1 W21-19 W21-20 Act 229 Evaluation Report Prepared for Prepared by Table of Contents 1. Documentation Page 3 2. Executive Summary 4 2.1. Purpose 4 2.2. Evaluation Results 4 3. Background 4 4. Approach
2015 Community Report Chaparral
 5 Chaparral Produced for the New Mexico Department of Transportation, Traffic Safety Division, Traffic Records Bureau, Under Contract 58 by the University of New Mexico, Geospatial and Population Studies,
2014 Community Report Portales
 4 Portales Produced for the New Mexico Department of Transportation, Traffic Safety Division, Traffic Records Bureau, Under Contract 58 by the University of New Mexico, Geospatial and Population Studies,
KANSAS SHSP 2015 STRATEGIC HIGHWAY EXECUTIVE SUMMARY SAFETY PLAN 2015
 KANSAS SHSP 2015 EXECUTIVE EXECUTIVE A strategic highway safety plan (SHSP) is a coordinated and informed approach to reducing highway fatalities and serious injuries on all public roads. By coordinated,
Linda Goodman. June 15, 2016
 Linda Goodman June 15, 2016 FMCSA s Safety-First Mission Congress established FMCSA in 2000 with a mission to prevent crashes, injuries, and fatalities involving large trucks and buses. FMCSA and our staff
2016 Community Report Portales
 6 Portales Produced for the New Mexico Department of Transportation, Traffic Safety Division, Traffic Records Bureau, Under Contract 58 by the University of New Mexico, Geospatial and Population Studies,
2015 Community Report Los Lunas
 25 Los Lunas Produced for the New Mexico Department of Transportation, Traffic Safety Division, Traffic Records Bureau, Under Contract 58 by the University of New Mexico, Geospatial and Population Studies,
2014 Community Report Luna County
 4 Luna County Produced for the New Mexico Department of Transportation, Traffic Safety Division, Traffic Records Bureau, Under Contract 58 by the University of New Mexico, Geospatial and Population Studies,
2016 Community Report Torrance County
 6 Torrance County Produced for the New Mexico Department of Transportation, Traffic Safety Division, Traffic Records Bureau, Under Contract 58 by the University of New Mexico, Geospatial and Population
2015 Community Report Torrance County
 5 Torrance County Produced for the New Mexico Department of Transportation, Traffic Safety Division, Traffic Records Bureau, Under Contract 58 by the University of New Mexico, Geospatial and Population
An Overview of Warn Range Administrative Licence Suspension Programs in Canada 2010
 An Overview of Warn Range Administrative Licence Suspension Programs in Canada 200 January 202 Introduction The provinces and territories first enacted warn range administrative licence suspension programs
DOT HS October 2011
 TRAFFIC SAFETY FACTS 2009 Data DOT HS 811 389 October 2011 Motorcycles Definitions often vary across publications with respect to individuals on motorcycles. For this document, the following terms will
2014 Community Report Los Lunas
 4 Los Lunas Produced for the New Mexico Department of Transportation, Traffic Safety Division, Traffic Records Bureau, Under Contract 58 by the University of New Mexico, Geospatial and Population Studies,
Traffic Safety Merit Badge Workbook
 Merit Badge Workbook This workbook can help you but you still need to read the merit badge pamphlet. This Workbook can help you organize your thoughts as you prepare to meet with your merit badge counselor.
2016 Community Report De Baca County
 6 De Baca County Produced for the New Mexico Department of Transportation, Traffic Safety Division, Traffic Records Bureau, Under Contract 58 by the University of New Mexico, Geospatial and Population
2015 Community Report Las Vegas
 5 Las Vegas Produced for the New Mexico Department of Transportation, Traffic Safety Division, Traffic Records Bureau, Under Contract 58 by the University of New Mexico, Geospatial and Population Studies,
Tools of the Trade. Victoria Hauan, Impaired Driving Program Manager, Office of Traffic Safety
 Tools of the Trade Victoria Hauan, Impaired Driving Program Manager, Office of Traffic Safety An ignition interlock is a device installed in a vehicle that requires a breath sample from the driver before
ASSEMBLY JOINT RESOLUTION No. 64 STATE OF NEW JERSEY. 218th LEGISLATURE INTRODUCED FEBRUARY 1, 2018
 ASSEMBLY JOINT RESOLUTION No. STATE OF NEW JERSEY th LEGISLATURE INTRODUCED FEBRUARY, 0 Sponsored by: Assemblyman JOHN F. MCKEON District (Essex and Morris) SYNOPSIS Establishes Commission on Drunk and
2015 Community Report Tularosa
 5 Tularosa Produced for the New Mexico Department of Transportation, Traffic Safety Division, Traffic Records Bureau, Under Contract 58 by the University of New Mexico, Geospatial and Population Studies,
2014 Community Report Las Vegas
 4 Las Vegas Produced for the New Mexico Department of Transportation, Traffic Safety Division, Traffic Records Bureau, Under Contract 58 by the University of New Mexico, Geospatial and Population Studies,
2014 Community Report Truth or Consequences
 4 Truth or Consequences Produced for the New Mexico Department of Transportation, Traffic Safety Division, Traffic Records Bureau, Under Contract 58 by the University of New Mexico, Geospatial and Population
Statement before the North Carolina House Select Committee. Motorcycle Helmet Laws. Stephen L. Oesch
 Statement before the North Carolina House Select Committee Motorcycle Helmet Laws Stephen L. Oesch The Insurance Institute for Highway Safety is a nonprofit research and communications organization that
2014 Community Report Tularosa
 4 Tularosa Produced for the New Mexico Department of Transportation, Traffic Safety Division, Traffic Records Bureau, Under Contract 8 by the University of New Mexico, Geospatial and Population Studies,
Alcohol-Impaired Driving Facts
 BREATH TEST REFUSAL RATES IN THE UNITED STATES 2011 UPDATE Nathan Warren-Kigenyi, MPH Work Performed During Public Health Fellowship with the National Highway Traffic Safety Administration s Office of
2016 Community Report San Juan County
 26 San Juan County Produced for the New Mexico Department of Transportation, Traffic Safety Division, Traffic Records Bureau, Under Contract 58 by the University of New Mexico, Geospatial and Population
2015 Community Report San Juan County
 25 San Juan County Produced for the New Mexico Department of Transportation, Traffic Safety Division, Traffic Records Bureau, Under Contract 58 by the University of New Mexico, Geospatial and Population
Virginia Traffic Records Electronic Data System (TREDS) John Saunders, Director Scott Newby, TREDS Data Warehouse Architect May 25, 2014
 John Saunders, Director Scott Newby, TREDS Data Warehouse Architect May 25, 2014") Virginia Traffic Records Electronic Data System (TREDS) John Saunders, Director Scott Newby, TREDS Data Warehouse Architect May 25, 2014 Award-winning System Governor s Technology Award for Virginia National
Virginia Traffic Records Electronic Data System (TREDS) John Saunders, Director Scott Newby, TREDS Data Warehouse Architect May 25, 2014 Award-winning System Governor s Technology Award for Virginia National
2016 Community Report New Mexico
 216 Produced for the Department of Transportation, Traffic Safety Division, Traffic Records Bureau, Under Contract 581 by the University of, Geospatial and Population Studies, Traffic Research Unit Distributed
Protecting Occupants
 Module 5.3 Protecting Occupants It s about managing natural laws and saving lives. 1 Protecting Occupants - Objectives Describe the three collisions of a crash and the effect on the restrained and unrestrained
2016 Community Report Aztec
 Aztec Produced for the New Mexico Department of Transportation, Traffic Safety Division, Traffic Records Bureau, Under Contract 58 by the University of New Mexico, Geospatial and Population Studies, Traffic