Trends in Motorcycle Crashes in Michigan: Lidia P. Kostyniuk Linda L. Miller
|
|
|
- Mervyn Wilkinson
- 6 years ago
- Views:
Transcription
1 Trends in Motorcycle Crashes in Michigan: Lidia P. Kostyniuk Linda L. Miller December 2003
2 Technical Report Documentation Page 1 RepoltNo UMTRI Tte and Subtte Trends in Motorcycle Crashes in Michigan: Government Accesson No 3 Recpents Catalog No 5 Repolt Date December Performng Organ~zat~on Code 7 Authofls) Kostyniuk, L.P. and Miller, L.L. 9 Periomng Orgen~zet~on Name end Address The University of Michigan Transportation Research Institute 2901 Baxter Road Ann Arbor, MI Performng Organ~zat~on Repolt No UMTRI WorkUnt No (TRAS) 11 Contract orgrant NO MC Sponsorng Agency Name and Address 13 Type oirepoti and Perod Covered Michigan Office of Highway Safety Planning 400 Collins Road Lansing MI Final 10/01/02-9/30/03 14 Sponsoring Agency Code 15 Suppementa!yNotes 16 Abstract Michigan crash data from 1997 to 2002 were analyzed fortrendsand patterns in motorcycle crashes. Over the 6-year period, the number of motorcycles registered in Michigan increased by 45%; licensed motorcyclists increased by 8%; and motorcycle crashes increased by 20%. The largest increases in licensed motorcyclists were among those age In there were 15.4 crashes per registered motorcycles. a 18% decrease from 1997; and 5.9 crashes per licensed motorcyclists. a 12% increase from The highest crash rate was among motorcyclists below age 19, and the lowest was among those over age 64. About 44% of crash-involved motorcyclists were not legally licensed to operate a motorcycle. The proportion of unlicenced motorcyclists among crash-involved motorcyclists varied by age. with the largest proportion among those below age 19. Between 1997 and the number of motorcycle crashes in which a driver had been drinking (HBD) decreased 4%, the number of fatalities from HBD crashes decreased 20%, and the proportion of HBD-crash fatalities among all crash fatalities decreased from 47% to 29%. The number of crashes involving motorcyclists. age who had been drinking increased by 71 %. Helmet use among crash-involved motorcyclists increased from 94% in 1997 to 97% in The high proportion of unlicenced motorcyclists was identified as a problem that should be addressed by public information and special enforcement programs. I? Keywords Crash trends. motorcycles. motorcycle crashes 18 Dstrbuton Statement Unlimited 19 Security Classf (ofths repolt) 20 Secunty Cassf (ofths 21 No of Pages 22 Price Unclassified page'~nclassified 68
3 ACKNOWLEDGMENTS The authors gratefully acknowledge the Transportation Data Center ofthe University of Michigan Transportation Research Institute (UMTRI) for providing us with the Michigan crash data files. The authors also thank Judy Settles and Mary Chico of UMTRI for help with the administrative portions of this project.
4 Table of Contents 1. INTRODUCTION DATA AND METHODS ALL MOTORCYCLE CRASHES SINGLE-AND MULTI-VEHICLE MOTORCYCLE CRASHES HAD BEEN DRINKING (HBD) CRASHES HELMETUSE NOTABLE TRENDS AND DISCUSSION REFERENCES APPENDIXA... A-I APPENDIX B... B-1
5 List of Tables Table 1. Number and Proportion of Vehicle Crashes Involving Motorcycles Table 2. Motorcycle Crashes by Severity Table 3. Motorcycle Crashes as Proportion of All Vehicle Crashes by Severity Table 4. People Killed and Injured in All Vehicle Crashes and Motorcycle Crashes Table 5. Registered Motorcycles and Crash Rate per Motorcycles Table 6. Licensed Motorcycle Drivers and Crash Rate per Motorcycle Drivers Table 7. Motorcycle Crashes. Licensed Motorcyclists. and Crash Rate by Age Table 8. Motorcycle Crashes. Licensed Motorcyclists. and Crash Rate by Sex Table 9. Number and Proportion of Crash-Involved Motorcycle Drivers with a Valid Motorcycle Endorsement by Age Table 10. Number and Proportion of Crash-Involved Motorcycle Drivers without Any Driver License by Age Group Table 11. Number and Proportion of Crash-Involved Motorcycle Drivers with a Valid Motorcycle Endorsement by Sex Table 12. Number and Proportion of Crash-Involved Motorcycle Drivers without Any Driver License by Sex Table 13. Motorcycle Crashes by Month Table 14. Motorcycle Crashes by Day of Week Table 15. Motorcycle Crashes by Time of Day Table 16. Motorcycle Crashes by Traffic Control Table 17. Motorcycle Crashes by Roadway Condition Table 18. Motorcycle Crashes by Weather Table 19. Motorcycle Crashes by Light Condition
6 Table 20. Number and Proportion of Single- and Multi-Vehicle Motorcycle Crashes Table 21. Multi-Vehicle Motorcycle Crashes by Traffic Unit Mix Table 22. Number and Proportion of People Killed and Injured in Single- and Multivehicle Motorcycle Crashes Table 23. Number and Proportion of Single- and Multi-Vehicle Motorcycle Crashes by AgeofDriver Table 24. Number and Proportion of Single- and Multi-Vehicle Motorcycle Crashes by Sex of Driver Table 25. Number and Proportion of Crash-Involved Licensed Motorcyclists by CrashType Table 26. Age Distribution of Other Drivers Involved in Multi- Vehicle Motorcycle Crashes Table 27. Sex Distribution of Other Drivers Involved in Multi-vehicle Motorcycle Crashes Table 28. Hazardous Actions for Single-Vehicle Crash-Involved Motorcyclists Table 29. Hazardous Actions for Multi-Vehicle Crash-Involved Motorcyclists Table 30. Hazardous Actions by Other Drivers in Multi-Vehicle Motorcycle Crashes Table 31. Number and Proportion of Drivers with a Hazardous Citation by Crash-Type Table 32. Single Motorcycle Crashes by Time of Day Table 33. Multi-Vehicle Motorcycle Crashes by Time of Day Table 34. Single Motorcycle Crashes by Light Condition Table 35. Multi-Vehicle Motorcycle Crashes by Light Condition Table 36. Number and Proportion of HBD Crashes Involving Motorcycles Table 37. Number and Proportion of Single- and Multi-Vehicle Motorcycle Crashes Involving Had Been Drinking Drivers
7 Table 38. Number and Proportion of People Killed and Injured in HBD Motorcycle Crashes Table 39. Number and Proportion of Crash-Involved Motorcyclists Who Had Been DrinkingbyAge, Table 40. Number and Proportion of HBD Motorcyclists by Sex, Table 41. Fatal-Crash-Involved Motorcyclists Tested for BAC, Table 42. BAC Levels (gldl) of Fatal-Crash-Involved Motorcyclists Table 43. HBD Motorcycle Crashes by Month Table 44. HBD Motorcycle Crashes by Day of Week Table 45. HBD Motorcycle Crashes by Time of Day Table 46. Number and Proportion of Helmet use for Crash-Involved Motorcycle Drivers andpassengers Table 47. Injury Severity of Crash-Involved Motorcycle Drivers by Helmet Use List of Figures Figure 1. Motorcycle Crashes by Month Figure 2. Motorcycle Crashes by Day of Week Figure 3. Motorcycle Crashes by Time of Day Figure 4. Single Motorcycle Crashes by Time of Day Figure 5. Multi-Vehicle Motorcycle Crashes by Time of Day Figure 6. HBD Motorcycle Crashes by Time of Day
8 1. INTRODUCTION The likelihood of death or injury in a motorcycle crash is much higher than in other vehicle crashes. According to the National Highway Traffic Administration (NHTSA) (2003a), 80% of motorcycle crashes result in a death or injury, while in passenger vehicle crashes this proportion is 20%. The number of motorcycles in the U.S. has increased significantly in the past few years, and the number of U.S. deathsfrom motorcycle crashes increased by 53% from 2,116 deaths in 1997 to 3,244 deaths in 2002 (NHTSA, 2003b). In 2002, motorcycles represented 2.2% of all registered vehicles in the United States (U.S.), but crashes involving motorcycles accounted for 7.6% of total traffic fatalities on U.S. roads. The increase in deaths resulting from motorcycle crashes, and expectations that the number of motorcycles will continue to increase (Motorcycle Industry Council, 2001) have raised concerns in the traffic safety community. As part of the traffic safety community, the Michigan Office of Highway Safety Planning (OHSP) asked for an analysis and assessment of recent trends in motorcycle crashes in Michigan. Such an assessment is a necessary first step in identifying opportunities and programs for reducing motorcycle crash-related deaths and injuries in the state. This report examines trends in Michigan motorcycle crashes from 1997 through Data and methods of analysis are described in the next section. Trends in the number and severity of motorcycle crashes; crash rates; licensing; and the time, location, and environmental conditions of crashes are reported in the third section. Single vehicle and multi-vehicle motorcycle crashes are examined in the fourth section. Crashes in which the motorcyclist had been drinking alcohol are examined in the fifth section, and helmet use is reported in the sixth section. A summary of notable trends and suggestions for improving motorcycle safety are in the last section of the report.
9 2. DATA AND METHODS Michigan vehicle crash data from 1997 through 2002 (UMTRI, Transportation Data Center, 1998, 1999, 2000, 2001, 2002, and 2003) are used for most of the analyses reported. These data cover all police-reported motor vehicle crashes in Michigan for the 6-year period ( ), and come from information coded on police crash reports (UD- 10 forms). Rates for crash occurrence were based on numbers of registered motorcycles and licensed motorcyclists. Data on motorcycle registrationsand motorcycle licenseswere obtained from the Michigan Department of State. Crashes in which one of the involved drivers was flagged for alcohol use are referred to as had been drinking (HBD) crashes. Most analyses in this study examine change in distributions of key variables from the Michiganvehicle crash data files. The data files for each year contain three linked files: the crash file with descriptive information about the crash itself; the vehicleldriver file with information on the vehicle and the driver; and the person file with information on the occupants of the vehicles involved in the crash. Choices about which files to use when similar information was contained in more than one file were based on the amount of missing data for the variable in each file. The Fatality Analysis Reporting System (FARS) NHTSA, 2003c) data are a census of all fatal vehicle crashes in the United States, and include additional information not found in the Michigan crash data files. FARS data are used in this report to examine blood alcohol concentration (BAC) levels of motorcyclists involved in fatal crashes. Because FARS data for 2002 were not available at the time this report was prepared, BAC analyses are limited to the years 1997 through 2001.
10 3. ALL MOTORCYCLE CRASHES Number and Severity Table 1 shows the overall number of all police-reported crashes in Michigan, and the number and percentage of crashes involving motorcycles from 1997 through During those 6 years, there was a 7% decrease in the number of all police reported crashes, and a 20% increase in the number of crashes involving motorcycles. Even though the number and proportion of motorcycle crashes increased from 1997, motorcycle crashes accounted for less then 1 % of all vehicle crashes in Michigan in Table 1. Number and Proportion of Vehicle Crashes Involving Motorcycles, ,793 2, ,766 2, ,675 2, ,852 3, ,813 3, ,515 3, % Change % 19.98% 0.16 Table 2showsthe number and percentage of motorcycle crashesforfatal, non-fatal injury, and property-damage-only (i.e., no injury) severity levels. The proportion of fatal crashes among motorcycle crashes in 2002 was almost the same as in 1997 at %. The proportion of injury crashesalso remained relatively constant. Together, the fatal and injury crashesaccounted for 77-78% of all motorcycle crashes. In contrast, the proportion of fatal and injury crashes among all vehicle crashes in Michigan over the same 6 years was 20-23% (Kostyniuk and Miller, 2003).
11

12 Table 3 shows the severity distribution of all vehicle crashes and the proportion of motorcycle crashes at each severity level. Motorcycles were involved in 4-8% of the fatal vehicle crashes in each of the 6 years from 1997 through During that time, the number of fatal motorcycle crashes increased by 27%, and the proportion of motorcycle crashes among all fatal crashes increased from 4.9% to 6.8%. In contrast, the total number of all fatal vehicle crashes in Michigan decreased by 8% over the same time period. Between 1997 and 2002, the number of all non-fatal injury crashes in Michigan decreased by 16%, but the number of motorcycle crashesthat resulted in a non-fatal injury increased by 19%. The number of all property-damage-only crashes deceased by 5% overall, but increased by 24% for motorcycles. The number of people killed and injured in all motor vehicle crashes from 1997 through 2002, and the proportion among them killed and injured in motorcycle crashesare shown in Table 4. Table 4. People Killed and Injured in All Vehicle Crashes and Motorcycle Crashes, In the 6-year period, the number of people killed in all motor vehicle crashes decreased by almost 12%, while the number of people killed in motorcycle crashes increased by 28%. The proportion of fatalitiesfrom motorcycle crashes relative to fatalities from all vehicle crashes increased from 4% to 6% over the 6-year period. While the number of people injured in all vehicle crashes in Michigan decreased by about 18%, the number of people injured in motorcycle crashes increased by 17%.
13 Registrations, Licenses, and Crash Rates Table 5 shows the number of motorcycles registered in Michigan from 1997 through 2002, and the crash rate per 1,000 registered motorcycles for each year. Between 1997 and 2002, the number of motorcycles registered in Michigan increased by 45%, and their proportion of the state's registered vehicles increased from 1.5% to 2.0% (Michigan Department of State, 2002). Although the number of crashes increased by 20%, the even larger increase in the number of registered motorcycles contributed to an overall decrease in the vehicle crash rate. In 1997, the crash rate was about 19 crashes per 1,000 registered motorcycles, and in 2002, the crash rate was 15 crashes per 1,000 motorcycles, a decrease of approximately 17%. A person must be at least 16 years of age, and have a motorcycle endorsement on a valid driver's license to legally operate a motorcycle in Michigan (Michigan Vehicle Code a). Drivers satisfying these conditions are referred to as licensed motorcyclists in this report (See Appendix A). Table 6 shows the number of licensed motorcyclists, the numberofcrashes, and the crash rate per 1,000 licensed motorcyclistsin Michigan for each year from 1997 through 2002.
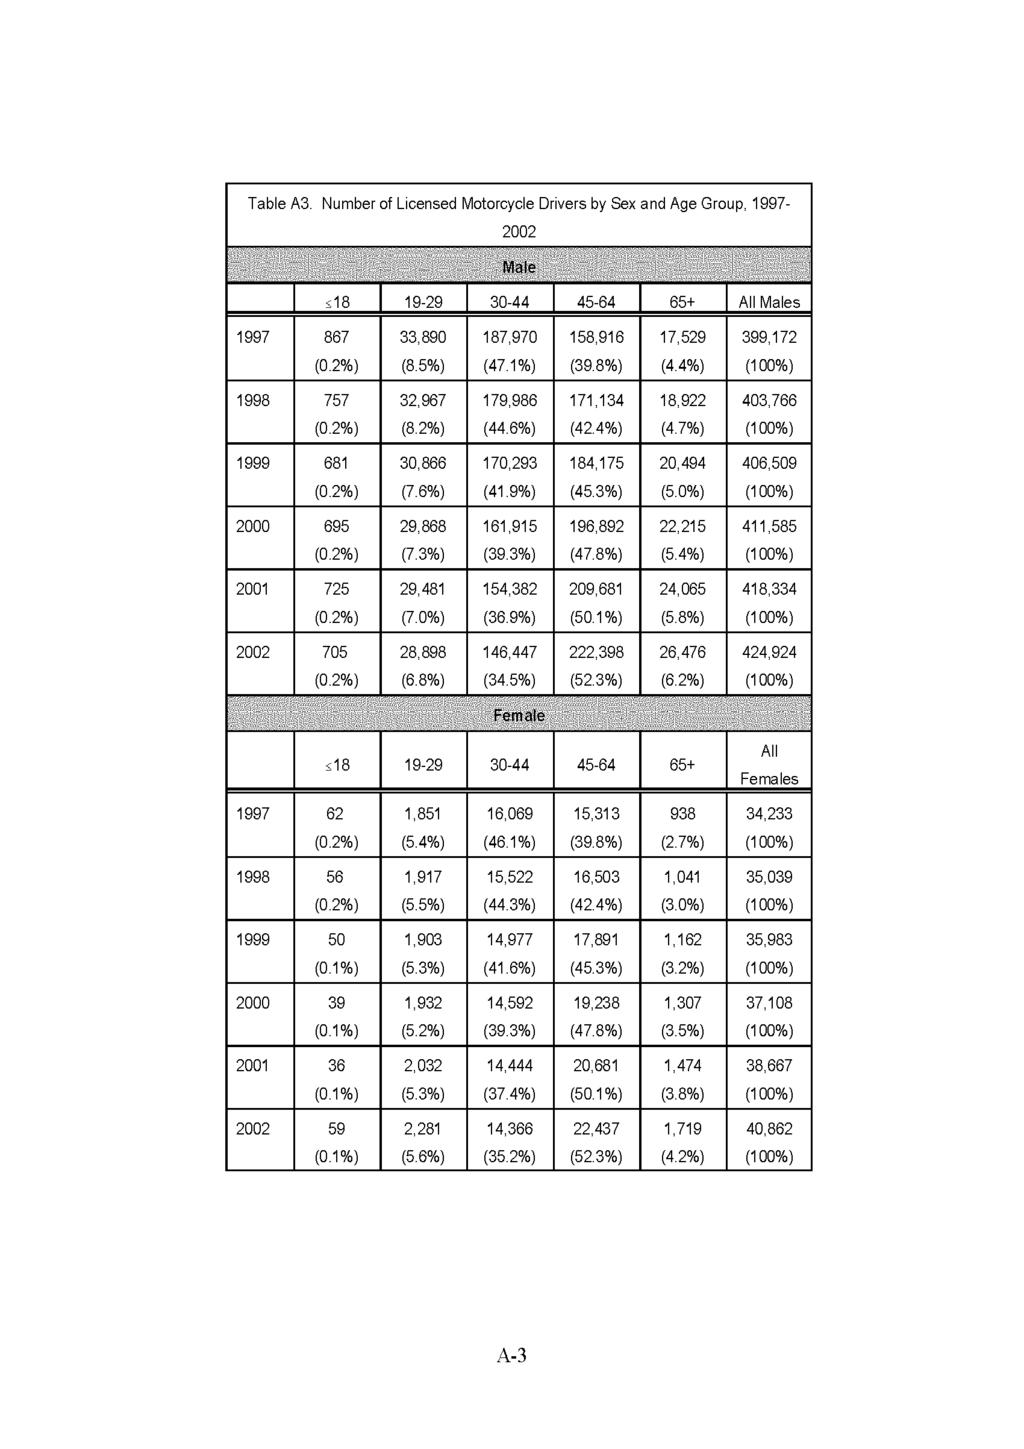
14 In the 6 years between 1997 and 2002, the number of licensed motorcyclists increased by 7.5%, and the crash rate per 1,000 licensed motorcyclists increased by almost 12% The changes in the number of crashes, licensed motorcyclists, and crash rates were further examined by age. Table 7 shows the number of crashes, the number of licensed motorcyclists, and the crash rate per 1,000 licensed motorcyclists by age category for each year. The table reveals several interesting patterns and trends. The first trend is the aging of the population of licensed motorcyclists in Michigan. In 1997 and 1998, the largest number of licensed motorcyclists was in the age group. From 1999 through 2002, however, the largest number of licensed motorcyclists was among those age The largest growth rate in the number of licensed motorcyclists was among those over age 64, and the second largest growth rate was among those age In 1997, the proportion of all licensed motorcyclists over age 44 was 45%. In 2002, this proportion was 59%. During that time, the number of licensed motorcyclists below age 45 decreased by 20%. Except for 1997, motorcyclists age were involved in more crashes than motorcyclists in any other age group, and motorcyclists over 64 years were consistently involved in the fewest crashes (Table 7). Although the number of crashes involving the
. Motorcyclists younger than 19 years consistently had the highest crash rates.")
15 oldest motorcyclists was still quite small in 2002, it had increased by 60% from However, the largest increase in the number of crashes (87%) was among motorcyclists age For each year from 1997 through 2002, the crash rate per licensed motorcyclist decreased with age (Table 7). Motorcyclists younger than 19 years consistently had the highest crash rates. Although the actual number of crashes was small, the number of licensed motorcyclists in the youngest age group was also very small, yielding a high crash rate per licensed motorcyclist. Within each age group, except age (which varies), the

16 crash rates increased from 1997 through The largest increase in crash rate was among motorcyclists age which increased by 52% from 3.8 to 5.8 crashes per 1,000 licensed motorcyclists. Notable also was the 32% increase in crash rate for motorcyclistsage 45-64, from 2.8 to 3.7 crashes per 1,000 licensed motorcyclists. The crash rate for motorcyclists age was the about same in 2002 as it was in Table 8 shows the number of licensed motorcyclists and the crash rate per 1,000 licensed motorcyclists by sex for each year from 1997 through Some interesting patternsand trends are revealed. Most motorcycle crashes involved male motorcyclists. The proportion of crashes involving female motorcyclists was 5-7% each year between 1997 through 2002, and the proportion ofwomen among licensed motorcyclists remained relatively constant at 8-9% over the 6-year period. Although the number of both male and female licensed motorcyclists increased from 1997 through 2002, the growth rate for women was much higher than that for men (19% compared to 7%) The crash rate for men was greater than for women, but the increase in crash rate was greater forwomen than for men (20% for women and 10% for men).
17 Unlicenced Motorcyclists To determine if crash rates per 1,000 licensed motorcyclists were an accurate measure of crash involvement from 1997 through 2002, motorcycle crash records were examined by the motorcycle license status of crash-involved motorcyclists. Table 9 shows the number and proportion of all crash-involved motorcyclists with a valid motorcycle endorsement (i.e., licensed motorcyclists) by age for each year from 1997 through Table 9. Number and Proportion of Crash-Involved Motorcycle Drivers with a Valid Motorcvcle Endorsement bv Aae * Because of missing data on age, total does not necessarily equal the sum of age groups Overall, only 55-57% of crash-involved motorcyclists had valid motorcycle endorsements on theirdrivers' licenses. The possibility that this might be an artifact of data or coding problems was investigated by querying the people responsible forthe integrity of the Michigan crash data at the Michigan State Police. They reported no unusual problems with the coding of thisvariable in police accident reports or in the final Michigan crash data files. Therefore, it was inferred that from 1997 through 2002, 43-45% of crash-involved motorcyclists were not legally licensed to operate a motorcycle. Examining the motorcycle license status by age shows that motorcycle endorsements were lowest in the youngest crash-involved age group and increased with age. Table 9 also shows changes in the proportion of crash-involved motorcyclists with valid motorcycle licenses from 1997 through The licensed proportion among the
18 youngest crash-involved motorcyclists increased from 15% in 1997 to 23% in The proportion of crash-involved motorcyclists with valid licenses among those age was 47% in both 1997 and In age group 30-44, the proportion of licensed motorcyclists among crash-involved motorcyclists decreased from 64% to 60%, and the proportion of licensed motorcyclists age decreased from 79% to 70%. The number of crashinvolved motorcycle drivers age 65 and older was quite small, but the proportion with valid licenses in this group varied from 61-87% from 1997 through Furtherexamination ofthe licensing statusofcrash-involved motorcyclists (Table 10) revealed that each year from 1997 through 2002 about 10-12% did not have a driver's license of any type. The pattern by age indicates that majority of crash-involved motorcyclists without any type of drivers' license were age 18 years and younger. The proportion of crash-involved motorcyclists in this age group without any type of drivers' license was 69% in 1997, and decreased to 54% in 2002.
19 Examining the license statusof crash-involved motorcycle drivers by sex (Table 1 I), shows that the proportion of crash-involved male motorcyclists with a valid motorcycle endorsement remained relatively constant at 57-58% over the 6-years from 1997 through The proportion of female motorcyclists with a valid motorcycle license was consistently lower than that of male motorcyclists, but increased from 43% in 1997 to 55% in The proportion of crash-involved female motorcyclists not licensed to drive any type of vehicle (Table 12) decreased from 25% in 1997 to 10% in 2002 The proportion of crash-involved male motorcyclists without any type of driver's license ranged between 7% and 9% over this 6-year period.
20
21 Jan Fet Mar +r May June July Aup Sept kt Nov Occ - I $@ 7 '"" ',' 2999 ',-""I zoo? a Figure 1. Motorcycle Crashes by Month, to be the peak months of crash occurrence, followed by May or September. This is not unusual because these are the peak months for recreational travel in the state. Table 14 and Figure 2 show the number and distribution of motorcycle crashes by day of week. I Table 14. Motorcycle Crashes by Day of Week, I
22 Figure 2. Motorcycle Crashes by Day of Week, Saturdays remain peak days for motorcycle crashes with 19-22% of all motorcycle crashes. The day of week with the second highest number of crashes was usually Sunday, with a bout 16-18% of crashes. Table 15 and Figure 3 showthe number and distribution of motorcycle crashes by the time of day for each year.

23 flg3 eao :oa Figure 3. Motorcycle Crashes by Time of Day, The pattern of motorcycle crashes by time of day has not changed significantly from 1997 through Approximately one-quarter of motorcycle crashes (24-26%) occurred
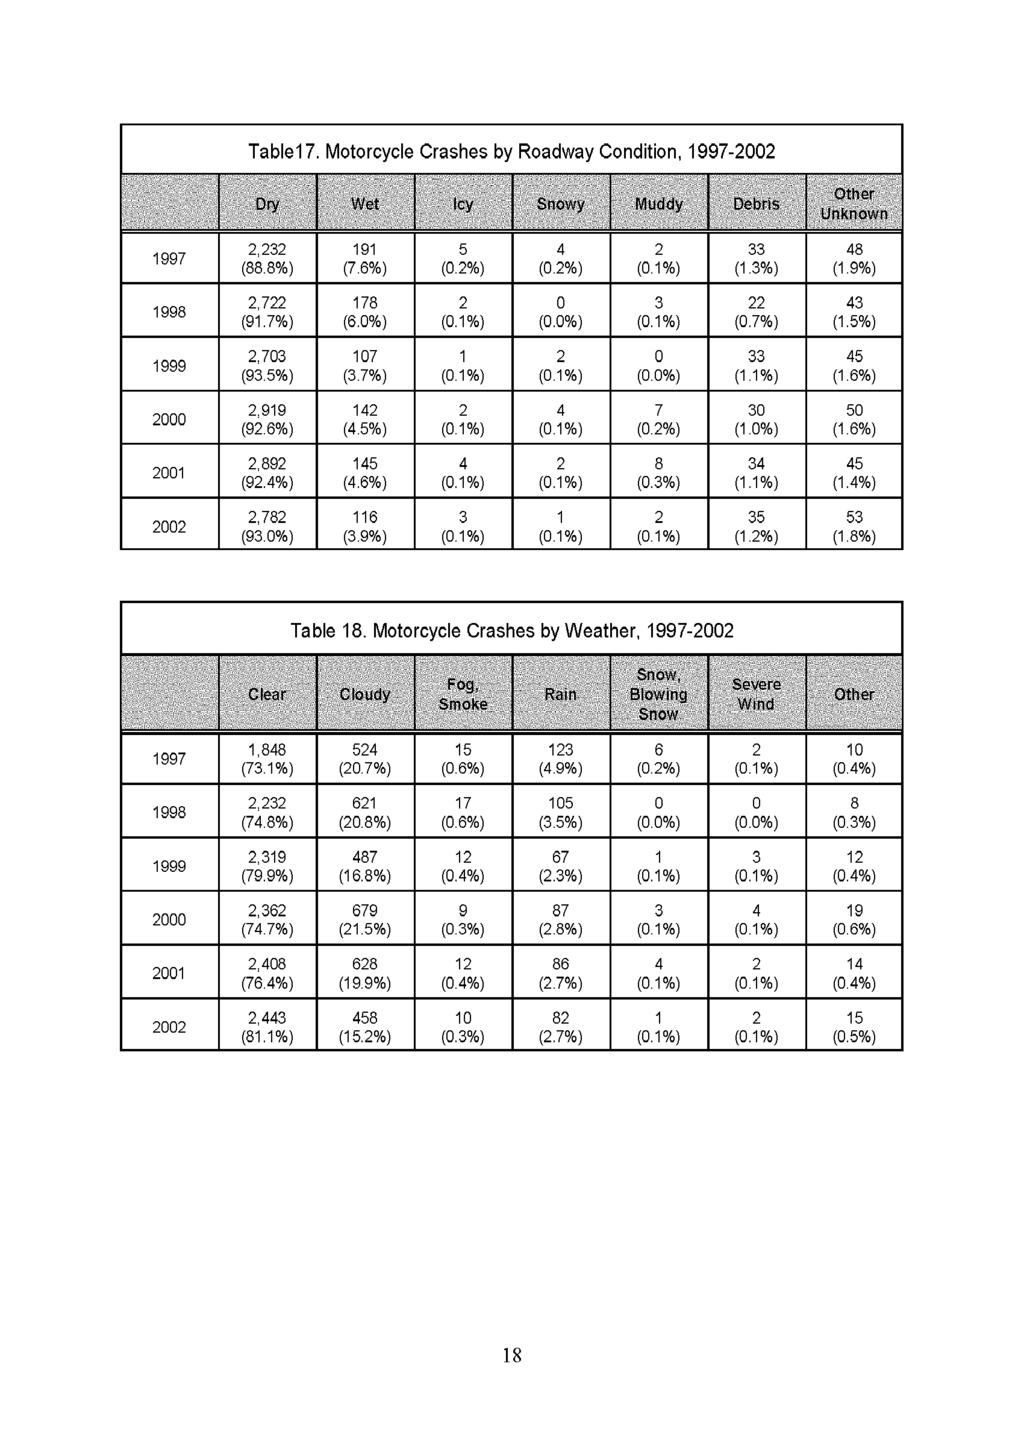
24 from 3:00 P.M. to 6:00 P.M., and close to one-half (45-49%) occurred between 3:00 P.M. and 9:00 P.M. The location of crashes by traffic control was examined to identify the pattern of motorcycle crash location by intersection or road segment. Signals, stop signs, and yield signs indicate intersections, and no traffic control usually indicates a location away from an intersection or a road segment. Table 16 showsthe location of motorcycle crashes by traffic control for each year from 1997 through About 70-72% of motorcycle crashesoccurred away from controlled intersections, and about 28-30% occurred at controlled intersections. This pattern has not changed over the 6-year period from 1997 through 2002, and is similar to that of all vehicle crashes in Michigan in the same years (Kostyniuk, 2003). Tables show the number and distribution of motorcycle crashes for each year from 1997 through 2002 by roadway condition, weather, and by light condition.
25
26 The pattern of occurrence of motorcycle crashes by roadway condition, weather, and light condition was stable over the 6-years from 1997 through About 89-94% of crashesoccurred on dry roadsand 4-8% were on wet roads. About %of the crashes occurred in good weather, and 3-5% were in rain. Each year about % of crashes were in daylight, 12-14% were in dark, lighted conditions, and 11-12% were in dark, unlighted conditions. These patterns indicate that from 1997 through 2002, most motorcycle crashes occurred on dry roads, in good weather, and during the day.
27 4. SINGLE-AND MULTI-VEHICLE MOTORCYCLE CRASHES Number and Severity In this section, crashes involving single motorcycles (single-vehicle) and crashes involving a motorcycle and other traffic units (multi-vehicle) are examined separately. Table 20 shows the number and proportion of motorcycle crashes that involved only a motorcycle, and crashes that involved a motorcycle with another vehicle(s) or pedestrian(s). Approximately one-half of motorcycle crashes were single-vehicle crashes and one-half involved other traffic units. This pattern was consistent over the 6 years from 1997 through Table 21 shows the distribution of other traffic units involved in collisions with motorcycles in multi-vehicle crashes from 1997 through 2002.
28 The distribution of traffic units involved in collisions with motorcycles did not change over the 6 years from 1997 through About two-thirds (67-70%) of the multi-vehicle crasheswere with passenger cars, 21-24% were with trucks, 5-6% were with more than one other traffic unit, and about 1 % were with pedestrians and other units (bicycles, etc). Severity of single- and multi-vehicle motorcycle crashes is examined in Table 22 by comparing the number and distribution of people killed or injured in each type of crash.
29 The proportions of people killed and injured in single- and multi-vehicle motorcycle crashes have not changed significantly over the 6-year time period. About 30-40% of all motorcycle fatalities and 46-49% of motorcycle injuries were sustained in single-vehicle crashes, while approximately 60-70% of all motorcycle fatalities and 51-54% of injuries occurred in multi-vehicle crashes. Distributions by Age, Sex, and License The distributions of motorcyclists by age in single- and multi-vehicle motorcycle crashes for each year from 1997 through 2002 are shown in Table 23.

30 Examining the age distributions of motorcyclists involved in both single- and multivehicle motorcycle crashes over the 6 years from 1997 through 2002, shows that they are similarto each other. An increase in the proportion of both single- and multi-vehicle crashes attributable to drivers age over the 6 years is an evident trend. Table 24 shows the distribution of crash-involved motorcyclists by sex for single- and multi-vehicle motorcycle crashes.
31 The table reveals that women motorcyclistswere involved in about 5-7% ofthe singlevehicle motorcycle crashes, and 4-7% of the multi-vehicle motorcycle crashes. The pattern of motorcycle crash involvement by sex of driver did not to vary by crash type and appears to be stable over the 6 years from 1997 through Table 25 shows the number and proportion of licensed motorcyclists among crashinvolved motorcyclists for each year from 1997 through There appears to be little difference in the proportions of licensed motorcyclists among those involved in single- and multi-vehicle motorcycle crashes over most ofthe 6 years. However, in 2002,601 ofthose involved in single-vehicle crashes held drivers' licenses with a motorcycle endorsement,
32 while only 53% of those involved in multi-vehicle crashes had licenses with a motorcycle endorsement. Whether this is a chance variation or the beginning of a trend remains to be seen. Other Drivers in Multi-vehicle Motorcycle Crashes Table 26 shows the age distribution of the drivers of other vehicles involved in collisions with motorcycles.
33 There was a decrease in the proportion of younger (age 18 years and less) drivers (from about 26% to 21 %) balanced by small increases in the proportion of drivers over age 45. However, the distribution by age of other drivers involved in motorcycle crashes did not change significantly from 1997 through The proportions of other drivers by age are similar to that for all vehicle crashes (Kostyniuk and Miller, 2003). Table 27 shows the distribution of the other drivers involved in motorcycle collisions by sex. Men comprised 55-59% of other drivers involved in motorcycle crashes from 1997 through This proportion reflects the general composition by sex of drivers on the road (Eby et al, 2002). Hazardous Actions The distributions of hazardous actions recorded by police for motorcycle drivers and other drivers in motorcycle crashes from 1997 through 2002 are examined in the next set of tables. Table 28 shows the distribution of hazardous actions recorded in single-vehicle motorcycle crashes.
34 (12.4%) (1 1.2%) (11.6%) (9.7%) (9.1%) (7.1%) Unknown (3.6%) (4.4%) (4.6%) (4.3%) (5.6%) (5.0%) The pattern of hazardous actions recorded for motorcyclists involved in single-vehicle crashesdid not change significantly overthe 6 years from 1997 through In about onehalf (48-52%) of these crashes, no hazardous action was recorded. The most frequently recorded hazardous action for motorcyclists in single vehicle crashes was "speed too fast"
35 (14-18%). The second most frequent was "(failing to maintain) clear distance" (7-9%). It should be noted that the hazardous action categories "reckless driving" and "carelesslnegligent driving" were added to the codes in Together they were recorded for about 5-6% of motorcyclists involved in single-vehicle crashes from 2000 through The distribution of hazardous actions recorded for motorcyclists involved in multi- vehicle crashes for each year from 1997 through 2002 is shown in Table 29.
 87 (5.4%) :;.-, 81 (5.2%) Other 164 (12.4%) 181 (1 1.4%) 182 (12.1%) 139 (8.2%) 147 (9.2%) 136 (8.7%) Unknown 66 (5.0%) 74 (4.7%) 67 (4.5%) 89 (5.2%) 83 (5.2%) 79 (5.")
36 Table 29. Hazardous Actions for Multi-Vehicle Crash-Involved Motorcyclists, CarelessINegligent Driving - -. lyg. g@, '?,.zf?~zyj, +... sat!y6!~l+17jtb:,j& i,&dfij%i+jfa', 1 6,,, ; : G;,, -, 62 (3.7%) 87 (5.4%) :;.-, 81 (5.2%) Other 164 (12.4%) 181 (1 1.4%) 182 (12.1%) 139 (8.2%) 147 (9.2%) 136 (8.7%) Unknown 66 (5.0%) 74 (4.7%) 67 (4.5%) 89 (5.2%) 83 (5.2%) 79 (5.1 %) The pattern of hazardous actions recorded for motorcyclists in multi-vehicle crashes is similar to that of motorcyclists in single-vehicle crashes. In about one-half (48-51%) ofthese crashes, no hazardous action was recorded for the motorcyclist involved in the crash. "Speed too fast" was the most frequently recorded hazardous action, accounting for 12-17% of the crashes, and "(failing to maintain) clear distance" accounted for 7-8% of the crashes. From 2000 through 2002, "reckless driving" and "carelesslnegligent driving" together were recorded for 6-8% of motorcyclists in multi-vehicle crashes. Table 30 shows the distribution of hazardous actions recorded for other drivers involved in multi-vehicle motorcycle crashes for each year from 1997 through Traffic Control 34 (2.6%) 43 (2.7%) 38 (2.5%) 52 (3.1 %) 45 (2.8%) 32 (2.0%) Wrong Way 1 (01%) 2 (01%) 2 (01%) 2 (01%) 1 (01%) 3 (0.2%) Left of Center 9 (0.7%) 13 (0.8%) 7 (05%) 10 (0.6%) 18 (1.1%) 10 (0.6%)
37 The pattern of hazardous actions recorded for other drivers in multi-vehicle motorcycle crashes was relatively stable over the 6 years from 1997 through 2002, but quite different from the hazardous actions recorded for motorcyclists in multi-vehicle crashes. Hazardous actions were recorded for a larger proportion of other drivers involved in crashes with motorcycles, than for crash-involved motorcyclists. The proportion of other drivers with no hazardous action recorded was 37-44% in the 6-years from 1997 through 2002, whereas, no hazardous action was recorded for 48-51% of the motorcyclists involved in the same crashes. "Failing to yield" (the right of way) was the most frequently recorded hazardous action, which accounted for 26-29% of the crashes. As with motorcyclists, the second most frequent action was "(failing to maintain) clear distance", which was recorded for 9-11 % of the other drivers in multi-vehicle motorcycle crashes. Table 31 shows the number and proportion of motorcyclists and other drivers who received a citation for the hazardous action in the 6 years from 1997 through 2002.
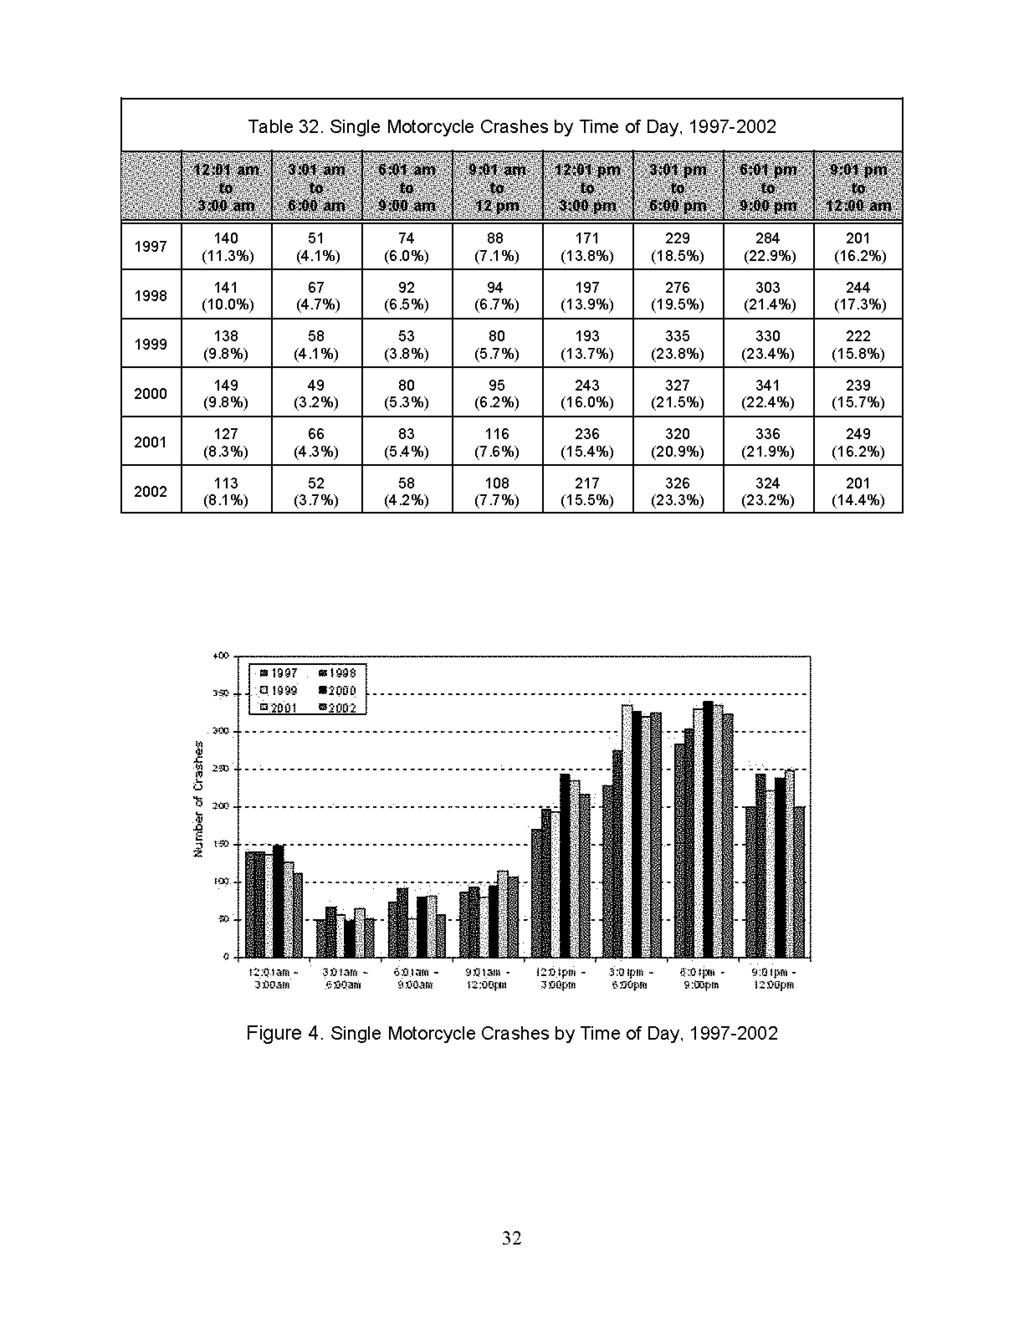
38 Two patterns are revealed by this table. First, the overall proportion of motorcyclists receiving citations for hazardous actions did not seem to vary by whether the crash was a single-or multi-vehicle crash. Furthermore, the proportion of motorcyclists receiving citations decreased slightly from 14-15% in 1997 to 12-13% in Second, the proportion of other drivers involved in multi-vehicle motorcycle crashes who received citations for a hazardous action was consistently higher than that of motorcyclists involved in the same crashes, and increased from 26% in 1997 to 30% in Time, Location, and Environmental Conditions The distributions of single- and multi-vehicle motorcycle crashes from 1997 through 2002 were examined by month, day of week, time of day, road type, roadway condition, weather, and light condition. With the exception ofthe distributions of crashes by time of day and light condition, the distributions were very similar to that of all motorcycle crashes, and therefore are not discussed in this section, but can be found in Appendix B. Tables 32 and 33 and Figures 4 and 5 show the distributions of single- and multi- vehicle motorcycle crashes by time of day.
39
 142 (9.1 %) 302 (1 9.4%) 433 (27.9%) 316 (20.3%) 195 (12.6%) 1999 67 (4.5%) 18 (1.2%) 75 (5.1%) 127 (8.6%) 279 (18.8%) 427 (28.85) 313 (21.1%) 179 (12.1%) 2000 67 (4.2%) 31 (1 9%) 73 (4.")
40 Table 33. Multi-Vehicle Motorcycle Crashes by Time of Day, I Igg7 57 (44%) 19 (1-5%) 81 ( 6.3%) 9 5 (7.4%) 233 (18.0%) 386 (29.9%) 267 (20.7%) 154 (1 1.9%) 60 Igg8 (3.9%) 30 (1.9%) 76 (4.9%) 142 (9.1 %) 302 (1 9.4%) 433 (27.9%) 316 (20.3%) 195 (12.6%) (4.5%) 18 (1.2%) 75 (5.1%) 127 (8.6%) 279 (18.8%) 427 (28.85) 313 (21.1%) 179 (12.1%) (4.2%) 31 (1 9%) 73 (4.6 %) 126 (7.9%) 31 1 (1 9.4%) 468 (29.3%) 350 (21.9%) 174 (1 0.9%) 58 (3.9%) 19 (1.3%) 68 (4.6 %) 9 5 (6.4%) 285 (19.3%) 439 (29.7%) 340 (23.05) 172 (1 1.7%) (4.2%) 13 (0.9 %) 78 (5.3 %) 132 (9.0%) 284 (1 9.3%) 424 (28.8%) 309 (21.0%) 173 (1 1.7%) Figure 5. Multi-Vehicle Motorcycle Crashes by Time of Day, Examination of these tables shows that a greater pro portion of single-ve hicle than multi-vehicle motorcycle crashes occurred at night. Approximately 23-27% of all singlevehicle motorcycle crashes occurred between 9.00 P.M. and 3.00 A.M., while 15-17% of the multi-ve hicle crashes occurred during those hours.

41 Examining the crashes by light condition (Tables 34 and 35) shows again that a greater proportion of single-vehicle than multi-vehicle motorcycle crashes occurred at night, under dark lighted or unlighted conditions. Generally, 30-33% of all single-vehicle motorcycle crashes and 19-20% of multi-vehicle motorcycle crashes occurred at night. This pattern was somewhat different in 2001, when 20% of single-vehicle crashes were at night, and in 2002 when 28% of multi-vehicle crashes were at night. These departures from the pattern are most likely chancevariations. However, this pattern should be monitored, in case it is the beginning of a trend.
42 5. HAD BEEN DRINKING (HBD) CRASHES Number and Severity Table 36 shows the number and proportion of motorcycle crashes in which a motorcyclists or driver of the other vehicle had been drinking. The number of HBD crashes involving motorcycles decreased by almost 4% from 1997, despite a 20% increase in motorcycle crashes. The proportion of HBD crashes among motorcycle crashes decreased from almost 12% in 1997 to 9% in In approximately 87% of HBD motorcycle crashes each year, the motorcyclist was the driver who had been drinking , % % , % % % Change % -3.7% -2.3% -7.4% -2.3% The number and proportion of motorcyclists who had been drinking in single-vehicle motorcycle HBD crashes and the number and proportion of motorcyclists and other drivers who had been drinking in multi-vehicle motorcycle HBD crashes is shown in Table 37 for each year from 1997 through 2002.
43 (7.8%) 123 (7.1 %) 48 (2.7%) (7.8%) 147 (8.9%) 51 (3.0%) (8.6%) 110 (6.7%) 60 (3.6%) % Change % % 0.27 From 1997through 2002,8-11 %of single-vehicle motorcycle crashes involved a motorcyclist who had been drinking. During those 6 years, the proportion of motorcyclists involved in multi-vehicle crashes who had been drinking ranged from 7% to 9%. Thus, it appears that the proportion of motorcyclistswho had been drinking isslightly higher among single-vehicle than in multi-vehicle motorcycle crashes. In about 3-4% of HBD crashes involving other vehicles, the drivers of the other vehicle had been drinking. Note that the total of had-beendrinking driversexceedsthe number of HBDcrashesin Table 36 because in a small number of the HBD multi-vehicle crashes, both the motorcyclist and other driver had been drinking. Table 38 shows the number and proportion of people killed and injured in HBD motorcycle crashes.
44 Although HBD crashes accounted for9-12% of motorcycle crashesfrom 1997 through 2002, they accounted for a much larger proportion of fatalities. In 1997, 47% of fatalities in motorcycle crashes were in HBD crashes, decreasing to 29% in Between 1997 and 2002, the number non-fatal injuries sustained in HBD motorcycle crashes decreased by nearly 11 %, and their proportion among all motorcycle injuries decreased from almost 14% to about 10%. Distributions of HBD Motorcycle Crashes by Age and Sex The distribution by age of crash-involved motorcyclistswho had been drinking (Table 39) shows a 7% overall reduction in the number of crash-involved motorcyclists who had been drinking. However, the table also shows large increases in the number of had-beendrinking crash-involved motorcyclists among those 18 and younger and age years. Although the actual number of young crash-involved, had-been-drinking motorcyclists was quite small, the increase in the number of their crashes was 55%. The number of crashinvolved, had been-drinking motorcyclists age 45-64, increased by 71 % from 1997 through 2002.
45 Table 40 shows that the proportion by sex of crash-involved, had-been drinking motorcyclists has not changed significantly from 1997 through About 96-99% of all crash-involved had-been-drinking motorcyclists were men, and 1-4% were women in each of the 6 years Table 40. Number and Proportion of HBD Motorcyclists by Sex, *<,<*&>,bb+t 4.*<c """*b:.+ds,-,. $,<.Q "zrf4$>,pr,>3h; v~2*,,~*<.~>~,\.<*<,<*&>,b~,.,~*" r#:;<,&,;l:>a^;* ;, tit<,^ \,,;,:., >,. $ p$):>>h,. <.+** i-.wo# p,. q,<i 8~\,.*.,.*- is;,,au",.,.,>v9>,e,* 8,e6>>,e, jq 4.. 3, -6,.. be>>,e,v,e,4,*,?,% ~,mg&$j!$g;j.i 242 (96.0%) 10 (4.0%) (96.3%) 285 (99.0%) 263 (96.7%) 226 (96.2%) 233 (97.1 %) 11 (3.7%) 3 (1.O%) 9 (3.3%) 9 (3.8%) 7 (2.9%)
46 BAC Levels in Fatal Crashes Blood alcohol concentration (BAC) information for motorcyclists involved in fatal crashes was obtained from FARS data. In general, about 50% of fatal-crash-involved motorists in Michigan are tested for BAC (Kostyniuk and Miller, 2003). However, the proportion of motorcyclists tested was higher. From 1997 through 2001, 64-84% of fatalcrash-involved motorcyclists were tested for BAC (Table 41). As noted earlier, FARS data for 2002 were not available at the time this report was prepared. "There was a small number of missing cases in each year. Table 42 shows the BAC level of fatal-crash-involved motorcyclists who had been tested. Of the tested motorcyclists each year, 44-60% had BAC levels of 0 gldl, 5-13% had BAC levels between 0 and 0.08 gldl, and 29-36% had BAC at or over 0.08 gldl. BAC test results were not reported for 5-8% of the motorcyclists.

47 Time of Occurrence Table 43 shows the distribution of HBD motorcycle crashes by month for each year from 1997 through The peak months for motorcycle HBD crashes in 1997 through 2002 were June, July, and August, although in some years, May or September could be included among the peak months. This pattern in peak monthsfor HBD motorcycle crashes resembles the pattern of peak months for all motorcycle crashes. Table 43. HBD Motorcycle Crashes by Month, Igg (0.0) (0.0) (1.6) (4.3) (12.1) (18.8) (25.4) (14.1) (9.4) (11.7) (2.3) (0.4) (0.8) 1 (0.4) 3 (1.3) 6 (2.5) 21 (8.9) 56 (23.6) 52 (21.9) 42 (17.7) 35 (14.8) 10 (4.2) 9 (3.8) 0 (00)

48 Table 44 shows the pattern of HBD motorcycle crashes by day ofweek. The majority (57-68%) of HBD crashes occurred on Fridays, Saturdays, and Sundays. Saturdays were the peak days for HBD motorcycle crashes in 5 of the 6 years from 1997 through The occurrence of motorcycle HBD crashes is examined by time of day in Table 45, and shown graphically in Figure 6.
49 Figure 6. HBD Motorcycle Crashes by Time of Day The pattern of motorcycle HBD crashes by time of day has not changed significantly over the 6 years from 1997 through Approximately three-quarters (74-80%) of all motorcycle HBD crashes occurred from 6:00 P.M. to 3:00 AM.
50 6. HELMET USE Michigan law requires that motorcyclists and motorcycle passengers wear DOTapproved helmetswhen riding motorcycles (Michigan Vehicle Code Section ). Table 46 shows the helmet use of crash-involved motorcyclists for 1997 through Information on helmet use of motorcycle drivers was available for approximately 85% of motorcycle crashes. Helmet use for motorcycle passengers is shown only for 1997 and 1998, because data for on passenger helmet use were not consistently coded, Table 46. Number and Proportion of Helmet use for Crash-Involved Motorcycle Drivers and Passengers, Drlver Passenger Helmet Helmet No Helmet * Data not available for As can be seen from Table 46, helmet use among motorcycle drivers, already quite high at 94% in 1997, increased to 97% by From the limited data on passenger helmet use, it appears that helmet use among motorcycle passengers is comparable to that of motorcycle drivers. Table 47 shows the proportion of crash-involved motorcycle drivers who were killed, sustained an incapacitating injury (A level injury as defined in State of Michigan, 1999), sustained other injuries (B or C level as defined in State of Michigan, 1999), or were
51 uninjured while wearing a helmet Worn No Helmet (3.0%) 3 4,2% (19.1%) 20 (28.2%) (55.2%) 37 (52.1 %) (22.7%) 11 (15.5%) (1 00%) 71 (1 00%) 2002 Helmet Worn No Helmet 59 (3.0%) 0 (00%) 389 (19.9%) 19 (27.1%) (54.2%) 43 (61 4%) 448 (22.9%) 8 (1 1.4%) (1 00%) 70 (100%) The severity of injuries among motorcyclists not wearing helmets was greater than among motorcyclists wearing helmets. From 1997 through 2002, 2-3% of crash-involved motorcyclists wearing helmets were killed in the crash. The proportion ofthose not wearing helmets who were killed ranged from 0% to 10% in the 6 years. Of crash-involved motorcyclistswearing helmets, 20-23% sustained incapacitating injuries, ascompared to % of those not wearing helmets. Furthermore, 21-24% of crash-involved motorcyclists wearing helmets were not injured at all, while only 8-16% of those not wearing helmets were not injured in the crash.
52 7. NOTABLE TRENDS AND DISCUSSION Trends and Patterns The salient patterns and trends in motorcycle crashes in Michigan from 1997 through 2002 are summarized below: lncrease in number of motorcycle crashes, and related deaths and injuries! There has been a 20% increase in the number of motorcycle crashes in Michigan from 1997 through The increase in fatal crashes involving motorcycles was 27%, and the increase in non-fatal injury crashes involving motorcycles was 19%. During the same time, the number of all vehicle crashes in Michigan decreased by 7%, fatal crashes decreased by 8%, and injury crashes decreased by 16%.! About 77-78% of motorcycle crashes in Michigan result in a death or injury. In contrast, about 20-23% of vehicle crashes in Michigan result in a death or injury.! Although the proportion of vehicle crashes in Michigan involving motorcycles increased each year from 1997, in 2002, motorcycle crashes represented less than 1 % of all vehicle crashes. However, each year from 1997 through 2002, motorcycle crashes accounted for 4-8% of all fatal crashes.! The proportion of fatal crashes among motorcycle crashes did not change significantly between 1997 and In 1997,2.5% of motorcycle crashes involved a fatality, and in 2002, 2.6% of motorcycle crashes involved a fatality. lncrease in registered motorcycles and decrease in vehicle crash rate! The number of registered motorcycles in Michigan increased by 45% from 136,030 in 1997 to 197,735 in 2002.! The crash rate per registered motorcycle decreased by 18% from 18.7 crashes per 1,000 registered motorcycles in 1997 to 15.4 crashes per 1,000 registered motorcycles in lncrease in the number and aging of licensed motorcyclists! The number of people with motorcycle endorsements on drivers' licenses increased by 7.5% from 433,405 in 1997 to 465,786 in About 93-94% of licensed motorcyclists are men.
53 ! There has been an aging of the licensed motorcyclists in Michigan. In 1997, 45% of licensed motorcyclists were age 45 or older, while in 2002, 59% of licensed motorcyclists were age 45 or older.! The number of licensed motorcyclists younger than 45 years decreased by 20% between 1997 and Changes in driver crash rates! The crash rate per licensed motorcyclist increased by 12% from 5.9 crashes per 1,000 licensed motorcyclists in 1997 to 6.6 crashes per 1,000 licensed motorcyclists in 2002.! The youngest motorcyclists had the highest crash rate. In 2002, the crash rate for motorcyclists younger than 19 years was 451 crashes per 1,000 licensed motorcyclists.! The lowest crash rate was among motorcyclists age 65 and older consistently. Their crash rate in 2002 was 1.7 crashes per 1,000 licensed motorcyclists.! The largest increase in crash rate was among motorcyclists age The crash rate increased by 53% from 3.8 to 5.8 crashes per 1,000 licensed motorcyclists.! The crash rate for motorcyclists age increased by 32%, from 2.8 crashes per 1,000 licensed motorcyclists in 1997 to 3.7 crashes per 1,000 licensed motorcyclists in Unlicenced motorcyclists! About 44% of motorcyclists involved in crashes in Michigan from 1997 through 2002 did not have a valid motorcycle endorsement on this driver's license, i.e. they were not legally licensed to operate a motorcycle.! Approximately 10% of crash-involved motorcyclists did not have drivers' licenses of any type.! The largest proportion of unlicenced motorcyclists was among those age 18 and younger. In 2002, only 23% of crash-involved motorcyclists in this age group were legally licensed to operate a motorcycle, and 54% did not have drivers' licenses of any type.
54 Time and Conditions of Crash Occurrence! The patterns of motorcycle crashes by month, day of week, and time of day have not changed in the 6 years from 1997 through The peak months of motorcycle crashes were June, July, and August. The peak days were Saturdays followed by Sundays, and the peak hours were between 3:00 P.M. and 6:00 P.M.! Most motorcycle crashes occurred on dry roads, in good weather, and in daylight.! Single-vehicle motorcycle crasheswere more likely to occurat nightthan multi-vehicle crashes. About 45-50% of single-vehicle motorcycle crashes occurred between 6.00 P.M. and 3:00 A.M.! Approximately 75% of HBD motorcycle crashesoccurred between 6.00 P.M. and 3.00 A.M. Single- and Multi-Vehicle Motorcycle Crashes! The patterns of motorcycle crashes by whether they involved only the motorcycle or a collision between the motorcycle and another vehicle did not change from 1997 through 2002,! About one-half of the motorcycle crashes involved only the motorcycle.! About 47% of all injuries and 35% of fatalities in motorcycle crashes occurred in single-vehicle motorcycle crashes.! Just over one-half of all injuries and 65% of fatalities occurred in multi-vehicle motorcycle crashes. Hazardous Actions! Patterns of hazardous actions recorded for motorcyclists in single- and multi-vehicle crashes were similar to each other, and did not change from 1997 through 2002.! Hazardous actions were recorded for approximately one-half of crash-involved motorcyclists, and for 56-63% of other drivers in multi-vehicle motorcycle crashes.! The most frequently recorded hazardous actionsfor motorcyclists regardless of crash type, were speeding (about % of crashes), (failure to maintain) clear distance (7-9%), and reckless, careless, and negligent driving (5-8%).! Failure to yield right of way was the most frequently recorded hazardous action for other drivers in multi-vehicle motorcycle crashes (26-29% of all multi-vehicle crashes).
55 ! About 15% of crash-involved motorcyclists, and 26-30% of crash-involved other drivers received citations for hazardous actions. Had-Been-Drinking (HBD) Crashes! There has been a 4% decrease in the number of motorcycle crashes in which a motorcyclist or other driver had been drinking, and a 20% decrease in the number of fatalities from these crashes. The proportion of all motorcycle fatalities that resulted from HBD crashes also decreased. In 1997, 47% of motorcycle crash fatalities were from HBD crashes, and in 2002, the proportion of motorcycle crash fatalities from HBD crashes was 29%.! In 2002, 9% of motorcycle crashes involved a motorcyclist or other driver who had been drinking. This was a decrease from 1997, when 12% of all motorcycle crashes involved a drinking motorcyclist or other driver.! Each year from 1997 through 2002, 8-11 % of single-vehicle motorcycle crashes involved motorcyclists who had been drinking.! In multi-vehicle motorcycle crashes, 7-9% of motorcyclists and 3-4% of other drivers had been drinking alcohol.! There has been an increase of 71 % in the number of motorcycle crashes involving motorcyclists age 45-64, who had been drinking.! Motorcyclists are more likely to be tested for BAC than drivers involved in other (nonmotorcycle) fatal crashes. Overall, approximately 50% of drivers involved in fatal crashesare tested for BAC. However, the proportion of motorcyclists involved in fatal crashes who were tested for BAC varied from 64% to 84% over the 6-year period.! Of motorcyclists involved in fatal crashes who were tested, 29-36% had BAC levels at or exceeding 0.08 gldl. Helmet Use! Helmet use among crash-involved motorcycle drivers increased from 94% in 1997 to 97% in 2002.! Injuries were more severe among motorcyclists not wearing helmets than among motorcyclists wearing helmets. From 1997 through 2002, 23-25% of crash-involved motorcyclists with helmets were killed or sustained incapacitating injuries, while 27-
56 39% of crash-involved motorcyclists without helmets were killed or sustained incapacitating injuries. Discussion The increase in motorcycle activity as evidenced by the number of motorcycles and motorcyclists in Michigan parallels that in the U.S. in general. Between 1997 and 2001, the number of motorcycles in the U.S. has increased by 28% and by 41 % in Michigan. By 2002, motorcycles constituted 2.2% of registered vehicles in the U.S., and 2.0% of registered vehicles in Michigan. There has also been an increase in motorcycle crashes, and deaths and injuries associated with these crashes. Nationally, the number of deaths in motorcycle crashes increased by 53% between 1997 and 2002, and crashes involving motorcycles accounted for 7.6% of total traffic fatalities (NHTSA, 2003b, 2003d). Between 1997 and 2002, the increase in the number of deaths from motorcycle crashes in Michigan was 28%, and motorcycle crash fatalities accounted for 6.4% of vehicle crash fatalities in the state in Despite the increase in the number of motorcycle crashesand in deaths resulting from these crashes, the proportion of motorcycle crashes that resulted in death or injury has not changed in Michigan between 1997 and Because motorcycles inherently offer less protection to their occupants in a crash than automobiles, the likelihood of death or injury in a motorcycle crash is much higher than in a crash involving an automobile. Thus, if the probability of a motorcycle being in a crash remainsthe same, and the probability of a death or injury in a motorcycle crash also remains the same, an increase in the number of motorcycles on the road will increase the number of motorcycle crashes, and also the total number of deaths and injuries from these crashes. It can be argued that the present increase in motorcycle crashes, deaths, and injuries in Michigan is simply a consequence of the increase of motorcycles on the road. Crash rates provide a measure ofthe probability of a crash, and changes in the crash rate per vehicle, driver, and vehicle miles of travel (VMT) indicate changes in traffic safety. Analysis of the crash data and vehicle registrations showed a 18% decrease in the crash rate per registered motorcycle from 18.7 to 15.4 crashes per 1,000 registered motorcycles
57 between 1997 and Overall, this is a positive indication of improvement in motorcycle safety, and indicates that the probability of a motorcycle being in a crash has decreased. However, the crash rate per licensed motorcyclist increased by 12%. The crash rate for motorcycle VMT could not be determined because VMT data are not directly available for motorcycles in Michigan. The changes in crash rates by registered motorcycle and by licensed motorcyclist give contradicting indications of changes in motorcycle safety. However, the number of licensed motorcyclists is not an accurate measurement of people operating motorcycles on Michigan's roads. Of crash-involved motorcyclists, only approximately 56% were licensed to operate motorcycles. The number of motorcyclists could be estimated by assuming that 56% of all motorcyclists were licensed. However, the validity of this assumption is questionable because people who ride motorcycleswithout valid licenses may be more likely than those who are licensed to be involved in crashes because of lack of skill, knowledge, or a propensity toward risky behavior. Therefore, the crash rate per motorcyclist cannot be accurately determined without a better measure of number of motorcyclists. An estimate of the number of people who operate motorcycles with and without licenses, aswell as an estimate of the amount of motorcycle travel in Michigan would be very useful for assessing changes in motorcycle safety, as well as quantifying the extent of the motorcycle licensing problem. A study to estimate the motorcycling population and amount of motorcycle travel is needed. Such a study could also investigate the reasons why so many motorcyclists are not legally licensed to operate motorcycles, and could identify the characteristics of those likely to be unlicenced. Although the crash rates per motorcyclists or per VMT could not be determined, it is still possible to work on decreasing the probability of motorcycle crashes by increasing the knowledge and skill of motorcyclists, and by teaching other drivers how to drive near motorcycles. Programs to increase knowledge and skill among motorcyclists can be linked to licensing. To receive a motorcycle endorsement on a driver's license, a person must
58 demonstrate knowledge and skillsof safe motorcycle operation by passing a written test and driving test. Because they have not passed these tests, the level of knowledge and skills of unlicenced motorcyclists is not known. However, it is reasonable to assume that there is considerable room for improvement. A concerted effort to get all currently unlicenced motorcyclists licensed, and to make sure that new motorcyclists start with a valid license is required. This effort could start with a public information program informing people that it is illegal to operate a motorcycle without the proper licensure, and telling them how they can get licensed. A special enforcement program targeting unlicenced motorcyclists could be combined with the public information program to promote licensing. Motorcycle training programs, motorcycle dealerships, and insurance companies could be recruited to help address the licensing problem. An emphasis on licensing could be made at the many training programs teaching riding and street skills courses offered at community colleges, by independent programs, and through motorcycle dealerships. Motorcycle dealerships could help by insuring that their customers do not drive off without proof of a valid motorcycle license. Insurance companies could also help by requiring proof that their clients are licensed to operate a motorcycle when selling them motorcycle insurance. Another issue in licensing is that of the level of skill. Different types of motorcycles require different levelsof skill to operate them safely, and some ofthe larger, heavier models are harder to operate than light, more maneuverable models. Although the crash analysis carried out in the present study did not address this issue, the literature (Shankar, 2001) points out a national trend, especially among the older motorcyclists, toward larger, heavier motorcycles. Anecdotal evidence suggests that some motorcyclists take the driving test on small, maneuverable motorcycles, and once licensed, drive motorcycles that require considerably more skill. One way of ensuring that motorcyclists have the appropriate skills for their motorcycles could be to require changes in the licensing tests. For example, everyone could be required to pass the driving test on the most challenging motorcycle. While this approach is probably somewhat impractical, it may be possible to have several levels of motorcycle endorsement, corresponding to categories of motorcycles. That way, the skills of the motorcyclists would be appropriate for the motorcycle they are operating.
59 A study comparing the Michigan motorcycle fleet, the type of motorcycles used in driving tests, and the types of motorcycles used by various segments of motorcyclists would be useful in determining if this is really a problem. Another known but not well-documented issue is that although most motorcyclists wear helmets, some of the helmetsare not DOT-approved as required by law, and offer little protection in the event of a crash. Public information programs could help to increase the awareness of the dangers of not using the appropriate gear. A small study could be designed to quantify the extent of the problem, and perhaps use focus groups to help understand this behavior, and develop strategies to counter it. Because the number of motorcycles is increasing, motorists are encountering more motorcycles on the road. Many motorists do not know the limitations and capabilities of motorcycles, and do not know how to drive safely near them. A public education campaign educating motorists about the differences between the operating characteristics of cars and motorcycles, and the safe ways to drive near motorcycles would help. Similar campaigns have been used to educate motorists how do drive near large trucks. Driving schools and driver education programs in schools could also include a lesson on how to drive near motorcycles. A study of how motorists perceive motorcycles, their attitudes toward them, and how much they know about the operating characteristicsof motorcycles would be helpful in developing the educational materials.
60 REFERENCES Eby, D.W., Kostyniuk, L.P., Molnar, L.J., Joksch, H.C. and Vivoda, J.M. (2002). The Effects of Standard Safety Belt Enforcement on Police Harassment: Year 2 Annual Report, Report No. UMTRI Ann Arbor, MI: University of Michigan Transportation Research Institute Kostyniuk, L.P. (2003). Michigan's Transportation Crash Profile, Presentation at Michigan Transportation Summit, October 6, Lansing, MI: Michigan Department of Transportation. Kostyniuk, L.P. and Miller, L.L. (2003). Fatal and Seious-Injury Traffic Crash Trends in Michigan: Report No. UMTRI Ann Arbor, MI: University of Michigan Transportation Research Institute Michigan Department of State (2002). Registration, Diver License, and Title Transaction History. Lansing, MI. Michigan Vehicle Code, Act 300 of 1949, a. Motorcycle Endorsement. Michigan Vehicle Code, Act 300 of 1949 Section Crash Helmets. Motorcycle Industry Council (2001) Motorcycle StatisticalAnnual. ( National Highway Traffic Safety Administration (2003a). Motorcycle Safety Program Washington, DC: US Department of Transportation. National Highway Traffic Safety Administration (2003b). Traffic Safety Facts 2002, Motorcycles. Washington, DC: US Department of Transportation. National Highway Traffic Safety Administration (2003~). FARS Analytic Reference Guide Washington, DC: US Department of Transportation.
61 National Highway Traffic Safety Administration (2003d). Motor Vehicle Traffic Crash Fatality and Injury Estimates for /Assess02.pdf. (Accessed August, 2003) Shankar, U.G. (2001). Recent Trendsin Fatal Motorcycle Crashes Report No. DOT HS , Washington, DC: U.S. Department of Transportation. State of Michigan (1999). UD-10 Traffic Crash Report Instruction Manual, Lansing MI, Michigan Department of State Police. UMTRI Transportation Data Center (1 998). State of Michigan 1997 Motor Vehicle Accident Codebook. Ann Arbor, MI: University of Michigan Transportation Research Institute. UMTRI Transportation Data Center (1 999). State of Michigan 1998 Motor Vehicle Accident Codebook. Ann Arbor, MI: University of Michigan Transportation Research Institute. UMTRI Transportation Data Center (2000). State of Michigan 1999 Motor Vehicle Accident Codebook. Ann Arbor, MI: University of Michigan Transportation Research Institute. UMTRI Transportation Data Center (2001). State of Michigan 2000 Motor Vehicle Accident Codebook. Ann Arbor, MI: University of Michigan Transportation Research Institute. UMTRI Transportation Data Center (2002). State of Michigan 2001 Motor Vehicle Accident Codebook. Ann Arbor, MI: University UMTRI Transportation Data Center (2003). State of Michigan 2002 Motor Vehicle Accident Codebook. Ann Arbor, MI: University of Michigan Transportation Research Institute.
62 APPENDIX A Motorcycle Licenses by Age and Sex,
63
64
Where are the Increases in Motorcycle Rider Fatalities?
 Where are the Increases in Motorcycle Rider Fatalities? Umesh Shankar Mathematical Analysis Division (NPO-121) Office of Traffic Records and Analysis National Center for Statistics and Analysis National
ITSMR Research Note. Motorcyclists and Impaired Driving ABSTRACT INTRODUCTION KEY FINDINGS. September 2013
 September 2013 KEY FINDINGS F&PI CRASHES INVOLVING IMPAIRED MOTORCYCLISTS 27% of the fatal MC crashes over the five year period, 2008-2012, were alcohol-related. 48% of the alcohol-related F&PI MC crashes
Michigan State Police (MSP) Post 21 - Metro North
 Post 21 - Metro North") June 2018 Revised 8/3/2018 2017 Reporting Criteria Please pay particular attention to the wording when interpreting the three levels of data gathered for this report. Crash The Crash Level analyzes data
June 2018 Revised 8/3/2018 2017 Reporting Criteria Please pay particular attention to the wording when interpreting the three levels of data gathered for this report. Crash The Crash Level analyzes data
Michigan State Police (MSP) Post 21 - Metro North
 Post 21 - Metro North") October 2017 2016 Reporting Criteria Please pay particular attention to the wording when interpreting the three levels of data gathered for this report. Crash The Crash Level analyzes data related to crash
October 2017 2016 Reporting Criteria Please pay particular attention to the wording when interpreting the three levels of data gathered for this report. Crash The Crash Level analyzes data related to crash
National Center for Statistics and Analysis Research and Development
 U.S. Department of Transportation National Highway Traffic Safety Administration DOT HS 809 271 June 2001 Technical Report Published By: National Center for Statistics and Analysis Research and Development
Michigan. Traffic. Profile
 June 2014 Revised 5/11/15 Michigan 2013 Traffic Crash Profile Reporting Criteria Please pay particular attention to the wording when interpreting the three levels of data gathered for this report. Crash
National Center for Statistics and Analysis Research and Development
 U.S. Department of Transportation National Highway Traffic Safety Administration DOT HS 809 360 October 2001 Technical Report Published By: National Center for Statistics and Analysis Research and Development
Traffic Safety Network Huron Valley
 June 2018 Revised 8/3/2018 2017 Reporting Criteria Please pay particular attention to the wording when interpreting the three levels of data gathered for this report. Crash The Crash Level analyzes data
Michigan. Traffic. Profile
 June 2014 Revised 5/11/15 Michigan 2013 Traffic Crash Profile Reporting Criteria Please pay particular attention to the wording when interpreting the three levels of data gathered for this report. Crash
Figure 15. Yearly Trend in Death Rates for Motor Vehicle Transport: NSW, Year
 6.0 MOTOR VEHICLE TRANSPORT 6.1 Deaths due to Motor Vehicle Transport: The motor vehicle transport (MV) death rate showed a statistically significant decrease overall between 1989 and 1999 although the
Michigan State Police (MSP) Traffic Safety Network Traverse Bay Area
 Traffic Safety Network Traverse Bay Area") June 2016 Revised 2/15/2017 2015 Reporting Criteria Please pay particular attention to the wording when interpreting the three levels of data gathered for this report. Crash The Crash Level analyzes data
June 2016 Revised 2/15/2017 2015 Reporting Criteria Please pay particular attention to the wording when interpreting the three levels of data gathered for this report. Crash The Crash Level analyzes data
Washtenaw County Traffic Crash Data & Year Trends. Reporting Criteria
 June 2018 Revised 8/3/2018 2017 Reporting Criteria Please pay particular attention to the wording when interpreting the three levels of data gathered for this report. Crash The Crash Level analyzes data
Washtenaw County Traffic Crash Data & Year Trends. Reporting Criteria
 June 2017 Revised 10/3/17 2016 Reporting Criteria Please pay particular attention to the wording when interpreting the three levels of data gathered for this report. Crash The Crash Level analyzes data
Alberta Speeding Convictions and Collisions Involving Unsafe Speed
 Alberta Speeding Convictions and Collisions Involving Unsafe Speed 2004-2008 Overview This document was prepared under the Alberta Traffic Safety Plan, Strategic Research Plan for 2008-2010, with the objective
Rates of Motor Vehicle Crashes, Injuries, and Deaths in Relation to Driver Age, United States,
 RESEARCH BRIEF This Research Brief provides updated statistics on rates of crashes, injuries and death per mile driven in relation to driver age based on the most recent data available, from 2014-2015.
Kent County Traffic Crash Data & Year Trends. Reporting Criteria
 May 2015 Revised 3/16/2016 2014 Reporting Criteria Please pay particular attention to the wording when interpreting the three levels of data gathered for this report. Crash The Crash Level analyzes data
ROADWAY INJURY EXPERIENCE FOR PERSONS WHO HAD BEEN DRINKING AND/OR USING DRUGS
 ROADWAY INJURY EXPERIENCE FOR PERSONS WHO HAD BEEN DRINKING AND/OR USING DRUGS Vehicle Severity Total Crashes involving drinking, not drugs Crashes involving drugs, not drinking Crashes involving drinking
Van Buren County Traffic Crash Data & Year Trends. Reporting Criteria
 May 2015 Revised 3/16/2016 2014 Reporting Criteria Please pay particular attention to the wording when interpreting the three levels of data gathered for this report. Crash The Crash Level analyzes data
Road Safety s Mid Life Crisis The Trends and Characteristics for Middle Aged Controllers Involved in Road Trauma
 Road Safety s Mid Life Crisis The Trends and Characteristics for Middle Aged Controllers Involved in Road Trauma Author: Andrew Graham, Roads and Traffic Authority, NSW Biography: Andrew Graham has been
UMTRI An Examination of the Michigan 2010 Motor Vehicle Traffic Crash Fatality Increase
 UMTRI-2011-31 An Examination of the Michigan 2010 Motor Vehicle Traffic Crash Fatality Increase Carol A. Flannagan Andrew J. Leslie Helen K. Spradlin Charles P. Compton Caroline S. Lupini September 2011
Austin Police Department. An Analysis of Traffic Fatalities 2015
 Austin Police Department An Analysis of Traffic Fatalities Prepared by the Austin Police Department Research and Planning Unit April Table of Contents Background... Overview... Terminology... Notes about
Fatal Motor Vehicle Crashes on Indian Reservations
 April 2004 DOT HS 809 727 Fatal Motor Vehicle Crashes on Indian Reservations 1975-2002 Technical Report Colleges & Universities 2% Other Federal Properties 9% Other 4% Indian Reservations 65% National
HAS MOTORIZATION IN THE U.S. PEAKED? PART 2: USE OF LIGHT-DUTY VEHICLES
 UMTRI-2013-20 JULY 2013 HAS MOTORIZATION IN THE U.S. PEAKED? PART 2: USE OF LIGHT-DUTY VEHICLES MICHAEL SIVAK HAS MOTORIZATION IN THE U.S. PEAKED? PART 2: USE OF LIGHT-DUTY VEHICLES Michael Sivak The University
TRAFFIC SAFETY FACTS. Overview Data
 TRAFFIC SAFETY FACTS 2009 Data Overview Motor vehicle travel is the primary means of transportation in the United States, providing an unprecedented degree of mobility. Yet for all its advantages, injuries
Delaware Information and Analysis Center
 Delaware Information and Analysis Center 2015 DELAWARE THERE WERE 684,731 LICENSED DRIVERS, 892,508 REGISTERED MOTOR VEHICLES, AND 9,761,000,000 VEHICLE MILES DRIVEN*. THERE WERE 24,066 TRAFFIC CRASHES
Analysis of Road Crash Statistics Western Australia 1990 to Report. December Project: Transport/21
 Analysis of Road Crash Statistics Western Australia 1990 to 1999 Report December 2000 Project: Transport/21 Analysis of Road Crash Statistics Western Australia 1990 to 1999 December 2000 Client: Transport
DOT HS April 2013
 TRAFFIC SAFETY FACTS 2011 Data DOT HS 811 753 April 2013 Overview Motor vehicle travel is the primary means of transportation in the United States, providing an unprecedented degree of mobility. Yet for
2015 Community Report Las Vegas
 5 Las Vegas Produced for the New Mexico Department of Transportation, Traffic Safety Division, Traffic Records Bureau, Under Contract 58 by the University of New Mexico, Geospatial and Population Studies,
Department of Highway Safety and Motor Vehicles
 Department of Highway Safety and Motor Vehicles Traffic Report 2005 A Compilation of Motor Vehicle Crash Data from the Florida Crash Records Database Fred O. Dickinson Executive Director Our Mission: Making
2015 Community Report White Rock
 5 White Rock Produced for the New Mexico Department of Transportation, Traffic Safety Division, Traffic Records Bureau, Under Contract 58 by the University of New Mexico, Geospatial and Population Studies,
2016 Community Report Los Alamos County
 6 Los Alamos County Produced for the New Mexico Department of Transportation, Traffic Safety Division, Traffic Records Bureau, Under Contract 58 by the University of New Mexico, Geospatial and Population
Rio Arriba County Report, 2007
 Rio Arriba County Report, 7 Demographics In 7, there were 3,748 licensed drivers in Rio Arriba County. Of these, there were,68 females and,63 males. The population in Rio Arriba County was 4,87. The total
2016 Community Report Portales
 6 Portales Produced for the New Mexico Department of Transportation, Traffic Safety Division, Traffic Records Bureau, Under Contract 58 by the University of New Mexico, Geospatial and Population Studies,
SEGMENT 2 DRIVER EDUCATION Risk Awareness
 Fact Sheet 1 Why Should Young Drivers Be Concerned? Risk is the chance of death, injury, damage, or loss. Approximately 1 out of 11 (9%) of 16-year-old drivers will have a serious crash before his/her
2016 Community Report Torrance County
 6 Torrance County Produced for the New Mexico Department of Transportation, Traffic Safety Division, Traffic Records Bureau, Under Contract 58 by the University of New Mexico, Geospatial and Population
2015 Community Report Torrance County
 5 Torrance County Produced for the New Mexico Department of Transportation, Traffic Safety Division, Traffic Records Bureau, Under Contract 58 by the University of New Mexico, Geospatial and Population
2015 Community Report Grants
 5 Grants Produced for the New Mexico Department of Transportation, Traffic Safety Division, Traffic Records Bureau, Under Contract 58 by the University of New Mexico, Geospatial and Population Studies,
2016 Community Report De Baca County
 6 De Baca County Produced for the New Mexico Department of Transportation, Traffic Safety Division, Traffic Records Bureau, Under Contract 58 by the University of New Mexico, Geospatial and Population
Los Lunas Community Report, 2002
 Los Lunas Community Report, Demographics In, there were, licensed drivers in Los Lunas. Of these, there were, females and, males. The population of Los Lunas was,. The total number of crashes in was, yielding
2014 Community Report Las Vegas
 4 Las Vegas Produced for the New Mexico Department of Transportation, Traffic Safety Division, Traffic Records Bureau, Under Contract 58 by the University of New Mexico, Geospatial and Population Studies,
2015 Community Report Tularosa
 5 Tularosa Produced for the New Mexico Department of Transportation, Traffic Safety Division, Traffic Records Bureau, Under Contract 58 by the University of New Mexico, Geospatial and Population Studies,
2016 Community Report Santa Fe County
 26 Santa Fe County Produced for the New Mexico Department of Transportation, Traffic Safety Division, Traffic Records Bureau, Under Contract 58 by the University of New Mexico, Geospatial and Population
2015 Community Report Chaparral
 5 Chaparral Produced for the New Mexico Department of Transportation, Traffic Safety Division, Traffic Records Bureau, Under Contract 58 by the University of New Mexico, Geospatial and Population Studies,
2016 Community Report Aztec
 Aztec Produced for the New Mexico Department of Transportation, Traffic Safety Division, Traffic Records Bureau, Under Contract 58 by the University of New Mexico, Geospatial and Population Studies, Traffic
2015 Community Report Aztec
 25 Aztec Produced for the New Mexico Department of Transportation, Traffic Safety Division, Traffic Records Bureau, Under Contract 58 by the University of New Mexico, Geospatial and Population Studies,
2016 Community Report San Juan County
 26 San Juan County Produced for the New Mexico Department of Transportation, Traffic Safety Division, Traffic Records Bureau, Under Contract 58 by the University of New Mexico, Geospatial and Population
2015 Community Report San Juan County
 25 San Juan County Produced for the New Mexico Department of Transportation, Traffic Safety Division, Traffic Records Bureau, Under Contract 58 by the University of New Mexico, Geospatial and Population
2015 Community Report Doña Ana County
 25 Doña Ana County Produced for the New Mexico Department of Transportation, Traffic Safety Division, Traffic Records Bureau, Under Contract 58 by the University of New Mexico, Geospatial and Population
RTCSNV CRASH ANALYSIS REPORT
 2011-2015 RTCSNV CRASH ANALYSIS REPORT TABLE OF CONTENTS Summary... 3 Crash Types... 4 Time and Day of Crashes... 7 Crash Factors... 9 Fatalities... 10 Driver s Behavior... 11 Crash Locations... 15 Non-Motorized
2015 Community Report Los Lunas
 25 Los Lunas Produced for the New Mexico Department of Transportation, Traffic Safety Division, Traffic Records Bureau, Under Contract 58 by the University of New Mexico, Geospatial and Population Studies,
DOT HS July 2012
 TRAFFIC SAFETY FACTS 2010 Data DOT HS 811 639 July 2012 Motorcycles In 2010, 4,502 motorcyclists were killed a slight increase from the 4,469 motorcyclists killed in 2009. There were 82,000 motorcyclists
2014 Community Report Portales
 4 Portales Produced for the New Mexico Department of Transportation, Traffic Safety Division, Traffic Records Bureau, Under Contract 58 by the University of New Mexico, Geospatial and Population Studies,
Doña Ana County Report, 2001
 Doña Ana County Report, 1 Demographics In 1, there were 7,7 licensed drivers in Doña Ana County. Of these, there were 17,15 females and,115 males. The population in Doña Ana County was 87,1. The total
ALCOHOL AND WYOMING TRAFFIC CRASHES
 AND WYOMING TRAFFIC -2007- 2002-2007 SUMMARY COMPARISON FOR WYOMING TRAFFIC YEAR OF 2002 2003 2004 2005 2006 2007 ALL FATAL 151 141 142 147 169 136 FATAL 53 43 50 51 58* 46* PERCENT [%] 35.0% 30.5% 35.2%
2014 Community Report Luna County
 4 Luna County Produced for the New Mexico Department of Transportation, Traffic Safety Division, Traffic Records Bureau, Under Contract 58 by the University of New Mexico, Geospatial and Population Studies,
Traffic Safety Facts 2002
 DOT HS 89 616 U.S. Department of Transportation National Highway Traffic Safety Administration Traffic Safety Facts 22 A Public Information Fact Sheet on Motor Vehicle and Traffic Safety Published by the
HAS MOTORIZATION IN THE U.S. PEAKED? PART 5: UPDATE THROUGH 2012
 UMTRI-2014-11 APRIL 2013 HAS MOTORIZATION IN THE U.S. PEAKED? PART 5: UPDATE THROUGH 2012 MICHAEL SIVAK HAS MOTORIZATION IN THE U.S. PEAKED? PART 5: UPDATE THROUGH 2012 Michael Sivak The University of
Rio Arriba County Report, 2002
 Rio Arriba County Report, Demographics In, there were,8 licensed drivers in Rio Arriba County. Of these, there were 8,8 females and 8,8 males. The population in Rio Arriba County was,9. The total number
2016 Community Report New Mexico
 216 Produced for the Department of Transportation, Traffic Safety Division, Traffic Records Bureau, Under Contract 581 by the University of, Geospatial and Population Studies, Traffic Research Unit Distributed
MOTORISTS' PREFERENCES FOR DIFFERENT LEVELS OF VEHICLE AUTOMATION: 2016
 SWT-2016-8 MAY 2016 MOTORISTS' PREFERENCES FOR DIFFERENT LEVELS OF VEHICLE AUTOMATION: 2016 BRANDON SCHOETTLE MICHAEL SIVAK SUSTAINABLE WORLDWIDE TRANSPORTATION MOTORISTS' PREFERENCES FOR DIFFERENT LEVELS
2014 Community Report Truth or Consequences
 4 Truth or Consequences Produced for the New Mexico Department of Transportation, Traffic Safety Division, Traffic Records Bureau, Under Contract 58 by the University of New Mexico, Geospatial and Population
2014 Community Report Tularosa
 4 Tularosa Produced for the New Mexico Department of Transportation, Traffic Safety Division, Traffic Records Bureau, Under Contract 8 by the University of New Mexico, Geospatial and Population Studies,
TRAFFIC SAFETY FACTS Fatal Motor Vehicle Crashes: Overview. Research Note. DOT HS October 2017
 TRAFFIC SAFETY FACTS Research Note DOT HS 812 456 October 2017 2016 Fatal Motor Vehicle Crashes: Overview There were 37,461 people killed in crashes on U.S. roadways during 2016, an increase from 35,485
2014 Community Report Aztec
 Aztec Produced for the New Mexico Department of Transportation, Traffic Safety Division, Traffic Records Bureau, Under Contract 58 by the University of New Mexico, Geospatial and Population Studies, Traffic
Driving Safely in Maryland
 Maryland Department of Transportation State Highway Administration Office of Traffic and Safety Driving Safely in Maryland In 2008, there were 141 fatal speeding crashes, accounting for 28% of all fatal
2014 Community Report Los Lunas
 4 Los Lunas Produced for the New Mexico Department of Transportation, Traffic Safety Division, Traffic Records Bureau, Under Contract 58 by the University of New Mexico, Geospatial and Population Studies,
Gallup Community Report, 2007
 Gallup Community Report, 7 Demographics In 7, there were,8 licensed drivers in Gallup. Of these, there were 7,9 females and 7,9 males. The population of Gallup was 8,8. The total number of crashes in 7
Large Trucks. Trends. About 1 in 10 highway deaths occurs in a crash involving a large truck.
 Large Trucks About 1 in 10 highway deaths occurs in a crash involving a large truck. Most deaths in large truck crashes are passenger vehicle occupants. The main problem is the vulnerability of people
Young drivers. Drivers involved in fatal or injury crashes. Drivers involved in fatal/injury crashes per 100. per licence holders (lines)
") Young drivers CRASH FACTSHEET 2012 CRASH STATISTICS FOR THE YEAR ENDED 31 DECEMBER 2011 Prepared by the Ministry of Transport In 2011 young drivers aged 15 24 were involved in 80 fatal traffic crashes,
Young drivers CRASH FACTSHEET 2012 CRASH STATISTICS FOR THE YEAR ENDED 31 DECEMBER 2011 Prepared by the Ministry of Transport In 2011 young drivers aged 15 24 were involved in 80 fatal traffic crashes,
 1 of 7 9/23/2015 5:20 PM Demographics In 2008, there were 91,559 licensed drivers in Sandoval County. Of these, there were 46,678 females and 44,881 males. The population of Sandoval County was 122,298.
 1 of 7 9/23/2015 5:23 PM Demographics In 2008, there were 12,286 licensed drivers in Socorro County. Of these, there were 5,872 females and 6,414 males. The population of Socorro County was 18,180. The
DOT HS October 2011
 TRAFFIC SAFETY FACTS 2009 Data DOT HS 811 389 October 2011 Motorcycles Definitions often vary across publications with respect to individuals on motorcycles. For this document, the following terms will
Excessive speed as a contributory factor to personal injury road accidents
 Excessive speed as a contributory factor to personal injury road accidents Jonathan Mosedale and Andrew Purdy, Transport Statistics: Road Safety, Department for Transport Summary This report analyses contributory
ITSMR Research Note. Recidivism in New York State: A Status Report ABSTRACT INTRODUCTION KEY FINDINGS RECIDIVISM RATES
 January 2017 KEY FINDINGS RECIDIVISM RATES The recidivism rate was 20% in down from 21% in, 22% in and down substantially from 29% in. In, the highest rate of recidivism occurred among drivers convicted
A Question of Size: Involvement of Large Trucks in Road Crashes
 A Question of Size: Involvement of Large Trucks in Road Crashes Steve Brown Research Associate Traffic Injury Research Foundation 3 rd Ontario Road Safety Forum Toronto, Ontario March 6, 2018 Involvement
Motorcyclist Deaths Jan Jul. 2018
 Motorcyclist Deaths Jan. 2008 Jul. 2018 This report summarizes all accidental deaths of motorcyclists in traffic-related motor vehicle incidents (MVIs) between January 1, 2008 and July 30, 2018. Inclusion
Traffic Safety Facts 1995
 U.S. Department of Transportation National Highway Traffic Safety Administration Traffic Safety Facts 1995 exceeding the posted speed limit or driving too fast for conditions is one of the most prevalent
Statistics and Facts About Distracted Driving
 Untitled Document Statistics and Facts About Distracted Driving What does it mean to be a distracted driver? Are you one? Learn more here. What Is Distracted Driving? There are three main types of distraction:
Traffic Accident Statistics
 2000 Missouri State Highway System Traffic Accident Statistics Missouri State Highway System Traffic Accident Statistics Table of Contents Subject Chapter 1: Statewide Traffic Accident Statistics, Introduction
Demographics An updated licensed driver count is not available for Navajo Nation for The total number of crashes in 2008 was 95.
 1 of 6 9/23/2015 4:57 PM Demographics An updated licensed driver count is not available for Navajo Nation for 2008. The total number of crashes in 2008 was 95. General Crash Information From 1999 to 2008
Provisional Review of Fatal Collisions. January to December 31 st 2017
 Provisional Review of Fatal Collisions January to December 31 st 17 2 nd January 18 Review of 17 fatal collision statistics as of 31st December 17 Overview This report summarises the main trends in road
ITSMR Research Note. Young Drivers on New York Roadways:
 January 2019 KEY FINDINGS In 2017: 113 persons were killed in motor vehicle crashes involving young drivers, compared to 139 in 2013. 22,485 persons were injured in young driver crashes, down 5% from 2013.
1 of 7 9/22/2015 1:20 PM
 1 of 7 9/22/2015 1:20 PM Demographics In 2009, there were 27,245 licensed drivers in Alamogordo. Of these, there were 13,674 females and 13,571 males. The population of Alamogordo was 35,984. The total
Evaluation of Kentucky s Driver License Point System
 Transportation Kentucky Transportation Center Research Report University of Kentucky Year 1998 Evaluation of Kentucky s Driver License Point System Kenneth R. Agent Nick Stamatiadis Jerry G. Pigman University
Traffic Safety Facts. Alcohol Data. Alcohol-Related Crashes and Fatalities
 Traffic Safety Facts 2005 Data Alcohol There were 16,885 alcohol-related fatalities in 2005 39 percent of the total traffic fatalities for the year. Alcohol-Related Crashes and Fatalities DOT HS 810 616
LARGE TRUCKS May 2010
 May 2010 A collision produces three levels of data: collision, unit (vehicles), and individual. For this reason, readers should pay particular attention to the wording of statements about the data to avoid
Traffic Safety Facts
 Part 1: Read Sources Source 1: Informational Article 2008 Data Traffic Safety Facts As you read Analyze the data presented in the articles. Look for evidence that supports your position on the dangers
MOTORISTS' PREFERENCES FOR DIFFERENT LEVELS OF VEHICLE AUTOMATION
 UMTRI-2015-22 JULY 2015 MOTORISTS' PREFERENCES FOR DIFFERENT LEVELS OF VEHICLE AUTOMATION BRANDON SCHOETTLE MICHAEL SIVAK MOTORISTS' PREFERENCES FOR DIFFERENT LEVELS OF VEHICLE AUTOMATION Brandon Schoettle
HAS MOTORIZATION IN THE U.S. PEAKED? PART 9: VEHICLE OWNERSHIP AND DISTANCE DRIVEN, 1984 TO 2015
 SWT-2017-4 FEBRUARY 2017 HAS MOTORIZATION IN THE U.S. PEAKED? PART 9: VEHICLE OWNERSHIP AND DISTANCE DRIVEN, 1984 TO 2015 MICHAEL SIVAK SUSTAINABLE WORLDWIDE TRANSPORTATION HAS MOTORIZATION IN THE U.S.
the Ministry of Transport is attributed as the source of the material
 Young Drivers 2016 Disclaimer All reasonable endeavours are made to ensure the accuracy of the information in this report. However, the information is provided without warranties of any kind including
ENTUCKY RANSPORTATION C ENTER
 Research Report KTC-05-39/TA19-05-1F T K ENTUCKY RANSPORTATION C ENTER College of Engineering SOCIO-ECONOMIC ANALYSIS OF FATAL CRASH TRENDS (Final Report) Our Mission We provide services to the transportation
In-depth analysis of speed-related road crashes
 Summary In-depth analysis of speed-related road crashes TØI Report 1569/2017 Author: Alena Høye Oslo 2017 109 pages Norwegian language The report summarizes detailed results of in-depth investigations
IS THE U.S. ON THE PATH TO THE LOWEST MOTOR VEHICLE FATALITIES IN DECADES?
 UMTRI-2008-39 JULY 2008 IS THE U.S. ON THE PATH TO THE LOWEST MOTOR VEHICLE FATALITIES IN DECADES? MICHAEL SIVAK IS THE U.S. ON THE PATH TO THE LOWEST MOTOR VEHICLE FATALITIES IN DECADES? Michael Sivak
file:///n:/students/maurreen/for Website/reports/Community/comm_10/...
 1 of 7 4/27/2015 11:28 AM Demographics In 2010, there were 12,013 licensed drivers in Aztec. Of these, there were 6,040 females and 5,973 males. The population of Aztec was 6,763. The total number of crashes
New York City Motorcycle Safety Study ALLEN MALLS: BEFORE, TEMPORARY MATERIALS, AFTER (CAPITAL): CHINATOWN (MANHATTAN)
: CHINATOWN (MANHATTAN)") New York City Motorcycle Safety Study 2014 Chris Brunson, Project Manager, Research Implementation and Safety Alicia Posner, Project Manager, Research Implementation and Safety New York City Department
New York City Motorcycle Safety Study 2014 Chris Brunson, Project Manager, Research Implementation and Safety Alicia Posner, Project Manager, Research Implementation and Safety New York City Department
Alberta. Collision Facts. 330 people killed. 17,907 people injured. 140,705 collisions.
 Collision Facts 330 people killed 17,907 people injured 140,705 collisions May 2017 www.transportation.alberta.ca/statistics Collision Facts 330 people killed 17,907 people injured 140,705 collisions Monday
1 of 6 9/23/2015 4:35 PM
 1 of 6 9/23/2015 4:35 PM Demographics In 2008, there were 60,539 licensed drivers in Rio Rancho. Of these, there were 30,884 females and 29,655 males. The population of Rio Rancho was 79,651. The total
Motorcycle Accident Causation and Identification of Countermeasures in Thailand Summary of Findings - Bangkok
 Motorcycle Accident Causation and Identification of Countermeasures in Thailand Summary of Findings - Bangkok The data obtained from all 723-on scenes, in-depth accident investigation cases reveal several
CHAPTER TWO AUTO CRASH STATISTICS
 CHAPTER TWO AUTO CRASH STATISTICS Age and Its Impact: Teen Drivers Teen Driving Statistics Age and Its Impact: Elderly Drivers Elderly Driving Statistics Auto Crash Statistics AGE AND ITS IMPAC T: TEEN
REAR SEAT BELT EFFECTIVENESS IN MICHIGAN
 REAR SEAT BELT EFFECTIVEESS I MICHIGA Kenneth L. Campbell Statistical Research Group University of Michigan Transportation Research Institute March 1988 This document is disseminated under the sponsorship