ROAD SAFETY IN THE WESTERN PACIFIC REGION 2015
|
|
|
- Kenneth Webb
- 5 years ago
- Views:
Transcription

1 ROAD SAFETY IN THE WESTERN PACIFIC REGION 2015
2
3 ROAD SAFETY IN THE WESTERN PACIFIC REGION 2015
4 Photo credit: WHO WPR/2016/DNH/022 World Health Organization 2016 All rights reserved.
5 CONTENTS Key facts Introduction Data collection Current situation National response Conclusions and recommendations Country profiles 3
6 4
7 KEY FACTS There were deaths from road traffic injuries in the Western Pacific Region in 2013, the latest year in which complete data were available. With 17.3 road traffic deaths for every people, the mortality rate in the Region is comparable to the global rate of Large disparities still exist within the Region, with 95% of deaths occurring in low- and middle-income countries. The risk of dying from a road traffic injury is more than 2.7 times greater in low- and middle-income countries compared to high-income countries. Of all road traffic deaths in the Region, 64% involved vulnerable road users (motorcyclists 34% of total road traffic deaths, pedestrians, 23% and cyclists, 7%). Between 2010 and 2013, the road traffic mortality rate in the Region decreased by 4.1%. The Region s 1.85 billion people own more than 463 million vehicles, 36% of which are motorized twoand three-wheelers. Australia and New Zealand are the only countries in the Region that have comprehensive legislation addressing the five main risk factors for road traffic injuries. 5
8 6
9 INTRODUCTION Globally, road traffic injuries claim more than 1.2 million lives each year and have a huge impact on health and development. They are the leading cause of death among young people aged years, and cost governments approximately 3% of gross domestic product, however the cost for low- and middle-income countries is up to 5%. The rise in global road traffic deaths has largely been caused by the escalating death toll on roads in low- and middle-income countries particularly in emerging economies where urbanization and motorization accompany rapid economic growth. In many of these countries, infrastructure development, policy changes and level of enforcement have not kept pace with increased vehicle use. In contrast, many high-income countries have managed to sever the link between rising motorization and road traffic deaths, with some managing to dramatically reduce such deaths. These achievements are the cumulative result of making infrastructure safer, improving the safety of vehicles and implementing a number of other interventions known to be effective at reducing road traffic injuries. Having good-quality data to monitor the impact of these efforts is also critical to demonstrating their success. In addition to deaths on roads, up to 50 million people incur non-fatal injuries each year as a result of road traffic crashes and additional indirect health consequences that are associated with this growing epidemic. As vehicle ownership grows, many countries face the dual problems of traffic congestion and rising vehicle emissions that result in higher rates of respiratory illness. 7
, the goal of which is to stabilize and reduce predicted levels of road traffic fatalities around the world.")
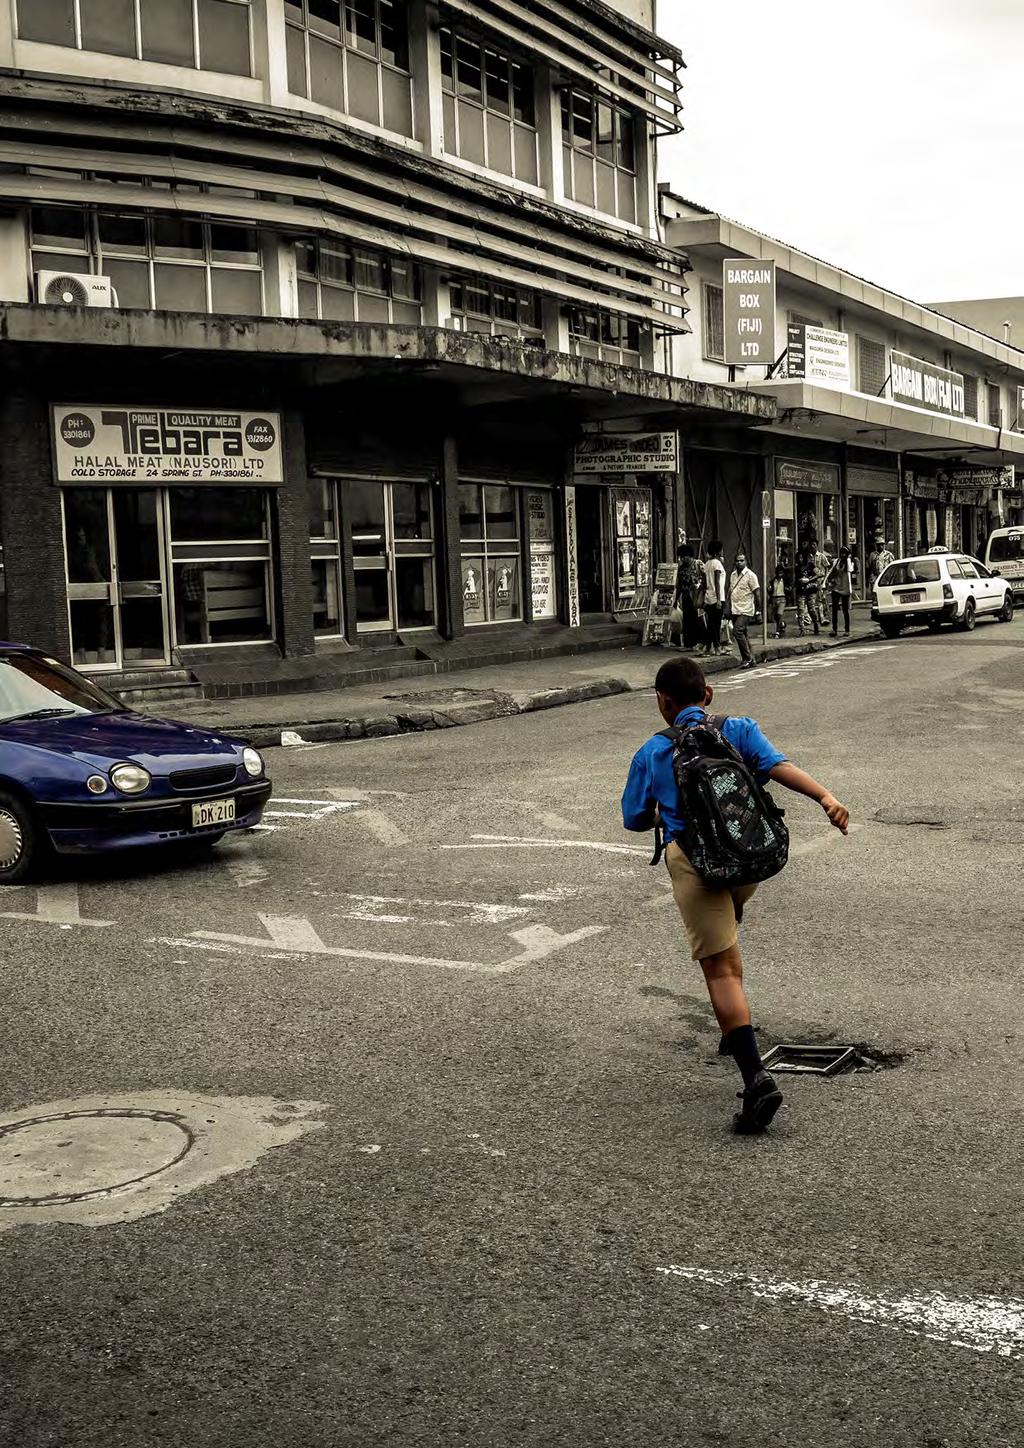
10 23% of all those killed on the Region s roads are pedestrians In 2010, the United Nations General Assembly adopted resolution A/ RES/64/255 to establish the Decade of Action for Road Safety ( ), the goal of which is to stabilize and reduce predicted levels of road traffic fatalities around the world. The Global Plan for the Decade Action for Road Safety provides the road map towards this goal by promoting proven, costeffective solutions for making roads safer. Resolution A/RES/64/255 also calls for regular monitoring of the impact of the Decade of Action through the series of Global status reports on road safety. Road Safety in the Western Pacific 2015 provides an assessment of the situation three years into the Decade of Action, highlighting the specific findings for the Western Pacific Region and is supplemental to the Global status report on road safety The objectives of this report are to describe the road safety situation in Member States, identify gaps in road safety in Member States and thereby stimulate road safety action, and monitor the progress of countries in implementing measures identified in the Global Plan for the Decade Action for Road Safety Global Status Report on Road Safety World Health Organization, Geneva ( road_safety_status/2015/en/)
.")
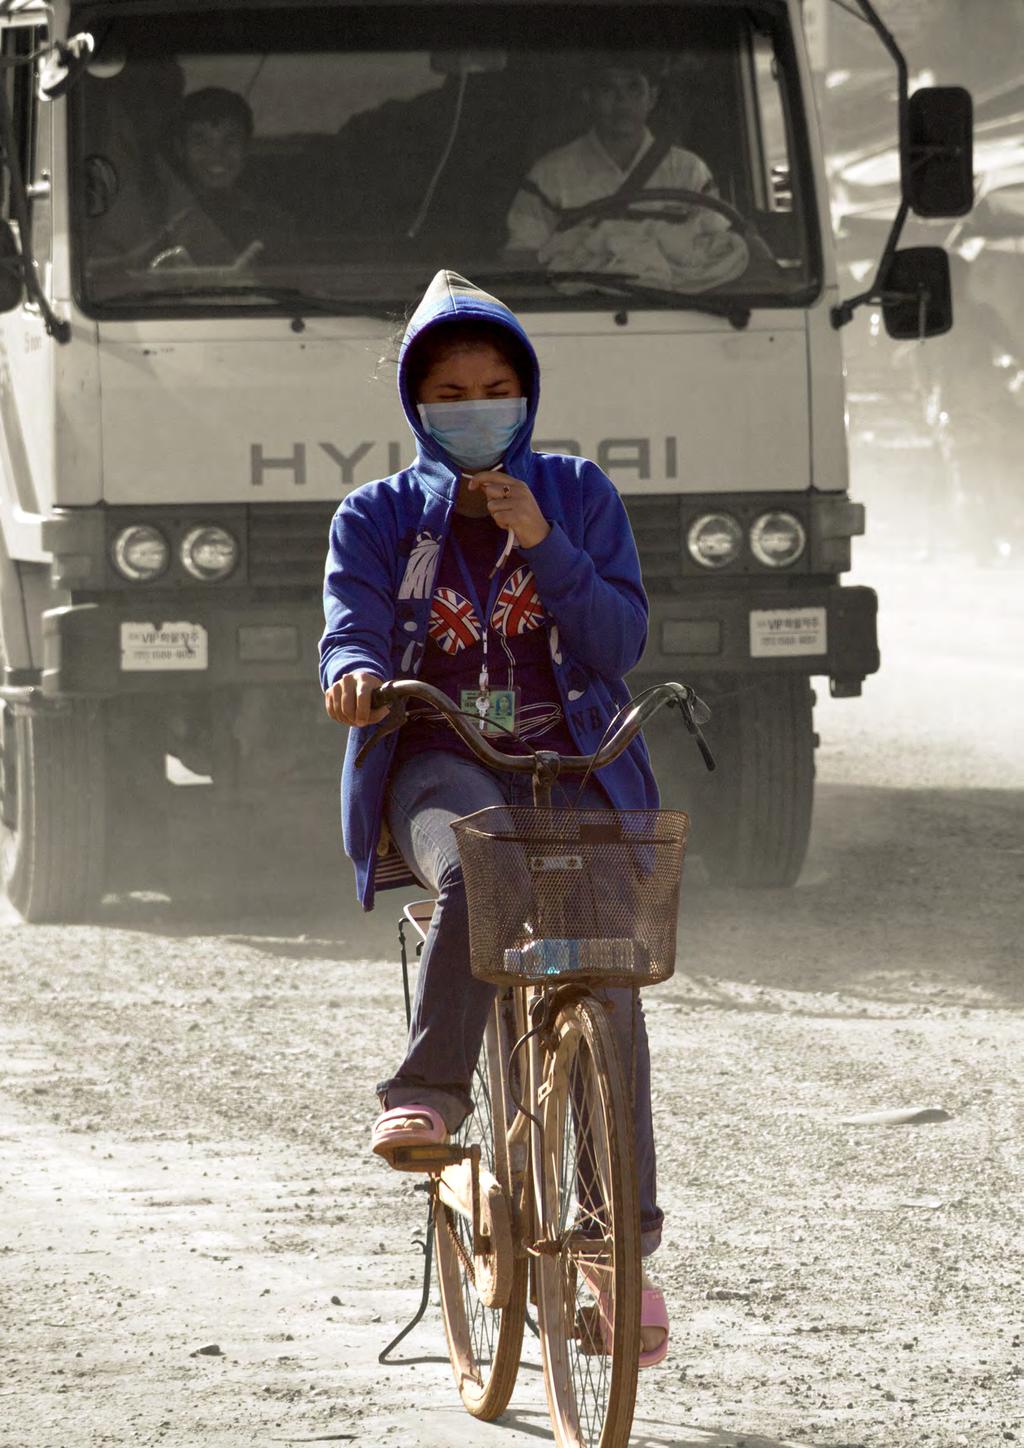
11 Rapid motorization in regional countries has contributed to increased exposure to road traffic injuries In September 2015 the United Nations launched the 2030 Agenda for Sustainable Development the development framework that replaces and builds on the achievements of the Millennium Development Goals (MDGs). Road safety was absent in the MDGs, but road safety targets have been integrated into the new Sustainable Development Goals (SDGs). SDG 3.6 target aims to halve the number of global deaths and injuries from road traffic accidents by 2020, while SDG 11.2 relates to providing access to sustainable transport systems for all, improving road safety and expanding public transport. The full report, including profiles of all participating countries, can be downloaded from the WHO website safety_status/2015/en/. 9
12 10
13 DATA COLLECTION In the Western Pacific Region, 23 countries participated in the study, representing 99.7% of the Region s 1.85 billion people. National counterparts from Brunei Darussalam, Nauru, Niue and Tuvalu either declined to participate or did not make a formal submission. Data for the global report were systematically gathered from each country in a four-step process. The process was led by government-appointed National Data Coordinators. First, within each country a self-administered questionnaire was completed by road safety stakeholders including ministries of health, transport and interior (police). Second, these respondents held a consensus meeting and agreed on the data best representing their country situation. Third, WHO regional and global technical staff validated the final data submitted for each country against independent databases and other sources. Finally, WHO obtained permission from government to include the final data in the global status report. A major new element for the Global status report on road safety 2015 was the comprehensive collection by WHO of legislative documents from all participating countries and the extraction and analysis, according to a standardized criteria, of articles relating to legislative coverage for five major behaviour risk factors speed, drink-driving, helmets, seat belts and child restraints. Road traffic mortality estimates are reported for all 27 countries in the Western Pacific Region, including those that did not participate in the study. Data on the existence and enforcement of risk factor legislation, as well as on vehicle and infrastructure safety standards, are reported for the 23 countries that participated in the study. All percentages expressed are reflective of a denominator of 23 participating countries. Complete details of the methodology are outlined in the annex in the Global status report on road safety
14 12
15 CURRENT SITUATION Road traffic injuries kill more than 885 people each day in the Western Pacific Region. WHO estimates that in 2013, the most recent year with complete data, people were killed on the roads of the Western Pacific Region with an overall mortality rate of 17.3 per people. Within such a diverse Region, country mortality rates ranged from 1.9 to 24.5 per people. Between 2010 and 2013, the road traffic mortality rate in the Region decreased by 4.1%. The greatest progress was in high-income countries in the Region, which decreased 10.1%, compared to 7.2% and 4.2% in low- and middle-income countries, respectively. This progress is encouraging, but is far from the SDG target of a 50% reduction in road traffic deaths and injuries by Compared to other WHO regions, the Western Pacific Region has the highest number of fatal road traffic injuries. More action is required to reverse the current trend. The greatest burden of road traffic injuries in the Western Pacific Region falls on the young and the economically active. Sixty-five per cent of all people killed on the Region s roads in 2013 were male 2 and 39% occurred among people aged years. 3 In high-income countries, 29% of deaths occurred in this age group; in low- and middle-income countries, the percentage was 68%. Because of the profound impact on the young and economically active population, prevention of road traffic injury should be recognized as a priority issue for economic development and poverty reduction. 2 Based on questionnaire-reported data from 20 countries. Papua New Guinea, Solomon Islands and Viet Nam did not report road traffic fatalities by sex. 3 Based on questionnaire-reported data from 17 countries. China, Fiji, Malaysia and the Philippines reported a non-comparable age breakdown in road traffic fatalities. Solomon Islands and Viet Nam did not provide an age breakdown in road traffic fatalities. 13
16 Road users in low- and middle-income countries are twice as likely to die on the roads compared to those in high-income countries of the Region. Large disparities in road traffic injuries exist within the Region (Figure 1). Some 95% of road traffic injury deaths occurred in low- and middle-income countries, where mortality rates are more than 2.7 times higher (18.7 deaths per population) than in high-income countries (7 per ). The coordinated and evidence-based approaches demonstrated in these highincome countries are key to their successes and achievements in road safety, and the lessons learnt can serve as important guidance for low- and middleincome countries. The majority of those killed on the roads in the Western Pacific Region are vulnerable road users. Of all road traffic deaths in the Region in 2013, 64% involved riders and passengers of motorcycles, pedestrians and cyclists (Figure 2). In high-income countries 4, these highly exposed road users represented 60% of the total number killed on roads, whereas in low- and middle-income countries, they accounted for 63% of all deaths. In many countries of the Region, motorcyclists are over represented in death statistics (Figure 3). For example in Australia in 2014, motorcycles accounted for 4.4% of registered vehicles 5, 0.9% of kilometres travelled 6, but 16.6% of those killed on Australia s roads. 7 The economic impact of road trauma is very high. The health and other consequences of road traffic crashes impose a high economic cost on countries, particularly low- and middle-income countries. Nine countries 8 provided estimates of the impact of traffic-related injuries on their economies, with losses to gross domestic product ranging from 1.03% (the Republic of Korea) to 2.9% (Viet Nam). 4 The Federated States of Micronesia, Solomon Islands and Viet Nam did not report a breakdown of road traffic fatalities by road user type. 5 Australian Bureau of Statistics Motor Vehicle Census ( Lookup/9309.0Main+Features131%20Jan%202015?OpenDocument, accessed 13 May 2016). 6 Australian Bureau of Statistics Survey of motor vehicle use. ( Lookup/9208.0Main+Features112%20months%20ended%2031%20October%202014?OpenDocument) 7 Department of Infrastructure and Regional Development Australian Road Death Database ( safety/fatal_road_crash_database.aspx, accessed 13 May 2016) 8 Australia, Cambodia, Japan, the Lao People s Democratic Republic, Malaysia, New Zealand, the Philippines, the Republic of Korea and Viet Nam 14
17 FIGURE 1 Road traffic mortality rates in the Western Pacific Region and WHO regions,
18 FIGURE 2 Road traffic fatalities in the Western Pacific Region, by road user, % 7% 22% 23% cyclists pedestrians motorised 2-3 wheelers car occupants others 34% FIGURE 3 Ratio of motorcyclists killed in countries of the Western Pacific Region, 2013 % vehicles % deaths 16

19 Adoption of priority vehicle standards are a crucial component of a safe systems approach to road safety Explosive motorization in countries in the Western Pacific Region has seen a 16% increase in registered vehicles. Motorization continues to increase rapidly in the Region, with the number of reported registered vehicles increasing by 16% between 2010 and Of the more than 463 million vehicles, 36% are motorcycles or other motorized two- and three-wheelers, which contributes to the exposure and high risk of road trauma. Safety standards for vehicles Only Australia, Japan and the Republic of Korea have ratified all seven priority vehicle safety standards of the United Nations World Forum for Harmonization of Vehicle Regulations. 10 Malaysia is the only low- or middle-income country in the Region to adopt any of these standards, ratifying six of the seven priority standards, with only the standard on Electronic Stability Control remaining. 9 Fiji, Palau, Solomon Islands and Vanuatu did not report a breakdown in the number of registered vehicles by type
20 18
21 NATIONAL RESPONSE Only two countries in the Western Pacific Region have road safety legislation that meets best practice. Across the Region, Australia and New Zealand are the only countries with best practice legislation covering all five main risk factors: speed, drink-driving, motorcycle helmet use, seat-belt use and child restraints. 11 Highlighting the extensive gaps in road safety legislation in the Region, five countries 12 have good practice legislation for two risk factors, eight countries 13 have legislation for one risk factor, and seven countries 14 have no legislation for any risk factor. The progress is encouraging, but evidence-based road safety legislation must be further developed and implemented throughout the Region. WHO will work with Member States to review current legislation to identify shortcomings or loopholes, ensuring that key risk factors are thoroughly covered and enforceable. The ongoing Decade of Action for Road Safety provides a unique opportunity to prioritize the revision and enforcement of critical road safety legislation. However, with only 8% of countries currently having comprehensive road safety legislation, the Region falls well short of the objective of the Decade of Action for Road Safety, which aims for 50% of countries having comprehensive legislation for all five risk factors by Due to submission deadlines, Fiji is reported in the Global status report on road safety 2015 as not having comprehensive legislation for any risk factor. Based on a legislation review completed after the publication of the report, Fiji has comprehensive legislation for speed, seat belts, motorcycle helmets and child restraints, making it the country most likely to join Australia and New Zealand in the ranks of countries with comprehensive legislation for the five main road safety risk factors. 12 China, Japan, Papua New Guinea, the Philippines and Singapore 13 Kiribati, Malaysia, the Marshall Islands, Mongolia, the Republic of Korea, Solomon Islands, Tonga and Viet Nam 14 Cambodia, Cook Islands, the Lao People s Democratic Republic, the Federated States of Micronesia, Palau, Samoa and Vanuatu 19
 in highdensity pedestrian areas.")


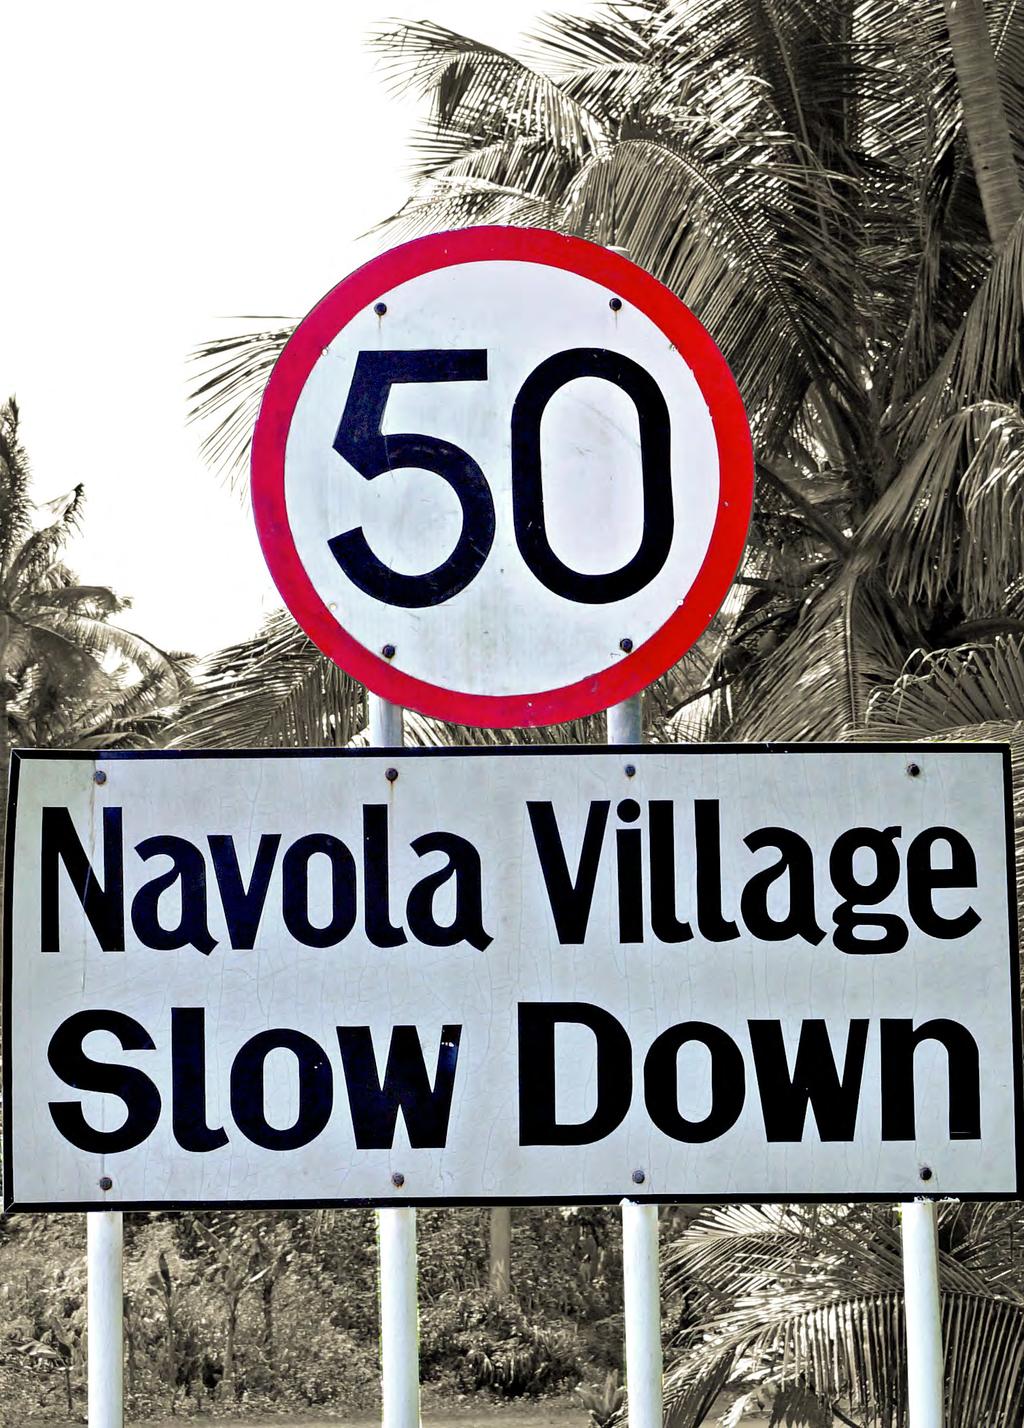
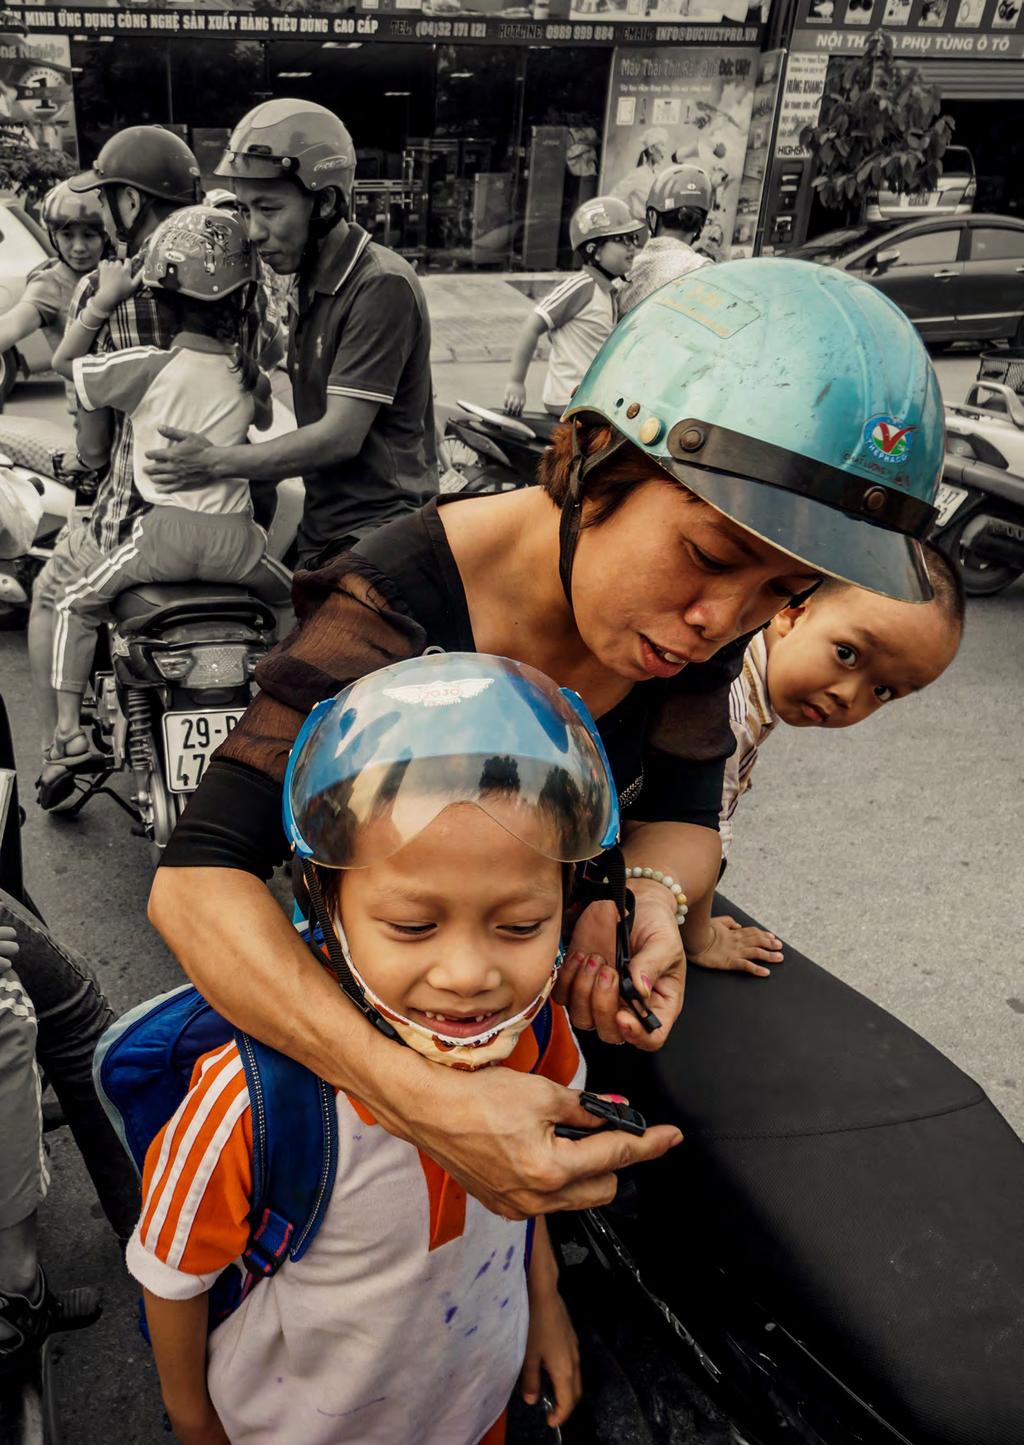
22 SPEED A maximum speed of 50 km/h in urban areas is considered best practice in order to protect pedestrians and other vulnerable road users from serious injuries. Mounting evidence suggests the need to reduce the speed limit even further (30 km/h) in highdensity pedestrian areas. Urban speed limits of less than or equal to 50 km/h are essential for the protection of pedestrians and other vulnerable road users Only four countries 15 have comprehensive legislation that imposes urban speed limits not exceeding 50 km/h and gives local authorities the power to introduce lower speed limits, if necessary. A further six countries 16 have maximum urban speed limits of less than 50km/h but do not empower local authorities to lower speed limits as required, for example in highpedestrian areas and school zones. HELMET USE Motorcycle helmets have been shown to reduce the risk of serious head injuries by 69% Motorcycle helmets must be worn by all riders and passengers, including children Worn correctly, standard-quality motorcycle helmets have been shown to reduce the risk of serious head injuries by 69%. 21 Nine countries 22 have comprehensive legislation on helmet use. A further eight countries 23 have legislation that mandates helmet use for both riders and passengers of all types of motorcycles and on all roads, but they do not specify that helmets must be correctly fastened to be considered correctly worn. With 34% (39% in low- and middle-income countries) of all road traffic deaths in the Region occurring among motorcycle riders and passengers, further action is required to ensure that helmet legislation is fully enforced and that helmets worn by riders and passengers are compliant with national quality standards and provide a high degree of head impact protection. 15 Australia, the Marshall Islands, New Zealand and the Philippines 16 Cambodia, Cook Islands, Kiribati, the Lao People s Democratic Republic, Tonga and Viet Nam 17 Australia, China and New Zealand 18 Cambodia, Japan, the Lao People s Democratic Republic, Mongolia, the Philippines, the Republic of Korea, Tonga and Viet Nam 19 Cook Islands, Fiji, Kiribati, Malaysia, Palau, Samoa and Singapore 20 Compton, R.P., Blomberg, R.D., Moskowitz, H., Burns, M., Peck, R.C. and Fiorentino, D Crash risk of alcohol impaired driving. 16th Conference of the International Council on Traffic Drugs and Alcohol Safety (ICADTS), Montreal. ( date of access 23/5/2016) 20
, WHO recommends setting and enforcing drinkdriving legislation for the general population, with a blood alcohol concentration (BAC) limit of 0.05 g/dl.")

23 DRINK-DRIVING Alcohol is a major risk factor for road traffic crashes. With international research indicating that road crash risk starts to increase exponentially at 0.04 grams/decilitre (g/dl), WHO recommends setting and enforcing drinkdriving legislation for the general population, with a blood alcohol concentration (BAC) limit of 0.05 g/dl. With driver inexperience shown to substantially increase the risk of alcohol-related crashes, WHO recommends a BAC of no greater than 0.02g/dL for novice and probationary drivers. Three countries 17 have comprehensive legislation against drink-driving. A further eight countries 18 have recommended legislation for the general population, but not specific reduced limit for novice or probationary drivers. Seven countries 19 have drink-driving legislation that sets a BAC at levels higher than 0.05 g/dl (six with a limit less than or equal to 0.08 and one with a limit less than or equal to 0.1g/dL). At these levels of alcohol impairment, drivers are times more likely to be involved in a crash compared to a driver who has not consumed alcohol. 20 The Marshall Islands, the Federated States of Micronesia, Papua New Guinea, Solomon Islands and Vanuatu do not currently have a national drink-driving law or not based on a BAC. Police enforcement must be random, widespread and highly visible in order to change driver behaviour SEAT-BELT USE Seat-belt use is a highly effective road safety intervention, shown to reduce the risk of fatal and serious injury by 40 65%. 24 Ten countries 25 have comprehensive legislation, in line with best practices, requiring all vehicle occupants (front and rear seats) to wear seat belts. A further five countries 26 have seat-belt legislation that applies to the driver and frontseat passengers only. Eight 11 countries 27 currently have no seat-belt legislation. 21 Liu B, Ivers R, rton R, et al. Helmets for preventing injury in motorcycle riders. The Cochrane Library. Chichester, UK: Wiley, Australia, Japan, Malaysia, New Zealand, Papua New Guinea, Singapore, Solomon Islands, Tonga and Viet Nam 23 Cook Islands, China, the Lao People s Democratic Republic, the Marshall Islands, Mongolia, the Philippines, the Republic of Korea and Vanuatu 24 World Health Organization. World Report on Road Traffic Injury Prevention Geneva, Switzerland 25 Australia, China, Japan, Kiribati, Mongolia, New Zealand, Papua New Guinea, the Philippines, the Republic of Korea and Singapore 26 Cambodia, the Lao People s Democratic Republic, Malaysia, Samoa and Viet Nam 27 Cook Islands, the Marshall Islands, the Federated States of Micronesia, Palau, Solomon Islands, Tonga and Vanuatu 21


24 CHILD RESTRAINTS Only two countries 28 have comprehensive legislation mandating the use of child restraints based on age, weight or height of the child and simultaneously restrict children under a specific age/height from sitting in the front seat. A further four countries 29 require children of a certain age/ weight/height to utilize child restraints, but do not restrict travel in the front seat. An age-appropriate child restraint is the safe way for a young child to travel in a car. Being held by an adult will not protect a child from serious injuries in the event of a sudden stop or crash With motorization increasing rapidly within the Region, particularly with private cars, greater communication with the public about the importance of using child restraints is crucial. Correctly fitted, child restraints reduce the risk of serious injury by up to 92% 30 and, compared to the cost of purchasing a vehicle, the cost of a child restraint is negligible. ENFORCEMENT Stringent enforcement is crucial for the injury prevention potential of legislation to be realized. For example, Japan and the Republic of Korea have mandatory seat-belt legislation for rear-seat occupants. Despite this requirement, reported wearing rates were 68% and 19%, respectively, compared to 96% in Australia and 90% in New Zealand. Only two countries 31 in the Region report good police enforcement of legislation across all five main risk factors, but opportunities for scaling up action exist throughout the Region. 32 Speed enforcement can be covert, followed by driver interception Five countries categorized enforcement as good for speed 33, nine countries for motorcycle helmets 34, eight countries for drink-driving 35, four countries for seat belts 36 and three countries for child restraints Australia and New Zealand 29 Cambodia, Japan, Kiribati and Singapore 30 World Health Organization. World Report on Road Traffic Injury Prevention Geneva, Switzerland 31 New Zealand and Singapore 32 Good enforcement was defined as a self-reported assessment of 8 or above on a scale of Australia, China, New Zealand, the Republic of Korea and Singapore 34 Australia, Japan, the Marshall Islands, New Zealand, Palau, Singapore, Solomon Islands, Tonga and Viet Nam 35 Australia, China, Japan, New Zealand, the Republic of Korea, Samoa, Singapore and Tonga 36 China, Japan, New Zealand and Singapore 37 Japan, New Zealand and Singapore 22
25 TABLE 1 Details of assessment criteria and legislation coverage for major risk factors Speed Drink-driving Child restraints Helmets Seat belts Urban speed limit 50km/h Local authorities can reduce speed limits as required BAC limit of 0.05g/dl for the general population BAC limit of 0.05g/dl for young or novice drivers Requirement for use of child restraints is based on age, weight, height or combination of these factors Restriction of children under a certain age or height from sitting in the front seat Protective helmets must be worn by all drivers and passengers, on all roads, on bikes of all engine types Law specifies helmet must be properly fastened Law specifies a national or international quality standard Applies to drivers and front-seat passengers Applies to rear-seat passengers Australia 50km/h Age Cambodia 40km/h Age Drivers only Cook Islands 40km/h China? Fiji Japan 60km/h Age Kiribati 40km/h Age Korea 80km/h Lao PDR 40km/h Malaysia 90km/h Marshall Islands 40km/h Micronesia Mongolia 60km/h New Zealand 50km/h Age Palau Papua New Guinea 60km/h Philippines 40km/h Samoa 56km/h Singapore 70km/h Weight/ height Solomon Islands Tonga 50km/h Vanuatu Viet Nam 50km/h

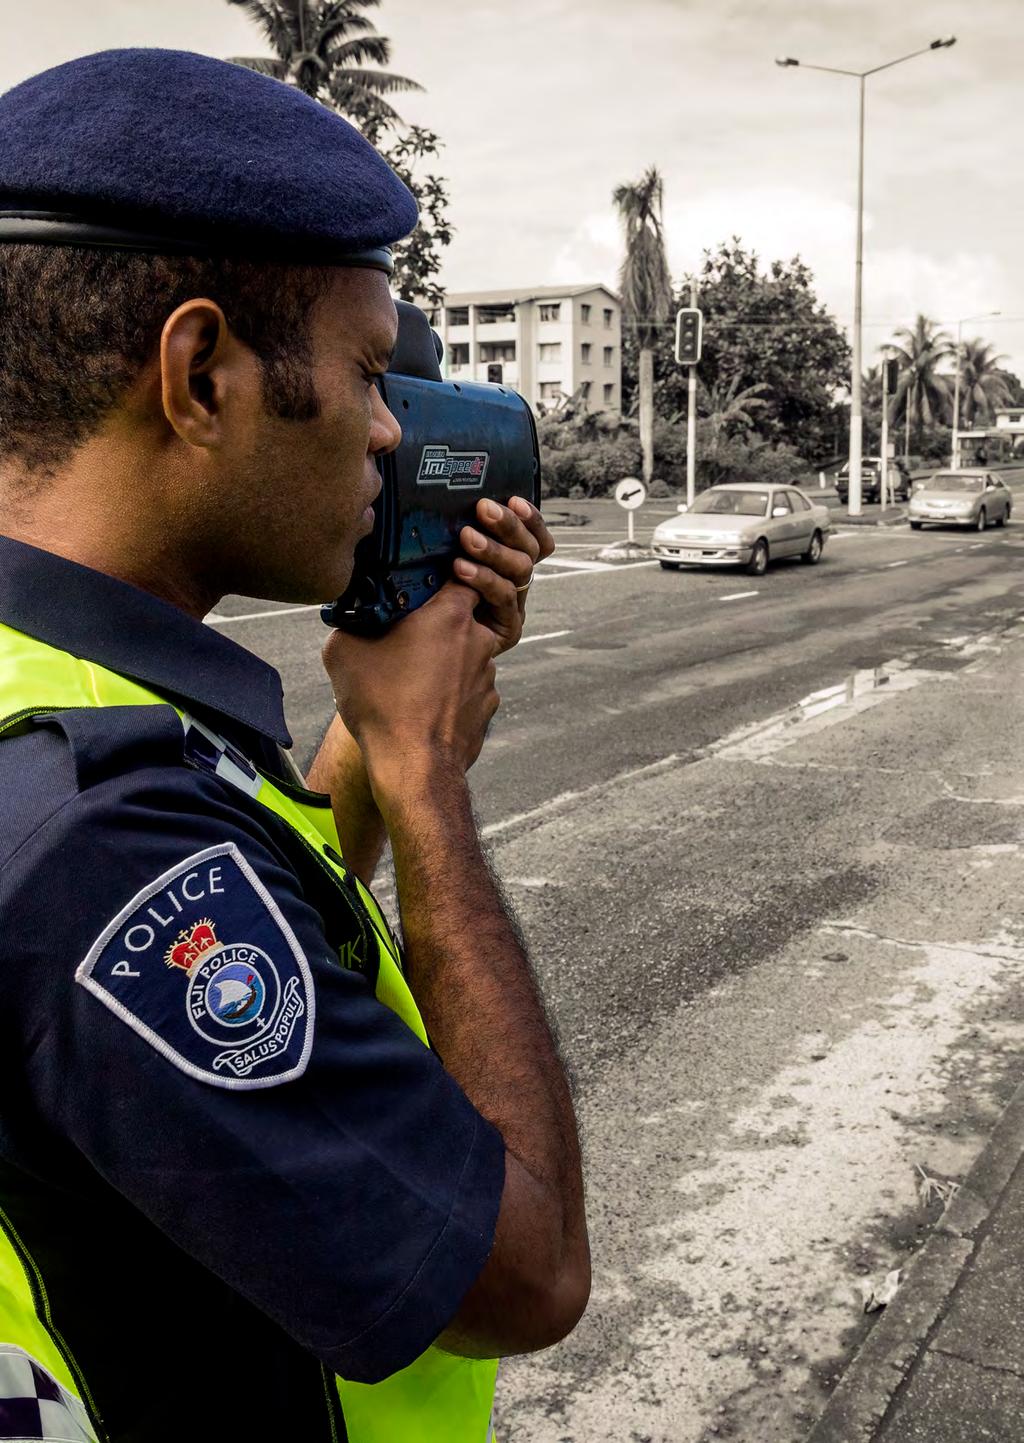
26 Social marketing campaign for road safety in Fiji Effective road safety requires a coordinated, multisectoral strategic response with sufficient human and financial resources. Whilst all participating countries except the Federated States of Micronesia have a designated lead agency for road safety, the roles and responsibilities of those lead agencies are varied. The lead agency in six countries 38 is an intersectoral/multidisciplinary committee. In 10 countries 39, the lead agency is a national transportation authority, and in another four countries the lead agency is the police. In two countries 40, the lead agency was identified as both the police and transportation agencies. While ministries of health routinely are members of the intersectoral committees, in no country in the Region does the health ministry coordinate road safety action; this highlights the need for intensive intersectoral collaboration by WHO with countries. Nineteen countries 41 have adopted some form of a national road safety strategy, with 15 of those strategies being overarching whole-of-government national strategies. Despite the existence of strategies in the majority of participating countries, only four countries 42 reported that the implementation of these strategies was fully funded; 12 countries 43 reported that strategies were partially funded, and only Australia, Mongolia and Solomon Islands reported that their national strategies were not funded Cambodia, China, Japan, Kiribati, the Lao People s Democratic Republic and Viet Nam 39 Australia, Fiji, Malaysia, Mongolia, New Zealand, Papua New Guinea, the Philippines, the Republic of Korea, Samoa and Solomon Islands 40 Singapore and Tonga 41 Australia, Cambodia, China, Cook Islands, Fiji, Japan, Kiribati, the Lao People s Democratic Republic, Malaysia, the Marshall Islands, Mongolia, New Zealand, the Philippines, the Republic of Korea, Singapore, Samoa, Solomon Islands, Tonga and Viet Nam 42 Japan, Malaysia, New Zealand and the Philippines 43 Cambodia, China, Cook Islands, Fiji, Kiribati, the Lao People s Democratic Republic, the Marshall Islands, the Republic of Korea, Samoa, Singapore, Tonga and Viet Nam

27 Ambulance services in Papua New Guinea Fifteen countries 44 have specific time-bound targets for the reduction of the number of people killed on national roads. Countries such as Australia, Cambodia, Fiji, Kiribati, the Lao People s Democratic Republic, Malaysia, Mongolia and the Philippines have strategies that specify a 10 50% reduction over a certain time period, commonly adopting the period of the Decade of Action for Road Safety. Only eight countries 45 have a national target for the reduction of serious injuries, despite the fact that these can have a far greater economic impact than fatal injuries. Coverage by emergency medical services must be improved. Access to rapid and timely pre-hospital care can save lives and prevent long- term disability. Only seven 46 countries reported that more than 75% of all seriously injured patients were transported to hospital by an ambulance. Coverage needs to be strengthened, particularly in the seven 47 countries that reported that less than 11% of seriously injured patients received care at the scene of a crash. Fourteen countries 48 reported having a single national telephone number to access emergency medical assistance. A further five countries 49 have multiple numbers for use in different geographical areas. 44 Australia, Cambodia, China, Cook Islands, Fiji, Japan, Kiribati, the Lao People s Democratic Republic, Malaysia, the Marshall Islands, Mongolia, New Zealand, the Philippines, the Republic of Korea and Viet Nam 45 Australia, Cook Islands, Japan, Kiribati, the Marshall Islands, Mongolia, the Philippines and Solomon Islands 46 China, Cook Islands, Japan, Kiribati, Malaysia, New Zealand, Palau 47 Federated States of Micronesia, Mongolia, Papua New Guinea, Tonga, Samoa, Solomon Islands and Viet Nam 48 Australia, China, Cook Islands, Japan, Lao People s Democratic Republic, Malaysia, Mongolia, New Zealand, Palau, Philippines, Republic of Korea, Solomon Islands, Vanuatu and Viet Nam. 49 Cambodia, Republic of Marshall Islands, Singapore, Samoa and Tonga 25
28 26
29 CONCLUSIONS AND RECOMMENDATIONS The Region has an overall road traffic fatality rate of 17.3 per population, similar to the global rate of The overall rate masks considerable variation among different Member States, with some Member States in the Region having some of the highest and lowest road traffic mortality rates globally. Progress has been made in many countries in the Region in implementing effective interventions to improve road safety. However, only two countries Australia and New Zealand have legislation that meets best practice across the five major road safety risk factors; virtually all countries require urgent action to strengthen coverage of road safety legislation and ensure its effective, stringent and consistent implementation through enforcement. To accelerate the pace of change in many countries in the Region, more action is needed in the following areas: This report highlights the need for countries to do more to ensure that road infrastructure is safe. Road safety audits should be conducted on both new and existing roads, assessing safety as it relates to the needs of all road users, including pedestrians and cyclists. Making walking and cycling safer will also have other positive co-benefits if these non-motorized forms of transport become more popular, including more physical exercise, reduced emissions and the health benefits associated with such changes. As well as emphasizing the prevention of crashes, this report stresses the role that post-crash care can make in mitigating the consequences of road traffic crashes. Interventions that can improve access to care, as well as the quality of care administered at health facilities, can have a major impact on outcomes. The number of road traffic deaths occurring each year in the Western Pacific Region has stabilized over the past three years. While this is positive news in the context of increasing motorization and population growth, the progress is too little and too slow. If the international road safety targets included in the SDGs a halving of road traffic deaths by 2020 are to be met, then strong political will and rapid action is needed by governments in the Region. 27


30 Enacting and enforcing laws based on best practices that relate to key behavioural risk factors are essential to realizing change. As this report has shown, most countries in the Region have multiple areas of legislation that need to be improved. The data presented here also suggest that lack of enforcement is undermining the potential of existing road safety laws to reduce injuries and deaths. More than 64% of all the road traffic deaths in the Region occur among pedestrians, cyclists and motorcyclists. Making the Region s roads safer will not be possible unless the needs of these road users are considered in all approaches to road safety including the way roads are built and the way vehicles are manufactured. This report shows that only Australia, Japan and the Republic of Korea have ratified the seven priority vehicle safety standards of the United Nations World Forum for Harmonization of Vehicle Regulations, despite the Region having a major focus on car manufacturing. Making cars safer does not only benefit car occupants, it is also important in avoiding crashes and mitigating the consequences of crashes that involve vulnerable road users. Governments must urgently agree to require manufacturers and assemblers to meet the minimum international vehicle standards, and limit the import and sale of sub-standard vehicles in their countries. As the leading cause of injury death in the Western Pacific Region, road traffic injuries are particular priorities for the recently endorsed Regional Action Plan for Violence and Injury Prevention in the Western Pacific Region ( ). Aligned to the direct and indirect Sustainable Development Goals pertaining to violence and injury prevention (including road safety), the action plan is designed to be a reference and tool to assist countries in positioning violence and injury prevention as a national development priority and to design and implement evidence-based policies, programmes and interventions relevant to the national context. For more information and to download the regional action plan, visit: _eng.pdf?ua=1. Regional Action Plan for Violence and Injury Prevention in the Western Pacific ( ) 28
31 29
32
33 COUNTRY PROFILES 30
34 AUSTRALIA Population: Income group: High Gross national income per capita: US$ INSTITUTIONAL FRAMEWORK Lead agency Department of Infrastructure and Regional Development Funded in national budget National road safety strategy Funding to implement strategy t funded Fatality reduction target 30% annually ( ) SAFER ROADS AND MOBILITY Formal audits required for new road construction projects Regular inspections of existing road infrastructure Policies to promote walking or cycling Policies to encourage investment in public transport Policies to separate road users and protect VRUs SAFER VEHICLES Total registered vehicles for Cars and 4-wheeled light vehicles Motorized 2- and 3-wheelers Heavy trucks Buses Other Vehicle standards applied a Frontal impact standard Electronic stability control Pedestrian protection a UNECE WP29. POST-CRASH CARE Emergency room injury surveillance system Emergency access telephone numbers 000 Permanently disabled due to road traffic crash 15% b b Cost of road crashes in Australia, DATA Reported road traffic fatalities (2013) b (72% M, 28% F) WHO estimated road traffic fatalities WHO estimated rate per population 5.4 Estimated GDP lost due to road traffic crashes 2.1% b c Australian Road Deaths Database, Department of Infrastructure and Regional Development. Defined as died within 30 days of crash. DEATHS BY ROAD USER CATEGORY Pedestrians (13%) Cyclists (4%) Riders motorized 2- or 3-wheelers (18%) Other (1%) Passengers 4-wheeled cars and light vehicles (17%) Source: 2013, Australian Road Deaths Database. Drivers 4-wheeled cars and light vehicles (47%) SAFER ROAD USERS* Speed limit law Max urban speed limit 50 km/h Max rural speed limit km/h Max motorway speed limit km/h Local authorities can modify limits Enforcement Drink driving law BAC limit general population g/dl BAC limit young or novice drivers 0.00 g/dl Random breath testing carried out Enforcement % road traffic deaths involving alcohol 30% d Motorcycle helmet law Applies to drivers and passengers Law requires helmet to be fastened Law refers to helmet standard Enforcement Helmet wearing rate 99% Drivers e Seat-belt law Applies to front and rear seat occupants Enforcement Seat-belt wearing rate 97% Front seats f 96% Rear seats f Child restraint law Restrictions on children sitting in front seat Child restraint law based on Age Enforcement % children using child restraints Law on mobile phone use while driving Law prohibits hand-held mobile phone use Law also applies to hands-free phones Drug-driving law d , Fatal Road Crash Database, Department of Infrastructure and Regional Development. e Haworth, N. et al. (1997) Case-Control Study of Motorcycle Crashes, CR174, Federal Office of Road Safety, Canberra. f Petroulias, T, Community Attitudes to Road Safety: 2013 survey report, Department of Infrastructure and Regional Development, Canberra. * These data take into consideration subnational laws. For more information please see Explanatory te 1. TRENDS IN REPORTED ROAD TRAFFIC DEATHS Deaths per population Source: Australian Road Deaths Database and Australian Bureau of Statistics Legislative review conducted by WHO. Vehicle safety data from UNECE WP29. Other data collected by questionnaire and cleared by the Department of Infrastructure and Regional Development. 1
35 CAMBODIA Population: Income group: Low Gross national income per capita: US$ 950 INSTITUTIONAL FRAMEWORK Lead agency National Road Safety Committee (NRSC) Funded in national budget National road safety strategy Funding to implement strategy Partially funded Fatality reduction target 50% ( ) SAFER ROADS AND MOBILITY Formal audits required for new road construction projects Regular inspections of existing road infrastructure Policies to promote walking or cycling Policies to encourage investment in public transport Policies to separate road users and protect VRUs SAFER VEHICLES Total registered vehicles for Cars and 4-wheeled light vehicles Motorized 2- and 3-wheelers Heavy trucks Buses Other Vehicle standards applied a Frontal impact standard Electronic stability control Pedestrian protection a UNECE WP29. POST-CRASH CARE Emergency room injury surveillance system Emergency access telephone numbers Permanently disabled due to road traffic crash b 2013, Road Crash & Victim Information System (RCVIS). DATA Multiple numbers 16.2% b Reported road traffic fatalities (2013) c (79% M, 20% F) WHO estimated road traffic fatalities (95% CI ) WHO estimated rate per population 17.4 Estimated GDP lost due to road traffic crashes 2.1% b c Road Crash & Victim Information System (RCVIS). Defined as died within 30 days of crash. DEATHS BY ROAD USER CATEGORY Other (3%) Drivers/passengers buses (1%) Drivers/passengers heavy trucks (2%) Pedestrians (13%) Cyclists (2%) Source: 2013, Road Crash and Victim Information System (RCVIS). Drivers 4-wheeled cars and light vehicles (3%) Passengers 4-wheeled cars and light vehicles (5%) Riders motorized 2- or 3-wheelers (71%) SAFER ROAD USERS National speed limit law Max urban speed limit 40 km/h Max rural speed limit 90 km/h Max motorway speed limit 100 km/h Local authorities can modify limits Enforcement National drink driving law BAC limit general population < 0.05 g/dl BAC limit young or novice drivers < 0.05 g/dl Random breath testing carried out Enforcement % road traffic deaths involving alcohol 15% b National motorcycle helmet law Applies to drivers and passengers Law requires helmet to be fastened Law refers to helmet standard Enforcement Helmet wearing rate 64% Drivers d, 6% Passengers d National seat-belt law Applies to front and rear seat occupants Enforcement Seat-belt wearing rate National child restraint law Restrictions on children sitting in front seat Child restraint law based on Age Enforcement % children using child restraints National law on mobile phone use while driving Law prohibits hand-held mobile phone use Law also applies to hands-free phones National drug-driving law d Jan Jan 2013, A.M Bachani et al.trends in prevalence, knowledge, attitudes, and practices of helmet use in Cambodia: results from a two year study. TRENDS IN REPORTED ROAD TRAFFIC DEATHS Deaths per population Source: Road Crash & Victim Information System (RCVIS) Legislative review conducted by WHO. Vehicle safety data from UNECE WP29. Other data collected by questionnaire and cleared by Ministry of Health. 2
36 CHINA Population: Income group: Middle Gross national income per capita: US$ INSTITUTIONAL FRAMEWORK Lead agency Inter-ministerial Convention on Road Traffic Safety Funded in national budget National road safety strategy Funding to implement strategy Partially funded Fatality reduction target 2.2 per vehicles ( ) SAFER ROADS AND MOBILITY Formal audits required for new road construction projects Regular inspections of existing road infrastructure Policies to promote walking or cycling Policies to encourage investment in public transport Policies to separate road users and protect VRUs SAFER VEHICLES Total registered vehicles for Cars and 4-wheeled light vehicles Motorized 2- and 3-wheelers Heavy trucks Buses - Other Vehicle standards applied a Frontal impact standard Electronic stability control Pedestrian protection a UNECE WP29. POST-CRASH CARE Emergency room injury surveillance system Emergency access telephone numbers 120 Permanently disabled due to road traffic crash DATA Reported road traffic fatalities (2013) b (72% M, 28% F) WHO estimated road traffic fatalities WHO estimated rate per population 18.8 Estimated GDP lost due to road traffic crashes b Ministry of Public Security, Annual statistics report on road traffic accident. Defined as died within 7 days of crash. DEATHS BY ROAD USER CATEGORY Other (16%) Drivers/passengers heavy trucks (4%) Pedestrians (26%) Cyclists (8%) Source: 2013, Ministry of Public Security Annual statistics report on road traffic accident. Drivers 4-wheeled cars and light vehicles (6%) Passengers 4-wheeled cars and light vehicles (13%) Riders motorized 2- or 3-wheelers (27%) SAFER ROAD USERS National speed limit law Max urban speed limit c Max rural speed limit c Max motorway speed limit 120 km/h Local authorities can modify limits Enforcement National drink driving law BAC limit general population < 0.02 g/dl BAC limit young or novice drivers < 0.02 g/dl Random breath testing carried out Enforcement % road traffic deaths involving alcohol 4% d National motorcycle helmet law Applies to drivers and passengers Law requires helmet to be fastened Law refers to helmet standard Enforcement Helmet wearing rate 20% All riders e National seat-belt law Applies to front and rear seat occupants Enforcement Seat-belt wearing rate 37% Drivers e National child restraint law Restrictions on children sitting in front seat Child restraint law based on % children using child restraints <1% f National law on mobile phone use while driving Law prohibits hand-held mobile phone use Law also applies to hands-free phones National drug-driving law c Speeds may not exceed the sign-posted speed limit. d 2013, Ministry of Public Security, Annual statistics report on road traffic accident. e DENG Xiao, LI Yi-chong, WANG Li-min et al. Study on behavioral risk factors of road traffic injury in Chinese adults, Chinese Journal of Disease Control & Prevention, f Annual report on development of auto society in China ( ). * These data take into consideration subnational laws. For more information please see Explanatory te 1. TRENDS IN REPORTED ROAD TRAFFIC DEATHS Deaths per population Source: Ministry of Public Security, Annual statistics report on road traffic accident, Legislative review conducted by WHO. Vehicle safety data from UNECE WP29. Other data collected by questionnaire and cleared by National Health and Family Planning Commission. 3
37 COOK ISLANDS Population: Income group: Middle Gross national income per capita: US$ INSTITUTIONAL FRAMEWORK Lead agency Police Department, Ministry of Police Funded in national budget National road safety strategy Funding to implement strategy Partially funded Fatality reduction target 4 fatal crashes per month by 2015 SAFER ROADS AND MOBILITY Formal audits required for new road construction projects Regular inspections of existing road infrastructure Policies to promote walking or cycling Policies to encourage investment in public transport Policies to separate road users and protect VRUs SAFER VEHICLES Total registered vehicles for Cars and 4-wheeled light vehicles Motorized 2- and 3-wheelers Heavy trucks 491 Buses 31 Other 0 Vehicle standards applied a Frontal impact standard Electronic stability control Pedestrian protection a UNECE WP29. POST-CRASH CARE Emergency room injury surveillance system Emergency access telephone numbers 999 Permanently disabled due to road traffic crash DATA Reported road traffic fatalities (2013) 5 b (100% M) WHO estimated road traffic fatalities 5 WHO estimated rate per population 24.2 Estimated GDP lost due to road traffic crashes b Police Intelligence Report. Defined as unlimited time period following crash. DEATHS BY ROAD USER CATEGORY Riders motorized 2- or 3-wheelers (60%) Source: 2013, Police Intelligence Report. Drivers 4-wheeled cars and light vehicles (40%) SAFER ROAD USERS National speed limit law Max urban speed limit 50 km/h c Max rural speed limit 50 km/h c Max motorway speed limit 50 km/h c Local authorities can modify limits Enforcement National drink driving law BAC limit general population 0.08 g/dl BAC limit young or novice drivers 0.08 g/dl Random breath testing carried out Enforcement % road traffic deaths involving alcohol 25% d National motorcycle helmet law Applies to drivers and passengers e Law requires helmet to be fastened Law refers to helmet standard Enforcement Helmet wearing rate National seat-belt law Applies to front and rear seat occupants Seat-belt wearing rate National child restraint law Restrictions on children sitting in front seat Child restraint law based on % children using child restraints National law on mobile phone use while driving Law prohibits hand-held mobile phone use Law also applies to hands-free phones National drug-driving law c Road type not specified. d 2012, Ministry of Health. e Only applies to those travelling > 40 km/h. TRENDS IN REPORTED ROAD TRAFFIC DEATHS Number of road traffic deaths Source: Ministry of Health/Police Department Legislative review conducted by WHO. Vehicle safety data from UNECE WP29. Other data collected by questionnaire and cleared by Ministry of Health. 4
38 FIJI Population: Income group: Middle Gross national income per capita: US$ INSTITUTIONAL FRAMEWORK Lead agency Land Transport Authority, Ministry of Transport Funded in national budget National road safety strategy Funding to implement strategy Partially funded Fatality reduction target 30% ( ) SAFER ROADS AND MOBILITY Formal audits required for new road construction projects Regular inspections of existing road infrastructure Policies to promote walking or cycling Policies to encourage investment in public transport Policies to separate road users and protect VRUs SAFER VEHICLES Subnational Total registered vehicles for Cars and 4-wheeled light vehicles Motorized 2- and 3-wheelers Heavy trucks Buses Other Vehicle standards applied a Frontal impact standard Electronic stability control Pedestrian protection a UNECE WP29. POST-CRASH CARE Emergency room injury surveillance system Emergency access telephone numbers Multiple numbers Permanently disabled due to road traffic crash DATA Reported road traffic fatalities (2013) 41 b (76% M, 24% F) WHO estimated road traffic fatalities 51 WHO estimated rate per population 5.8 Estimated GDP lost due to road traffic crashes b Fiji Police Accident Traffic Research Unit (PATRU). Defined as died within 30 days of crash. DEATHS BY ROAD USER CATEGORY Pedestrians (59%) Source: 2013, Fiji Police Accident Traffic Research Unit (PATRU). Drivers 4-wheeled cars and light vehicles (17%) Passengers 4-wheeled cars and light vehicles (22%) Cyclists (2%) SAFER ROAD USERS National speed limit law Max urban speed limit Max rural speed limit Max motorway speed limit Local authorities can modify limits National drink driving law BAC limit general population 0.08 g/dl BAC limit young or novice drivers 0.00 g/dl Random breath testing carried out Enforcement % road traffic deaths involving alcohol 15% c National motorcycle helmet law Applies to drivers and passengers Law requires helmet to be fastened Law refers to helmet standard Helmet wearing rate National seat-belt law Applies to front and rear seat occupants Seat-belt wearing rate National child restraint law Restrictions on children sitting in front seat Child restraint law based on % children using child restraints National law on mobile phone use while driving Law prohibits hand-held mobile phone use Law also applies to hands-free phones National drug-driving law c 2013, Fiji Police Accident Traffic Research Unit (PATRU). TRENDS IN REPORTED ROAD TRAFFIC DEATHS Deaths per population Source: Fiji Police Accident Traffic Research Unit (PATRU) Legislative review conducted by WHO. Vehicle safety data from UNECE WP29. Other data collected by questionnaire and cleared by the Land Transport Authority. 5
39 JAPAN Population: Income group: High Gross national income per capita: US$ INSTITUTIONAL FRAMEWORK Lead agency Central Traffic Safety Policy Council Funded in national budget National road safety strategy Funding to implement strategy Fully funded Fatality reduction target < 3000 deaths per year by 2015 SAFER ROADS AND MOBILITY Formal audits required for new road construction projects Regular inspections of existing road infrastructure Policies to promote walking or cycling Policies to encourage investment in public transport Policies to separate road users and protect VRUs SAFER VEHICLES Total registered vehicles for 2013 a Cars and 4-wheeled light vehicles Motorized 2- and 3-wheelers Heavy trucks Buses Other Vehicle standards applied b Frontal impact standard Electronic stability control Pedestrian protection a As of April 2013 b UNECE WP29. POST-CRASH CARE Emergency room injury surveillance system Emergency access telephone numbers 119 Permanently disabled due to road traffic crash DATA Reported road traffic fatalities (2013) c (66% M, 34% F) WHO estimated road traffic fatalities WHO estimated rate per population 4.7 Estimated GDP lost due to road traffic crashes 1.3% d c National Police Agency. Defined as died within 24 hours of crash. d March 2012, Investigative Study for Economic Losses Caused by Road Traffic Accidents. DEATHS BY ROAD USER CATEGORY Pedestrians (36%) Other (<1%) Cyclists (14%) Source: 2013, National Police Agency. Drivers 4-wheeled cars and light vehicles (25%) Passengers 4-wheeled cars and light vehicles (8%) Riders motorized 2- or 3-wheelers (17%) SAFER ROAD USERS National speed limit law Max urban speed limit 60 km/h Max rural speed limit 60 km/h Max motorway speed limit 100 km/h Local authorities can modify limits Enforcement National drink driving law BAC limit general population < 0.03 g/dl BAC limit young or novice drivers < 0.03 g/dl Random breath testing carried out Enforcement % road traffic deaths involving alcohol 6% e National motorcycle helmet law Applies to drivers and passengers Law requires helmet to be fastened Law refers to helmet standard Enforcement Helmet wearing rate National seat-belt law Applies to front and rear seat occupants Enforcement Seat-belt wearing rate 98% Front seats f, 68% Rear seats f National child restraint law Restrictions on children sitting in front seat Child restraint law based on Age Enforcement % children using child restraints 81% < 1 year, 62% 1-4 years, 38% 5 years, 60% Total g National law on mobile phone use while driving Law prohibits hand-held mobile phone use Law also applies to hands-free phones National drug-driving law e 2013, National Police Agency f On expressways.% lower on other roads. 2013, Joint study by Japan Automobile Federation (JAF) and National Police Agency. g 2013, Joint study by Japan Automobile Federation (JAF) and National Police Agency. TRENDS IN REPORTED ROAD TRAFFIC DEATHS Deaths per population Source: National Police Agency Legislative review conducted by WHO. Vehicle safety data from UNECE WP29. Other data collected by questionnaire and cleared by Ministry of Health, Labour and Welfare. 6
40 KIRIBATI Population: Income group: Middle Gross national income per capita: US$ INSTITUTIONAL FRAMEWORK Lead agency Kiribati Road Safety Task Force Funded in national budget National road safety strategy Funding to implement strategy Partially funded Fatality reduction target 10% ( ) SAFER ROADS AND MOBILITY Formal audits required for new road construction projects Regular inspections of existing road infrastructure Policies to promote walking or cycling Policies to encourage investment in public transport Policies to separate road users and protect VRUs SAFER VEHICLES Total registered vehicles for Cars and 4-wheeled light vehicles Motorized 2- and 3-wheelers 701 Heavy trucks 536 Buses 289 Other 0 Vehicle standards applied a Frontal impact standard Electronic stability control Pedestrian protection a UNECE WP29. POST-CRASH CARE Emergency room injury surveillance system Emergency access telephone numbers 194 Permanently disabled due to road traffic crash DATA Reported road traffic fatalities (2013) 3 b (67% M, 33% F) WHO estimated road traffic fatalities 3 WHO estimated rate per population 2.9 Estimated GDP lost due to road traffic crashes b Combined sources (police and health). Defined as died at scene of crash. DEATHS BY ROAD USER CATEGORY Pedestrians (67%) Source: 2013, Police and health records. Cyclists (33%) SAFER ROAD USERS National speed limit law Max urban speed limit 40 km/h Max rural speed limit 60 km/h Max motorway speed limit 60 km/h Local authorities can modify limits Enforcement National drink driving law BAC limit general population 0.08 g/dl BAC limit young or novice drivers 0.08 g/dl Random breath testing carried out Enforcement % road traffic deaths involving alcohol National motorcycle helmet law Applies to drivers and passengers Law requires helmet to be fastened Law refers to helmet standard Helmet wearing rate National seat-belt law Applies to front and rear seat occupants Enforcement Seat-belt wearing rate National child restraint law Restrictions on children sitting in front seat Child restraint law based on Age Enforcement % children using child restraints National law on mobile phone use while driving Law prohibits hand-held mobile phone use Law also applies to hands-free phones National drug-driving law TRENDS IN REPORTED ROAD TRAFFIC DEATHS Number of road traffic deaths Source: Police and health records Legislative review conducted by WHO. Vehicle safety data from UNECE WP29. Other data collected by questionnaire and cleared by Ministry of Health and Medical Services. 7
41 LAO PEOPLE'S DEMOCRATIC REPUBLIC Population: Income group: Middle Gross national income per capita: US$ INSTITUTIONAL FRAMEWORK Lead agency National Road Safety Committee Funded in national budget National road safety strategy Funding to implement strategy Partially funded Fatality reduction target 50% ( ) SAFER ROADS AND MOBILITY Formal audits required for new road construction projects Regular inspections of existing road infrastructure Policies to promote walking or cycling Policies to encourage investment in public transport Policies to separate road users and protect VRUs SAFER VEHICLES Subnational Subnational Total registered vehicles for Cars and 4-wheeled light vehicles Motorized 2- and 3-wheelers Heavy trucks Buses Other 0 Vehicle standards applied a Frontal impact standard Electronic stability control Pedestrian protection a UNECE WP29. POST-CRASH CARE Emergency room injury surveillance system Emergency access telephone numbers 1195 Permanently disabled due to road traffic crash DATA Reported road traffic fatalities (2013) 910 b (82% M, 18% F) WHO estimated road traffic fatalities 971 (95% CI ) WHO estimated rate per population 14.3 Estimated GDP lost due to road traffic crashes 2.7% c b Traffic Police. Defined as died within 3 months of crash. c 2005, Asian Development Bank. DEATHS BY ROAD USER CATEGORY Source: 2013, Traffic Police. Pedestrians (10%) Cyclists (3%) Other (2%) Riders motorized 2- or 3-wheelers (67%) Drivers 4-wheeled cars and light vehicles (12%) Passengers 4-wheeled cars and light vehicles (6%) SAFER ROAD USERS National speed limit law Max urban speed limit 40 km/h Max rural speed limit 90 km/h Max motorway speed limit d Local authorities can modify limits Enforcement National drink driving law BAC limit general population 0.05 g/dl BAC limit young or novice drivers 0.05 g/dl Random breath testing carried out Enforcement % road traffic deaths involving alcohol National motorcycle helmet law Applies to drivers and passengers Law requires helmet to be fastened Law refers to helmet standard Enforcement Helmet wearing rate National seat-belt law Applies to front and rear seat occupants Enforcement Seat-belt wearing rate National child restraint law Restrictions on children sitting in front seat Child restraint law based on Enforcement % children using child restraints National law on mobile phone use while driving Law prohibits hand-held mobile phone use Law also applies to hands-free phones National drug-driving law d motorways in the country. TRENDS IN REPORTED ROAD TRAFFIC DEATHS Deaths per population Source: National Road Safety Committee Secretariat Legislative review conducted by WHO. Vehicle safety data from UNECE WP29. Other data collected by questionnaire and cleared by Ministry of Public Works and Transport. 8
42 MALAYSIA Population: Income group: Middle Gross national income per capita: US$ INSTITUTIONAL FRAMEWORK Lead agency Road Safety Department, Ministry of Transport Funded in national budget National road safety strategy Funding to implement strategy Fully funded Fatality reduction target 50% (2020) SAFER ROADS AND MOBILITY Formal audits required for new road construction projects Regular inspections of existing road infrastructure Policies to promote walking or cycling Policies to encourage investment in public transport Policies to separate road users and protect VRUs SAFER VEHICLES Subnational Total registered vehicles for Cars and 4-wheeled light vehicles Motorized 2- and 3-wheelers Heavy trucks Buses Other Vehicle standards applied a Frontal impact standard Electronic stability control Pedestrian protection a UNECE WP29. POST-CRASH CARE Emergency room injury surveillance system Emergency access telephone numbers 999 Permanently disabled due to road traffic crash DATA Reported road traffic fatalities (2013) b (85% M, 15% F) WHO estimated road traffic fatalities (95% CI ) WHO estimated rate per population 24 Estimated GDP lost due to road traffic crashes 1.5% c b Royal Malaysian Police. Defined as died within 30 days of crash. c 2013, Malaysian Institute on Road Safety Research (MIROS). DEATHS BY ROAD USER CATEGORY Other (1%) Drivers/passengers buses (1%) Drivers/passengers heavy trucks (3%) Pedestrians (7%) Cyclists (2%) Riders motorized 2- or 3-wheelers (62%) Source: 2013, Royal Malaysian Police. Occupants 4-wheeled cars and light vehicles (24%) SAFER ROAD USERS National speed limit law Max urban speed limit 90 km/h Max rural speed limit 90 km/h Max motorway speed limit 110 km/h Local authorities can modify limits Enforcement National drink driving law BAC limit general population 0.08 g/dl BAC limit young or novice drivers 0.08 g/dl Random breath testing carried out Enforcement % road traffic deaths involving alcohol 23% d National motorcycle helmet law Applies to drivers and passengers Law requires helmet to be fastened Law refers to helmet standard Enforcement Helmet wearing rate 97% Drivers c, 89% Passengers c National seat-belt law Applies to front and rear seat occupants Enforcement Seat-belt wearing rate 77% Front seats c, 13% Rear seats c National child restraint law Restrictions on children sitting in front seat Child restraint law based on % children using child restraints National law on mobile phone use while driving Law prohibits hand-held mobile phone use Law also applies to hands-free phones National drug-driving law d 2010, Malaysian Institute on Road Safety Research (MIROS). TRENDS IN REPORTED ROAD TRAFFIC DEATHS Deaths per population Source: Malaysian Institute on Road Safety Research (MIROS) Legislative review conducted by WHO. Vehicle safety data from UNECE WP29. Other data collected by questionnaire and cleared by Ministry of Health. 9
43 MARSHALL ISLANDS Population: Income group: Middle Gross national income per capita: US$ INSTITUTIONAL FRAMEWORK Lead agency Funded in national budget National road safety strategy Funding to implement strategy Fatality reduction target SAFER ROADS AND MOBILITY Formal audits required for new road construction projects Regular inspections of existing road infrastructure Policies to promote walking or cycling Policies to encourage investment in public transport Policies to separate road users and protect VRUs SAFER VEHICLES Marshall Island Police Partially funded (not specified) Total registered vehicles for Cars and 4-wheeled light vehicles Motorized 2- and 3-wheelers 52 Heavy trucks 26 Buses 63 Other 58 Vehicle standards applied a Frontal impact standard Electronic stability control Pedestrian protection a UNECE WP29. POST-CRASH CARE Emergency room injury surveillance system Emergency access telephone numbers Multiple numbers Permanently disabled due to road traffic crash DATA Reported road traffic fatalities (2013) 3 b (100% M) WHO estimated road traffic fatalities 3 WHO estimated rate per population 5.7 Estimated GDP lost due to road traffic crashes b Vital Records Information System, Ministry of Health. Defined as - Police reported within 24 hours but the official death will be based on the assessment of the attending physician. DEATHS BY ROAD USER CATEGORY Riders motorized 2- or 3-wheelers (67%) Source: 2013, Ministry of Health Vital Statistics. Passengers 4-wheeled cars and light vehicles (33%) SAFER ROAD USERS National speed limit law Max urban speed limit ~40 km/h Max rural speed limit ~64 km/h Max motorway speed limit ~64 km/h Local authorities can modify limits Enforcement National drink driving law BAC limit general population BAC limit young or novice drivers Random breath testing carried out % road traffic deaths involving alcohol 100% c National motorcycle helmet law Applies to drivers and passengers Law requires helmet to be fastened Law refers to helmet standard Enforcement Helmet wearing rate 98% Drivers d 98% Passengers d National seat-belt law Applies to front and rear seat occupants Seat-belt wearing rate National child restraint law Restrictions on children sitting in front seat Child restraint law based on % children using child restraints National law on mobile phone use while driving Law prohibits hand-held mobile phone use Law also applies to hands-free phones National drug-driving law c 2013, Marshall Islands Police Force and Ministry of Health. d 2013, Marshall Islands Police Force and Ministry of Justice. TRENDS IN REPORTED ROAD TRAFFIC DEATHS Number of road traffic fatalities Source: Ministry of Health Vital Statistics Legislative review conducted by WHO. Vehicle safety data from UNECE WP29. Other data collected by questionnaire and cleared by the Marshall Islands Police Force.
44 MICRONESIA (FEDERATED STATES OF) Population: Income group: Middle Gross national income per capita: US$ INSTITUTIONAL FRAMEWORK Lead agency Funded in national budget National road safety strategy Funding to implement strategy Fatality reduction target SAFER ROADS AND MOBILITY Formal audits required for new road construction projects Regular inspections of existing road infrastructure Policies to promote walking or cycling Policies to encourage investment in public transport Policies to separate road users and protect VRUs SAFER VEHICLES Total registered vehicles for Cars and 4-wheeled light vehicles Motorized 2- and 3-wheelers 96 Heavy trucks 747 Buses 138 Other 0 Vehicle standards applied a Frontal impact standard Electronic stability control Pedestrian protection a UNECE WP29. POST-CRASH CARE Emergency room injury surveillance system Emergency access telephone numbers Subnational Permanently disabled due to road traffic crash DATA Reported road traffic fatalities (2013) 2 b (100% M) WHO estimated road traffic fatalities 2 WHO estimated rate per population 1.9 Estimated GDP lost due to road traffic crashes b Department of Health and Social Affairs, Pohpei and Yap States only. Defined as died within 24 hours of crash. DEATHS BY ROAD USER CATEGORY d at a n o t ava i l a b l e SAFER ROAD USERS National speed limit law Subnational c Max urban speed limit Max rural speed limit Max motorway speed limit Local authorities can modify limits National drink driving law Subnational c BAC limit general population BAC limit young or novice drivers Random breath testing carried out % road traffic deaths involving alcohol National motorcycle helmet law Subnational c Applies to drivers and passengers Law requires helmet to be fastened Law refers to helmet standard Helmet wearing rate National seat-belt law Subnational c Applies to front and rear seat occupants Seat-belt wearing rate National child restraint law Restrictions on children sitting in front seat Child restraint law based on % children using child restraints National law on mobile phone use while driving Subnational c Law prohibits hand-held mobile phone use Law also applies to hands-free phones National drug-driving law c All legislation is subnational. TRENDS IN REPORTED ROAD TRAFFIC DEATHS Number of road traffic deaths Source: Department of Health and Social Affairs, deaths in Pohpei and Yap States only Legislative review conducted by WHO. Vehicle safety data from UNECE WP29. Other data collected by questionnaire and cleared by Department of Health and Social Affairs. 11
45 MONGOLIA Population: Income group: Middle Gross national income per capita: US$ INSTITUTIONAL FRAMEWORK Lead agency Ministry of Road and Transportation, Department of Road Transportation Funded in national budget National road safety strategy Funding to implement strategy t funded Fatality reduction target 50% ( ) SAFER ROADS AND MOBILITY Formal audits required for new road construction projects Regular inspections of existing road infrastructure Policies to promote walking or cycling Policies to encourage investment in public transport Policies to separate road users and protect VRUs SAFER VEHICLES Subnational Total registered vehicles for Cars and 4-wheeled light vehicles Motorized 2- and 3-wheelers Heavy trucks Buses Other 0 Vehicle standards applied a Frontal impact standard Electronic stability control Pedestrian protection a UNECE WP29. POST-CRASH CARE Emergency room injury surveillance system Emergency access telephone numbers 103 Permanently disabled due to road traffic crash DATA Reported road traffic fatalities (2013) 579 b, (79% M, 21% F) WHO estimated road traffic fatalities 597 (95% CI ) WHO estimated rate per population 21 Estimated GDP lost due to road traffic crashes b Health Indicators 2013, Center for Health Development. Defined as died within 30 days of crash.. DEATHS BY ROAD USER CATEGORY Drivers/passengers buses (1%) Drivers/passengers heavy trucks (2%) Pedestrians (31%) Cyclists (<1%) Riders motorized 2- or 3-wheelers (19%) Source: Health Indicators 2013, Center for Health Development. Drivers 4-wheeled cars and light vehicles (24%) Passengers 4-wheeled cars and light vehicles (23%) SAFER ROAD USERS National speed limit law Max urban speed limit 60 km/h Max rural speed limit 80 km/h Max motorway speed limit 100 km/h Local authorities can modify limits Enforcement National drink driving law BAC limit general population < 0.04 g/dl c BAC limit young or novice drivers < 0.04 g/dl c Random breath testing carried out Enforcement % road traffic deaths involving alcohol 20% d National motorcycle helmet law Applies to drivers and passengers Law requires helmet to be fastened Law refers to helmet standard Enforcement Helmet wearing rate 7% Drivers e National seat-belt law Applies to front and rear seat occupants Enforcement Seat-belt wearing rate 42% Drivers f National child restraint law Restrictions on children sitting in front seat Child restraint law based on % children using child restraints National law on mobile phone use while driving Law prohibits hand-held mobile phone use Law also applies to hands-free phones National drug-driving law c Law based on breath alcohol concentration, values converted to BAC. d 2013, Traffic fault and injury statistics 3rd edition. e 2014, The injury and death situation of motorbikes in countryside of Mongolia. f 2010, Research result of driver behavior when driving. TRENDS IN REPORTED ROAD TRAFFIC DEATHS Deaths per population Source: Health Indicators 2013, Center for Health Development Legislative review conducted by WHO. Vehicle safety data from UNECE WP29. Other data collected by questionnaire and cleared by Ministry of Health.
46 NEW ZEALAND Population: Income group: High Gross national income per capita: US$ INSTITUTIONAL FRAMEWORK Lead agency Funded in national budget National road safety strategy Funding to implement strategy Fatality reduction target Land Transport Safety Team, Ministry of Transport Fully funded Multiple a a Targets vary for specific groups. See New Zealand Road Safety Strategy , p.13. SAFER ROADS AND MOBILITY Formal audits required for new road construction projects Regular inspections of existing road infrastructure Policies to promote walking or cycling Policies to encourage investment in public transport Policies to separate road users and protect VRUs SAFER VEHICLES Total registered vehicles for Cars and 4-wheeled light vehicles Motorized 2- and 3-wheelers Heavy trucks Buses Other Vehicle standards applied b Frontal impact standard Electronic stability control Pedestrian protection b UNECE WP29. POST-CRASH CARE Emergency room injury surveillance system Emergency access telephone numbers 111 Permanently disabled due to road traffic crash DATA Reported road traffic fatalities (2013) 253 c (70% M, 30% F) WHO estimated road traffic fatalities 272 WHO estimated rate per population 6 Estimated GDP lost due to road traffic crashes 1.6% d c Police reported data. Defined as died within 30 days of crash. d Calculated from The Social Cost of Road Crashes and Injuries 2013 update. DEATHS BY ROAD USER CATEGORY Other (< 1%) Drivers/passengers buses (< 1%) Drivers/passengers heavy trucks (3%) Pedestrians (12%) Cyclists (3%) Riders motorized 2- or 3-wheelers (15%) Passengers 4-wheeled cars and light vehicles (18%) Source: 2013, Police reported data. Drivers 4-wheeled cars and light vehicles (48%) SAFER ROAD USERS National speed limit law Max urban speed limit 50 km/h Max rural speed limit 100 km/h Max motorway speed limit 100 km/h Local authorities can modify limits Enforcement National drink driving law BAC limit general population 0.05 g/dl BAC limit young or novice drivers 0.00 g/dl Random breath testing carried out Enforcement % road traffic deaths involving alcohol 31% e National motorcycle helmet law Applies to drivers and passengers Law requires helmet to be fastened Law refers to helmet standard Enforcement Helmet wearing rate National seat-belt law Applies to front and rear seat occupants Enforcement Seat-belt wearing rate 96% Front seats f, 90% Rear seats f National child restraint law Restrictions on children sitting in front seat Child restraint law based on Age Enforcement % children using child restraints 92% 0 4 years g, 96% 5 9 years h National law on mobile phone use while driving Law prohibits hand-held mobile phone use Law also applies to hands-free phones National drug-driving law e 2013, police reported data. f 2012, Annual National Survey of Seatbelts in New Zealand. g Ministry of Transport, Child restraint use by children under 5 years, h Ministry of Transport, Child restraint use by children aged 5-9 years; Results of a national survey TRENDS IN REPORTED ROAD TRAFFIC DEATHS Deaths per population Source: Combined Police and Statistics New Zealand data Legislative review conducted by WHO. Vehicle safety data from UNECE WP29. Other data collected by questionnaire and cleared by the Ministry of Transport. 13
47 PALAU Population: Income group: Middle Gross national income per capita: US$ INSTITUTIONAL FRAMEWORK Lead agency Bureau of Public Safety Funded in national budget National road safety strategy Funding to implement strategy Fatality reduction target SAFER ROADS AND MOBILITY Formal audits required for new road construction projects Regular inspections of existing road infrastructure Policies to promote walking or cycling Policies to encourage investment in public transport Policies to separate road users and protect VRUs SAFER VEHICLES Total registered vehicles for Cars and 4-wheeled light vehicles Motorized 2- and 3-wheelers Heavy trucks Buses Other Vehicle standards applied a Frontal impact standard Electronic stability control Pedestrian protection a UNECE WP29. POST-CRASH CARE Emergency room injury surveillance system Emergency access telephone numbers 911 Permanently disabled due to road traffic crash DATA Reported road traffic fatalities (2013) 1 b (100% M, 0% F) WHO estimated road traffic fatalities 1 WHO estimated rate per population 4.78 Estimated GDP lost due to road traffic crashes b Bureau of Public Safety. Defined as unlimited time period following crash. SAFER ROAD USERS National speed limit law Max urban speed limit Max rural speed limit Max motorway speed limit c Local authorities can modify limits Enforcement National drink driving law BAC limit general population 0.10 g/dl BAC limit young or novice drivers 0.10 g/dl Random breath testing carried out Enforcement % road traffic deaths involving alcohol 100% d National motorcycle helmet law Applies to drivers and passengers Law requires helmet to be fastened Law refers to helmet standard Enforcement Helmet wearing rate National seat-belt law Applies to front and rear seat occupants Seat-belt wearing rate National child restraint law Restrictions on children sitting in front seat Child restraint law based on % children using child restraints National law on mobile phone use while driving Law prohibits hand-held mobile phone use Law also applies to hands-free phones National drug-driving law c motorways in Palau. d 2013, Bureau of Public Safety. DEATHS BY ROAD USER CATEGORY Year Category Deaths 2013 Pedestrian 1 Source: 2013, Bureau of Public Safety. TRENDS IN REPORTED ROAD TRAFFIC DEATHS 4 Number of road traffic deaths Source: Bureau of Public Safety and Ministry of Health Legislative review conducted by WHO. Vehicle safety data from UNECE WP29. Other data collected by questionnaire. 14
48 PAPUA NEW GUINEA Population: Income group: Middle Gross national income per capita: US$ INSTITUTIONAL FRAMEWORK Lead agency National Road Safety Council a Funded in national budget National road safety strategy Funding to implement strategy Fatality reduction target a National Road Safety Council and National Department of Transport and Road Safety merged in February 2015 to form the National Road Transport Authority. SAFER ROADS AND MOBILITY Formal audits required for new road construction projects Regular inspections of existing road infrastructure Policies to promote walking or cycling Policies to encourage investment in public transport Policies to separate road users and protect VRUs SAFER VEHICLES Total registered vehicles for Cars and 4-wheeled light vehicles Motorized 2- and 3-wheelers Heavy trucks Buses Other 0 Vehicle standards applied b Frontal impact standard Electronic stability control Pedestrian protection b UNECE WP29. POST-CRASH CARE Emergency room injury surveillance system Emergency access telephone numbers Multiple numbers Permanently disabled due to road traffic crash DATA Reported road traffic fatalities (2013) 248 c WHO estimated road traffic fatalities 1232 (95% CI ) WHO estimated rate per population 16.8 Estimated GDP lost due to road traffic crashes c Royal Papua New Guinea Constabulary, Traffic Police records. Defined as died within 30 days of crash. DEATHS BY ROAD USER CATEGORY Drivers/passengers buses (9%) Drivers/passengers heavy trucks (14%) Pedestrians (29%) Source: 2013, Royal Papua New Guinea Constabulary, Traffic Police records. Drivers 4-wheeled cars and light vehicles (11%) Passengers 4-wheeled cars and light vehicles (37%) SAFER ROAD USERS National speed limit law Max urban speed limit 60 km/h d Max rural speed limit 75 km/h Max motorway speed limit Local authorities can modify limits Enforcement National drink driving law e BAC limit general population BAC limit young or novice drivers Random breath testing carried out Enforcement % road traffic deaths involving alcohol 56% f National motorcycle helmet law Applies to drivers and passengers Law requires helmet to be fastened Law refers to helmet standard Enforcement Helmet wearing rate National seat-belt law Applies to front and rear seat occupants Enforcement Seat-belt wearing rate National child restraint law Restrictions on children sitting in front seat Child restraint law based on % children using child restraints National law on mobile phone use while driving Law prohibits hand-held mobile phone use Law also applies to hands-free phones National drug-driving law d Higher speed limit may be posted. e t based on BAC. f 2013, Papua New Guinea Traffic Police records. TRENDS IN REPORTED ROAD TRAFFIC DEATHS Deaths per population Source: National Road Safety Council Legislative review conducted by WHO. Vehicle safety data from UNECE WP29. Other data collected by questionnaire and cleared by the Department of Transport. 15
49 PHILIPPINES Population: Income group: Middle Gross national income per capita: US$ INSTITUTIONAL FRAMEWORK Lead agency Road Safety Management Group, Department of Transportation and Communications Funded in national budget National road safety strategy Funding to implement strategy Fully funded Fatality reduction target 50% ( ) SAFER ROADS AND MOBILITY Formal audits required for new road construction projects Regular inspections of existing road infrastructure Policies to promote walking or cycling Policies to encourage investment in public transport Policies to separate road users and protect VRUs SAFER VEHICLES Total registered vehicles for Cars and 4-wheeled light vehicles Motorized 2- and 3-wheelers Heavy trucks Buses Other Vehicle standards applied a Frontal impact standard Electronic stability control Pedestrian protection a UNECE WP29. POST-CRASH CARE Emergency room injury surveillance system Emergency access telephone numbers 117 (call) or 2920 (SMS) Permanently disabled due to road traffic crash DATA Reported road traffic fatalities (2013) b, (77% M, 22% F) WHO estimated road traffic fatalities WHO estimated rate per population 10.5 Estimated GDP lost due to road traffic crashes 2.6% c b 2013, Department of Public Works and Highway (DPWH) -Traffic Accident Recording and Analysis System (TARAS). Defined as death caused by road traffic crash (unlimited time period). c 2009, Sigua, UP COE/NCTS (ADB Publication). DEATHS BY ROAD USER CATEGORY Pedestrians (19%) Cyclists (2%) Other (1%) Riders motorized 2- or 3-wheelers (53%) Source: 2013, DPWH Traffic Accident Recording and Analysis System (TARAS). Drivers 4-wheeled cars and light vehicles (14%) Passengers 4-wheeled cars and light vehicles (11%) SAFER ROAD USERS National speed limit law Max urban speed limit 40 km/h Max rural speed limit 80 km/h Max motorway speed limit Local authorities can modify limits Enforcement National drink driving law BAC limit general population < 0.05 g/dl BAC limit young or novice drivers < 0.05 g/dl Random breath testing carried out Enforcement % road traffic deaths involving alcohol 1% d National motorcycle helmet law Applies to drivers and passengers Law requires helmet to be fastened Law refers to helmet standard Enforcement Helmet wearing rate 51% All riders e, 87% Drivers e National seat-belt law Applies to front and rear seat occupants Enforcement Seat-belt wearing rate 80% Drivers e National child restraint law Restrictions on children sitting in front seat Child restraint law based on % children using child restraints National law on mobile phone use while driving Law prohibits hand-held mobile phone use Law also applies to hands-free phones National drug-driving law d 2006, Philippine National Police (PNP), Traffic Management Group (TMG). e 2010, Prevelance of road traffic injury risk factors in the province of Guimaras. TRENDS IN REPORTED ROAD TRAFFIC DEATHS Number of road traffic deaths Source: DPWH-Traffic Accident Recording and Analysis System (TARAS) Legislative review conducted by WHO. Vehicle safety data from UNECE WP29. Other data collected by questionnaire and cleared by Department of Health.
50 REPUBLIC OF KOREA Population: Income group: High Gross national income per capita: US$ INSTITUTIONAL FRAMEWORK Lead agency Ministry of Land, Infrastructure and Transport Funded in national budget National road safety strategy Funding to implement strategy Partially funded Fatality reduction target < deaths per year by 2017 SAFER ROADS AND MOBILITY Formal audits required for new road construction projects Regular inspections of existing road infrastructure Policies to promote walking or cycling Policies to encourage investment in public transport Policies to separate road users and protect VRUs SAFER VEHICLES Total registered vehicles for Cars and 4-wheeled light vehicles Motorized 2- and 3-wheelers Heavy trucks Buses Other 0 Vehicle standards applied a Frontal impact standard Electronic stability control Pedestrian protection a UNECE WP29. POST-CRASH CARE Emergency room injury surveillance system Emergency access telephone numbers 119 Permanently disabled due to road traffic crash 0.4% b b 2012, Korea Insurance Development Institute. DATA Reported road traffic fatalities (2013) c, (72% M, 28% F) WHO estimated road traffic fatalities WHO estimated rate per population 12 Estimated GDP lost due to road traffic crashes 1% d c Korean National Police Agency. Defined as died within 30 days of crash. d 2013, Evaluation and estimation of the road accident cost, KoRoad. DEATHS BY ROAD USER CATEGORY Other (2%) Drivers/passengers buses (2%) Drivers/passengers heavy trucks (3%) Pedestrians (39%) Cyclists (5%) Source: 2013, Korean National Police Agency. Drivers 4-wheeled cars and light vehicles (23%) Passengers 4-wheeled cars and light vehicles (10%) Riders motorized 2- or 3-wheelers (16%) SAFER ROAD USERS National speed limit law Max urban speed limit 80 km/h e Max rural speed limit 80 km/h Max motorway speed limit 120 km/h Local authorities can modify limits Enforcement National drink driving law BAC limit general population < 0.05 g/dl BAC limit young or novice drivers < 0.05 g/dl Random breath testing carried out Enforcement % road traffic deaths involving alcohol 14% f National motorcycle helmet law Applies to drivers and passengers Law requires helmet to be fastened Law refers to helmet standard Enforcement Helmet wearing rate 74% All riders g National seat-belt law Applies to front and rear seat occupants Enforcement Seat-belt wearing rate 84% Front seats g, 19% Rear seats g National child restraint law Restrictions on children sitting in front seat Child restraint law based on % children using child restraints 34% g National law on mobile phone use while driving Law prohibits hand-held mobile phone use Law also applies to hands-free phones National drug-driving law e Maximum speed limit can increase to 90km/h on roads exclusively for use by automobiles. f 2013, Korean National Police Agency. g On motorways, lower on other roads Korea Transportation Safety Authority (KOTSA), Transport Culture Index. TRENDS IN REPORTED ROAD TRAFFIC DEATHS Deaths per population Source: Korean National Police Agency Legislative review conducted by WHO. Vehicle safety data from UNECE WP29. Other data collected by questionnaire and cleared by Ministry of Land Infrastructure and Transport. 17
51 SAMOA Population: Income group: Middle Gross national income per capita: US$ INSTITUTIONAL FRAMEWORK Lead agency Funded in national budget National road safety strategy Funding to implement strategy Fatality reduction target SAFER ROADS AND MOBILITY Formal audits required for new road construction projects Regular inspections of existing road infrastructure Policies to promote walking or cycling Policies to encourage investment in public transport Policies to separate road users and protect VRUs SAFER VEHICLES Land Transport Authority Partially funded Total registered vehicles for Cars and 4-wheeled light vehicles Motorized 2- and 3-wheelers 97 Heavy trucks 873 Buses 236 Other 0 Vehicle standards applied a Frontal impact standard Electronic stability control Pedestrian protection a UNECE WP29. POST-CRASH CARE Emergency room injury surveillance system Emergency access telephone numbers Permanently disabled due to road traffic crash b 2013, Accident Compensation Corporation. DATA Multiple numbers 10.1% b Reported road traffic fatalities (2013) 17 c (76% M, 24% F) WHO estimated road traffic fatalities 30 (95% CI 27 33) WHO estimated rate per population 15.8 Estimated GDP lost due to road traffic crashes c Accident Compensation Corporation registration database. Defined as death caused by a road traffic crash (unlimited time period). DEATHS BY ROAD USER CATEGORY Drivers/passengers buses (12%) Drivers/passengers heavy trucks (12%) Source: 2013, Accident Compensation Corporation. Pedestrians (76%) SAFER ROAD USERS National speed limit law Max urban speed limit ~56 km/h Max rural speed limit ~56 km/h Max motorway speed limit Local authorities can modify limits Enforcement National drink driving law BAC limit general population 0.08 g/dl BAC limit young or novice drivers 0.08 g/dl Random breath testing carried out Enforcement % road traffic deaths involving alcohol National motorcycle helmet law Applies to drivers and passengers Law requires helmet to be fastened Law refers to helmet standard Enforcement Helmet wearing rate National seat-belt law Applies to front and rear seat occupants Enforcement Seat-belt wearing rate National child restraint law Restrictions on children sitting in front seat Child restraint law based on % children using child restraints National law on mobile phone use while driving Law prohibits hand-held mobile phone use Law also applies to hands-free phones National drug-driving law TRENDS IN REPORTED ROAD TRAFFIC DEATHS Number of road traffic deaths Source: Accident Compensation Corporation, Samoa Bureau of Statistics Legislative review conducted by WHO. Vehicle safety data from UNECE WP29. Other data collected by questionnaire and cleared by the Ministry of Health.
52 SINGAPORE Population: Income group: High Gross national income per capita: US$ INSTITUTIONAL FRAMEWORK Lead agency Funded in national budget National road safety strategy Funding to implement strategy Fatality reduction target SAFER ROADS AND MOBILITY Formal audits required for new road construction projects Regular inspections of existing road infrastructure Policies to promote walking or cycling Policies to encourage investment in public transport Policies to separate road users and protect VRUs SAFER VEHICLES Traffic Police & Land Transport Authority Partially funded Total registered vehicles for Cars and 4-wheeled light vehicles Motorized 2- and 3-wheelers Heavy trucks Buses Other 444 Vehicle standards applied a Frontal impact standard Electronic stability control Pedestrian protection a UNECE WP29. POST-CRASH CARE Emergency room injury surveillance system Emergency access telephone numbers Multiple numbers Permanently disabled due to road traffic crash DATA Reported road traffic fatalities (2013) 159 b (87% M, 13% F) WHO estimated road traffic fatalities 197 WHO estimated rate per population 3.6 Estimated GDP lost due to road traffic crashes b Traffic Police Department. Defined as died within 30 days of crash. DEATHS BY ROAD USER CATEGORY Pedestrians (27%) Drivers/passengers buses (1%) Cyclists (9%) Source: 2013, Traffic Police Department. Drivers 4-wheeled cars and light vehicles (13%) Passengers 4-wheeled cars and light vehicles (4%) Riders motorized 2- or 3-wheelers (46%) SAFER ROAD USERS National speed limit law Max urban speed limit 70 km/h Max rural speed limit Max motorway speed limit 90 km/h Local authorities can modify limits Enforcement National drink driving law BAC limit general population 0.08 g/dl BAC limit young or novice drivers 0.08 g/dl Random breath testing carried out Enforcement % road traffic deaths involving alcohol 11% c National motorcycle helmet law Applies to drivers and passengers Law requires helmet to be fastened Law refers to helmet standard Enforcement Helmet wearing rate National seat-belt law Applies to front and rear seat occupants Enforcement Seat-belt wearing rate National child restraint law Restrictions on children sitting in front seat Child restraint law based on Weight/Height Enforcement % children using child restraints National law on mobile phone use while driving Law prohibits hand-held mobile phone use Law also applies to hands-free phones National drug-driving law c 2013, Traffic Police Department. TRENDS IN REPORTED ROAD TRAFFIC DEATHS Deaths per population Source: Traffic Police Department Legislative review conducted by WHO. Vehicle safety data from UNECE WP29. Other data collected by questionnaire and cleared by the Ministry of Health. 19
53 SOLOMON ISLANDS Population: Income group: Middle Gross national income per capita: US$ INSTITUTIONAL FRAMEWORK Lead agency Funded in national budget National road safety strategy Funding to implement strategy Fatality reduction target SAFER ROADS AND MOBILITY Formal audits required for new road construction projects Regular inspections of existing road infrastructure Policies to promote walking or cycling Policies to encourage investment in public transport Policies to separate road users and protect VRUs SAFER VEHICLES Ministry of Infrastructure Development t funded Total registered vehicles for Cars and 4-wheeled light vehicles Motorized 2- and 3-wheelers Heavy trucks Buses Other Vehicle standards applied a Frontal impact standard Electronic stability control Pedestrian protection a UNECE WP29. POST-CRASH CARE Emergency room injury surveillance system Emergency access telephone numbers 999 Permanently disabled due to road traffic crash DATA Reported road traffic fatalities (2013) 11 b WHO estimated road traffic fatalities 108 (95% CI ) WHO estimated rate per population 19.2 Estimated GDP lost due to road traffic crashes b Kukum Police Station. Defined as died within 24 hours of crash. DEATHS BY ROAD USER CATEGORY d at a n o t ava i l a b l e SAFER ROAD USERS National speed limit law Max urban speed limit Max rural speed limit Max motorway speed limit Local authorities can modify limits Enforcement National drink driving law c BAC limit general population BAC limit young or novice drivers Random breath testing carried out Enforcement % road traffic deaths involving alcohol 16% d National motorcycle helmet law Applies to drivers and passengers Law requires helmet to be fastened Law refers to helmet standard Enforcement Helmet wearing rate National seat-belt law Applies to front and rear seat occupants Seat-belt wearing rate National child restraint law Restrictions on children sitting in front seat Child restraint law based on % children using child restraints National law on mobile phone use while driving Law prohibits hand-held mobile phone use Law also applies to hands-free phones National drug-driving law c t based on BAC. d Kukum Police Station TRENDS IN REPORTED ROAD TRAFFIC DEATHS Deaths per population Source: Kukum Police Station Legislative review conducted by WHO. Vehicle safety data from UNECE WP29. Other data collected by questionnaire and cleared by the Ministry of Health and Medical Services.
54 TONGA Population: Income group: Middle Gross national income per capita: US$ INSTITUTIONAL FRAMEWORK Lead agency Funded in national budget National road safety strategy Funding to implement strategy Fatality reduction target SAFER ROADS AND MOBILITY Formal audits required for new road construction projects Regular inspections of existing road infrastructure Policies to promote walking or cycling Policies to encourage investment in public transport Policies to separate road users and protect VRUs SAFER VEHICLES Ministry of Police and Ministry of Infrastructure Partially funded Total registered vehicles for Cars and 4-wheeled light vehicles Motorized 2- and 3-wheelers 184 Heavy trucks Buses 49 Other 0 Vehicle standards applied a Frontal impact standard Electronic stability control Pedestrian protection a UNECE WP29. POST-CRASH CARE Emergency room injury surveillance system Emergency access telephone numbers Permanently disabled due to road traffic crash b 2013, Ministry of Health, Tonga. DATA Multiple numbers 1.9% b Reported road traffic fatalities (2013) 8 c (88% M, 13% F) WHO estimated road traffic fatalities 8 WHO estimated rate per population 7.6 Estimated GDP lost due to road traffic crashes c Police Records. Defined as died within a year of crash. DEATHS BY ROAD USER CATEGORY Pedestrians (37%) Source: 2013, Ministry of Police. Passengers 4-wheeled cars and light vehicles (63%) SAFER ROAD USERS National speed limit law Max urban speed limit 50 km/h Max rural speed limit 70 km/h Max motorway speed limit 70 km/h Local authorities can modify limits Enforcement National drink driving law BAC limit general population 0.03 g/dl BAC limit young or novice drivers 0.03 g/dl Random breath testing carried out Enforcement % road traffic deaths involving alcohol 25% d National motorcycle helmet law Applies to drivers and passengers Law requires helmet to be fastened Law refers to helmet standard Enforcement Helmet wearing rate 100% Drivers d, 100% Passengers d National seat-belt law Applies to front and rear seat occupants Seat-belt wearing rate National child restraint law Restrictions on children sitting in front seat Child restraint law based on % children using child restraints National law on mobile phone use while driving Law prohibits hand-held mobile phone use Law also applies to hands-free phones National drug-driving law d 2013, Police Data. TRENDS IN REPORTED ROAD TRAFFIC DEATHS Number of road traffic fatalities Source: Ministry of Police Legislative review conducted by WHO. Vehicle safety data from UNECE WP29. Other data collected by questionnaire and cleared by the Ministry of Health. 21

55 VANUATU Population: Income group: Middle Gross national income per capita: US$ INSTITUTIONAL FRAMEWORK Lead agency Vanuatu Police Force Funded in national budget National road safety strategy Funding to implement strategy Fatality reduction target SAFER ROADS AND MOBILITY Formal audits required for new road construction projects Regular inspections of existing road infrastructure Policies to promote walking or cycling Policies to encourage investment in public transport Policies to separate road users and protect VRUs SAFER VEHICLES Total registered vehicles for Cars and 4-wheeled light vehicles Motorized 2- and 3-wheelers Heavy trucks Buses Other Vehicle standards applied a Frontal impact standard Electronic stability control Pedestrian protection a UNECE WP29. POST-CRASH CARE Emergency room injury surveillance system Emergency access telephone numbers Permanently disabled due to road traffic crash b 2013, Ministry of Health. DATA Multiple numbers 10% b Reported road traffic fatalities (2013) 9 c (33% M, 67% F) WHO estimated road traffic fatalities 42 (95% CI 37 47) WHO estimated rate per population 16.6 Estimated GDP lost due to road traffic crashes c Vanuatu Police Force and Ministry of Health. Defined as died at scene of crash. DEATHS BY ROAD USER CATEGORY Pedestrians (56%) Source: 2013, Vanuatu Police Force and Ministry of Health. Drivers 4-wheeled cars and light vehicles (44%) SAFER ROAD USERS National speed limit law Max urban speed limit Max rural speed limit Max motorway speed limit Local authorities can modify limits National drink driving law d BAC limit general population BAC limit young or novice drivers Random breath testing carried out Enforcement % road traffic deaths involving alcohol 22% e National motorcycle helmet law Applies to drivers and passengers Law requires helmet to be fastened Law refers to helmet standard Enforcement Helmet wearing rate 50% Drivers f, 50% Passengers f National seat-belt law Applies to front and rear seat occupants Seat-belt wearing rate National child restraint law Restrictions on children sitting in front seat Child restraint law based on % children using child restraints National law on mobile phone use while driving Law prohibits hand-held mobile phone use Law also applies to hands-free phones National drug-driving law d t based on BAC. e 2013, Vanuatu Police Force & Ministry of Health. f 2013, Vanuatu Police Force. TRENDS IN REPORTED ROAD TRAFFIC DEATHS d at a n o t ava i l a b l e Legislative review conducted by WHO. Vehicle safety data from UNECE WP29. Other data collected by questionnaire and cleared by the Ministry of Health.
56 VIET NAM Population: Income group: Middle Gross national income per capita: US$ INSTITUTIONAL FRAMEWORK Lead agency National Traffic Safety Committee Funded in national budget National road safety strategy Funding to implement strategy Partially funded Fatality reduction target 5 10% annually ( ) SAFER ROADS AND MOBILITY Formal audits required for new road construction projects Regular inspections of existing road infrastructure Policies to promote walking or cycling Policies to encourage investment in public transport Policies to separate road users and protect VRUs SAFER VEHICLES Subnational Total registered vehicles for Cars and 4-wheeled light vehicles Motorized 2- and 3-wheelers Heavy trucks Buses Other Vehicle standards applied a Frontal impact standard Electronic stability control Pedestrian protection a UNECE WP29. POST-CRASH CARE Emergency room injury surveillance system Emergency access telephone numbers 115 Permanently disabled due to road traffic crash DATA Reported road traffic fatalities (2013) b WHO estimated road traffic fatalities WHO estimated rate per population 24.5 Estimated GDP lost due to road traffic crashes 2.9% c b National Traffic Safety Committee Annual Report. Defined as died within 7 days of crash. c 2012, The research master plan for road safety in Vietnam (Japan International Cooperation Agency). DEATHS BY ROAD USER CATEGORY d at a n o t ava i l a b l e SAFER ROAD USERS National speed limit law Max urban speed limit 50 km/h Max rural speed limit 80 km/h Max motorway speed limit Local authorities can modify limits Enforcement National drink driving law BAC limit general population g/dl d BAC limit young or novice drivers g/dl d Random breath testing carried out Enforcement % road traffic deaths involving alcohol 34% e National motorcycle helmet law Applies to drivers and passengers Law requires helmet to be fastened Law refers to helmet standard Enforcement Helmet wearing rate 96% Drivers f, 83% Passengers f National seat-belt law Applies to front and rear seat occupants Enforcement Seat-belt wearing rate National child restraint law Restrictions on children sitting in front seat Child restraint law based on % children using child restraints National law on mobile phone use while driving Law prohibits hand-held mobile phone use Law also applies to hands-free phones National drug-driving law d For motorcycles drivers and for drivers of all other vehicles. e 2003, National Forensic Institute. f 2013, Hanoi School of Public Health, Helmet observations in select provinces. TRENDS IN REPORTED ROAD TRAFFIC DEATHS Deaths per population Source: National Traffic Safety Committee Annual Reports Legislative review conducted by WHO. Vehicle safety data from UNECE WP29. Other data collected by questionnaire and cleared by the Ministry of Transport. 23
57 Acknowledgements This Regional Report was made possible through funding from Bloomberg Philanthropies.

58
Global Status Report on Road Safety: Respondents' Questionnaire
 Global Status Report on Road Safety: Respondents' Questionnaire Country: Respondent's Information Name: Position: Institution: Email: Telephone: Fax: National Data Coordinator Name: Position: Institution:
Table 1: Candidate global targets and indicators for review
 Table 1: Candidate global targets and indicators for review Core area Objective and target Indicator Data source How data are collected Justification Road management Improve road management across all
Recommendations of the Expert Group on Preventing Motorcycle Injuries in Children
 Recommendations of the Expert Group on Preventing Motorcycle Injuries in Children All Member States in the WHO South-East Asia (SEA) Region are low- and middle-income countries. In the SEA Region, the
ROAD SAFETY ANNUAL REPORT 2018 LITHUANIA
 ROAD SAFETY ANNUAL REPORT 2018 LITHUANIA LITHUANIA In 2017, 192 persons lost their lives in traffic crashes. Lithuania is one of the IRTAD countries that has achieved the strongest reduction in the number
Road Safety Status of AEC Countries
 การประช มว ชาการว ศวกรรมโยธาแห งชาต คร งท 19 19 th National Convention on Civil Engineering ว นท 14-16 พฤษภาคม 2557 จ. ขอนแก น 14-16 May 2014, Khon Kaen, THAILAND Road Safety Status of AEC Countries Pongrid
Government and Governance
 218 Government and Governance Negative fiscal balances are observed in slightly over half of the economies in the region. A number of relatively fast-growing economies have low tax burdens. Government
Government and Governance
 264 Government and Governance Fiscal deficits fell in 2010 as economies throughout the region recovered from the financial crisis. Government spending on social security and welfare have been rising throughout
STATISTICS. Economic Research and Regional Cooperation Department. Core Indicators. Development Economics and Indicators Division
 Total Average Annual Growth Proportion of below $1.90 Purchasing Power Parity (PPP) a Day CORE INDICATORS Proportion of Living below the National Poverty Line Annual Growth Per Capita of Gross Gross National
Road fatalities in 2012
 Lithuania 1 Inhabitants Vehicles/1 000 inhabitants Road fatalities in 2012 Fatalities /100 000 inhabitants in 2012 2.98 million 751 301 10.1 1. Road safety data collection Definitions Road fatality: person
Successes and failures of road safety policy in Europe
 of road safety Francesco Mitis WHO Regional Office for Europe Athens, 22 November 2012 http://www.euro.who.int/en/what-we-do/health-topics/diseaseprevention/violence-and-injuries mit@euro.who.int Road
SUMMARY GLOBAL STATUS REPORT ON ROAD SAFETY 2018
 SUMMARY GLOBAL STATUS REPORT ON ROAD SAFETY 2018 Global status report on road safety 2018: Summary WHO/NMH/NVI/18.20 World Health Organization 2018 Some rights reserved. This work is available under the
Stronger road safety. in South Australia. Presented by Tamra Fedojuk Senior Statistician Road Safety Policy
 Stronger road safety performance monitoring in South Australia Presented by Tamra Fedojuk Senior Statistician Road Safety Policy Outline Introduction Challenges for road safety in South Australia Current
Global Status Report on Road Safety: INSTRUCTIONS FOR COMPLETION OF RESPONDENTS' QUESTIONNAIRE
 : INSTRUCTIONS FOR COMPLETION OF RESPONDENTS' QUESTIONNAIRE Thank you for completing this questionnaire. This questionnaire was developed to assess the response to the road safety situation in your country.
VIETNAM TRAFFIC SAFETY FOR 2 WHEELERS: CHALLENGES AND STRATEGIES. Trinh Thu Ha Deputy Chief Office National Traffic Safety Committee Vietnam
 VIETNAM TRAFFIC SAFETY FOR 2 WHEELERS: CHALLENGES AND STRATEGIES Trinh Thu Ha Deputy Chief Office National Traffic Safety Committee Vietnam 7 December 2017 12/7/2017 2 Content Vietnam Demographic-Society
Government and Governance
 255 Government and Governance The global crisis has increased fiscal deficits in most economies and reduced tax revenues, but government expenditures on education and on social security and welfare have
Strategic Planning Directorate General of Traffic. VI International Conference of European Traffic Policies Barcelona, 16 May 2014
 Strategic Planning Directorate General of Traffic VI International Conference of European Traffic Policies Barcelona, 16 May 2014 Script Objective Context: Present and Evolution. Assessments Strategy Areas
Economy and Output. Snapshots. Key trends. 220 Key Indicators for Asia and the Pacific 2015
 220 Key Indicators for Asia and the Pacific 2015 Economy and Output Snapshots The Asia and Pacific region generated more than 40% of global gross domestic product (GDP) in purchasing power parity terms
International Flows REGIONAL TABLES. Introduction. Key Trends. Key Indicators for Asia and the Pacific 2008
 183 International Flows The People s Republic of China has the biggest share of merchandise exports in the region. The destination of exports of major exporters tends to be other Asian economies. A similar
Collect and analyze data on motorcycle crashes, injuries, and fatalities;
 November 2006 Highway Safety Program Guideline No. 3 Motorcycle Safety Each State, in cooperation with its political subdivisions and tribal governments and other parties as appropriate, should develop
People REGIONAL TABLES. Introduction. Key Trends. Key Indicators for Asia and the Pacific 2010
 125 People The Asia and Pacific region accounts for about 56% of the world s population, with about 37% living in the two most populous economies, People s Republic of China (PRC) and India. Population
Second Global status report on road safety: Respondents' Questionnaire
 Second Global status report on road safety: Respondents' Questionnaire Country: Respondent's Information Name: Position: Institution: E-mail address: Phone number: Fax: INSTRUCTIONS FOR COMPLETION OF RESPONDENTS'
2018 ESCAP population data sheet
 2018 ESCAP data sheet Population and Development Indicators for Asia and the, 2018 Region, subregion, country, territory or area Population at mid-year Population growth 1 2 3 4 5 6 7 8 9 10 11 12 13 14
Economy and Output. Introduction. Key Trends. Key Indicators for Asia and the Pacific 2010
 152 Economy and Output The Asia and Pacific region accounts for almost one third of global GDP measured in purchasing power parity (PPP) terms. Many economies in the region have made substantial increases
Figure 4.1 Shares in total world exports, regions of the world and major exporters in the Asia and Pacific region, Asia and the Pacific 32.
 255 Globalization Snapshots The Asia and Pacific region accounted for about one-third of the world s merchandise exports. Subdued demand from major markets dampened export growth in 2012. Intraregional
I. Road Safety Targets and Indicators. II. Follow-up. III. Proposal. Note by the secretariat
 Note by the secretariat Informal document WP.29-172-29 172 nd WP.29, 20-23 June 2017 Agenda item 8.5 I. Road Safety Targets and Indicators 1. The representative of the World Health Organization (WHO) presented
The potential for insurance markets to reduce road trauma. Samantha Cockfield, Manager Road Safety
 The potential for insurance markets to reduce road trauma Samantha Cockfield, Manager Road Safety Outline TAC at a glance Role in road safety Road trauma the strategy Key reduction measures safer roads
DOT HS April 2013
 TRAFFIC SAFETY FACTS 2011 Data DOT HS 811 753 April 2013 Overview Motor vehicle travel is the primary means of transportation in the United States, providing an unprecedented degree of mobility. Yet for
TRAFFIC SAFETY FACTS. Overview Data
 TRAFFIC SAFETY FACTS 2009 Data Overview Motor vehicle travel is the primary means of transportation in the United States, providing an unprecedented degree of mobility. Yet for all its advantages, injuries
Presented by Mr. Lian Cin Mang (Director) Mr. Aung Kyaw Tun (Assistant Director) Ministry of Transport and Communications 1
 Mr. Aung Kyaw Tun (Assistant Director) Ministry of Transport and Communications 1") 28.7.2016 Seoul, Republic of Korea Presented by Mr. Lian Cin Mang (Director) Mr. Aung Kyaw Tun (Assistant Director) Ministry of Transport and Communications 1 2 National Road Safety Council was established
28.7.2016 Seoul, Republic of Korea Presented by Mr. Lian Cin Mang (Director) Mr. Aung Kyaw Tun (Assistant Director) Ministry of Transport and Communications 1 2 National Road Safety Council was established
Road Map For Safer Vehicles & Fleet Safety
 Road Map For Safer Vehicles & Fleet Safety David Ward Secretary General Global New Car Assessment Programme Global Fleet Conference Miami 6-8 June 2017 Changing Geography of Vehicle Use Global NCAP - Building
Economy and Output. Key Trends. Key Indicators for Asia and the Pacific 2011
 156 Economy and Output Asia generated a third of global GDP (gross domestic product) in 2009 in purchasing power parity terms. The big three the People s Republic of China, Japan, and India dominate the
ROAD SAFETY ANNUAL REPORT 2018 NEW ZEALAND
 ROAD SAFETY ANNUAL REPORT 2018 NEW ZEALAND NEW ZEALAND Following the all-time low in fatalities achieved in 2013, New Zealand registered four consecutive years of increases in the number of road deaths.
Respecting the Rules Better Road Safety Enforcement in the European Union. ACEA s Response
 Respecting the Rules Better Road Safety Enforcement in the European Union Commission s Consultation Paper of 6 November 2006 1 ACEA s Response December 2006 1. Introduction ACEA (European Automobile Manufacturers
Figure 4.1: Shares in Total World Exports, Regions of the World; and Major Exporters in the Asia and Pacific Region, 2014
 272 Key Indicators for Asia and the Pacific 2015 Globalization Snapshots The Asia and Pacific region accounted for about one-third of the world s merchandise exports in 2014, up from about one-quarter
Where are the Increases in Motorcycle Rider Fatalities?
 Where are the Increases in Motorcycle Rider Fatalities? Umesh Shankar Mathematical Analysis Division (NPO-121) Office of Traffic Records and Analysis National Center for Statistics and Analysis National
A) New zero tolerance drug presence laws for young and novice drivers. Create a new regulation to define and permit the use of federally
 New zero tolerance drug presence laws for young and novice drivers. Create a new regulation to define and permit the use of federally") Proposed Regulatory Amendments to Support Implementation of Schedule 4 of the Cannabis, Smoke-Free Ontario and Road Safety Statute Law Amendment Act, 2017 Background: For the last 16 years, Ontario has
Proposed Regulatory Amendments to Support Implementation of Schedule 4 of the Cannabis, Smoke-Free Ontario and Road Safety Statute Law Amendment Act, 2017 Background: For the last 16 years, Ontario has
OECD TRANSPORT DIVISION RTR PROGRAMME ROAD SAFETY PERFORMANCE - TRENDS AND COMPARATIVE ANALYSIS
 OECD TRANSPORT DIVISION RTR PROGRAMME ROAD SAFETY PERFORMANCE - TRENDS AND COMPARATIVE ANALYSIS ROAD SAFETY TRENDS IN OECD COUNTRIES Attachment 1 1. Trends in road fatalities - 1990 to 2000 Between 1990
POLICY POSITION ON THE PEDESTRIAN PROTECTION REGULATION
 POLICY POSITION ON THE PEDESTRIAN PROTECTION REGULATION SAFETY Executive Summary FIA Region I welcomes the European Commission s plan to revise Regulation 78/2009 on the typeapproval of motor vehicles,
Florida Strategic Highway Safety Planning Florida Strategic Highway Safety Plan (SHSP) Update and Performance Overview
 Update and Performance Overview") Session 1 Florida Strategic Highway Safety Planning Florida Strategic Highway Safety Plan (SHSP) Update and Performance Overview Joe Santos, PE, FDOT, State Safety Office October, 23, 2013 Florida Statistics
Session 1 Florida Strategic Highway Safety Planning Florida Strategic Highway Safety Plan (SHSP) Update and Performance Overview Joe Santos, PE, FDOT, State Safety Office October, 23, 2013 Florida Statistics
Figure 2.1: Distribution of Gross Domestic Product at Purchasing Power Parity Asia and Pacific Region in the World Economy (%)
") 134 Key Indicators for Asia and the Pacific 2017 II. Economy and Output Snapshot Asia and the Pacific accounted for 40.9% of global gross domestic product (GDP) at purchasing power parity (PPP) in 2016,
134 Key Indicators for Asia and the Pacific 2017 II. Economy and Output Snapshot Asia and the Pacific accounted for 40.9% of global gross domestic product (GDP) at purchasing power parity (PPP) in 2016,
Analysis of Road Crash Statistics Western Australia 1990 to Report. December Project: Transport/21
 Analysis of Road Crash Statistics Western Australia 1990 to 1999 Report December 2000 Project: Transport/21 Analysis of Road Crash Statistics Western Australia 1990 to 1999 December 2000 Client: Transport
Globalization. Snapshots. Key trends. 212 Key Indicators for Asia and the Pacific 2014
 212 Key Indicators for Asia and the Pacific 2014 Snapshots The Asia and Pacific region accounted for about one-third of the world s merchandise exports in 2013, up from about one-quarter in 2001. At the
Money, Finance, and Prices
 232 Key Indicators for Asia and the Pacific 2013 Money, Finance, and Prices Snapshots Inflation eased across the Asia and Pacific region in 2012, reflecting softer economic growth in the region, relatively
Produced by: Working in partnership with: Brake. the road safety charity
 1 Direct Line & Brake Reports on Safe Driving 2013-2014 REPORT ONE Are you ready to drive Produced by: Brake the road safety charity Working in partnership with: INTRODUCTION Julie Townsend, Brake s deputy
The People s Republic of China and Hong Kong, China together accounted for nearly 55% of developing member economies total external debt in 2015.
 185 IV. Globalization Snapshot The People s Republic of China and Hong Kong, China were once again the recipients of the largest net foreign direct investment (FDI) inflows in nominal terms in 2016, while
Major causes of road crashes in countries in the Asia-Pacific region
 https://twitter.com/shirleyeungccsi/status/748914589132165120 UNESCAP Regional Meeting on Renewing Regional Road Safety Goalsand Targets 28-29 July, 2016, Seoul, Republic of Korea Major causes of road
Discussion Paper: Developing indicators for voluntary global performance targets for road safety risk factors and service delivery mechanisms
 Discussion Paper: Developing indicators for voluntary global performance targets for road safety risk factors and service delivery mechanisms INTRODUCTION Background 1. The importance of setting performance
Figure 15. Yearly Trend in Death Rates for Motor Vehicle Transport: NSW, Year
 6.0 MOTOR VEHICLE TRANSPORT 6.1 Deaths due to Motor Vehicle Transport: The motor vehicle transport (MV) death rate showed a statistically significant decrease overall between 1989 and 1999 although the
ROYAL AUSTRALASIAN COLLEGE OF SURGEONS Subject: Road Trauma Prevention Ref. No. FES-FEL-046
 BACKGROUND In 1965 the Royal Australasian College of Surgeons (the College) recognized that road trauma was a serious public health problem reaching epidemic proportions. A Road Trauma Committee was appointed
Priorities for future vehicle safety improvements in the Western Australian light vehicle fleet
 Priorities for future vehicle safety improvements in the Western Australian light vehicle fleet a, L. & Newstead a, S. a Monash University Accident Research Centre & Curtin-Monash Accident Research Centre,
Road safety in Greece
 Athens, Greece April 23-26 2012 Transport Research Arena Europe 2012 Road safety in Greece George Yannis, Eleonora Papadimitriou National Technical University of Athens, Greece Background and objectives
Transportation Demand Management Element
 Transportation Demand Management Element Over the years, our reliance on the private automobile as our primary mode of transportation has grown substantially. Our dependence on the automobile is evidenced
IRTAD Activities and Management of Road Infrastructure Safety
 IRTAD Activities and Management of Road Infrastructure Safety Sangjin Han Expert Group Meeting on Road Safety Seoul, 8-10 May 2013 2 Outline IRTAD in a nutshell Twinning program Management of Road Infrastructure
GOVERNMENT STATUS REPORT OF JAPAN
 GOVERNMENT STATUS REPORT OF JAPAN Hidenobu KUBOTA Director, Policy Planning Office for Automated Driving Technology, Engineering Policy Division, Road Transport Bureau, Ministry of Land, Infrastructure,
ANNEX ON TRADE PERFORMANCE INDICATORS. Annex on Trade Performance Indicators
 Annex on Trade Performance Indicators 177 ASIA-PACIFIC TRADE AND INVESTMENT REPORT 2009 178 List of tables Page 1.1. Merchandise exports to the world... 187 1.2. Merchandise imports from the world... 188
2010 Motorcycle Risk Study Update
 2010 Motorcycle Risk Study Update Introduction This report provides an update to the Motorcycle Risk Study from AI.16 of the 2005 Rate Application. The original study was in response to Public Utilities
Money, Finance, and Prices
 250 Key Indicators for Asia and the Pacific 2015 Money, Finance, and Prices Snapshots Inflation generally remained low across Asia and the Pacific in 2014 as declining oil prices took pressure off of consumer
Policy Options to Decarbonise Urban Passenger Transport
 Policy Options to Decarbonise Urban Passenger Transport Results of expert opinion survey Guineng Chen, ITF/OECD 19 April 2018 2 INTRODUCTION The expert survey is part of the ITF Decarbonising Transport
Target Zero: Underutilized Strategies in Traffic Safety That Work
 Target Zero: Underutilized Strategies in Traffic Safety That Work James C. Fell National Opinion Research Center (NORC) at the University of Chicago, Bethesda, MD Office The Problem In 2015, 35,092 people
The Shared Road To Safety A Global Approach for Safer Motorcycling
 The Shared Road To Safety A Global Approach for Safer Motorcycling WP.1 Roundtable 23 March 2014, Geneva Edwin Bastiaensen, Secretary General Overview 1. Introduction to IMMA 2. Use of Powered Two-Wheelers
Quick Facts General Statistics. Fatality Rate per 100,000 Population Source: FARS/Census
 Fatal Crashes 2016 34,439 2015 32,539 2014 30,056 Fatality Rate per 100 Million VMT 2016 1.18 2015 1.15 2014 1.08 /FHWA 2016 37,461 2015 35,485 2014 32,744 General Statistics Fatality Rate per 100,000
National Center for Statistics and Analysis Research and Development
 U.S. Department of Transportation National Highway Traffic Safety Administration DOT HS 809 271 June 2001 Technical Report Published By: National Center for Statistics and Analysis Research and Development
National Road Safety Action Plan in China
 Sixth SHRP 2 Safety Research Symposium National Road Safety Action Plan in China Dr. Yan Wang July 14, 2011 Washington DC, USA Outline 1 Initiative of Road Safety Action Plan 2 Phase I 3 For Next Phase?
Towards Safer Roads. National Road Safety Plan Executive Summary
 National Road Safety Plan 2020 Executive Summary National Road Safety Plan 2020 Executive Summary Implementing Israel s national road safety policy is predicated on four key conditions: the firm commitment
Statement before the North Carolina House Select Committee. Motorcycle Helmet Laws. Stephen L. Oesch
 Statement before the North Carolina House Select Committee Motorcycle Helmet Laws Stephen L. Oesch The Insurance Institute for Highway Safety is a nonprofit research and communications organization that
Table 1. GDP per Capita, current prices, (US$)
") Table 1. GDP per Capita, current prices, -211 (US$) 21 22 23 24 25 26 27 28 29 211 Estimates Start After Brunei Darussalam 18,477 16,828 16,977 18,757 21,885 25,754 29,949 31,44 36,223 26,423 29,852 36,584
Table 1. GDP per Capita, current prices, -211 (US$) 21 22 23 24 25 26 27 28 29 211 Estimates Start After Brunei Darussalam 18,477 16,828 16,977 18,757 21,885 25,754 29,949 31,44 36,223 26,423 29,852 36,584
Low Carbon Green Growth Roadmap for Asia and the Pacific FACT SHEET
 Smart grid Low Carbon Green Growth Roadmap for Asia and the Pacific FACT SHEET Key point The smart grid allows small- and medium-scale suppliers and individuals to generate and distribute power in addition
Non-standard motorcycle helmets in low and middleincome
 Non-standard motorcycle helmets in low and middleincome nations: A Multi-country Study Rationale Motorcycles are a common and increasing form of transport in many LMIC Efficacy of helmets in reducing serious
Population. H.2. Transport
 H.2. Efficient, reliable and safe transport infrastructure and services are crucial to regional integration and the sustainable and inclusive economic and social development of countries. Asia and the
COUNTERMEASURES THAT WORK:
 COUNTERMEASURES THAT WORK: A HIGHWAY SAFETY COUNTERMEASURE GUIDE FOR STATE HIGHWAY SAFETY OFFICES NINTH EDITION, 2017 AT A GLANCE SUMMARY DOCUMENT ACCESS THE FULL REPORT HERE: Richard, C. M., Magee, K.,
First Do No Harm: Why Seatbelts are a Patient Care Issue. Noah Smith, NHTSA Office of EMS
 First Do No Harm: Why Seatbelts are a Patient Care Issue Noah Smith, NHTSA Office of EMS Hi, I m Noah Standard Bureaucratic Disclaimer To the extent that I mention specific brands or products in this presentation,
northeast group, llc Southeast Asia Smart Grid: Market Forecast ( ) Volume II October group.com
 Volume II October group.com") northeast group, llc Southeast Asia Smart Grid: Market Forecast (2014 2024) Volume II October 2014 www.northeast- group.com Southeast Asia Smart Grid: Market Forecast (2014-2024) Southeast Asia is a growing
northeast group, llc Southeast Asia Smart Grid: Market Forecast (2014 2024) Volume II October 2014 www.northeast- group.com Southeast Asia Smart Grid: Market Forecast (2014-2024) Southeast Asia is a growing
NTSB Recommendations to Reduce Speeding-Related Crashes
 NTSB Recommendations to Reduce Speeding-Related Crashes Nathan Doble and Ivan Cheung Lifesavers Conference Fast & Furious Won t Get Us to Zero Workshop Sunday, April 22, 2018 1 About the NTSB Independent
Abstract. 1. Introduction. 1.1 object. Road safety data: collection and analysis for target setting and monitoring performances and progress
 Road Traffic Accident Involvement Rate by Accident and Violation Records: New Methodology for Driver Education Based on Integrated Road Traffic Accident Database Yasushi Nishida National Research Institute
Urban Transport systems in major cities in China. Sun Kechao Senior Engineer China Academy of Transportation Sciences, Beijing, China
 Urban Transport systems in major cities in China Sun Kechao Senior Engineer China Academy of Transportation Sciences, Beijing, China Part 1 Part 2 Part 3 Part 4 Introduction Urban transport policies Urban
10th Eastern Partnership Transpot Panel
 10th Eastern Partnership Transpot Panel 11th May 2016 Maria Teresa SANZ VILLEGAS Road Safety Unit Directorate-General for Mobility and European Commission WHITE PAPER 2011: Towards a zero-vision on road
Robert Beckman Head, Ocean Law & Policy Programme NUS Centre for International Law
 International Conference on Regional Cooperation for the Protection of the Marine Environment 15-16 January 2019, Singapore Panel 5. Session 1 Ship-Source Pollution: Current State of Play in Southeast
HEAVY VEHICLE DRIVERS INVOLVED IN ROAD CRASHES IN SOUTH AUSTRALIA
 FACT SHEET HEAVY VEHICLE DRIVERS INVOLVED IN ROAD CRASHES IN SOUTH AUSTRALIA OVERVIEW Heavy vehicles 1 travel more than 1.3 billion kilometres per year in South Australia. represent 8% of the kilometres
Road Safety s Mid Life Crisis The Trends and Characteristics for Middle Aged Controllers Involved in Road Trauma
 Road Safety s Mid Life Crisis The Trends and Characteristics for Middle Aged Controllers Involved in Road Trauma Author: Andrew Graham, Roads and Traffic Authority, NSW Biography: Andrew Graham has been
Urban Transport Development Investment Program (RRP MON 39256) SECTOR ROAD MAP
 SECTOR ROAD MAP") Urban Transport Development Investment Program (RRP MON 39256) SECTOR ROAD MAP 1. The government s vision for urban transport in Ulaanbaatar provides the basis for the sector roadmap to be implemented
Urban Transport Development Investment Program (RRP MON 39256) SECTOR ROAD MAP 1. The government s vision for urban transport in Ulaanbaatar provides the basis for the sector roadmap to be implemented
Pupil Transportation Safety
 Highway Safety Program Guideline No. 3 March 2009 Highway Safety Program Guideline No. 17 Pupil Transportation Safety Each State, in cooperation with its political subdivisions and tribal governments,
Safety and Green Vehicle Performance Rating
 Safety and Green Vehicle Performance Rating presentation by David Ward Secretary General Global New Car Assessment Programme 2014 Fleet Forum Budapest 3 rd April 2014 Changing Geography of Vehicle Use
OVERVIEW OF THE ASIAN FUEL MARKET
 OVERVIEW OF THE ASIAN FUEL MARKET THE EUROPEAN FUELS CONFERENCE 9 March 2011 Sunanda Banerjee European Fuel Oxygenates Association - www.efoa.eu Mission and Vision Working closely with fuel policymakers,
Kathrine Wilson-Ellis Strategic Safety Team. Phil Proctor Future Technologies
 Kathrine Wilson-Ellis Strategic Safety Team Phil Proctor Future Technologies Who are we? 1 st April 2015 Highways England is a public sector company, owned by the Government Primary role of Highways England
Road fatalities in Road fatality: A person who died immediately after the crash or within the next 30 days.
 Finland Source: IRTAD, Finnish Transport Safety Agency, TraFi Inhabitants Vehicles/1 000 inhabitants Road fatalities in 2012 Fatalities /100 000 inhabitants in 2012 5.4 million 710 255 4.7 1. Road safety
Seat Belt Law and Road Traffic Injuries in Delhi, India
 Seat Belt Law and Road Traffic Injuries in Delhi, India Dinesh MOHAN Professor Transportation Research & Injury Prevention Programme Indian Institute of Technology Delhi Hauz Khas New Delhi 110016, India
GRADUATED LICENSING. KITCHEN TABLE DISCUSSION GUIDE Have your say on Your PLates reforms
 YOUR GRADUATED LICENSING KITCHEN TABLE DISCUSSION GUIDE Have your say on Your PLates reforms Justice and Community Safety Directorate April - May 2018 INTRODUCTION Thank you for your interest in how we
INJURY PREVENTION POLICY ANALYSIS
 INJURY PREVENTION POLICY ANALYSIS Graduated Driver Licensing for Passenger Vehicles in Atlantic Canada Introduction Motor vehicle collisions (MVC) are a leading cause of death for young Atlantic Canadians.
RSWGM meeting European Commission DG MOVE 3-4 April 2017
 Podgorica RSWGM meeting European Commission DG MOVE 3-4 April 2017 Mobility and Transport 1 WHITE PAPER 2011: Towards a zero-vision on road safety POLICY ORIENTATIONS ON ROAD SAFETY 2011-2020 The -50%
ROAD SAFETY ANNUAL REPORT 2018 HUNGARY
 ROAD SAFETY ANNUAL REPORT 2018 HUNGARY HUNGARY Hungary recorded 625 road fatalities in 2017, representing a 3% increase when compared to 2016. The mortality rate is 6.2 deaths per 100 000 population. From
The UNECE World Forum for Harmonization of Vehicle Regulations (WP.29)
") Vehicle technologies to enhance road safety Regulatory Context The UNECE World Forum for Harmonization of Vehicle Regulations (WP.29) Brussels, 8 March 2013 Antonio ERARIO, Italian Ministry of Transport
Vehicle technologies to enhance road safety Regulatory Context The UNECE World Forum for Harmonization of Vehicle Regulations (WP.29) Brussels, 8 March 2013 Antonio ERARIO, Italian Ministry of Transport
Ex-Ante Evaluation (for Japanese ODA Loan)
") Japanese ODA Loan Ex-Ante Evaluation (for Japanese ODA Loan) 1. Name of the Project Country: India Project: Delhi Mass Rapid Transport System Project Phase 2 (V) Loan Agreement: March 31, 2010 Loan Amount:
Japanese ODA Loan Ex-Ante Evaluation (for Japanese ODA Loan) 1. Name of the Project Country: India Project: Delhi Mass Rapid Transport System Project Phase 2 (V) Loan Agreement: March 31, 2010 Loan Amount:
Reducing CO 2 emissions from vehicles by encouraging lower carbon car choices and fuel efficient driving techniques (eco-driving)
") Reducing CO 2 emissions from vehicles by encouraging lower carbon car choices and fuel efficient driving techniques (eco-driving) David Pryke, Head of Efficient Driving, Department for Transport, London
Reducing CO 2 emissions from vehicles by encouraging lower carbon car choices and fuel efficient driving techniques (eco-driving) David Pryke, Head of Efficient Driving, Department for Transport, London
SECTOR ASSESSMENT (SUMMARY): URBAN TRANSPORT
: URBAN TRANSPORT") Vientiane Sustainable Urban Transport Project (RRP LAO 45041) Sector Road Map SECTOR ASSESSMENT (SUMMARY): URBAN TRANSPORT 1. Sector Performance, Problems, and Opportunities 1. Road transport dominates
Vientiane Sustainable Urban Transport Project (RRP LAO 45041) Sector Road Map SECTOR ASSESSMENT (SUMMARY): URBAN TRANSPORT 1. Sector Performance, Problems, and Opportunities 1. Road transport dominates
A Question of Size: Involvement of Large Trucks in Road Crashes
 A Question of Size: Involvement of Large Trucks in Road Crashes Steve Brown Research Associate Traffic Injury Research Foundation 3 rd Ontario Road Safety Forum Toronto, Ontario March 6, 2018 Involvement
Doubling the Market Share of Public Transport Worldwide by 2025: A Smart Future for Cities
 Doubling the Market Share of Public Transport Worldwide by 2025: A Smart Future for Cities Dawn CHUI International Association of Public Transport (UITP) Contents 1. What would happen in 2025 if current
How to make urban mobility clean and green
 POLICY BRIEF Decarbonising Transport Initiative How to make urban mobility clean and green The most effective way to decarbonise urban passenger transport? Shared vehicles, powered by clean electricity,
Final Administrative Decision
 Final Administrative Decision Date: August 30, 2018 By: David Martin, Director of Planning and Community Development Subject: Shared Mobility Device Pilot Program Operator Selection and Device Allocation
Road Safety. Background Information. Motor Vehicle Collisions
 Background Information Motor Vehicle Collisions For many Canadians, the riskiest part of their job is their time spent on the road driving. Motor vehicle collisions are the leading cause of injury and
NHTSA / ANSTSE. Traffic Safety for Teen Drivers Presenter:
 NHTSA / ANSTSE Traffic Safety for Teen Drivers Presenter: Presentation Topics NHTSA s Support for Driver Education The Stakeholder Association - ANSTSE Young Motor Vehicle Crashes NHTSA Initiatives Vermont