EFFECT OF GIRDER DAMAGE ON THE STRUCTURAL BEHAVIOR OF SLAB- ON-GIRDER BRIDGES. A THESIS IN CIVIL ENGINEERING Master of Science in Civil Engineering
|
|
|
- Osborn Robertson
- 5 years ago
- Views:
Transcription

1 EFFECT OF GIRDER DAMAGE ON THE STRUCTURAL BEHAVIOR OF SLAB- ON-GIRDER BRIDGES A THESIS IN CIVIL ENGINEERING Master of Science in Civil Engineering Presented to the faculty of the American University of Sharjah College of Engineering in partial fulfillment of the requirements for the degree MASTER OF SCIENCE by AHMED E. ELOZN B.S Sharjah, UAE June 2011
2 2011 AHMED E. ALOZN ALL RIGHTS RESERVE
3 We approve the thesis of Ahmad E. Alozn Date of signature Dr. Sami Tabsh Professor Department of Civil Engineering Thesis Advisor Dr. Farid H. Abed Assistant Professor Department of Civil Engineering Graduate Committee Dr. Ibrahim Deiab Associate Professor Department of Mechanical Engineering Graduate Committee Samer Barakat, Professor, Department of Civil & Environmental Engineering, University of Sharjah Graduate Committee Dr. Jamal Abdulla Department Head Department of Civil Engineering Dr. Hany El Kadi Associate Dean College of Engineering Dr. Yousef Al-Assaf Dean College of Engineering Dr. Gautam Sen Vice Provost Research & Graduate Studies
4 EFFECT OF GIRDER DAMAGE ON THE STRUCTURAL BEHAVIOR OF SLAB- ON-GIRDER BRIDGES Ahmed E. Alozn, Candidate for the Master of Science Degree American University of Sharjah, 2011 ABSTRACT There are many bridges around the world that have been constructed with inadequate vertical clearance. Such bridges are susceptible to over-height vehicle collisions, causing damage to the underside of the supporting girders. The incurred damage leads to redistribution of load among the girders. The objective of this study is to investigate the effect of minor damage in the exterior girder on the behavior of composite steel girder bridges subjected to live load. This is done through numerical studies involving finite element modeling of various bridges with different geometry. Linearly elastic material behavior is utilized since the loading condition is that of a serviceability criterion, and the damaged girder is eventually repaired after a short period of time following the next inspection. Different extent of damage in the exterior girder is considered, and their effect on the live load distribution factor for shear and moment in the exterior and adjacent interior girders is studied. The damage in the girders is confined to the lower part of the web and bottom flange, at different distortion angles. The study showed that the reduced stiffness of the damaged exterior girder pushes live load away from it to the nearby undamaged interior girders; thus, the girder distribution factor in the exterior girder reduces and the same for the adjacent interior girder(s) increases. Also, damage to the exterior girder significantly impact the flexural live load redistribution in a steel girder bridge but does not have a measurable effect on the shear live load redistribution. For the flexural live load effect, the percentage decrease in the exterior girder s distribution factor reaches about 50-70% when the damage distorts the exterior steel girder web by 45 o. The corresponding increases in the girder distribution factor for the first and second interior girders are within the ranges 40-50% and 5-15%, respectively. For the 45 o damage distortion angle, the live load flexural effect to flexural capacity ratio of the damaged exterior girder increases many times over the same ratio in an undamaged exterior girder. iii
5 Contents ABSTRACT... iii LIST OF ILLUSTRATIONS... vi LIST OF TABLES... ix ACKNOWLEDGEMENTS... x INTRODUCTION... 1 BACKGROUND AND LITRATURE REVIEW Introduction Types of Bridges AASHTO LRFD Live Load Methods for Live Load Distribution The AASHTO LRFD Live Load Distribution Method Bridge Damage FINITE ELEMENT MODELING Introduction Finite Element Theory Finite Element Modeling of Bridges Model Verification Methodology Introduction Bridges and Damage Scenarios Considered GDF, Critical Girders, and Critical Truck Positioning Observations and Comments FINDINGS AND DISCUSSION Introduction Flexural Effect Effect of Span Length Effect of Girder Spacing Effect of Cross-Bracing Spacing Effect of Slab Thickness Effect of Deck Slab Overhang Width Discussion of Results on Flexural Behavior Shear Effect iv
6 5.3.1 Effect of Girder Spacing Effect of Cross-Bracing Spacing Effect of Deck Slab Thickness Discussion of Results on Shear Flexural Behavior Effect of Damage on Flexural Capacity of Exterior Girder SUMMARY, CONCLUSIONS AND RECOMMENDATIONS Summary Conclusions Shear Flexure Recommendations for Future Studies BIBLIOGRAPHY APPENDIX A APPENDIX B APPENDIX C VITA v
7 LIST OF ILLUSTRATIONS Figure 1.1: Typical damage in a steel girder due to over-height truck impact 2 Figure 1.2: Typical damage in a prestressed concrete girder due to over-height 3 truck impact Figure 1.3: Example of minor damage of a bridge in UAE 4 Figure 1.4: Example of severe damage of a bridge 4 Figure 2.1: Definition of bridge parts 10 Figure 2.2: Slab-on-girder bridge cross-section 11 Figure 2.3: Examples of slab-on-girder bridges 12 Figure 2.4: AASHTO s HL-93 live load 13 Figure 2.5: Design truck in AASHTO s LRFD Specification (2007) 13 Figure 2.6: Dubai Metro Bridge in Rashidiya, Dubai, UAE 18 Figure 2.7: Overpass on the Bypass Road, Sharjah, UAE 19 Figure 2.8: Bridge on One of the industrial Roads, Sharjah, UAE 20 Figure 2.9: Exterior Girder in the 10 th Street Bridge on the Interstate Route 95 in 23 Delaware Damaged Due to an Over-Height Vehicular Collision Figure 2.10: Bedi s suggested idealization of a cross-section of a damaged bridge 24 girder Figure 2.11: Brackmann s suggested damaged cross-section 24 Figure 3.1: Chung and Sotelino models 30 Figure 3.2: Summary of finite element model 32 Figure 3.3: Finite element model for 40 m span with 5 girders at m spacing 33 Figure 3.4: Finite element model for 40 m span with 4 girders at 4.5m spacing 34 Figure 3.5: Finite element model for 40 m span with 7 girders at 2.25m spacing 35 Figure 3.6: Contour lines of the flexural stress in the girders for the standard 36 bridge Figure 3.7: Contour lines of the shear stress in the girders for the standard bridge 37 Figure 3.8: Details of the double-girder bridge 39 Figure 3.9: First verification approach deflected shape with flexural stress 40 contour Figure 3.10: Second verification 41 Figure 3.11: Fang et al. (1986) layout of the experimental bridge 42 Figure 4.1: Standard bridge arrangement 45 Figure 4.2: Girder damage idealization 46 Figure 4.3: Damage zones 48 Figure 4.4: Girder layout 49 Figure 4.5: Truck longitudinal position to maximize 50 Figure 4.6: Lanes loading 51 Figure 4.7: Procedure for maximizing load effect in the girders with two lanes 52 loaded Figure 4.8: Flexure GDF versus truck position for one loaded lane 56 Figure 4.9: Flexure GDF versus truck position for two loaded lanes 56 Figure 4.10: Flexure GDF versus truck position for two lane load and 15 o damage 57 Figure 4.11: Flexure GDF versus truck position for two lane load and 30 o damage 57 vi
8 Figure 4.12: Flexure GDF versus truck position for two lane load and 45 o damage 58 Figure 4.13: Flexure GDF summary for the standard bridge in the intact and 58 damaged statuses Figure 4.14: Percentage change in flexure GDF for the standard bridge 59 Figure 4.15: Shear GDF summary for the standard bridge in the intact and 60 damaged statuses Figure 4.16: Percentage change in shear GDF for the standard bridge 60 Figure 5.1: Live load distribution in a girder bridge 63 Figure 5.2: Bridge 1 flexural GDF 64 Figure 5.3: Bridge 1 change in flexural GDF 65 Figure 5.4: Bridge 2 flexural GDF 66 Figure 5.5: Bridge 2 change in flexural GDF 66 Figure 5.6: Bridge 3 flexural GDF 67 Figure 5.7: Bridge 3 change in flexural GDF 67 Figure 5.8: Percentage decrease in the exterior girder flexure GDF (span) 68 Figure 5.9: Percentage increase in the 1 st interior girder flexure GDF (span) 68 Figure 5.10: Bridge 5 flexural GDF 69 Figure 5.11: Bridge 5 change in flexural GDF 69 Figure 5.12: Bridge 4 flexural GDF 70 Figure 5.13: Bridge 4 change in flexural GDF 70 Figure 5.14: Percentage decrease in the exterior girder flexure GDF (girder 71 spacing) Figure 5.15: Percentage increase in the 1 st interior girder flexure GDF (girder 71 spacing) Figure 5.16: Bridge 7 flexural GDF 72 Figure 5.17: Bridge 7 change in flexural GDF 72 Figure 5.18: Bridge 6 flexural GDF 73 Figure 5.19: Bridge 6 change in flexural GDF 74 Figure 5.20: Percentage decrease in the exterior girder flexure GDF (crossbracing) 74 Figure 5.21: Percentage increase in the 1 st interior girder flexure GDF (crossbracing) 75 Figure 5.22: Bridge 8 flexural GDF 75 Figure 5.23: Bridge 8 change in flexural GDF 76 Figure 5.24: Bridge 9 flexural GDF 76 Figure 5.25: Bridge 9 change in flexural GDF 77 Figure 5.26: Percentage decrease in the exterior girder flexure GDF (slab 77 thickness) Figure 5.27: Percentage increase in the 1 st interior girder flexure GDF (slab 78 thickness) Figure 5.28: Bridge 10 flexural GDF 78 Figure 5.29: Bridge 10 change in flexural GDF 79 Figure 5.30: Bridge 11 flexural GDF 80 Figure 5.31: Bridge 11 change in flexural GDF 80 Figure 5.32: Percentage decrease in the exterior girder flexure GDF (slab overhang) 81 vii
9 Figure 5.33: Percentage increase in the 1 st interior girder flexure GDF (slab 81 overhang) Figure 5.34: Increase in 1 st interior girder flexural GDF for = 45 o (span) 84 Figure 5.35: Increase in 1 st interior girder flexural GDF for = 45 o (girder spacing) 84 Figure 5.36: Increase in 1 st interior girder flexural GDF for = 45 o (cross-bracing) 85 Figure 5.37: Increase in 1 st interior girder flexural GDF for = 45 o (slab thickness) 85 Figure 5.38: Increase in 1 st interior girder flexural GDF for = 45 o (over-hang) 86 Figure 5.39: Rate of change in 1 st interior girder flexural GDF for ±20% 87 parameter change Figure 5.40: Bridge 1 Shear GDF 89 Figure 5.41: Bridge 1 change in Shear GDF 90 Figure 5.42: Bridge 5 shear GDF 90 Figure 5.43: Bridge 5 change in shear GDF 91 Figure 5.44: Bridge 4 shear GDF 91 Figure 5.45: Bridge 4 change in shear GDF 92 Figure 5.46: Bridge 7 change in shear GDF 92 Figure 5.47: Bridge 6 change in shear GDF 93 Figure 5.48: Bridge 8 change in shear GDF 93 Figure 5.49: Bridge 9 change in shear GDF 94 Figure 5.50: L.E.I for damaged girder in bridges 2, 1 and 3 (span length) 99 Figure 5.51: L.E.I for damaged girder in bridges 5, 1 and 4 (girders spacing) 99 Figure 5.52: L.E.I for damaged girder in bridges 7, 1 and 6 (cross-bracing spacing) 100 Figure 5.53: L.E.I for damaged girder in bridges 8, 1 and 9 (slab thickness) 101 Figure 5.54: L.E.I for damaged girder in bridges 10, 1 and 11 (slab overhang) 101 Figure 5.55: L.E.I for damaged girder in bridges 2, 1 and 3 (span length) 102 Figure 5.56: L.E.I for damaged girder in bridges 5, 1 and 4 (girders spacing) 103 Figure 5.57: L.E.I for damaged girder in bridges 7, 1 and 6 (cross-bracing spacing) 103 Figure 5.58: L.E.I for damaged girder in bridges 8, 1 and 9 (slab thickness) 104 Figure 5.59: L.E.I for damaged girder in bridges 10, 1 and 11 (slab overhang) 104 viii
10 LIST OF TABLES Table 3.1: Chung and Sotelino (2006) Finite Element Models 29 Table 3.2: Summary of the finite element model 32 Table 3.3: Sample comparison between Fang et al. (1986) field experiment results 43 and ANSYS model results Table 4.1: Parameters of bridges considered in the study 45 Table 4.2: Damage levels considered 47 Table 4.3: AASHTO LRDF 2007 Multiple Presence Factors 50 Table 4.4: Standard bridge girder cross-section 53 Table 4.5: Flexural stress at the girder bottom flange, standard bridge and one lane 54 loaded Table 4.6: Flexure GDF of the girders, standard bridge and one lane loaded 54 Table 4.7: Flexural stress at the girder bottom flange, standard bridge, and two lanes 55 loaded Table 4.8: Flexure GDF of the girders, standard bridge and two lanes loaded 55 Table 5.1: Percent increase in GDF for the = 30 o damage angle 82 Table 5.2: Percent increase in GDF for the = 45 o damage angle 82 Table 5.3: Summary of % increase in GDF of first interior girder due to bridge 86 geometric parameters at = 45 o Table 5.4: L.E.I for Bridges 2, 1 and 3 (Span Length Parameter) 97 Table 5.5: L.E.I for Bridges 5, 1 and 4 (Girders Spacing Parameter) 97 Table 5.6: L.E.I for Bridges 7, 1 and 6 (Cross-Bracing Spacing Parameter) 97 Table 5.7: L.E.I for Bridges 8, 1 and 9 (Slab Thickness Parameter) 98 Table 5.8: L.E.I for Bridges 10, 1 and 11 (Slab Overhang Width Parameter) 98 ix
11 ACKNOWLEDGEMENTS First, I would like to thank Allah for paving me the way to reach this level of education and accomplish this work. I would like to express my gratitude to my research advisor, Dr. Sami W. Tabsh for his advice, encouragement dedication and continuous support and mentoring. His advanced expertise in structures and bridges specifically combined with a friendly personality made him a great mentor throughout my graduate studies at AUS. I am also very thankful to the members of my committee, Dr. Farid Abed for his advice and recommendations, Dr. Ibrahim Deiab for his extended support and Dr. Samer Barakat for his helpful comments Special thanks to Mr. Aqeel Ahmed for his suggestions and support during the course of the research. I wish to thank my colleagues, friends, and the faculty and staff of the College of Engineering. Finally, saving the best for the last, I will be forever indebted to my family. Without their unyielding support, I would not be standing here. Thank you all x
12 CHAPTER 1 INTRODUCTION 1.1 Introduction A bridge is a structure built to span over a physical obstacle for the purpose of providing passage. Bridges are important part of today s society as they significantly affect economy and commerce. This is being the case, disturbing the traffic along a bridge is critical and unfeasible. Hence, it is a difficult decision to shut down a bridge and reroute traffic, or even close a few traffic lanes of a bridge to perform maintenance or damage repair operation unless alternatives are provided. While it is difficult to measure the long-run economic impact of infrastructure disruptions, the short-term consequences are easy to evaluate and include significant monetary loss associated with detour to both the value of auto travel time and heavy commercial truck travel time for road users, as well as to variable operating costs due to increased travel distance for each. There are various types of damage that a bridge can be subjected to during its lifetime, such as steel corrosion, concrete cracking, concrete spalling, fatigue, and fracture, to name a few. However, this study is concerned with structural damage to the supporting girders of a slab-on-girders bridge due to over-height truck impact, with particular attention to composite steel bridges. Figures 1.1 and 1.2 show respectively 1

13 typical damage in steel and prestressed concrete girder bridges due to over-height vehicle impact. The figures indicate that steel girders absorb the damage through ductile bend and distortion in the web and bottom flange, whereas concrete girders exhibit brittle concrete spalling and cracking in the bottom flange due to the imposed impact. In this context, the decision whether or not a damaged bridge can still hold the load of the traffic safely following damage to its girders is very sensitive. Often, the desire will be to determine the lost capacity or increased loading due to unforeseen redistribution of load in each structural element in order to repair it properly. One of the aims of this study is to determine change in the portion of the live load carried the critical bridge s girders resulting from damages in one of the girders, particularly the exterior one. As slab-onsteel girder bridges are very common structures around the world, this type of bridges is addressed in this study. Fig. 1.1: Typical damage in a steel girder due to over-height truck impact [1] 2
![Fig. 1.2: Typical damage in a prestressed concrete girder due to over-height truck impact [2] 1.2 Problem Statement Transportation is one of the core cost elements of most industries around the world.](/docs-images/90/102831612/images/14-0.jpg "As transportation cost is often based on trip frequency, business owners lean towards using trucks or ships that are tall (high) and over-loaded to utilize a trip to the maximum limit since the")
14 Fig. 1.2: Typical damage in a prestressed concrete girder due to over-height truck impact [2] 1.2 Problem Statement Transportation is one of the core cost elements of most industries around the world. As transportation cost is often based on trip frequency, business owners lean towards using trucks or ships that are tall (high) and over-loaded to utilize a trip to the maximum limit since the vehicle width is difficult to alter. In some countries, such practices have been monitored and legalized to be accommodated on certain roads and navigable waters. However, records have shown that accidents of trucks and ships hitting the bottom of bridges still occur frequently. Lack of caution signs of the maximum allowable height passing under a bridge or careless drivers are the main reasons for such accidents. In some cases, such damage can be minimal and the bridge capacity is retained to a close level to that of the as-built capacity of the bridge. In these cases, the rectification work required can be deferred to a later time or can be done along with the normally planned prevention maintenance regimes. Figure 1.3 shows a posttensioned concrete box girder bridge in the UAE that has experienced minor damage due to an over-height truck scraping the bottom of the bridge. 3
 However, in other cases, such damage can be so severe that they reduce bridge capacity and need to be immediately rectified since")

15 Fig. 1.3: Example of minor damage of a bridge in UAE (photo taken by author) However, in other cases, such damage can be so severe that they reduce bridge capacity and need to be immediately rectified since they drastically decrease the structural safety. Figure 1.4 shows an example of severe damage in a bridge hit by an over-height crane while moving under the bridge. When the damage is severe, it affects the primary load bearing elements and can, in some cases cause collapse especially to non-redundant bridges composed of a few girders. Fig. 1.4: Example of severe damage of a bridge [3] Remedial works on damaged structural elements cannot be carried out unless the effect of the girder damage is clearly quantified. There are two important issues that a bridge engineer needs to consider when determining an action plan for a damaged bridge. 4
16 Firstly, in an over-height vehicle impact, the damaged girder cross-section gets affected and its capacity is accordingly reduced. This results in less capacity in the individual girder and also overall structural system. Secondly and most importantly, the load that used to be carried by the damaged girder gets redistributed due to the change in the relative stiffness of the individual girders in the system. The undamaged girders will have a higher relative stiffness after the impact compared with the damaged girder. These undamaged girders will carry additional live load when this load gets redistributed after the damage has occurred. In other words, the girder distribution factors (GDF) of all of the bridge girders are altered due to the impact. Literature review has shown that there is no available direct or simplified method to determine such GDFs unless using a detailed structural model. Such models are highly involved and time consuming which is not feasible in such emergency incidents for most bridge engineers. The purpose of this study is to reveal the redistribution scheme of load among the bridge composite steel girders when a girder is damaged by over-height truck impact. More importantly, it has been proven that relying on damaged girder cross-section geometrical properties to evaluate the load carrying capacity after damage overestimates the damaged section capacity [4]. In Ashwani s study, a simply supported, single girder was modeled and analyzed when it was intact and the results were recorded. Damage was introduced gradually in the girder by distorting its web, the damaged girder was analyzed and the results were recorded for each damage level. The moment of inertia of the same girder cross-section was calculated for the intact girder as well as at the different damage levels. The ratio between the damaged girder moment of inertia and the undamaged girder moment of inertia was calculated for the model as well as the theoretical results at the different damage levels. It was found that this ratio decreases as the damage increases however, at a much larger rate for the results obtained from the model relative to those obtained theoretically. This shows that the reduction in the section load carrying capacity for a damaged girder is more than what the theoretical calculation reveal. Hence, relying only on the damaged girder cross-section geometrical properties to evaluate the load carrying capacity of a damaged girder overestimates the damaged section capacity. This study quantifies the effect of different damage levels to an exterior girder on the load-carrying capacity of a composite steel girder bridge. It addresses the reduced 5
17 capacity of the damaged girder and the redistribution of the live load among the other undamaged girders within the bridge for the different damage levels. To generalize the findings, different bridge parameters are examined such as span length, girder spacing, cross-bracing spacing, and deck slab thickness. 1.3 Objective and Scope The objectives for this research study are to: 1. Investigate the effect of damage due to over-height truck impact in the exterior steel girder and/or cross-bracing system on the behavior of composite steel girder bridge systems subjected to live load. 2. Quantify the effects of the span length, number of girders/girder spacing, deck slab thickness, deck slab overhang width, spacing of cross-bracing on the response of damaged steel girder bridges. 3. Relate the reduction in the load-carrying capacity of a damaged bridge girder to the redistributed live load in the girder following an over-height truck impact. The scope of the study addresses only composite steel girder bridges since noncomposite bridges are rarely used in practice. Such composite action is often achieved through the use of shear studs welded to the top flange of the steel girder and embedded in the concrete deck. Only short and medium length, simply-supported bridges with span lengths up to 75 m are considered. Various levels of minor damage to the bottom of the steel girders are considered at a specified location along the bridge; other part of the steel girder is assumed to remain undamaged. Such damage represents the practical scenario of bridges struck by over-height truck impact. The investigated bridge parameters are span lengths (range from 20 m to 60 m), girder spacing (range from 2.25 m to 4.5 m), presence of cross bracing and their spacing (range from no cross-bracing to 5 m spacing), deck slab thickness (range from 180 mm to 260 mm) and slab cantilever width (range from 0.75m to 2.0m). Different live load scenarios will be considered to maximize load effect for both damaged and intact sections, including single and multiple trucks. The analysis is carried out using the commercial finite element software ANSYS Release 13 [5]. A parametric study of the obtained result is performed to understand the effect of the above 6
18 bridge parameters on the redistribution of the live load in the case of over-height trucks impact one of the bridge composite girders. 1.4 Approach In this study, the finite element method is utilized to model and analyze the considered intact and damaged steel girder bridge systems. The software ANSYS is used to develop and analyze the models with different damage levels and for the different bridge parameters. The finite element model was validated against experimental results on a model bridge from the published literature. Following the common practice, all analyses are conducted in the linearly-elastic range. Three-dimensional solid elements are used to model the concrete deck slab, while shell elements are used to model the steel girder top and bottom flanges and web. The cross bracings (or diaphragms) are modeled by beam elements. The imposed AASHTO truck load is directly applied as point loads on the deck slab. The longitudinal location of the truck on the bridge is governed by the respective load effect under consideration. For flexure, the middle axle of the truck is located at mid-span, which is the location of the maximum flexural load effect. For shear, the truck s rear axle is located just off the girder support. In the transverse direction, one and two truck were considered starting from one edge of the bridge, closest to the parapet and moving toward the other edge in an incremental manner to capture the maximum load effect in the bridge girders. This approach is performed for all intact and damaged bridges and the results are recorded. The results are then analyzed and compared, and final conclusions with practical implications are drawn. 1.5 Thesis Organization This thesis is organized into seven chapters. This chapter provides an introduction to the subject matter, outlines the motivation behind the study, and summarizes the objectives, scope and approach followed in the research. Chapter 2 gathers the required background on live load distribution in slab-ongirders bridges gives information on the concept of girder distribution factors. The literature review on the common bridge damages, with particular emphasis on overheight truck impact on low-clearance bridges, is also summarized in this chapter. 7
19 Chapter 3 gives the background on the finite element method and sheds light on finite element modeling for girder bridges in general. It further details and presents the validation of the computational modeling scheme considered for this study. Chapter 4 outlines the methodology through which the scope of the study is accomplished. It details the bridges and the damage scenarios that are considered, as well as identification of the critical girders and the critical live load (AASHTO truck) configuration. Chapter 5 presents girder distribution factor (GDF) results obtained from finite element model, the redistributed live load and the decreased capacity of the damaged girder. This is done for the five bridge parameters considered for the different damage levels. A parametric study is conducted to determine the influence of the five bridge parameters on the redistributed live load in the damaged bridge. It further presents relationships that can be used to obtain the decrease in the damaged girder capacity and the increase in the undamaged girders GDF for different bridge geometries and damage severity. Finally, Chapter 6 provides a summary of the results obtained and outlines conclusions based on the findings. It further presents recommendations for new research ideas on the subject that can be investigated in the future. 8
20 CHAPTER 2 BACKGROUND AND LITRATURE REVIEW 2.1 Introduction This chapter discusses the different types of bridge structures with particular emphasis on slab-on-girder. It further provides an overview about composite steel bridges and its main components. A summary on the AASHTO LRFD live load models is also included. Three main live load distribution methods are presented ranging from the simplest, straightforward method to the highly involving and most accurate methods. The latest AASHTO LRFD live load distribution methods are highlighted with details to facilitate understanding the subsequent chapters of the thesis. 2.2 Types of Bridges In general, bridges are composed of two parts: (1) superstructure and (2) substructure, as shown in Fig The superstructure is the portion of the bridge that directly receives and supports the live load, and transfer the reactions to the substructure. It consists of deck slab, sidewalks, parapets, barriers, railings, floor beams and/or girders, 9


21 diaphragms or cross-bracing, expansion joints, wearing surface, signs, utilities and lighting. On the other hand, the substructure is the portion of the bridge that supports the superstructure and transfers the loads to the ground. It includes the bearings, abutments, wing-walls, piers, pile cap and footings, piling and caisson, and pier protection. Fig. 2.1: Definition of bridge parts Bridges can be classified in different ways, according to their function, span length, structural system, structural material, geometry, and superstructure-tosubstructure connection. From a structural engineering point of view, classification according to the structural system is most important. For such a classification, the structural system of highway bridges can be slab, beam/girder, truss, rigid frame, cantilever, arch, suspension or cable stayed. The optimum structural system for a given bridge depends to a large extent on the span length, and to some extent on the available material, cost of labor, topography, and site conditions. For short to medium spans (up to 300 m), experience has shown that slab-on-girder bridges are most favorable due to their cost-effectiveness. The structural form of slab-on-girder structures consists of a thin cast-in-place concrete slab on a number of concrete or steel girders, as shown in Fig The longitudinal girders can be either concrete or steel, I-section or box, composite or noncomposite with the slab. The composite action forms when the girder and concrete slab act together in resisting bending moments [6]. For steel girders, the composite action is generated by means of shear connectors, such as studs, welded on the tope flange of the girders. For concrete girders, the composite action is obtained by extending the vertical stirrups from the web of the girders into the cast-in-place slab. 10
 3D view, (b) cross-section Composite steel girder bridges provide advantages over other")


22 (a) (b) Fig. 2.2: Slab-on-girder bridge (a) 3D view, (b) cross-section Composite steel girder bridges provide advantages over other types in terms of decreased weight, reduced cost, and enhanced performance. They provide superior stiffness to weight ratio; delivering 25-30% reduction in weight compared to other steel beams of similar stiffness and strength. The significant reduction in weight results in less material being used, reduced deflection, and decreased load effects (shear and bending moment) in the structural elements compared to other types of beams. Other adavatnages of steel bridges include their ability to maintain their strength with time, prefabrication, versatility in construction, and recyclability. Their main disadvantages are their need for protection against corrosion, high conductivity of temperature, susceptibility to fatigue and fracture. Figure 2.3 shows examples of slab-on-girder bridges. 11

; closer spacing is used in curved bridges than in straight bridges. 2.")
23 (a) Concrete girders (b) Steel girders Figure 2.3: Examples of slab-on-girder bridges [7] Diaphragms or cross-bracing are usually provided between the steel girders to give lateral stability for the girders, especially during construction. They further enhance the distribution of live load among the girders. Lateral bracing is placed at discrete distances along the span of the bridge ( mm); closer spacing is used in curved bridges than in straight bridges. 2.3 AASHTO LRFD Live Load The live load in the AASHTO LRFD Bridge Design Specification (AASHTO 2007) includes both truck and lane loads. The design live load is designated as HL-93 and includes a design truck or tandem (whichever governs) plus a uniformly distributed design lane load, as shown in Figs. 2.4a and 2.4b. The design truck load governs over the design tandem for spans greater than 12 m. The specification allows the use of two trucks in the lane, at a 15 m minimum distance between the trucks, plus the uniform lane load at a 10% reduction in intensity for determining the negative moment effect in the girders between the inflection points along the bridge, as shown in Fig. 2.4c. The live load is assumed to occupy a space of 3000 mm within a 3600 mm wide lane in the transverse direction, as shown in Fig The gross design truck weight is 325 kn, and is placed longitudinally over the bridge with the aid of influence lines to maximize the load effect. The design tandem consists of a pair of 110,000 N axles that are 1200 mm apart. AASHTO further requires magnifying the truck and tandem loads by 33% to allow for the dynamic load component. The design lane load is 3000 mm wide and has an 12
 when designing the deck slab, and 600 mm when designing other structural elements.")
24 35 kn 145 kn 145 kn 35 kn 145 kn 145 kn intensity of 9300 N/m. This is applied simultaneously with the truck and tandem loads. According to AASHTO, a truck wheel shall be at least 300 mm away from the parapet edge (in the reansverse direction) when designing the deck slab, and 600 mm when designing other structural elements. However, the minimum distance between the truck wheel and the design lane edge is 600 mm, noting that the standard lane width of 3600mm shall not be compromised. 35 kn 145 kn 145 kn 110 kn 110 kn 4300mm 4300 to 9000mm 1200mm 9.3 N/mm 9.3 N/mm (a) Truck plus Lane (b) Tandem plus Lane 0.90 x 15000mm MIN 9.3 N/mm (c) For Negative Moment in continuous bridges Figure 2.4: AASHTO s HL-93 live load (AASHTO 2007) Figure 2.5: Design truck in AASHTO s LRFD Specification (2007) 13
25 2.4 Methods for Live Load Distribution Truck load is usually applied as point loads that correspond to the wheels configuration. The point loads are applied on the deck slab that distributes the load to the girders. Bridge live load is analyzed through two main methods, of which one is simple and the other complicated. The simple method comprises formulas that estimate the share of each girder from the truck wheel laterally, called girder distribution factors. AASHTO LRFD Bridge Design Specification allows using such methods for design purposes as they provide conservative estimates. However, this method is not very accurate for research purposes. The most accurate method involves detailed modeling and analysis of the bridge with the help of advanced methods of structural analysis. This includes two or three dimensional finite element modeling, which often yield accurate results. However, this approach is time consuming and computationally involving; besides, the results are highly sensitive to the type of elements used, mesh size and nature of connectivity. With the current advancement computer technology and processing capabilities, this method is becoming more popular and practical. In general, as the size of elements is decreased and number of nodes increased, more accurate results can be obtained. For bridge live load analysis application, it s noted that the critical transverse location of the truck(s) cannot be determined without a number of trials. However, this method is recommended in the case of unusual bridge geometry, such as sharp skewness and large curvature, and when easier methods cannot be utilized due to the constraints imposed on their use by the specification. 2.5 The AASHTO LRFD Live Load Distribution Method For slab-on-girder bridges, the live load distribution factor in the old AASHTO s Standard Specification for Highway Bridges (1996) was based on dividing the girder spacing by a constant that is dependent on the type of the bridge. Experience has shown that this approach results in conservative designs, especially for bridges having small girder spacing. Hence, a more accurate method to compute the live-load distribution factor based on more accurate analyses was required. In the past decade, new equations 14
26 were developed as a result of research by the National Cooperative Highway Research Program (NCHRP) Project [8]. The developed equations used several additional parameters beyond the girder spacing to more accurately represent the distribution factors [9] and became part of AASHTO s LRFD Bridge Design Specification (2007). In AASHTO s LRFD specification (2007), a more accurate distribution factor is used than that in the standard specification. It involves relatively complicated equations but with better accuracy [10]. It computes the percentage of live load carried by each of the bridge girder taking into consideration number of secondary factors such as the girder spacing, stiffness of the girders, span length and deck slab thickness. Recent attempts to simplify these equations while maintaining a similar level of accuracy have not been successful. For design purposes, to determine the fraction of live-load carried by an individual girder within a bridge system, several steps must be followed. The first step involves computing the design live load effect (shear or bending moment) caused by the HL-93 loading in a single lane. The longitudinal positioning of live load that results in the maximum live load effect can be obtained with the help of influence lines. The design moment or shear in a single girder within the bridge system is then obtained by multiplying the maximum live load effect per lane by the live-load distribution factor. Note that the live load distribution factor is defined as the fraction of live load in a single lane that is carried by an individual girder. Unlike the S/D equation in the Standard AASHTO Specification, the distribution factor specified in the AASHTO LRFD approach is computationally more involved. According to the AASHTO LRFD method, the flexure girder distribution factor for an interior girder in a slab-on-girder bridge is given by: For one lane of live load: 2.1 For two or more lanes of live load: 2.2 where S is girder spacing (mm), L is span length (mm), K g = n(i+ae 2 ) is longitudinal stiffness factor (mm 4 ), t s is slab thickness (mm), n is modular ratio between the materials 15
27 of the girder and the slab, I is girder moment of inertia (mm 4 ), A is girder cross-sectional area (mm 2 ), and e is eccentricity between centroids of bare girder and deck slab (mm). Likewise, the girder distribution factor for the shear limit state for an interior girder in a slab-on-girder bridge is given by: For one lane of live load: 2.3 For two or more lanes of live load: 2.4 The above expressions are used to estimate the interior girders girder distribution factors. For exterior girders, the following expression is used: 2.5 where 2.6 Note that the above expressions represent common bridges with usual geometries. For bridges with 3 girders, the lever rule shall be used. Also, for bridges with diaphragms or cross-bracing, the girder distribution factor for an exterior girder shall be checked against the rigid body rotation concept (AASHTO 2007). There are modification factors in the AASHTO specification to account for the skewness effect. 2.6 Bridge Damage Even with posted signs on available under-bridge clearance, highway bridges on highways are subject to the danger of being hit by over-height trucks. Combined with such truck mass, the high speeds produce huge momentum that can bend or even destroy some of the bridges girders if over-height trucks strike them. Compared to concrete girders, steel girders are more problematic on the long run when over-height vehicle 16
28 collision is concerned. A concrete girder might get scrapes due to over-height vehicle collision. If the collision momentum was big enough, the concrete girder (being brittle) will most probably show noticeable loss in the cross-section. Unlike concrete girders, steel girders deform under hard over-height vehicle collision as they are less brittle. This results in moment of inertia and capacity reduction, even without any section loss. The load used to be carried by the damaged girder before getting hit by a truck reduces and gets transferred mostly to the closest girder to it; thus, increasing its load-to-capacity ratio. To study the seriousness of over-height trucks hitting highway bridges at the Maryland, US, a study was conducted on the available statistics on such collision accidents [11]. The study revealed that in a period of 5 years, the frequency of overheight trucks collisions with bridges increased by 81% since The study also showed that 4% of the affected bridges required immediate repairs. This serious problem has prompted some states in the United States to raise the bridge vertical under-clearance, despite being within the recommended vertical clearance limits. Other states planned to increase the number of warning signs that post the vertical clearance limit. New York State bridges also found to suffer around 200 vehicle impact a year. It was established that the third leading cause of bridge collapse is over height vehicle or ship collision with a bridge. According to Agrawal and Chen [12], this was a result of improper loading of a vehicle, ignorance or lack of attention to maximum vehicle height posts, etc. Likewise, Martin and Mitchell [13] further rationale over-height vehicle collision with bridges to drivers not being aware of their vehicle height, lack of alternative routes for roads passing under bridges with insufficient vertical clearance, and lack of signage posting maximum allowable vertical clearance. Appendix A shows examples of bridges damaged by over-height vehicle collision. In 1990, a University of Kentucky study researched bridge failures in the US since 1950 found that 14% of bridge failure incidents were contributed by over-height vehicle collision [12]. Michigan DOT recorded 36% increase in over-height vehicle collisions in 1988 [14]. Increase in the number of bridge damages caused by over-height vehicle collision was noted in Mississippi State Highway Department [15]. Texas DOT also noted a rise in the number of over-height vehicle collision with bridges [16]. As a 17
, Moderate (defined as noticeable concentrated cracks, spalls, etc) and Severe (defined as significant section loss,")

29 result, Texas DOT developed a scheme to evaluate the degree of damage by describing the damage visually. The damage was classified as Minor (defined as isolated cracks, scrapes, etc), Moderate (defined as noticeable concentrated cracks, spalls, etc) and Severe (defined as significant section loss, lateral misalignment of member, etc). It was expected that records on over-height vehicle collision with bridges would not be available for countries like the UAE, as such incidents might be rare since most bridges in the country are relatively new and constructed with ample vertical clearance according to the specification. A limited field observation in Dubai and Sharjah has revealed that such accidents have happened recently in the cities with an increasing frequency. Figures 2.6, 2.7 and 2.8 show some examples of the observed over-height vehicle collision with concrete bridges in the UAE. Although the limited local study showed that the extent of the damage in these examples is minimal, it was observed that repair work was not carried out on the affected bridges. (a) Figure 2.6: Dubai Metro Bridge in Rashidiya, Dubai, UAE (photos taken by author) (b) 18
 (d) The common concern in the literature")

![incident [12].](/docs-images/90/102831612/images/30-2.jpg "Sennah and others [17] have tested a damaged prestressed concrete girder recovered from a bridge struck by an")

30 (a) (b) (c) Figure 2.7: Overpass on the Bypass Road, Sharjah, UAE (photos taken by author) (d) The common concern in the literature regarding over-height vehicle collision with bridges is the lack of certainty on the retained capacity of the damaged structural elements and the load redistribution pattern in the undamaged elements after a collision incident [12]. Sennah and others [17] have tested a damaged prestressed concrete girder recovered from a bridge struck by an over-height truck in the province of Ontario. It was noticed that tensional-shear cracks were highly present between the quarter points of the damaged girder. Predicting the behavior of a prestressed concrete girder under a lateral impact explains such observation. Moreover, it was established that the damaged girder did not lose much of its flexure capacity due to the minor damage sustained by the girder. 19
 (d) Russo, Klaiber and Wipf [18] as well as Kim, Green and Wight [19] have modeled different prestressed concrete")


31 (a) (b)\ (c) Figure 2.8: Bridge on One of the industrial Roads, Sharjah, UAE (photos taken by author) (d) Russo, Klaiber and Wipf [18] as well as Kim, Green and Wight [19] have modeled different prestressed concrete girder bridges to investigate the stress due to live and dead load redistribution and deflection of the bridges in the undamaged and damaged phases under different loading schemes. Russo, Klaiber and Wipf concluded that the undamaged state live load distribution pattern is restored by replacing the damaged beams in the bridge. Once again, such a conclusion considerably depends on the type of bridge and extent of damage. Significant portion of bridges along expressways have been constructed from prestressed concrete beam bridges in the early construction time in Korea [20]. Several damages have been noted such as strength decrease, surface deterioration, and cracks. It is worth mentioning that some of these damages are due to over-height trucks impacts. There are a number of repair and retrofit methods to secure such the stability of such bridges and restore their capacity, including the use of external prestressing and steel plate or composite wraps attachment. Lee, Park, Lee and Kim investigated the effects of 20
32 such repair and retrofit works on the structural behavior of bridges and concluded that to the support conditions of the structure greatly affect the structural response. Sharma, Hurlebaus and Gardoni [21] addressed the possibility to fabricate a bridge bumper that absorbs most of the impact energy resulting from over-height trucks striking reinforced concrete bridge girders. A small-scale bridge bumper has been produced in the lab and a finite element model has been developed and analyzed. The study proposed executing a full-scale bridge bumper to further investigate the feasibility of such an approach in practice. In an early study, statistics over a 5-year period showed that among the 50 states in the US, 33 of them had a total of 815 damaged steel bridges [22]. Ninety-four percent of these damaged bridges were hit by over-height trucks. Records show that most of these bridges were either steel girder or truss bridges. Shanafelt and Horn s study lists and evaluates the effectiveness of existing practices for assessment of damage in such bridges. During a strike event, the steel girder dissipates the hitting (kinetic) energy by deforming plastically in the form of twisted or bent bottom flange or even steel girder web. In the presence of diaphragms or cross-bracing, these elements might also experience plastic buckling as well [23]. The structural damage to the girders varies from small bends in the flanges to total destruction of the girder. Depending on the level of damage, the common repair strategies for such accidents are to do nothing, repair the locally damaged girder, replace the damaged girder, or total replacement of the bridge [1]. As cost of such work is extremely high, it s crucial to know when to consider damage as negligible and when repair works shall be done. More importantly, the question is when can a bridge remain in service while repair works are carried out simultaneously? In order to make such judgment, the retained structural capacity of the damaged bridge shall be determined and compared to the redistributed stresses. However, this forms a serious challenge to bridge engineers due to the complexity of the problem [23]. The presence of cross bracing or diaphragms in steel multi-girder bridges plays a major role in the redistribution of load following damage to the exterior girder, as noted by Lenox and Kostem [24]. The lateral bracing role is even more significant in the case of two-girder steel bridges, as reported by Park et. al [25], due to the fact that the load is 21
33 often redistributed away from the damaged girder to the undamaged one. On the same subject, Shenton et al. [1] developed a procedure that assumes that the damage caused by vehicle impact produces a change in geometry to the cross section along the length of the member. The procedure assumes that the top flange of the member would still be constrained by the deck, and the capacity of the damaged girder is evaluated as if it were designed to have a varying cross-section along its length. The maximum member forces are calculated at the different locations along the bridge for the rating vehicles based on the geometry of the resulting cross-section. Literature and statistical information has minimal record on the mode of damage in girders struck by over-height vehicles. Few studies recorded the mode of damage in such accidents such as the study conducted on the 10 th Street Bridge on the Interstate Route 95 in the state of Delaware in the United States [1]. In this case, an over-height vehicle hit the bottom of the exterior composite steel girder. The girder was bent about the web while the flange suffered minor buckling. One of the diaphragms was almost separated from the girder. The above damage is shown in figure 2.9. The figure shows that the girder is locally bent about the web along the span of the girder, within the middle-third of the span length. The same study recommends evaluating the retained capacity in the damaged girder by calculating second moment of inertia for the deformed cross-section and establishing the new capacity accordingly. However, it was proven by Bedi [26] that the reduction in the actual section load carrying capacity for a damaged girder is almost double the reduction obtained by computing the modified cross-section properties. Hence, relying on damaged girder cross-section geometrical properties to evaluate the load carrying capacity after damage overestimates the structural capacity of the damaged section. 22

![[27] suggested modeling a composite steel bridge system that has been damaged by an over-height vehicle collision using a finite element model by completely omitting the damaged girder(s) regardless](/docs-images/90/102831612/images/34-1.jpg "of the extent of the damage. Such an approach is very conservative and does not reflect a realistic scenario for two reasons.")
34 (a) (b) Figure 2.9: Exterior Girder in the 10 th Street Bridge on the Interstate Route 95 in Delaware Damaged Due to an Over-Height Vehicular Collision [1] In their study on bridge redundancy, Frangopol and Nakib [27] suggested modeling a composite steel bridge system that has been damaged by an over-height vehicle collision using a finite element model by completely omitting the damaged girder(s) regardless of the extent of the damage. Such an approach is very conservative and does not reflect a realistic scenario for two reasons. Firstly, literature has shown that in most composite steel bridges when subjected to an over-height vehicle collision- tend to dissipate the impact in the form of deformation in the girders. Secondly, the Frangopol and Nakib proposed methodology will most likely result in drastic reduction in bridge capacity to the extent that the bridge would not be able to carry much load beyond its self weight, especially when the damage affects more than one girder. However, most research and field observations have shown that the majority of over-height vehicle collisions with bridge accidents do not reduce the capacity of the bridge to that extent. A more realistic approach is presented by Bedi [26] to model a damaged girder in a bridge. Bedi suggested that the damage can be idealized by a lateral deformation in the bottom half of the web of a composite girder with a certain angel of twist around an axis along the span of the girder and positioned at the middle of its depth. This damage is assumed to be confined within the middle one-third of the span of the girder, which represents the most probable position of a truck under the bridge. The value of the twist angle represents the intensity of the damage. Figure 2.10 shows the idealization of the damaged girder. 23
35 Figure 2.10: Bedi s suggested idealization of a cross-section of a damaged bridge girder Brackmann [28] suggested a similar approach to model a bridge girder damaged by an over-height vehicle collision. However, Brackmann considered a lower level of damage, compared to Bedi, by confining the damage to within one-half of the bottom flange only. Figure 2.11 idealizes Brackmann s suggested mode of damage, where the value of the angle represents the intensity of the damage. This model was employed by the author to analyze a damaged wide flange steel beam using the finite element program ANSYS. Verification of the computer model was carried out using a 3-point bend test on a 1.8-m long steel wide-flange beam instrumented with strain gauges in the laboratory. Figure 2.11: Brackmann s suggested damaged cross-section [28] 24
36 It was also observed that the mode of damage in girders damaged by over-height vehicle collision takes a form similar to the form suggested by Bedi. Appendix A contains various bridges that are damaged by over-height vehicle collision. In summary, the literature review reveals that over-height vehicle collision with bridges is not only one of the main reasons behind bridge damages but also increasing over the last 20 years. Researchers and transportation authorities and departments recorded increasing rates of such incidents especially in the Unites States and some European cities. However, this study quantifies the effect of the damage due to an overheight vehicle collision on the structural behavior of the bridge system as this was neither addressed nor investigated in the available literature. 25
37 CHAPTER 3 FINITE ELEMENT MODELING 3.1 Introduction This chapter explores the finite element theory by presenting its basic steps. It gives a background on the commonly used element types, formulation and connectivity. Available finite element modeling of steel girder bridges is presented through the published literature on the subject. Models utilizing linearly-elastic materials and static loads are considered since it is a common practice to consider such behavior for bridges subjected to live loads. The accuracy of the various considered models are presented and compared. The chapter also presents details of the finite element model chosen to analyze the bridges considered in the study, with validation of its accuracy. The validation consists of three key components; a small scale experimentally tested bridge, a damaged girder, and a full-scale field experiment bridge. 3.2 Finite Element Theory Finite Element Analysis (FEA) was first introduced by Courant in 1943, who combined the Ritz method of numerical analysis with minimization of variational calculus to obtain approximate solutions to vibration problems [29]. Thereafter, a study published by Turner, Clough, Martin, and Topp [30] established a broader definition of this approach with focus on computations of stiffness and deflection of complex 26
38 structures. By the early 1970s, FEA was limited to expensive mainframe computers generally owned by large industries. Since the rapid decline in the cost of computers and the significant increase in computing power in recent years, FEA has been developed to a high level of accuracy. Nowadays, computers are able to produce accurate results for all kinds of structures in short time. The basic background and formulation of the finite element method have been documented by Clough [31]. When a complex structural system cannot be solved to a desired level of accuracy by manual or approximate methods of analysis, more sophisticated yet adoptable methods such as Finite Element Method are essential. This method involves sub-dividing the structural system into a number of elements, interconnected at the nodes. These discrete finite elements are chosen to accurately reflect the behavior of the actual structure. In practice, there are different types of finite elements such as shell, solid, and line elements. Each type has further divisions depending on the structural behavior under consideration. The choice of the type and number of elements greatly affects the convergence of the results. The finite elements displacement status is defined by nodal displacement functions that are compatible with the type of element type used. The relationships between stress and both displacement and strain are necessary to come up with a global stiffness matrix that can be then assembled, and boundary conditions can be introduced for the entire structural system. Like any other structural problems, the equilibrium equations of the finite elements are solved simultaneously for nodal displacements and rotations. Nodal solutions are then utilized to come up with the elements strains that are used to calculate the stresses in the finite elements using the basic stress-strain relationships of the material. Generally, higher accuracy can be achieved by increasing the number of elements but this in turn increases the number of equilibrium equations to be solved, which adds to the computation time. The elements aspect ratio is recommended to be kept close to one in order to enhance the accuracy of the results. Large commercially available computer software, such as ANSYS and ABAQUS, facilitate the highly computational-intensive analysis. However, without accurate modeling of the given problem the results would be questionable at best. 27
39 In this study, all bridges are analyzed using the finite-element computer program ANSYS [5] available in the college of engineering at AUS. It is a general-purpose software that can be used to analyze a variety of problems in many fields of engineering, including structural, mechanical, fluid, thermal, electromagnetic, and heat transfer. In the structural engineering field, the program has the capability of performing linear, nonlinear, buckling, static, or dynamic analysis. 3.3 Finite Element Modeling of Bridges For accurate modeling of bridges by finite elements, the behavior of the structure as well as the finite elements available in the software shall be well understood by the user. This study will analyze the girder bridges as three-dimensional systems. Different approaches could be used to model the subject structure. The simplest finite element approach to model the superstructure of a bridge is to use shell elements for the deck slab and beam elements for the girders. Bishara [32] considered three-node triangular thin plate elements for the concrete deck slab, rigidly connected to the top flange of the steel girders. Tabsh and Sahajwani [33] and Tabsh and Tabatabai [34] considered the same approach to model the girders; however, they used four-node rectangular shell elements to model the deck slab. In both models, beam elements were considered for the top and bottom flanges while shell elements were utilized for the web of the supporting I-girders. Mabsout [10] considered four-node shell elements for the girders and solid brick elements for the deck slab. Similarly, Eamon and Nowak [35] modeled the deck slab by solid elements; however, beam elements were used to model the whole girders at their centroids, with rigid elements linking the deck slab to the beams. Rigid links have been used extensively by researchers to model the composite action between the deck slab and the supporting girders. From published research, it can be concluded that the deck slab can be adequately modeled either by shell or 3D solid elements. According to Chung and Sotelino (2006), the transverse shear deformation may be neglected in finite element analysis of bridges with span length to depth ratios up to 150. In their comparative study, Chung and Sotelino investigated four approaches to model steel bridge girders, as shown Table 3.1 and Fig In all cases, the deck slab was modeled by rectangular shell elements. 28
40 Table 3.1: Chung and Sotelino [36] Finite Element Models Girders Model Web Flange M1 Shell Elements Shell Elements M2 Shell Elements Beam Elements M3 Beam Elements Shell Elements M4 Beam Element In model M1, the flanges and the web were modeled by shell elements. Similarly, model M2 considers shell elements for the web but beam elements for both flanges. Model M3 considers a beam element for the web and shell elements for the flanges. Model M4 is considered the simplest model, when compared with the previous models, as it utilizes beam elements for the whole girders, lumped at the centroid. Although model M4 require less computational effort, such an approach limits the choice for varying material properties between the web and the flanges. Chung and Sotelino (2006) found out that models M1 and M2 provide more accurate results on local behavior; however, they require considerable meshing efforts to converge to a reasonably accurate solution. Unlike models M1 and M2, models M3 and M4 results vary by less than 1% from the analytical solution regardless of the mesh used. In conclusion, models M1 is preferable as the study concentrates on the local behavior, not on the global response. 29
41 (a) (b) (c) (d) Figure 3.1: Chung and Sotelino models [36]: (a) Girder model M1, (b) Girder model M2, (c) Girder model M3, and (d) Girder model M4. 30
42 Based on this, a model similar to model M1 will be used for this study where four-node shell elements will be utilized for the steel girder web and flanges. ANSYS four-node rectangular shell element, SHELL63, will be used to model both the girder web and flanges. ANSYS SHELL63 is suitable for this application as it has membrane and both in-plane and out of plane bending capabilities. Each of its 4 nodes has six DOF; three translational and three rotational. The steel material of the girder has a modulus of elasticity of 200,000 MPa and Poisson ratio of 0.3. For the most part, the finite elements aspect ratio is kept below 1.5. As mentioned earlier, the deck slab can be modeled using plate, shell or solid elements. However, using shell elements introduces an offset between the centroid of the slab and the girder s top flange; thus, requiring rigid links connection between the two elements. The disadvantage of using rigid links within the model lies in the introduction of points of concentration of stresses within the deck slab. To avoid the use of rigid links, solid elements can be utilized to model the bridge slab. When comparing FEA models involving shell elements with solid elements in the slab, Sahajwani [37] concluded that both four-node shell elements with membrane and bending actions and eight-node solid elements can be used to model the deck slab since they yield similar results and level of accuracy (less than 1%). Accordingly, ANSYS SOLID45 is used to model the deck slab with three translational DOF for each of its eight nodes. This element has high stress and strain capabilities besides being suitable for 3D modeling. The defined concrete deck had a modulus of elasticity of 25,000 MPa and poisson ratio of 0.2, which are typical values in highway bridges. The value of the modulus of elasticity of concrete corresponds to a nominal compressive strength equal to about 30 MPa. To achieve the composite action between the deck slab and steel girders, the top flange of the girder is attached to the bottom surface of the deck slab at three nodes in the transverse direction of the bridge (i.e., these nodes have the same strains at the interface) The crossbracing is composed of single angles, and is modeled by three dimensional beam elements using the same material as the girders. A summary of the employed finite element model is provided in Fig. 3.2 and Table 3.2. As the considered bridges are simply supported, translations at both ends of the bridges are restricted except for the translation along the span at one end of the bridges. 31
43 This is done to reflect a realistic boundary condition of the structural system, composed of rollers at one end and pins at the other. Figure 3.3 shows a complete assembled finite element model created in ANSYS for a 40 m simply-supported bridge with five girders spaced at m. Bridges with four and seven girders spaced at 4.5 m and 2.25 m, respectively, are shown in Fig. 3.4 and Fig Those models and others will be used later in this thesis to investigate the behavior of damaged bridges and compare it with the response of intact bridges. Figures 3.6 and 3.7 represent contour lines for the flexural stress and shear stress in the standard bridge and for the shown trucks position, respectively. Figure 3.2: Summary of finite element model Table 3.2: Summary of the finite element model Bridge Element ANSYS Element Number of Nodes Per Element DOF Per Node Slab SOLID45 Eight 3 Translational Girder Flanges 3 Translational SHELL63 Four Girder Web 3 Rotational Diaphragms BEAM188 Two 3 Translational 32
44 Figure 3.3: Finite element model for 40 m span with 5 girders at m spacing 33

45 Figure 3.4: Finite element model for 40 m span with 4 girders at 4.5m spacing 34
46 Figure 3.5: Finite element model for 40 m span with 7 girders at 2.25m spacing 35

47 Figure 3.6: Contour lines of the flexural stress in the girders for the standard bridge 36

48 Figure 3.7: Contour lines of the shear stress in the girders for the standard bridge 37
49 The live load that is represented by the truck wheel load is idealized by a concentrated load for each wheel applied at the nodes. As the aim of this study is mainly the computation of the girder distribution factor (GDF) for shear and moment, trucks are positioned transversely and longitudinally in such a way to maximize load effect in a particular girder. Accordingly, if a wheel load location corresponding to a critical truck position does not coincide with a node, it s distributed on the closest four nodes in such a way that the summation of the four forces are statically equivalent to the wheel load. This approach has been utilized in a number of studies including the published work by Mourad and Tabsh [38]. 3.4 Model Verification In this section, the finite element model is verified to ensure its accuracy. The model utilized for this study has been proven to be accurate in various past studies, as elaborated in Section 3.3 earlier. However, verifying the model accuracy further is another check point to assure that the obtained results are accurate and sound. In this study, the verification consists of three different approaches including a small scale model bridge, a damaged girder, and a full scale field experiment bridge. A small scale bridge is developed using the previously described finite element model in ANSYS to compare its results with the theoretical calculations. The bridge has a 10 m simply-supported span, and consisting of twin steel girders compositely attached to a concrete slab. The deck slab concrete has a modulus of elasticity of 25,000 MPa and the steel girders have a modulus of elasticity of 200,000 MPa. Further details on the modeled bridge are shown in Fig The bridge is first analyzed under the application of a uniform pressure of MPa that is vertically applied downward on the entire deck slab. The tensile stress at the bottom flange and the maximum deflection are obtained both by theoretical beam theory calculations and the finite element model. The obtained bottom flange tensile stress was 4.12 MPa through theoretical calculations using the equation =Mc/I, while it was 4.13 MPa as extracted from ANSYS with a relative error of 0.24%. Furthermore, the maximum vertical deflection in the bridge was mm through theoretical calculations using the conjugate beam method, while it was mm as extracted from ANSYS with a relative error of 8%. The error in deflection could have 38
50 been reduced with the use of finer finite element mesh, but this was not done. The support reactions obtained from ANSYS were also verified using statics. The deformed shape and longitudinal flexural stress contour lines are shown in Fig Figure 3.8: Details of the double-girder bridge The bridge is then tested under two concentrated loads of 1.2 MN each in the direction of gravity. The point loads were applied on the bridge deck at the centerline of each girder transversely and at the bridge mid-span longitudinally. Again, the tensile stress at the bottom flange and the maximum deflection are obtained both by theoretical calculations and the finite element model. The bottom flange tensile stress was 137 MPa through theoretical calculations while it was 131 MPa as extracted from ANSYS with a relative error of 4.5%. The maximum vertical deflection in the bridge was 9.67 mm through theoretical calculations, while it was mm as extracted from ANSYS with a relative error of 6%. In summary, the first verification approach yielded reasonable errors, which was a good indication on the validity of the finite element model. 39

51 Figure 3.9: First verification approach deflected shape with flexural stress contour As the subject study is concerned with damaged girders, it is necessary to examine the model against a damaged girder which is done in the second verification approach. A simply supported, steel girder spanning 10 m was modeled and analyzed first as an intact girder and secondly as a damaged girder. The finite element model results were verified by the theoretical calculations based on the 1-dimensional beam theory. Damage was introduced to the girder by applying an upward deflection of 200 mm to one side of the bottom flange. A uniformly distributed load of 1000 N/mm was applied downward in the gravity direction before and after introducing the mentioned damage. Details of the girder geometry are shown in Fig The tensile stress in the bottom flange and the maximum deflection were obtained both by theoretical calculations and the finite element model. For the undamaged beam, The bottom flange tensile stress was 703 MPa through theoretical calculations while it is 708 MPa as extracted from ANSYS, with a relative error of 0.78%. The maximum vertical deflection in the bridge was 87.1 mm through theoretical calculations while it is 92.7 mm as extracted from ANSYS with a relative error of 6.4%. After introducing the damage, the bottom flange tensile stress was 806 MPa through theoretical calculations while it is 835 MPa as extracted from ANSYS with a relative error of 3.6%. The maximum vertical deflection in the bridge is 96.1 mm through theoretical calculations while it is mm as extracted 40
 Elevation, (b) Intact section and, (c) Damaged section The third verification approach is the most important one since it relates the finite element results to an")
52 from ANSYS with a relative error of 7.4%. Note that the results show that the damage increases the flexural stress by 18%. (a) (b) (C) Figure 3.10: Second verification (a) Elevation, (b) Intact section and, (c) Damaged section The third verification approach is the most important one since it relates the finite element results to an experimental test results obtained from instrumentation in the laboratory. The finite element results are compared with those obtained from an 41
53 experiment on a bridge structure previously conducted by Fang et al. [39]. A full-scale simply supported, composite steel girder bridge spanning m was constructed in the laboratory. It consisted of 190 mm thick concrete deck slab rigidly connected to three W36x150 steel girders that are spaced at 2134 mm with 991 mm overhang width. The bridge layout is shown in Fig Figure 3.11: Fang et al. [39] layout of the experimental bridge The bridge was tested under four vertical loads equal to 89 kn each, and applied at a distance of 4420 mm away from the girder supports and 1829 mm away from each other transversely in a symmetrical fashion. The bridge had a concrete slab with a modulus of elasticity of 28,270 MPa and a Poisson ratio of 0.2 while the steel beams were of a 199,950 MPa modulus of elasticity and a 0.3 Poisson ratio. The same bridge is modeled in this study by ANSYS using the previously mentioned modeling scheme. To examine the significance of mesh size, the said bridge is once with an average mesh and again with a fine mesh. Sample of the results obtained are listed and compared with the experimental findings in Table 3.3. It is noted that the relative errors achieved in the average sized mesh are within reasonable limits. Furthermore, the results obtained from the model with finer mesh do not deviate much from that of the average-sized mesh. Hence, it can be concluded that the finite element model with average mesh size behaves in a very similar manner to the behavior of Fang s experimental bridge. In an effort to 42
54 determine the effect of using a fine mesh in the deck slab on the results, the deck slab mesh was then enhanced to contain 3 layers of solid elements instead of 1 layer. However, the results obtained didn t vary much from those in Table 3.4. Hence, it is was decided to keep modeling the deck slab in this study with one layer of solid elements. Table 3.3: Sample comparison between Fang et al. [39] field experiment results and ANSYS model results Aspect Deflection at a section through the load point, at the exterior girder (mm) Deflection at a section through the load point, at the interior girder (mm) Deflection at a section through the load point, at the load point (mm) Compressive stress in the slab transverse direction, at a section through the load point, close to the exterior girder top flange (MPa) Tensile stress in the slab in the transverse direction at a section through the load point, on top of the interior girder (MPa) Field Exp. Avg. mesh Fine Mesh Fang et. al. Result Error Result Error % % % % % % % % % % Based on the above, it can be concluded that the three verification approaches are evidence of the validity of the proposed finite element model. As the relative errors between the theoretical and finite element results and also between the experimental and finite element results are generally low, the considered finite model is said to be reliable. Hence, it will be used in this study to investigate the response of damaged bridges. 43
55 CHAPTER 4 Methodology 4.1 Introduction This chapter discusses the different bridge parameters considered in the study. It further describes modeling of the damage that occurs due to an over-height vehicle collision with a bridge superstructure. The different damage scenarios, from mild to moderate, are also illustrated herein. This chapter also outlines the methodology followed in the study in detail with reference to a standard composite steel girder bridge, with additional cases representing modifications to the standard bridge. It explains the way trucks are positioned in the transverse direction of the bridge to achieve maximum load effects in the supporting girders, and outlines the procedure for computing the girder distribution factor for the flexure and shear limit states. While such details are provided for the standard bridge and its derivatives in this chapter, the discussion of the results in the following chapters shows only the final results in order to eliminate unnecessary repetitions. At the end of this chapter, some important observations on the process of calculating girder distribution factors are presented. 44
56 4.2 Bridges and Damage Scenarios Considered Five different bridge parameters are considered in this study. These include span length (L), girder spacing (S), cross-bracing spacing, slab thickness (t s ) and overhang cantilever width (d). A reference bridge is set and each parameter is then varied twice, once above and another below the standard value, while keeping all other parameters constant in the analysis. As a result, eleven different simply supported, composite steel girder bridges are considered in the study. Note that in order to compare the various bridges on equal basis, all considered bridges had the same width; thus, when the girder spacing is increased, the number of girders was reduced. Different levels of damage are introduced to the exterior girder of each bridge. The standard bridge arrangement is shown in Fig. 4.1 and the values of the parameters and their upper and lower bounds are summarized in Table 4.1. Appendix B details the bridges and girders considered further. (a) Fig. 4.1: Standard bridge arrangement (a) cross-section, (b) elevation (b) Table 4.1: Parameters of bridges considered in the study Parameter Span L (m) Girders Spacing S (m) Number of Diaphragms per meter of span (m -1 ) * Slab Thickness t s (mm) Cantilever Width d (m) Standard bridge Limits for parametric study Lower value Upper value

57 Minor to moderate damage levels are considered in this study through a twisting angle. As elaborated in section 2.6 of this thesis, the damage is assumed as a cold-formed twist in the girder web about an axis passing through the centroid of the steel girder. The twist angle ( ) is measured between the original web and the distorted/bent web. This model confines the damage to the bottom half of the girder depth. An idealization of the damage is provided in Fig It is also assumed that the top flange remains rigidly attached to the bottom of the deck slab and the angle between the distorted web and the bottom flange remains at 90 o. It is assumed that the entire damage occurs within the span, and no lateral movement of the damaged girder at its support points. As the damage level considered in this study is minor to moderate, the damage is assumed to affect the exterior girder only. (a) Fig. 4.2: Girder damage idealization (a) cross-section (b) 3D imaginary visual. (b) The damage is assumed to be confined within the middle third of the exterior girder, based on observed damage to actual bridges. The damaged portion of the girder consists of two main affected zones, designated here as Direct Damage Zone and Indirect Damage Zone. The direct damage zone is the portion of the girder that gets hit directly by an over-height vehicle, i.e. the first portion of the girder that receives the damage. The width of the direct damage zone is denoted as l d, and is assumed to receive 46
58 the maximum damage. It has the maximum bend angle ( ) throughout this zone. The indirect damage zone represents the two portions of the girder to the right and left of the direct damage zone. These are the portions of the girder that get bent as a result of the lateral deflection in the direct damage zone. In other words, they are transition regions between the undamaged part of the girder and the maximum damage zone. The width of each indirect damage zone is denoted as l t. The damage angle starts equal to the damage angle in the indirect damage zone and diminishes to zero at the end farther from the direct damage zone. The cross-bracings attached to the bottom flange of the damaged girder are assumed to buckle within the direct damage zone, whose length is 2 meters. This is accomplished by omitting them locally from the finite element model. However, the indirect damage zone length is governed by the presence of diaphragms; if a diaphragm exists within that zone, the lateral deformation diminishes to zero at the diaphragm location as it works as a support in the lateral direction. However, the length of the indirect damage zone is assumed not to exceed 2 meters. Figure 4.3 illustrates the damage zones and Table 4.2 summarizes the considered levels of damage. To model the damage profile explained in Chapter 2 of this report, the coordinates of the damage profile were determined by trigonometry. These coordinates are used to create the damaged section in ANSYS, at each damage angle,. Table 4.2: Damage levels considered Damage Angle, Direct Damage Zone, l d Indirect Damage Zone, l t 15 o 2 m 1 m 30 o 2 m 1.5 m 45 o 2 m 2 m 47


59 (a) (b) Fig. 4.3: Damage zones (a) imaginary visual (b) damage zones diagram 4.3 GDF, Critical Girders, and Critical Truck Positioning The aim of this study is to understand the behavior of composite steel bridges following an over-height truck collision with the superstructure resulting in damage to the exterior girder. Accordingly, damage is introduced to the exterior girder, as shown in Fig. 4.4, and the change in the girder distribution factor, GDF, is recorded for both exterior damaged girder as well as interior intact girders. The of the redistributed live load effect in the damaged bridge to the girder capacity, represented by the relevant moment of inertia, is evaluated and compared to the same ratio in the undamaged bridge. 48
60 (a) (b) Fig. 4.4: Girder layout (a) before damage (b) after damage The flexural as well as shear girder distribution factors are calculated first in the undamaged case and then in the bridges with different damage level cases. The calculation of GDF using the finite element method is achieved based on the critical truck(s) positioning both in the longitudinal direction and in the transverse direction. The live load is first placed longitudinally over the bridge to maximize either bending moment or shear in the bridge. For the considered span lengths, flexure in the girders is governed by the truck load over the tandem load. AASHTO LRFD truck is placed with its middle axle at midspan of the bridge in order to maximize the flexural load effect at that point. To maximize shear load effect, AASHTO LRFD truck is placed with its heaviest axle just off one of the bridge supports. Figure 4.5 illustrates the longitudinal positioning of the truck to achieve the maximum load effect. 49
61 (a) (b) Fig. 4.5: Truck longitudinal position to maximize (a) flexural load effect, (b) shear load effect In the transverse direction (perpendicular to traffic flow), single as well as multiple lanes are loaded to achieve the maximum load effect for a particular girder with consideration of AASHTO s multiple presence factors, as presented in Fig The AASHTO LRFD [40] multiple presence factors account for the reduced probability of simultaneous presence of multiple HL-93 trucks on a bridge at a given time and are shown in Table 4.3. Table 4.3: AASHTO LRDF 2007 Multiple Presence Factors Number of Loaded Multiple Presence Lanes Factor >
62 Fig. 4.6: Lanes loading To maximize load effect in the exterior girder, a truck or two side-by-side trucks, with appropriate multiple presence factors, are placed at a distance x (m) from the bridge edge and moved transversely by small increments until the girder under consideration records the highest load effect. According to AASHTO s LRFD specification, the minimum distance between a truck wheel and the parapet edge is 300 mm while the minimum distance from a truck wheel to the design lane edge is 600 mm. The parapet width considered in this study is 300 mm and accordingly the minimum value of x is 600 mm. The procedure of evaluating the girder distribution factor in a girder of a bridge using the finite element approach is illustrated in Fig

63 Fig. 4.7: Procedure for maximizing load effect in the girders with two lanes loaded For the flexural load effect, for each value of x, stress at the bottom flange is recorded for all of the girders. Girder distribution factors are then computed for the exterior girder and critical interior girders by considering the ratio of the stress in the girder under consideration to the total stress in all the girders. Flexural and shear girder distribution factors are computed according to equations 4.1 and 4.2, respectively. These equations have been derived starting from the definition of the girder distribution factor [41]. The GDFs of only one-half of the girders need to be considered because the GDF of the remaining girders can be predicted by symmetry, since the damage can be located in the left exterior girder or right exterior girder. 52
64 GDF GDF j j Nm j n i 1 Nm R n R i 1 i i j where; N = number of lanes loaded m = multiple presence factor j = bottom flange stress for girder j i = bottom flange stress for girders i,where i = 1 to n R j = support reaction for girder j R i = support reactions for girders i, where i = 1 to n n = number of girders in the bridge Note that the stress at the bottom flange obtained from ANSYS is a weighted average stress at the bottom side of the bottom flange. For the standard undamaged bridge (bridge 1), the girder considered is detailed in table 4.4. The flexural load effect results and critical GDFs are presented in Tables 4.5 and 4.6, respectively, for the case of one loaded lane. In Fig. 4.8, the computed GDFs are plotted against the truck position from the bridge edge (x) to illustrate the effect of the truck location on the value of the GDF for one lane loaded. The results of the load effect and GDFs are presented in Tables 4.7 and 4.8, respectively, for the case of two lanes loaded with trucks. In Fig. 4.9, the computed GDFs are plotted against the truck position from the bridge edge (x) to illustrate the truck location resulting in maximum GDF for the two loaded lanes. From the presented results, it is clear that the case of two loaded lanes governs for flexural load effect over the case of one loaded lane, for the exterior as well as interior girders Table 4.4: Standard bridge girder cross-section Dimension b TF t TF b BF t BF D t w Std Bridge Girder 300 mm 30 mm 600 mm 60 mm 1700 mm 15 mm 53
65 Table 4.5: Flexural stress at the girder bottom flange, standard bridge and one lane loaded x (m) Stress at the bottom flange of girder (MPa) Table 4.6: Flexure GDF of the girders, standard bridge and one lane loaded x (m) GDF, G5 GDF, G4 GDF, G3 GDF, G2 GDF, G GDF max
66 Table 4.7: Flexural stress at the girder bottom flange, standard bridge, and two lanes loaded x (m) Stress at the bottom flange of girder 'n' (MPa) Table 4.8: Flexure GDF of the girders, standard bridge and two lanes loaded x (m) GDF, G5 GDF, G4 GDF, G3 GDF, G2 GDF, G GDF max
67 GDF GDF GDF, G5 GDF, G4 GDF, G3 GDF, G2 GDF, G1 x (m) Fig. 4.8: Flexure GDF versus truck position for one loaded lane GDF, G5 GDF, G4 GDF, G3 GDF, G2 GDF, G1 x(m) Fig. 4.9: Flexure GDF versus truck position for two loaded lanes The flexural GDF results for the standard bridge with damages corresponding to angles of 15 o, 30 o and 45 o are shown in Figs. 4.10, 4.11 and 4.12, respectively. It is interesting to note that as the damage is induced in the exterior girder, the live effect within the bridge get redistributed from the location of the damage to the intact girders that are located near the damaged exterior girder. 56
68 GDF GDF GDF, G5 GDF, G4 GDF, G3 GDF, G2 GDF, G1 x(m) Fig. 4.10: Flexure GDF versus truck position for two lane load and damage of 15 o GDF, G5 GDF, G4 GDF, G3 GDF, G2 GDF, G x (m) Fig. 4.11: Flexure GDF versus truck position for two lane load and damage of 30 o 57
69 GDF GDF GDF, G5 GDF, G4 GDF, G3 GDF, G2 GDF, G x (m) Fig. 4.12: Flexure GDF versus truck position for two lane load and damage of 45 o For a comprehensive understanding of the results, the maximum flexural GDF for the standard bridge in the intact and damaged states is presented in Fig The figure shows that the flexibility of the damaged girder due to reduction in its moment of inertia pushes the live load away from it to the nearby first interior girder, with the second interior girder being negligibly affected Ext. Girder 1st int. Girder 2nd int. Girder Damage Angle (Degrees) Fig. 4.13: Flexure GDF summary for the standard bridge in the intact and damaged statuses 58
70 % change in GDF The percentage change in the flexural GDFs for the exterior and critical interior girders is plotted against the damage angle in Fig The results shows that as the damage angle increases from 15 o to 45 o, the live in the first interior girder increases by 8% to 52%, relative to the GDF of the intact bridge. Such an increase in the live load in the critical interior girder cannot be neglected and must be considered when rating an existing bridge. Although the live load decreases in the damaged exterior girder, it will be shown in the subsequent chapter that the rate of decrease in the live slower that the rate of decrease in the capacity of the girder. This indicates that both the exterior and first interior girders are greatly affected by the damage. 60% 40% 20% 0% -20% -40% -60% -80% Ext. Girder 1st int. Girder 2nd int. Girder Damage Angle (Degrees) Fig. 4.14: Percentage change in flexure GDF for the standard bridge The same steps done to obtain the graphs in Figs and 4.13 are employed to obtain similar graphs for shear girder distribution factors. The maximum shear GDF for the standard bridge in the intact and damaged states is presented in Fig Note that the location of the damage in the bridge remains the same as in the flexural cases considered earlier since over-height trucks strike bridges within the central span, not near the supports. The results show that the damaged exterior girder shear GDF decreases as the damage intensity increases; this is coupled with an increase in the shear GDF of the 59
71 % CHange in GDF GDF undamaged interior girders. The percentage change in the shear GDFs is plotted against the damage angle in Fig It is noted that the shear stress behavior of damaged bridges is similar to that the flexural stress behavior of the corresponding bridges. However, the magnitude of change in GDF for the shear limit state is negligible, in most cases less than 5%. This is mainly due to the fact that the location of the damage is too far from the location of the critical shear in the bridge to affect the bridge response Ext. Girder 1st int. Girder 2nd int. Girder Damage Angle (Degrees) Figure 4.15: Shear GDF summary for the standard bridge in the intact and damaged statuses 2% 1% 0% -1% -2% -3% -4% -5% Ext. Girder 1st int. Girder 2nd int. Girder Damage Angle (Degrees) Fig. 4.16: Percentage change in shear GDF for the standard bridge 60
72 4.4 Observations and Comments The previous structural analysis for the various bridges with different damage scenarios leads to the following observations: 1- The maximum load effect can be achieved when 2 lanes are loaded with trucks in the transverse direction. This result applies to both the exterior and interior girders, with consideration of the multiple presence factors. 2- The change in the shear and flexure GDF is approximately linear with the change in the damage angle. Accordingly, instead of introducing three different damage levels (15 o, 30 o and 45 o ), two damage levels are found to be sufficient to consider in the subsequent analysis (22.5 o and 45 o ). This was helpful in reducing the increments of the damage level ( ). 3- Percentage change in shear GDFs as damage increases is less than 5%. This was revealed in three of the bridge parameters considered in this study. These are girder spacing, slab thickness and cross-bracing spacing. As a result, shear girder distribution factors are not computed for the rest two bridge parameters, bridge span and cantilever width. Note: the details of computing the maximum shear and moment girder distribution factors are provided in Appendix C. 61
73 CHAPTER 5 FINDINGS AND DISCUSSION 5.1 Introduction In this section, findings in relation to the effect of damage in an exterior girder on the live load distribution characteristics of composite steel girder bridges are presented. It is a known that the distribution of load among the different main structural members in a system is directly proportional to the structural members relative stiffness. In general, the stiffer the structural member, the larger the load transferred to it. Translating this concept into the subject study, a damaged girder experiences a reduced stiffness as its second moment of inertia decreases. As a result, the adjacent undamaged girder stiffness is relatively higher compared to the damaged girder stiffness if both have been constructed with similar geometry and material properties, which is usually the case. This causes the live load effect from the applied truck(s) on a bridge to reduce in the damaged girder and increase in the adjacent interior girders. Figure 5.1 illustrates the live load distribution pattern in an intact and damaged bridge when subjected to truck load. 62
 before damage, and (b) after damage If a truck is positioned on a steel girder bridge in the transverse direction as close as possible to the parapet,")
74 (a) (b) Fig. 5.1: Live load distribution in a girder bridge (a) before damage, and (b) after damage If a truck is positioned on a steel girder bridge in the transverse direction as close as possible to the parapet, then the live load effect will be maximized on the exterior girder, as shown in Fig. 5.1a. Since the wheels of the truck are directly located over, or close to, the exterior girder, it follows that most of the truck load will be carried by the exterior girder and the remaining load will be transferred to the first interior girder. When the exterior girder experiences a damage that reduces its moment of inertia, and consequently its stiffness, some of the live load shifts from the flexible girder towards the adjacent stiffer girder(s). This means that live load reduces in the exterior girder and increases in the first interior and possibly the second interior intact girders that are close to the exterior damaged girder. It should be noted that looking at the load effect without considering the load-carrying capacity of the individual structural members does not show the whole picture. For a comprehensive analysis, the research needs to address how 63
75 GDF the reduction in capacity of the damaged exterior compares with the decrease in live load effect. This chapter investigates this phenomenon in detail with consideration both flexural and shear effects in the affected girders in the bridge system. 5.2 Flexural Effect For the standard bridge (bridge 1) considered in Chapter 4, Fig. 5.2 presents the flexural GDF for the exterior girder, as well as the adjacent first and second interior girders for different angles of damage,. The results indicate that as damage angle increases, the flexural GDF decreases in the damaged exterior girder while it increases in the intact interior girders. As expected, the live load effect of the damage on the bridge is significant in the exterior and first interior girders, where the local damage in present, and minimal in the second interior girder Ext. Girder 1st int. Girder Damage Angle (Degrees) Figure 5.2: Bridge 1 flexural GDF 2nd int. Girder In order to quantify the effect of the live distribution in a damaged bridge, Fig. 5.3 presents the flexural GDF percentage change from the undamaged bridge state. It s noted that the slope of the exterior girder s curve in the figure is relatively steeper than that of the first interior girder. The second interior girder s curve slope is mild. This can be explained as follows; the damaged girder experiences significant reduction in the flexural GDF that goes as high as 65% when the damage angle reaches 45 o. The first interior 64
76 % Change in GDF girder experiences considerable increase in the flexural GDF which reaches as high as 50% at = 45 o. The second interior girder, being farther away from the damaged girder, experiences a maximum of 10% increase in the flexural GDF. From a practical point of view, the results indicate that particular attention shall be provided to the first interior girder when significant damage occurs in the exterior girder, particularly when the damage angle is larger than 20 o. As indicated earlier, the effect of the damage on the exterior girder cannot be assessed unless the reduced capacity of the exterior girder is considered simultaneously with the decrease in the live load effect on the girder. This will be considered for this case and others later in the chapter. 75% 50% 25% Ext. Girder 0% -25% -50% -75% Damage Angle (degrees) Figure 5.3: Bridge 1 change in flexural GDF 1st int. Girder 2nd int. Girder Effect of Span Length Figure 5.4 presents the flexural GDF of the 20 m span bridge (bridge 2) for a range of damage angles. As was the case in of the standard bridge, the results show that as damage angle increases the flexural GDF decreases in the damaged exterior girder and increases in the intact interior girders. However, compared to 40m long bridge 1, the change in the GDF of bridge 2 is less. Figure 5.5 presents the flexural GDF percentage change from the undamaged bridge state. It s noted that the slope of the exterior girder s curve is close to that of the first interior girder while the second interior girder s curve is almost flat. The damaged girder experiences a maximum of 37% reduction in the flexural GDF, corresponding to = 45 o. The first and second interior girders experience a 65
77 % Chnage in GDF GDF maximum of 30% and 5% increase in the flexural GDF, respectively, at the same level of damage. This finding is expected because short span bridges are known to posses less live load distribution capability when compared with longer span structures due to their limited ability to allow individual girders to go through relative deflections Damage Angle (Degrees) Figure 5.4: Bridge 2 flexural GDF Ext. Girder 1st int. Girder 2nd int. Girder 40% 20% Ext. Girder 0% -20% -40% Damage Angle (Degrees) Figure 5.5: Bridge 2 change in flexural GDF 1st int. Girder 2nd int. Girder Figure 5.6 presents the flexural GDF outcomes for the 60m span bridge (bridge 3). A similar trend to the previous results is observed with regard to live load distribution in relation to the damage angle. Compared to the standard bridge 1, the bridge 3 changes in GDF do not vary by much. Figure 5.7 presents the flexural GDF percentage change 66
78 % Change in GDF GDF from the undamaged bridge state. It is noted that the slope of the exterior girder s curve is close to that of the first interior girder while the second interior girder s curve is mild. The damaged girder experiences a maximum reduction of 62% in the flexural GDF. The first and second interior girders experience a maximum increase of 54% and 10% in the flexural GDF, respectively. These findings for are similar to those of bridge 1, indicating that while the span length does affect the live load distribution in short span bridges, its effect diminishes as the span length increases. This statement regarding the span length is true for both damaged as well as intact bridges Damage Angele (degrees) Figure 5.6: Bridge 3 flexural GDF Ext. Girder 1st int. Girder 2nd int. Girder 60% 40% 20% 0% -20% -40% -60% -80% Damage Angle (degrees) Figure 5.7: Bridge 3 change in flexural GDF Ext. Girder 1st int. Girder 2nd int. Girder 67
79 % Increase in GDF % Decrease in GDF The effect of span length on the change in GDF for the exterior girder and first interior girder results are summarized in Fig. 5.8 and 5.9, respectively. 80% 60% 40% 20% 20m 40m 60m 0% Damage Angle (degrees) Figure 5.8: Percentage decrease in the exterior girder flexure GDF (span parameter) 60% 40% 20% 20m 40m 60m 0% Damage Angle (degrees) Figure 5.9: Percentage increase in the 1 st interior girder flexure GDF (span parameter) Effect of Girder Spacing Figure 5.10 presents the flexural GDF of the bridge with 4.5m girder spacing, denoted by bridge 5. The same trend in the live load distribution that has been reported earlier holds; however, compared to the standard bridge 1 with 3.375m girder spacing, the change in the GDF of bridge 5 is less. This finding can be justified by noting that as the girders move away from each other within the structural system, their interaction and 68
80 % Change in GDF GDF effect on each other reduces. Figure 5.11 presents the flexural GDF percentage change from the undamaged bridge state. It is noted that the slope of the damaged exterior curve is higher than that of the undamaged first interior girder. The damaged girder experiences a maximum of 53% reduction in the flexural GDF. The first interior girder experiences a maximum 34% increase in the flexural GDF only. Note that bridge 5 has only 4 girders, of which two are similar interior girders and the remaining two are exterior girders Ext. Girder 1st int. Girder Damage Angle (Degrees) Figure 5.10: Bridge 5 flexural GDF 40% 20% 0% -20% -40% -60% Damage Angle (Degrees) Figure 5.11: Bridge 5 change in flexural GDF Ext. Girder 1st int. Girder 69
81 % Change in GDF GDF Figure 5.12 presents the maximum flexural GDF of the bridge with 2.25m girders spacing (bridge 4). Compared to the standard bridge 1, the results indicate that the change in GDF for bridge 5 as a function of the damage angle is more. Figure 5.13 presents the percent change in flexural GDF from the undamaged bridge state. It s noted that the slope of the exterior girder s curve is higher than that of the first interior girder. The damaged exterior girder experiences a maximum of 71% reduction in the flexural GDF, whereas the first interior girder experiences a maximum of 51% increase in the flexural GDF when the damage angle reaches 45 o. The results show that the high reduction in live in the exterior damaged girder redistributes among the many intact interior girders that are close to the exterior girder Ext. Girder 1st int. Girder 2nd int. Girder Damage Angle (Degrees) Figure 5.12: Bridge 4 flexural GDF 60% 40% 20% 0% -20% -40% -60% -80% Ext. Girder 1st int. Girder nd int. Girder Damage Angle (Degrees) Figure 5.13: Bridge 4 change in flexural GDF 70
82 % Increase in GDF % Decrease in GDF The effect of girder spacing on the change in GDF for the exterior girder and first interior girder results are summarized in Fig and 5.15, respectively. 80% 60% 40% 2.25m 3.375m 20% 4.5m 0% Damage Angle (Degrees) Figure 5.14: Percentage decrease in the exterior girder flexure GDF (girder spacing parameter) 60% 40% 20% 2.25m 3.375m 4.5m 0% Damage Angle (Degrees) Figure 5.15: Percentage increase in the 1 st interior girder flexure GDF (girder spacing parameter) Effect of Cross-Bracing Spacing Figure 5.16 presents the maximum flexural GDF of the bridge with no crossbracing (bridge 7). Compared to the standard bridge 1 with cross-bracings spaced at 5 m, the results show that the reduction in the GDF for the exterior girder in bridge 7 is less. The absence of cross-bracing, which plays an important role in load distribution in girder bridges, reduces somewhat the ability of the bridge to distribute the imposed live load to location further away from the damaged exterior girder. This is recognized through the 71
83 % Change in GDF GDF large change in GDF of the first interior girder and negligible change in the GDF of the second interior girder Ext. Girder 1st int. Girder 2nd int. Girder Damage Angle (Degrees) Figure 5.16: Bridge 7 flexural GDF Figure 5.17 presents the flexural GDF percentage change from the undamaged bridge state. It is found that the slope of the damaged exterior girder s curve is lower than that of the first interior girder. The damaged girder experiences a maximum of 56% reduction in the flexural GDF. The first and second interior girders experience a maximum increase of 71% and 6% in the flexural GDF, respectively. 100% 60% 20% -20% -60% -100% Damge Angle (Degrees) Figure 5.17: Bridge 7 change in flexural GDF 72 Ext. Girder 1st int. Girder 2nd int. Girder
84 GDF Figure 5.18 presents the maximum flexural GDF of the bridge with 2.5m crossbracing spacing (bridge 6). The results show that as the damage angle increases, the flexural GDF decreases in the damaged exterior girder while increases equally in the first and second intact interior girders. Compared to the standard bridge with 5m cross-bracing spacing, the change in the GDF for the girder of bridge 6 is much less. This is explained by the fact that presence of cross-bracing in girder bridges enhances the live load distribution among the bridge girders by reducing their relative vertical deflection when subjected to gravity loads Damge Angle (Degrees) Figure 5.18: Bridge 6 flexural GDF Ext. Girder 1st int. Girder 2nd int. Girder Figure 5.19 presents the flexural GDF percentage change from the undamaged bridge state. It s noted that the slope of the exterior girder s curve is higher than that of the first interior girder. The damaged girder experiences a maximum of 26% reduction in the flexural GDF. The first and second interior girders experience a maximum of 17% and 13% increase in the flexural GDF, respectively. From a practical point of view, this finding indicate that as the cross-bracing spacing in a bridge decreases, the bridge will be able to absorb and sustain damage in the exterior girder by engaging the other intact girder within the bridge in the redistribution of the load. 73
85 % Decrease in GDF % Change in GDF 20% 10% 0% -10% -20% -30% Damage Angle (Degrees) Figure 5.19: Bridge 6 change in flexural GDF Ext. Girder 1st int. Girder 2nd int. Girder The effect of cross-bracing spacing on the change in GDF for the exterior girder and first interior girder results are summarized in Fig and 5.21, respectively. 80% 60% 40% 20% 2.5m 5m No Braces 0% Damage Angle (Degrees) Figure 5.20: Percentage decrease in the exterior girder flexure GDF (cross-bracing parameter) 74
86 GDF % Increase in GDF 80% 70% 60% 50% 40% 30% 20% 10% 0% Damage Angle (Degrees) 2.5m Figure 5.21: Percentage increase in the 1 st interior girder flexure GDF (cross-bracing parameter) 5m No Braces Effect of Slab Thickness Figure 5.22 presents the maximum flexural GDF of the bridge with 180 mm slab thickness (bridge 8). Compared to the standard bridge 1 with 220 mm slab thickness, the change in the GDF of bridge 8 is slightly higher. This means that the load is less shared among the girders, which is expected in bridges having thin deck slabs as the lateral stiffness of such bridge superstructures is small. The reduction in lateral stiffness reduces the bridge ability to transfer loads among the supporting girders, particularly after damage occurs Ext. Girder 1st int. Girder 2nd int. Girder Damage Angle (Degrees) Figure 5.22: Bridge 8 flexural GDF 75
87 GDF % Change in GDF Figure 5.23 presents the flexural GDF percentage change from the undamaged bridge state. It is found that the slope of the exterior girder s curve is higher than that of the first interior girder. The damaged girder experiences a maximum of 72% reduction in the flexural GDF. The first and second interior girders experience a maximum 52% and 12% increase in the flexural GDF, respectively. The later percentages are slightly higher than those obtained from the analysis of bridge 1. 80% 40% Ext. Girder 0% -40% st int. Girder 2nd int. Girder -80% Damage Angle (Degrees) Figure 5.23: Bridge 8 change in flexural GDF Figure 5.24 presents the maximum flexural GDF of the bridge with 260 mm slab thickness (bridge 9). When compared with the results of bridge 1, the findings indicate an expected trend opposite to that obtained earlier for bridge 8 that has a thin slab thickness. This shows that the increase in slab thickness reduces the impact of damage from overheight truck collision on the live load distribution within a girder bridge Damage Angle (Degrees) Figure 5.24: Bridge 9 flexural GDF Ext. Girder 1st int. Girder 2nd int. Girder 76
88 % Decrease in GDF % Change in GDF Figure 5.25 presents the flexural GDF percentage change from the undamaged bridge state. The results show that the damaged exterior girder experiences a maximum reduction in the flexural GDF equal to 34% when the damage angle is 45 o. For the same damage level, the flexural GDF in the first and second interior girders increases by 20% and 5%, respectively. This is explained by the fact that a thick concrete slab in a bridge provides lateral rigidity, which enhances the live load distribution among the supporting girders. This is particularly helpful when damage occurs in one of the girders of the bridge. 40% 20% 0% -20% Ext. Girder 1st int. Girder 2nd int. Girder -40% Damage Angle (Degrees) Figure 5.25: Bridge 9 change in flexural GDF The effect of slab thickness on the change in GDF for the exterior girder and first interior girder results are summarized in Fig and 5.27, respectively. 80% 60% 40% 20% 180mm 220mm 260mm 0% Damage Angle (Degrees) Figure 5.26: Percentage decrease in the exterior girder flexure GDF (slab thickness parameter) 77
89 GDF % Increase in GDF 60% 40% 20% 180mm 220mm 260mm 0% Damage Angle (Degrees) Figure 5.27: Percentage increase in the 1 st interior girder flexure GDF (slab thickness parameter) Effect of Deck Slab Overhang Width Figure 5.28 presents the maximum flexural GDF of bridge 10, which has a reduced deck slab overhang width equal to 0.75 m. Compared to the standard bridge that has an overhang width of 12.5 m, the change in the flexural GDF as a function of the damage angle for bridge 10 is slightly lower, particularly in the intact girders. This is mainly because the interior girders in the bridge with small overhang are already loaded with more live load than the bridge with large overhang in the undamaged case, and a slight damage in the exterior girder of the bridge with small overhang does not add up a lot more live to those interior girders beyond to what they have been subjected to Damage Angle (Degrees) Figure 5.28: Bridge 10 flexural GDF Ext. Girder 1st int. Girder 2nd int. Girder 78
90 % Change in GDF Figure 5.29 presents the flexural GDF percentage change from the undamaged bridge state. It shows that the slope of the exterior girder s curve is approximately double that of the first interior girder. The damaged girder experiences a maximum of 53% reduction in the flexural GDF, while the first and second interior girders experience a maximum 26% and 5% increase in their GDF, respectively. The small increase in the flexural GDF of the undamaged girders, compared with the standard bridge, is explained by the fact that the interior girder s GDF in the undamaged state was large; hence, some increase in its value beyond its original measure does not lead to a high percentage. 40% 20% 0% -20% -40% -60% Damage Angle (Degrees) Ext. Girder 1st int. Girder 2nd int. Girder Figure 5.29: Bridge 10 change in flexural GDF Figure 5.30 presents the flexural GDF of the bridge with 2.0 m deck slab cantilever width, denoted by bridge 11. Compared with the results of bridge 1, the findings indicate an expected trend opposite to that obtained earlier for bridge 10 that has an overhang width equal to 0.75 m. However, it is worth mentioning that the changes in the flexural GDF for bridge 11 are close to those in the standard bridge; thus indicating that the effect of the overhang width on live load redistribution when damage occurs in girder bridges has a limit. 79
91 % Change in GDF GDF Ext. Girder 1st int. Girder 2nd int. Girder Damage Angle (Degrees) Figure 5.30: Bridge 11 flexural GDF Figure 5.31 presents the flexural GDF percentage change from the undamaged bridge state for the bridge with 2 m overhang width. The results show that the damaged exterior girder experiences a maximum of 68% reduction in the flexural GDF when the damage angle reaches 45 o. The corresponding increases in the flexural GDF for the first and second interior girders are 47% and 7%, respectively. The greater sensitivity of the flexural GDF for the exterior and first interior girders in a bridge with wide overhang, compared to the same in a bridge with short overhang, reflects the importance of such girders for resisting live load in bridges having wide overhangs. 60% 40% 20% 0% -20% -40% -60% -80% Damage Angle (Degrees) Figure 5.31: Bridge 11 change in flexural GDF Ext. Girder 1st int. Girder 2nd int. Girder 80
92 % Increase in GDF % Decrease in GDF The effect of slab overhang width on the change in GDF for the exterior girder and first interior girder results are summarized in Fig and 5.33, respectively. 80% 60% 40% 20% 0.75m 1.25m 2m 0% Damage Angle (Degrees) Figure 5.32: Percentage decrease in the exterior girder flexure GDF (slab overhang width parameter) 60% 40% 20% 0.75m 1.25m 2m 0% Damage Angle (Degrees) Figure 5.33: Percentage increase in the 1 st interior girder flexure GDF (slab overhang width parameter) Discussion of Results on Flexural Behavior The previous results based on finite element analysis shows that significant reduction in live load flexural effect happens in the exterior girder due to damage located in it, particularly when the damage angle is large. This is accompanied by moderate-tolarge increase in the live load flexural effect in the first interior girder, and minor increase in the same for the second interior girder. The results from the previous analysis are summarized in tables 5.1 and
93 Table 5.1: Percent increase in GDF for the = 30 o damage angle Girder Location Span Length (m) Girder Spacing (m) Cross-Bracing Spacing (m) Slab Thickness (mm) Overhang Width (m) None Exterior st Interior nd Interior Table 5.2: Percent increase in GDF for the = 45 o damage angle Girder Location Span Length (m) Girder Spacing (m) Cross-Bracing Spacing (m) Slab Thickness (mm) Overhang Width (m) Exterior st Interior nd Interior
94 The following discussion mainly addresses the change in the flexural live load effect in the undamaged interior girders that are adjacent to the exterior damaged girder for the investigated parameters. Discussion of the flexural live load effect in the exterior damaged girder will be treated later in the chapter, as it makes more sense to relate it to the reduction in moment of inertia of the damaged girder. The previous results are analyzed to determine the most significant bridge geometric parameters that affect live load flexural effect redistribution into the first interior undamaged girder following damage to the exterior. To do this, the variation of the parameters considered in this study are plotted against the increase in the first interior girder flexural GDF due to damage in the exterior girder. For convenience, the results corresponding to 45 o damage angle are considered. To enable comparison between the five bridge parameters (span length, girder spacing, cross-bracing spacing, slab thickness, and overhang deck slab width) on equal basis, the parameters are varied by ±20% and the percentage increase in the first girder flexural GDF is recorded. The available results from sections are employed and the percentage increase in flexural GDF is interpolated by a second order parabolic equation that fits the results, as shown in Figs to The cross-bracing spacing parameter is converted to number of crossbracing per one meter of the bridge span in order to quantify the absence of cross-bracing in bridge number 7 and relate it to the bridges that have discrete cross-bracing spacing. 83
95 Increase in flexural GDF Increase in flexural GDF 60% 40% 20% 0% -60% -40% -20% 0% 20% 40% 60% Change in span length Figure 5.34: Increase in 1 st interior girder flexural GDF for = 45 o (span parameter) 60% 40% 20% 0% -40% -20% 0% 20% 40% Change in girder spacing Figure 5.35: Increase in 1 st interior girder flexural GDF for = 45 o (girder spacing parameter) 84
96 Increase in flexural GDF Increase in flexural GDF 80% 60% 40% 20% 0% -100% -60% -20% 20% 60% 100% Change in number of diaphragms per 1m span Figure 5.36: Increase in 1 st interior girder flexural GDF for = 45 o (cross-bracing parameter) 60% 40% 20% 0% -40% -20% 0% 20% 40% Change in slab thickness Figure 5.37: Increase in 1 st interior girder flexural GDF for = 45 o (slab thickness parameter) 85
97 Increase in flexural GDF 60% 40% 20% 0% -60% -40% -20% 0% 20% 40% 60% 80% Change in cantilever width Figure 5.38: Increase in 1 st interior girder flexural GDF for = 45 o (over-hang width parameter) The results obtained from the previous figures at ±20% change in geometric parameters are summarized in Table They show that for all bridges, at 20% change in the parameter, the percentage change in the first interior girder flexural GDF due to damage angle of 45 o (in the exterior girder) is basically around 55%. Nevertheless, the percentage difference between the percentage change values corresponding to varying the five bridge parameters between -20% and +20% yields a different conclusion, which are presented in Fig This reveals that slab thickness is the most significant bridge parameter affecting the increase in the first interior girder GDF due to damage in the exterior girder. Bridge Geometric Parameter % Increase in GDF of 1 st Interior Girder % Difference Table 5.3: Summary of % increase in GDF of first interior girder due to bridge geometric parameters at = 45 o % Change in Parameter Span Length Girder Spacing Cross-Bracing Slab Thickness Slab Overhang -20% +20% -20% +20% -20% +20% -20% +20% -20% +20% 45% 55% 52% 43% 56% 45% 51% 16% 41% 55% 20% 18% 21% 106% 28% 86
98 120.00% % 80.00% 60.00% 40.00% 20.00% Slab thickness Slab Over-Hang Width No. of Cross Braces per 1 m span Span Length Girder Spacing 0.00% Figure 5.39: Rate of change in 1 st interior girder flexural GDF for ±20% parameter change The excessive difference in the percentage increase in GDF associated with slab thickness variation is explained by the fact that a small increase in the slab thickness results in a significant increase in the second moment of inertia of the slab; thus, greatly affecting the bridge superstructure s stiffness in the transverse direction. The second significant parameter that affects the live load redistribution characteristics of a damaged bridge towards the first interior girder is the slab over-hang. While they do have some effect, the rest of the bridge parameters affect the fraction of live load redirected towards the first interior girder in the same effect. Live redistribution among undamaged girders due to over-height vehicle collision with an exterior girder in composite steel girder bridges is directly proportional to span length. As the span increases, the change in flexural GDF increases for both the exterior and adjacent interior girders. At shorter spans, the redistributed live load flexural effect from the damaged girder to the nearby undamaged interior ones is less compared to that in longer spans. Live load redistribution among undamaged girders in a bridge containing a damaged exterior girder is inversely proportional to girder spacing. As the girder spacing decreases, the redistributed live load flexural effect increases. This is due to the fact that 87
99 the closer the girders to each other are, the shorter the live load path to the girders in the lateral direction; thus, resulting in more live load sharing among the girders. The results of the study also demonstrated that live redistribution among undamaged girders in the considered damaged bridges is directly proportional to crossbracing spacing. As the spacing increases, the redistributed live load flexural effect also increases. The increase in distributed live load effect is accompanied with less variation in the GDF from the undamaged state. This is due to the role that cross-bracings play in load distribution among bridge girders. They ensure sharing of live load by minimizing excessive relative vertical deflection in the supporting girders. Findings of the study further showed that live load redistribution among the undamaged girders in a damaged bridge is directly proportional to the slab thickness. As the slab thickness increases, the redistributed live load flexural effect increases in the intact interior girders close the damaged exterior girder. The increase in live load redistribution comes with less variation in the GDF from the undamaged state. This is due to the role that the slab thickness plays in live load distribution among the bridge girders. A thick deck slab helps increase load sharing between the girders of a bridge by providing higher rigidity in the transverse direction of the bridge. Finally, the previous analysis on flexural effect indicated that the live load redistribution among the undamaged girders in a damaged bridge depends to a large extent on the deck slab overhang width. As the cantilever width increases, the rate of decrease in flexural GDF of the damaged girder further increases as the wide cantilever gathers more of the live load toward the damaged girder. This is accompanied with more increase in the live load that is transferred to the intact interior girders. The results show the importance of the exterior and first interior girders in resisting live load in bridges having wide overhang widths. 88
100 GDF 5.3 Shear Effect As stated in Chapter 4, the location of the local damage in an exterior girder due to an over-height truck impact for the shear cases is the same as that for the flexural cases discussed earlier, that is positioned longitudinally in the middle part of the bridge. This location of damage is due to the fact that under-bridge roadway lanes are often positioned away from the bridge piers and abutments. However, the shear in such bridges is checked at the support, which is the critical longitudinal location for this live load effect. For the standard bridge (bridge 1), Figure 5.40 presents the maximum shear GDF for the exterior girder, as well as for the first and second interior girders for different damage angles. As reported for the flexural effect, it is likewise noted that as the damage angle increases, the shear GDF decreases in the damaged exterior girder and increases in the nearby intact interior girders. The magnitude of change is, however, very small. Figure 5.41 presents the shear GDF percentage change from the undamaged bridge state. It is found that the slope of the exterior girder s curve is relatively steep compared to that of the first and second interior girders. While the live load effect of damage is higher on the exterior girder than on the adjacent interior girders, the change in shear GDF does not exceed 5% for all cases, even when the damage angle is at the maximum value of 45 o. Such a finding shows that the embedded factors of safety in the structural design specification can adequately account for such small changes in the shear due to live in the affected girders Damage Angle (Degrees) Figure 5.40: Bridge 1 Shear GDF Ext. Girder 1st int. Girder 2nd int. Girder 89
101 GDF % Change in GDF 2% 0% -2% -4% -6% Damage Angle (Degrees) Figure 5.41: Bridge 1 change in shear GDF Ext. Girder 1st int. Girder 2nd int. Girder Effect of Girder Spacing Figure 5.42 presents the maximum shear GDF of the bridge with 4.5 m girder spacing (bridge 5). The results show that as damage angle increases, the shear GDF negligibly changes in the supporting girders. Compared to the standard bridge 1 with m girder spacing, the change in GDF for bridge 5 is much smaller. Figure 5.43 presents the shear GDF percentage change from the undamaged bridge state. The results again show that the change in shear GDF is larger in the exterior girder than in the first interior girder, but does not exceed 5% in all cases Ext. Girder 1st int. Girder Damage Angle (Degrees) Figure 5.42: Bridge 5 shear GDF 90
102 GDF % Change in GDF 2% 0% -2% -4% Ext. Girder 1st int. Girder -6% Damage Angle (Degrees) Figure 5.43: Bridge 5 change in shear GDF Figure 5.44 presents the maximum shear GDF of the bridge with 2.25m girders spacing (bridge 4). The corresponding results for the percent change in the shear GDF as a function of the damage angle are given in Fig It is clearly noted that the change in shear GDF of intact and damaged girders is insignificantly small and doesn t exceed 4%, even when the damage angle is very large Ext. Girder Damage Angle (Degrees) Figure 5.44: Bridge 4 shear GDF 1st int. Girder 2nd int. Girder 91
103 % Change in GDF % Change in GDF 2% 1% 0% -1% -2% -3% -4% Damage Angle (Degrees) Figure 5.45: Bridge 4 change in shear GDF Ext. Girder 1st int. Girder 2nd int. Girder Effect of Cross-Bracing Spacing The effect of cross-bracing spacing on shear due to live load redistribution in a damaged bridge are shown in Figs and 5.47, which present the percentage change in the shear GDF from the undamaged state for two cases. The first case, shown in Fig. 5.30, is about a bridge without diaphragms (bridge 7), while the second case concerns a bridge with diaphragms spaced at 2.5 m (bridge 6). It s noted that as the damage angle increases, the shear GDF slightly decreases in the damaged exterior girder and increases in the intact interior girders, with a maximum percentage change in the shear GDF not exceeding 4%. 4% 2% Ext. Girder 0% -2% st int. Girder 2nd int. Girder -4% Damage Angle (Degrees) Figure 5.46: Bridge 7 change in shear GDF 92
104 % Change in GDF % Change in GDF 2.0% 1.0% 0.0% -1.0% Ext. Girder 1st int. Girder 2nd int. Girder -2.0% Damage Angle (Degrees) Figure 5.47: Bridge 6 change in shear GDF Effect of Deck Slab Thickness Figures 5.48 and 5.49 present the shear GDF percentage change from the undamaged state of damaged bridges having 180 mm slab thickness (bridge 8) and 260 mm slab thickness, respectively. Here again, as damage angle increases, the shear GDF slightly changes in the damaged exterior girder and intact girders. However, the change in shear GDF doesn t exceed 5%. 3% 1% -1% -3% Ext. Girder 1st int. Girder 2nd int. Girder -5% Damage Angle (Degrees) Figure 5.48: Bridge 8 change in shear GDF 93
105 % Change in GDF 2% 0% -2% -4% Ext. Girder 1st int. Girder 2nd int. Girder -6% Damage Angle (Degrees) Figure 5.49: Bridge 9 change in shear GDF 94
106 5.3.4 Discussion of Results on Shear Flexural Behavior As the damage in this study is assumed to occur in the middle third of the girder span, the obtained results showed, as expected, minimal effect on the girders shear behavior under live load. This is due to the fact that the critical shear is checked at the support, too far from the location of the damage to make a significant effect on the shear stress. This finding is true for bridges with various girder spacing, cross-bracing spacing, and slab thicknesses. Although the deck slab overhang width and span length effects on shear were not considered, it is expected that such variables will not lead to significantly different conclusions than what have been already obtained for the other variables. In all the considered cases, it was found that the percentage change in shear GDF due to the damage does not exceed 5% even at the maximum damage angle of 45 o. Furthermore, the design of moderately long span steel girder bridges is usually governed by the flexural, note shear, limit state. As a result, an adequate steel girder cross-section that is sized for flexure is only partially utilized to resist shear stresses. When damage occurs in the bottom half of the girder depth, it is expected that the cross-section will still have adequate shear capacity to resist the live load effect. In summary, the effect of damage on the shear behavior is insignificant as the change in shear GDF in confined to a range of ±5%, regardless of the damage extent or the varied bridge parameter. This is being the case, further analysis of the shear results will not be carried out. Thus, the final part of this chapter will investigate the relationship between the decrease in live load flexural effect in the exterior damaged girder and the corresponding decrease in the flexural load carrying capacity due to damage. 95
107 5.4 Effect of Damage on Flexural Capacity of Exterior Girder An important ratio, denoted by the live load effect index will be used in this section to investigate the impact of damage on the flexural capacity of an exterior girder in a bridge damaged by over-height truck impact. Although the damaged girder redistributes live load effect away from it, it also suffers a reduction in its load carrying capacity due to the damage. To examine this, a measure of the increase in load-tocapacity ratio will be created. The flexural live load effect in a bridge girder can be measured by the value of the flexural GDF of the girder. The ability of a girder to resist flexural load effect can be represented by the girder cross-section s second moment of inertia, I. Accordingly; the ratio of flexural GDF to second moment of inertia represents the load-capacity ratio. To examine the increase/decrease in flexural load-to-capacity ratio, the Live Load Effect Index (L.E.I) is created: 5.1 where (GDF/I) Damaged = ratio of the flexural girder distribution factor to second moment of inertia of the exterior girder in the damaged state, and (GDF/I) Intact = ratio of the flexural girder distribution factor to second moment of inertia of the exterior girder in the intact or undamaged state. Note: the second moment of inertia in this expression is based on a horizontal axis passing through the section center of gravity; not the second moment of inertia about the principal axis. Based on the expression 5.1 above, the intact bridge state is considered to be the base of the index with 100% L.E.I. Such an index is calculated for the damaged girders at each damage level, represented by the damage angle. Any value for the L.E.I above 1.0 indicates an increase in the live load-to-capacity ratio in that particular girder at the specific damage level. Likewise, any reduction in L.E.I below 1.0 represents a decrease in the live load-to-capacity ratio in that particular girder at the specific damage level. Tables 5.4 to 5.8 summarize the L.E.I values for all the exterior girders in the bridges considered in the study. 96
108 Table 5.4: L.E.I for Bridges 2, 1 and 3 (Span Length Parameter) Span (m) Damage L.E.I for Ext. Angle Girder 15 o o o o o o o o o 2.75 Table 5.5: L.E.I for Bridges 5, 1 and 4 (Girders Spacing Parameter) Girder Spacing (m) Damage Angle L.E.I for Ext. Girder 15 o o o o o o o o o Table 5.6: L.E.I for Bridges 7, 1 and 6 (Cross-Bracing Spacing Parameter) Cross-Bracings Spacing (m) No Cross- Bracings Damage Angle L.E.I for Ext. Girder 15 o o o o o o o o o
109 Table 5.7: L.E.I for Bridges 8, 1 and 9 (Slab Thickness Parameter) Slab Thickness (mm) Damage Angle L.E.I for Ext. Girder 15 o o o o o o o o o 5.54 Table 5.8: L.E.I for Bridges 10, 1 and 11 (Slab Overhang Width Parameter) Slab Overhang Width (m) Damage Angle L.E.I for Ext. Girder 15 o o o o o o o o o 2.61 The results of the live load effect index analysis are plotted against the damage angle to observe the pattern of this index on the variation in the damage angle. These are shown in figures 5.50 to Generally, it is noted that the damaged exterior girder in all the considered bridges with different spans suffer L.E.I values that are well above 100% and as high as 410% when the damage angle reaches 45 o (Fig. 5.50), which is significant. However, the bridges with spans of 40m and 60m show faster increase in damaged girder L.E.I as damage angle increase up to = 30 o, after which, the L.E.I slightly drops. This is explained by the larger drop in flexural GDF for the 40m and 60m span bridges compared to that of the 20m span bridge, as illustrated in section earlier. 98
110 L.E.I L.E.I L= 40 m L= 20 m L= 60 m Damage Angle (Degrees) Figure 5.50: L.E.I for damaged girder in bridges 2, 1 and 3 (span length parameter) Figure 5.51 presents the damaged girder L.E.I as a function of the girder spacing. It can be observed that the damaged exterior girder in all bridges with different girder spacing suffer L.E.I values that are well above 100% when the girder spacing is moderate or large. The L.E.I. can be as high as 520% when the girder spacing is m and the damage is 30 o. It s important to note that the damaged girder at the bridge with girders spacing of 2.25m experiences a minimal increase in load to capacity ratio as its L.E.I doesn t exceed 120%, even at large damage angles, due to the fact that this bridge is much more redundant, having 7 girders, than the other bridges S= m S= 4.5 m 2.0 S= 2.25 m Damage Angle (Degrees) Figure 5.51: L.E.I for damaged girder in bridges 5, 1 and 4 (girders spacing parameter) 99
111 L.E.I Figure 5.52 presents the damaged girder L.E.I for bridges with a range of crossbracing spacing. The results for the damaged girder in all bridges, with or without crossbracing, suffer L.E.I values that are well above 100% and as high as 620% when the cross-bracing spacing is small (2.5 m) and the damage angle is large. This means that the presence of close cross-bracing in bridges reduces the ability of the bridge to redistribute live load to areas away from the exterior girder following the occurrence of damage. For the bridge with no bracing or with widely spacing bracing, the largest value of L.E.I is reached when the damage angle is 30 o Damage Angle (Degrees) 5m Dia. 2.5m No Dia. Figure 5.52: L.E.I for damaged girder in bridges 7, 1 and 6 (cross-bracing spacing parameter) Figure 5.53 presents the damaged girder L.E.I for the slab thickness parameter. It is noted that the damaged exterior girder in all the considered bridges with different slab thicknesses suffer L.E.I values that are well above 100% and can be as high as 550% for a 260 mm slab thickness and damage angle equal to 45 o. It is important to note that the role that the slab thickness plays is similar to that of the cross-bracing; they increase the lateral stiffness of the bridge superstructure and, consequently, reduce the ability of the bridge to redistribute live load for the vicinity of damage to other areas away. Note that when the slab thickness becomes large, the L.E.I value keeps increasing with an increase in the damage angle. This is unlike the case of thin deck slabs in which the maximum value of L.E.I for the exterior girder is reached at a damage angle 25 o -30 o. 100
112 L.E.I L.E.I ts= 220 mm 3.0 ts= 180 mm 2.0 ts= 260 mm Damage Angle (Degrees) Figure 5.53: L.E.I for damaged girder in bridges 8, 1 and 9 (slab thickness parameter) Figure 5.54 presents the damaged girder L.E.I for the slab overhang width parameter. The results show that the damaged girder in all the considered bridges suffer L.E.I values that are between 3 and 4 when the damage angle is greater than 15 o. It is interesting to note that as the overhang width increases, the peak value of the L.E.I is reached at a damage angle between 15 o and 30 o. For the minimum considered slab overhang width of 0.75 m, the L.E.I. keeps increases with an increase in the damage angle, although the rate of increase becomes smaller at large values of d= 1.25 m d= 0.75 m d= 2.00 m Damage Angle (Degrees) Figure 5.54: L.E.I for damaged girder in bridges 10, 1 and 11 (slab overhang width parameter) 101
113 L.E.I In order for the findings in this study to be used for different damage scenarios than the one developed in the study, the results of the L.E.I for the exterior girder are again plotted against the ratio of damaged-to-intact moment of inertia of the girder s cross-section. These results are shown in figures 5.55 to 5.59 for the various geometric parameters considered in the study. All of these figures show that the L.E.I value is larger than 1.0, even when the reduction in the moment of inertia due to damage is not significant. Further, the L.E.I increases with a decrease in the moment of inertia of the damaged exterior girder, up to a limit. Thereafter, the high flexibility of the damaged girder starts pushing a lot of the live load away from it L= 40 m L= 20 m L= 60 m (I x ) damaged / (I x ) intact Figure 5.55: L.E.I for damaged girder in bridges 2, 1 and 3 (span length parameter) 102
114 L.E.I L.E.I S= m 3.0 S= 4.5 m 2.0 S= 2.25 m (I x ) damaged / (I x ) intact Figure 5.56: L.E.I for damaged girder in bridges 5, 1 and 4 (girders spacing parameter) (I x ) damaged / (I x ) intact 5m Dia. 2.5m No Dia. Figure 5.57: L.E.I for damaged girder in bridges 7, 1 and 6 (cross-bracing spacing parameter) 103
115 L.E.I L.E.I ts= 220 mm ts= 180 mm ts= 260 mm (I x ) damaged / (I x ) intact Figure 5.58: L.E.I for damaged girder in bridges 8, 1 and 9 (slab thickness parameter) d= 1.25 m d= 0.75 m 1.0 d= 2.00 m (I x ) damaged / (I x ) intact Figure 5.59: L.E.I for damaged girder in bridges 10, 1 and 11 (slab overhang width parameter) 104
116 CHAPTER 6 SUMMARY, CONCLUSIONS AND RECOMMENDATIONS 6.1 Summary Shutting down or even disturbing traffic along a bridge is a critical issue for departments of transportation and public work agencies around the world. Therefore, it is an extremely important decision to reroute traffic around a bridge for the sake of performing damage repair. There are many bridges with inadequate vertical clearance around the world that have been exposed to impact damage by trucks at high speed. Experience has shown that over-height vehicles causing damage to the underside of the exterior girders and cross-bracing system. This type of damage redistributes the live load on the bridge from above among the girders. There are numerous examples that show that such damaged bridges may remain in service for some time before repair work is finally conducted on the structure. This study investigated the effect of minor damage in the exterior girder on the structural response due to live load on composite steel girder bridges. This was done through numerical studies involving finite element modeling with ANSYS of a number of steel girder bridges with consideration of different span lengths, girder spacing, slab thicknesses, cross-bracing spacing, overhang widths, and number of girders. Linearly 105
117 elastic material behavior was utilized since the loading condition in these cases is that of a serviceability criterion, as the damaged girder is often repaired after a short period of time following the next inspection. The finite element model was validated against experimental results on a model bridge from the published literature. Three-dimensional solid elements were used to model the concrete deck slab, while shell elements were utilized for the steel girder top and bottom flanges and web. The cross bracings were modeled by beam elements. The imposed AASHTO truck load was directly applied as point loads on the deck slab. The longitudinal location of the truck on the bridge was governed by the respective load effect under consideration. For flexure, the middle axle of the truck was placed in the longitudinal direction at mid-span, which is the location of the maximum flexural load effect. For shear, the truck s rear axle was located just off the girder support, which in this case is the longitudinal location of maximum shear. In the transverse direction, one or two truck were considered starting from one edge of the bridge closest to the parapet and moving toward the other edge in an incremental manner to capture the maximum live load effect in the various bridge girders. Different extents of damage in the girders were considered, and their effect on the live load distribution factor for the shear and flexure limit states was studied. Based on published field studies, the considered damage in the girders was confined to the bottom flange and lower part of the web of the exterior steel girder, at different distortion angles. The relationship between the load-carrying capacity of the damaged bridge girder to the live load induced in the girder was also investigated. 6.2 Conclusions Based on the results of the analysis in this study, the following conclusions are relevant for steel girder bridges damaged by over-height truck impact: Shear Shear load effect is insignificant to the behavior of composite steel girders after an over-height vehicle collision. This is evident by the negligible live load redistribution among the girders after a damage incident. 106
118 The percentage change in shear GDF for any of the supporting girders in the bridge system does not exceed 5%, even with damage in the external girder corresponding to 45 o damage angle Flexure There is a significant reduction in live load flexural effect in the exterior girder due to the damage that can reach as high as 70% when the damage causes distortion in the bottom half of the steel girder web angle through an angle (designated by damage angle) equal to 45 o. There is a large increase in the live load flexural effect in the first interior girder adjacent to the damaged girder, and minor-to-moderate increase in the same for the second interior girder in the side of the bridge that receives the damage. This increase is in the order of 50-60% for the first interior girder, and 5-15% for the second interior girder. Live load redistribution among the nearby undamaged interior girders due damage in the exterior girder is directly proportional to span length, crossbracing spacing, and deck slab overhang width. This means that as the span length, cross-bracing spacing, and slab overhang width increase, the fraction of live load redistributed to the undamaged interior girders also increase, following an occurrence of damage in the exterior girder. Live load redistribution among the nearby undamaged interior girders due damage in the exterior girder is inversely proportional to the girder spacing and deck slab thickness. This means that as the girder spacing and deck slab thickness increase, the fraction of live load redistributed to the undamaged interior girders decrease, following an occurrence of damage in the exterior girder. The most critical geometric parameter that affects the live redistribution among the undamaged interiors in a bridge subjected to damage in the exterior girder is the deck slab thickness, followed by the deck slab overhang width. 107
119 Although the study showed that live load reduces in the exterior girder following an occurrence of damage, the exterior girder remains a critical structural member in the bridge because its flexural load effect to its flexural capacity ratio increases by many times over the same ratio in an undamaged state. 6.3 Recommendations for Future Studies This thesis has used finite element analysis to investigate the live load effect in simply supported bridges hit by over-height truck impact, causing damage to the underside of the exterior girder. Only shear and bending moment in the supporting composite steel girders were studies. Future research work on the subject shall focus on the following issues: Continuous bridges. Concrete girders. Dead load effect. Dead and live load effect in the deck slab. Other damage models, scenarios (e.g. two damaged girders) and location along the bridge. Dynamic truck load effect during the impact of over-height vehicle collision. 108
120 BIBLIOGRAPHY [1] Harry Shenton and Matthew Dawson, "Evaluation and Rating of Damaged Steel I- Girders," in The 3rd International Conference on Bridge Maintenance, 2006, pp [2] Statesman.com. [Online]. [3] Daily Cognition.com. [Online]. [4] Bedi K. Ashwani, "Study of a Typical Bridge Girder Damaged by Vehicle Impacts," in The Second Forensic Congress, San Juan, 2000, p. 10. [5] INC ANSYS, ANSYS, Academic Research, [6] J. Ambrose, Building Structures.: Wiley-Interscience, [7] Hera.org.nz. [Online]. [8] Transportation Research Board, "Distribution of Wheel Loads on Highway Bridges," NCHRP, no. 187, p. 31, May [9] Toorak Zokaie, "AASHTO-LRFD Live Load Distribution Specifications," Journal of Bridge Engineering, pp , [10] E. Mounir Mabsout, M. Kassim Tarhini, R. Gerald Frederick, and Tayar Charbel, "Finite-Element Analysis of Steel Girder Highway Bridges," Journal of Bridge Engineering, pp , August [11] Chung C. Fu, Ross J. Burhouse, and Gang-Len Chang, "Study of Overheight Vehicle Collisions With Highway Bridges," [12] A. Agrawal and C. Chen, Bridge Vehicle Impact Assessment [Task 1: Problem Background Investigation], [13] A. Martin and J. Mitchell, "Measures to Reduce the Frequency of Over-Height Vehicles Striking Bridges," Department of Transportation, UK,
121 [14] MRC, "5 Span Damage Rate Rising," Michigan Roads and Construction 85, no. 50, p. 3, [15] C. M. Henachey and S. F. Exley, "Overheight Vehicle Warning Systems with Mississippi," ITE, pp , [16] L. R. Feldman, J. O. Jirsa, and E. S. Kowal, "Repair of Bridge Impact Damage," Concrete International 20, no. 2, pp , [17] K. Sennah, D. Cerullo, C. Lam, B. Tharmabala, and A. Fam, "Elastic Behaviour Testing on AASHTO Type-III Bridge Girder Damaged by Vehicle Impact," in Canadian Society for Civil Engineering Annual Conference, vol. v4, 2008, pp [18] Francesco M. Russo, w. Klaiber, and Terry J. Wipf, "Testing of a Damaged Prestressed Concrete Bridge," in Structural Engineering in the 21st Century, 1999, pp [19] Yail J. Kim, Mark F. Green, and Gordon R. Wight, "Live load Distributions on an impact-damaged prestressed concrete girder bridge repaired using prestressed CFRP sheets," vol. 2, no. 13, pp , [20] B. Lee, C. Park, W. Lee, and M. Kim, "Evaluation of Reinforcement Effect of Deteriorated PSC Beam Through Cutting its External Tendons," in The 3rd International Conference on Bridge Maintenance, 2006, pp [21] Hrishikesh Sharma, Stefan Hurlebaus, and Paolo Gardoni, "Development of a Bridge Bumper to Protect Bridge Girders from Overheight Vehicle Impacts," Computer-Aided Civil and Infrastructure Engineering, vol. 6, no. 23, pp , August [22] G. O. Shanafelt and W. B. Horn, "Guidelines for Evaluation and Repair of Damaged Steel Bridge Members," [23] C. Stull, C. Earls, and B. Akinci, "On the Strength and Stability of Slab on Steel I- Girder Bridge Systems Damaged by Truck Strikes," in Annual Stability Conference, 2006, pp [24] Thomas A. Lenox and Celal N. Kostem, "Secondary Member Contribution to the Behavior of Damaged Multigirder Highway Bridges," Computing in Civil and Building Engineering, pp ,
122 [25] Yong-Myung Park, Woom-Do-Ji Joe, Min-Oh Hwang, and Tae-Yang Yoon, "After- Fracture Redundancy in Simple Span Two-Girder Steel Bridge," Structural Engineering and Mechanics, vol. 6, no. 27, pp , December [26] Ashwani K. Bedi, "Study of a Typical Bridge Girder Damaged by Vehicle Impacts," in The Second Forensic Congress, San Juan, 2000, p. 10. [27] Dan Frangopol and Rachid Nakib, "Redundancy in Highway Bridges," Engineering Journal, vol. 1, no. 28, pp , [28] Emily M. Brackmann, "Ultimate Capacity Assessment of Damaged I-Girders," [29] R. Courant, "Variational methods for the solution of problems of equilibrium and vibrations," Math. Soc., vol. 49, pp. 1-23, [30] M.J., Clough, R.W., Martin, H.C., and Topp, L.J. Turner, "Stiffness and deflection analysis of complex structures," Journal of Aeronautical Science, vol. 23, pp , [31] R.W. Clough, "Original formulation of the finite element method," Finite Elements in Analysis and Design, vol. 7, no. 2, pp , November [32] A. Bishara, M. Liu, and N. El Ali, "Wheel Load Distribution on Simply Supported Skew I-Beam Composite Bridges," Journal of Structural Engineering, ASCE, pp , [33] S.W., and Sahajwani, K. Tabsh, "Approximate Analysis of Irregular Highway Bridges," Journal of Bridge Engineering, ASCE, vol. 2, no. 1, pp , February [34] Sami W. Tabsh and Muna Tabatabai, "LiveLoad Distribution In Girder Bridges Subject to Oversized Trucks," Journal of Bridge Engineering, pp. 9-16, [35] C. Eamon and A. Nowak, "Effects of Edge-Stiffening Elements and Diaphragms on Bridge Resistance and Load Distribution," ASCE Journal of Bridge Engineering, pp , [36] W. Chung and E. Sotelino, "Three-Dimensional Finite Element Modeling of Composite Girder Bridges," Engineering Structure, vol. 28, pp , [37] Kalpana Sahajwani, "Analysis of Composite Steel Bridges With Unequal Girder 111
123 Spacings," Department of Civil and Environmental Engineering, University of Houston, Master of Science Thesis Report [38] Shehab Mourad and Sami Tabsh, "Deck Slab Stresses in Integral Abutment Bridges," Journal of Bridge Engineering, ASCE, vol. 4, no. 2, pp , May [39] I. Fang, J. Worley, N. Burns, and R. Klingner, "Behavior of Ontario-Type Bridge Decks on Steel Girders," Austin, Interim FHWA/TX-86/ , [40] American Association of State Highway and Transportation Officials, AASHTO LRFD Bridge Design Specifications., [41] S. W. Tabsh and K. Sahajwani, "Approximate Analysis of Irregular Highway Bridges," Journal of Bridge Engineering, ASCE, vol. 2, no. 1, pp , February [42] INC ANSYS, ANSYS,
124 APPENDIX A EXAMPLES OF BRIDGES DAMAGED BY OVER-HEIGHT VEHICLE COLLISION 113


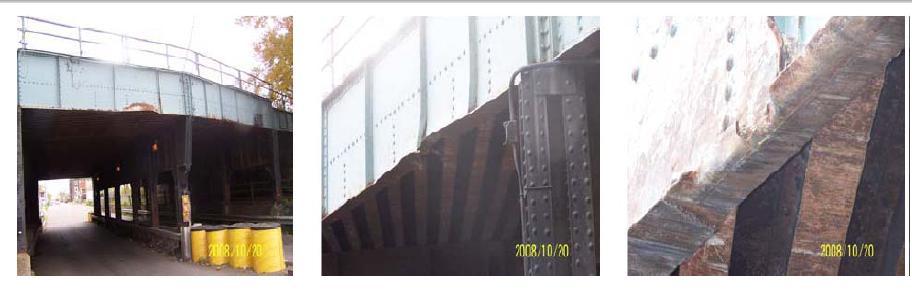
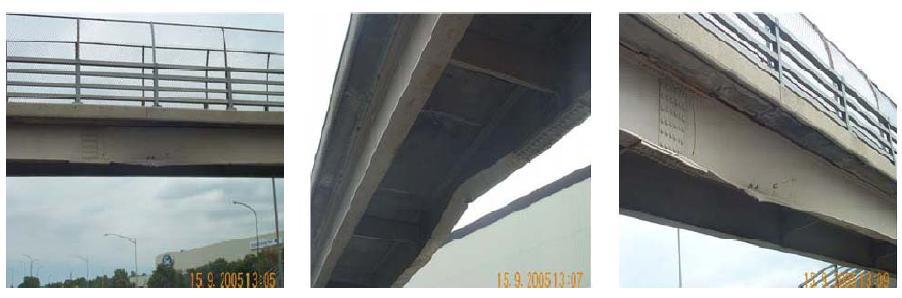
125


126 All images taken from: Agrawal, A., & Chen, C. (2008). Bridge Vehicle Impact Assessment [Task 1: Problem Background Investigation].
CFIRE December 2009
 i BRIDGE ANALYSIS AND EVALUATION OF EFFECTS UNDER OVERLOAD VEHICLES (PHASE 1) CFIRE 02-03 December 2009 National Center for Freight & Infrastructure Research & Education College of Engineering Department
Parametric study on behaviour of box girder bridges using CSi Bridge
 Parametric study on behaviour of box girder bridges using CSi Bridge Kiran Kumar Bhagwat 1, Dr. D. K. Kulkarni 2, Prateek Cholappanavar 3 1Post Graduate student, Dept. of Civil Engineering, SDMCET Dharwad,
2018 LOUISIANA TRANSPORTATION CONFERENCE. Mohsen Shahawy, PHD, PE
 2018 LOUISIANA TRANSPORTATION CONFERENCE Sunday, February 25 - Wednesday, February 28, 2018 DEVELOPMENT OF U-BEAM PRESTRESSED CONCRETE DESIGN STANDARDS Mohsen Shahawy, PHD, PE SDR Engineering Consultants,
UT Lift 1.2. Users Guide. Developed at: The University of Texas at Austin. Funded by the Texas Department of Transportation Project (0-5574)
") UT Lift 1.2 Users Guide Developed at: The University of Texas at Austin Funded by the Texas Department of Transportation Project (0-5574) Spreadsheet Developed by: Jason C. Stith, PhD Project Advisors:
UT Lift 1.2 Users Guide Developed at: The University of Texas at Austin Funded by the Texas Department of Transportation Project (0-5574) Spreadsheet Developed by: Jason C. Stith, PhD Project Advisors:
Analysis Methods for Skewed Structures. Analysis Types: Line girder model Crossframe Effects Ignored
 Analysis Methods for Skewed Structures D Finite Element Model Analysis Types: Line girder model Crossframe Effects Ignored MDX Merlin Dash BSDI StlBridge PC-BARS Others Refined model Crossframe Effects
EXPERIMENTAL STUDY ON EFFECTIVENESS OF SHEAR STRENGTHENING OF RC BEAMS WITH CFRP SHEETS
 EXPERIMENTAL STUDY ON EFFECTIVENESS OF SHEAR STRENGTHENING OF RC BEAMS WITH CFRP SHEETS Yasuhiro Koda and Ichiro Iwaki Dept. of Civil Eng., College of Eng., Nihon University, Japan Abstract This research
Comparison of T-Beam Girder Bridge with Box Girder Bridge for Different Span Conditions.
 The International Journal of Engineering and Science (IJES) ISSN (e): 2319 1813 ISSN (p): 23-19 1805 Pages PP 67-71 2018 Comparison of T-Beam Girder Bridge with Box Girder Bridge for Different Span Conditions.
Transverse Distribution Calculation and Analysis of Strengthened Yingjing Bridge
 Modern Applied Science; Vol. 8, No. 3; 4 ISSN 93-844 E-ISSN 93-85 Published by Canadian Center of Science and Education Transverse Distribution Calculation and Analysis of Strengthened Yingjing Bridge
Case Study of Bridge Load Rating in KY using BrR. C.Y. Yong, P.E., S.E., ENV-SP
 Case Study of Bridge Load Rating in KY using BrR C.Y. Yong, P.E., S.E., ENV-SP Project Overview Choosing the Right Tool Validation Challenges Conclusions Outline KY Bridge Load Rating Horizontally curved
Influence of cross beam spacing on load distribution factor at girder bridges
 Influence of cross beam spacing on load distribution factor at girder bridges * Hyo-Gyoung Kwak 1) and Joung Rae Kim 2) 1), 2) Department of Civil Engineering, KAIST, Daejeon 305-600, Korea 1) kwakhg@kaist.ac.kr
Plate Girder and Stiffener
 Plate Girder and Stiffener (Gelagar Pelat dan Pengaku) Dr. AZ Department of Civil Engineering Brawijaya University Introduction These girders are usually fabricated from welded plates and thus are called
RESILIENT INFRASTRUCTURE June 1 4, 2016
 RESILIENT INFRASTRUTURE June 1 4, 2016 RE-TESTING OF A FIRE-DAMAGED RIDGE Alexander M.. Au, Senior ridge Engineer, Highway Standards ranch, Ontario Ministry of Transportation, anada ASTRAT A proof load
2. Runway & Crane System
 2. Runway & Crane System The crane runway girders, crane, columns and building frames can all be regarded as components of the overall crane installation. The individual components cannot be designed in
Impact of Heavy Loads on State and Parish Bridges. Aziz Saber, Ph.D., P.E. Program Chair Civil Engineering Louisiana Tech University
 Impact of Heavy Loads on State and Parish Bridges Aziz Saber, Ph.D., P.E. Program Chair Civil Engineering Louisiana Tech University Acknowledgement Funds from Louisiana Transportation Research Center LA
Review of Overhead Crane and Analysis of Components Depending on Span
 Review of Overhead Crane and Analysis of Components Depending on Span Omkar K. Sakurikar 1, D.V. Kushare 2 1Student, Department of Mechanical Engineering, N.D.M.V.P.S K.B.T. College of Engineering, Nashik,
Performance Based Design for Bridge Piers Impacted by Heavy Trucks
 Performance Based Design for Bridge Piers Impacted by Heavy Trucks Anil K. Agrawal, Ph.D., P.E., Ran Cao and Xiaochen Xu The City College of New York, New York, NY Sherif El-Tawil, Ph.D. University of
TITLE: EVALUATING SHEAR FORCES ALONG HIGHWAY BRIDGES DUE TO TRUCKS, USING INFLUENCE LINES
 EGS 2310 Engineering Analysis Statics Mock Term Project Report TITLE: EVALUATING SHEAR FORCES ALONG HIGHWAY RIDGES DUE TO TRUCKS, USING INFLUENCE LINES y Kwabena Ofosu Introduction The impact of trucks
Stress Analysis in Pulley of Stacker-Reclaimer by Using Fem Vs Analytical
 Stress Analysis in Pulley of Stacker-Reclaimer by Using Fem Vs Analytical X. Oscar fenn Daniel 1, A. Hussain lal 2 PG. Scholar, Department of Mechanical Engineering,, JJ College of Engineering and Technology,
Live Load Distribution in Multi-Cell Box-Girder Bridges and its Comparison with Current AASHTO LRFD Bridge Design Specifications
 Live Load Distribution in Multi-Cell Box-Girder Bridges and its Comparison with Current AASHTO LRFD Bridge Design Specifications by Rob Y.H. Chai, Eddy Shin-Tai Song & Karl M. Romstad Department of Civil
USING NSBA S LRFD SIMON SOFTWARE FOR PRELIMINARY DESIGN OF A CURVED HAUNCHED STEEL PLATE GIRDER BRIDGE
 USING NSBA S LRFD SIMON SOFTWARE FOR PRELIMINARY DESIGN OF A CURVED HAUNCHED STEEL PLATE GIRDER BRIDGE THOMAS DENSFORD BIOGRAPHY Thomas Densford, P.E. is a Sr. Principal Engineer with the firm Fay, Spofford
Assessing the needs for intermediate diaphragms in prestressed concrete girder bridges
 Louisiana State University LSU Digital Commons LSU Master's Theses Graduate School 2005 Assessing the needs for intermediate diaphragms in prestressed concrete girder bridges Anand Kumar Chandolu Louisiana
Simulating Rotary Draw Bending and Tube Hydroforming
 Abstract: Simulating Rotary Draw Bending and Tube Hydroforming Dilip K Mahanty, Narendran M. Balan Engineering Services Group, Tata Consultancy Services Tube hydroforming is currently an active area of
Reducing the Structural Mass of a Real- World Double Girder Overhead Crane
 Reducing the Structural Mass of a Real- World Double Girder Overhead Crane V.V. Arun Sankar 1, K.Sudha 2, G.Gnanakumar 3, V.Kavinraj 4 Assistant Professor, Karpagam College of Engineering, Coimbatore,
Comparison of Live Load Effects for the Design of Bridges
 J. Environ. Treat. Tech. ISSN: 2309-1185 Journal weblink: http://www.jett.dormaj.com Comparison of Live Load Effects for the Design of Bridges I. Shahid 1, S. H. Farooq 1, A.K. Noman 2, A. Arshad 3 1-Associate
DESIGN AND OPTIMIZATION OF HTV FUEL TANK ASSEMBLY BY FINITE ELEMENT ANALYSIS
 DESIGN AND OPTIMIZATION OF HTV FUEL TANK ASSEMBLY BY FINITE ELEMENT ANALYSIS GAJENDRA G 1, PRAKASHA A M 2, DR NOOR AHMED R 3, DR.K.S.BADRINARAYAN 4 1PG Scholar, Mechanical department, M S Engineering College,
Probability based Load Rating
 Probability based Load Rating Dennis R. Mertz, Ph.D., P.E. Center for Innovative Bridge Engineering University of Delaware Fundamentals of LRFR Part 1 Introduction to Load Rating of Highway Bridges 1-2
D1.3 FINAL REPORT (WORKPACKAGE SUMMARY REPORT)
") WP 1 D1.3 FINAL REPORT (WORKPACKAGE SUMMARY REPORT) Project Acronym: Smart RRS Project Full Title: Innovative Concepts for smart road restraint systems to provide greater safety for vulnerable road users.
WP 1 D1.3 FINAL REPORT (WORKPACKAGE SUMMARY REPORT) Project Acronym: Smart RRS Project Full Title: Innovative Concepts for smart road restraint systems to provide greater safety for vulnerable road users.
Live-Load Test and Finite-Model Analysis of an Integral Abutment Concrete Girder Bridge
 Utah State University DigitalCommons@USU All Graduate Theses and Dissertations Graduate Studies 5-2013 Live-Load Test and Finite-Model Analysis of an Integral Abutment Concrete Girder Bridge Robert W.
INTERNATIONAL JOURNAL OF APPLIED ENGINEERING RESEARCH, DINDIGUL Volume 1, No 4, 2011
 Numerical modal analysis of Howell Bunger valve using FEM method Farid Vakili Tahami, Mohammad Zehsaz, Mohammad Ali Saeimi Sadigh, Amin Paykani Department of Mechanical Engineering, University of Tabriz,
The FRACOF Composite Slab Test
 The FRACOF Composite Slab Test Experiment, Predictions & Results Anthony Abu & Ian Burgess Fire Resistance Assessment of partially protected COmposite Floors - FRACOF Introduction To increase the use of
Workshop Agenda. I. Introductions II. III. IV. Load Rating Basics General Equations Load Rating Procedure V. Incorporating Member Distress VI.
 Workshop Agenda I. Introductions II. III. IV. Load Rating Basics General Equations Load Rating Procedure V. Incorporating Member Distress VI. Posting, SHV s and Permitting VII. Load Rating Example #1 Simple
Design and Stress Analysis of Crankshaft for Single Cylinder 4-Stroke Diesel Engine
 Design and Stress Analysis of Crankshaft for Single Cylinder 4-Stroke Diesel Engine Amit Solanki #1, Jaydeepsinh Dodiya #2, # Mechanical Engg.Deptt, C.U.Shah University, Wadhwan city, Gujarat, INDIA Abstract
Finite Element Analysis of Clutch Piston Seal
 Finite Element Analysis of Clutch Piston Seal T. OYA * F. KASAHARA * *Research & Development Center Tribology Research Department Three-dimensional finite element analysis was used to simulate deformation
Traffic Signal Volume Warrants A Delay Perspective
 Traffic Signal Volume Warrants A Delay Perspective The Manual on Uniform Traffic Introduction The 2009 Manual on Uniform Traffic Control Devices (MUTCD) Control Devices (MUTCD) 1 is widely used to help
DEVELOPING AN ASSESSMENT CRITERION FOR MEDIUM-TERM AXLE LOAD BRIDGE CAPACITY IN MALAYSIA. S.K. Ng Evenfit Consult Sdn Bhd MALAYSIA
 DEVEOPING AN ASSESSMENT CRITERION FOR MEDIUM-TERM AXE OAD BRIDGE CAPACITY IN MAAYSIA C.C. im Public Works Department MAAYSIA S.K. Ng Evenfit Consult Sdn Bhd MAAYSIA Z. Jasmani Zeca Consult Sdn Bhd MAAYSIA
Applicability for Green ITS of Heavy Vehicles by using automatic route selection system
 Applicability for Green ITS of Heavy Vehicles by using automatic route selection system Hideyuki WAKISHIMA *1 1. CTI Enginnering Co,. Ltd. 3-21-1 Nihonbashi-Hamacho, Chuoku, Tokyo, JAPAN TEL : +81-3-3668-4698,
Development and Validation of a Finite Element Model of an Energy-absorbing Guardrail End Terminal
 Development and Validation of a Finite Element Model of an Energy-absorbing Guardrail End Terminal Yunzhu Meng 1, Costin Untaroiu 1 1 Department of Biomedical Engineering and Virginia Tech, Blacksburg,
4.5 COMPOSITE STEEL AND CONCRETE
 4.5 COMPOSITE STEEL AND CONCRETE 4.5.1 RULES OF THUMB 4.5 Composite Steel and Concrete (1/11) Typical starting point Overall concrete depth 130mm (Grade 30) Depth of profiled decking 60mm Size beam with
A COMPARATIVE STUDY OF LIVE LOADS FOR THE DESIGN OF HIGHWAY BRIDGES IN PAKISTAN
 International Journal of Bridge Engineering (IJBE), Vol. 4, No. 3, (2016), pp. 49-60 A COMPARATIVE STUDY OF LIVE LOADS FOR THE DESIGN OF HIGHWAY BRIDGES IN PAKISTAN Muhammad Adeel Arshad University of
US 191 Load Rating Past and Present. By Ron Pierce, P.E.,S.E., CBI David Evans & Associates Bridge Operations Services Practice Leader
 US 191 Load Rating Past and Present By Ron Pierce, P.E.,S.E., CBI David Evans & Associates Bridge Operations Services Practice Leader Inspection Experience Bridge Inspection with Idaho Transportation Department
DeltaStud - Lightweight Steel Framing
 DeltaStud - Lightweight Steel Framing B C H A t P Load Tables for Wind Bearing and Combined Wind & Axial Load Bearing Condition January 2014 Table of Contents Commentary Introduction...3 Product Identification...3
Monitoring of Shoring Pile Movement using the ShapeAccel Array Field
 2359 Royal Windsor Drive, Unit 25 Mississauga, Ontario L5J 4S9 t: 905-822-0090 f: 905-822-7911 monir.ca Monitoring of Shoring Pile Movement using the ShapeAccel Array Field Abstract: A ShapeAccel Array
Modal analysis of Truck Chassis Frame IJSER
 Modal analysis of Truck Chassis Frame 158 Shubham Bhise 1, Vaibhav Dabhade 1, Sujit Pagi 1, Apurvi Veldandi 1. 1 B.E. Student, Dept. of Automobile Engineering, Saraswati College of Engineering, Navi Mumbai,
Racing Tires in Formula SAE Suspension Development
 The University of Western Ontario Department of Mechanical and Materials Engineering MME419 Mechanical Engineering Project MME499 Mechanical Engineering Design (Industrial) Racing Tires in Formula SAE
STATIC AND FATIGUE ANALYSIS OF LEAF SPRING-AS A REVIEW
 STATIC AND FATIGUE ANALYSIS OF LEAF SPRING-AS A REVIEW Vishal Gavali 1, Mahesh Jadhav 2, Digambar Zoman 3 1,2, 3 Mechanical Engineering Department, LGNSCOE Anjaneri Nashik,(India) ABSTRACT In engineering
Chapter 10 Parametric Studies
 Chapter 10 Parametric Studies 10.1. Introduction The emergence of the next-generation high-capacity commercial transports [51 and 52] provides an excellent opportunity to demonstrate the capability of
The effectiveness of CFRP strengthening of steel plate girders with web opening subjected to shear
 BCEE3-07 https://doi.org/.5/matecconf/086040 The effectiveness of CFRP strengthening of steel plate girders with web opening subjected to shear Mohammed Hamood,*, Wael AbdulSahib, and Ali Abdullah Building
Test Based Optimization and Evaluation of Energy Efficient Driving Behavior for Electric Vehicles
 Test Based Optimization and Evaluation of Energy Efficient Driving Behavior for Electric Vehicles Bachelorarbeit Zur Erlangung des akademischen Grades Bachelor of Science (B.Sc.) im Studiengang Wirtschaftsingenieur
CAE Analysis of Passenger Airbag Bursting through Instrumental Panel Based on Corpuscular Particle Method
 CAE Analysis of Passenger Airbag Bursting through Instrumental Panel Based on Corpuscular Particle Method Feng Yang, Matthew Beadle Jaguar Land Rover 1 Background Passenger airbag (PAB) has been widely
EXPERIMENTAL AND FINITE ELEMENT ANALYSIS OF SKEW GIRDER BRIDGES RAVINDRA SWAROOP. Department of Applied Mechanics. Submitted
 EXPERIMENTAL AND FINITE ELEMENT ANALYSIS OF SKEW GIRDER BRIDGES RAVINDRA SWAROOP Department of Applied Mechanics Submitted in fulfilment of the requirements of the degree of Doctor of Philosophy to the
NUMERICAL ANALYSIS OF IMPACT BETWEEN SHUNTING LOCOMOTIVE AND SELECTED ROAD VEHICLE
 Journal of KONES Powertrain and Transport, Vol. 21, No. 4 2014 ISSN: 1231-4005 e-issn: 2354-0133 ICID: 1130437 DOI: 10.5604/12314005.1130437 NUMERICAL ANALYSIS OF IMPACT BETWEEN SHUNTING LOCOMOTIVE AND
A Proposed Modification of the Bridge Gross Weight Formula
 14 MID-CONTINENT TRANSPORTATION SYMPOSIUM PROCEEDINGS A Proposed Modification of the Bridge Gross Weight Formula CARL E. KURT A study was conducted using 1 different truck configurations and the entire
VEHICLE ANTI-ROLL BAR ANALYZED USING FEA TOOL ANSYS
 VEHICLE ANTI-ROLL BAR ANALYZED USING FEA TOOL ANSYS P. M. Bora 1, Dr. P. K. Sharma 2 1 M. Tech. Student,NIIST, Bhopal(India) 2 Professor & HOD,NIIST, Bhopal(India) ABSTRACT The aim of this paper is to
Load Analysis and Multi Body Dynamics Analysis of Connecting Rod in Single Cylinder 4 Stroke Engine
 IJSRD - International Journal for Scientific Research & Development Vol. 3, Issue 08, 2015 ISSN (online): 2321-0613 Load Analysis and Multi Body Dynamics Analysis of Connecting Rod in Single Cylinder 4
Regulatory Treatment Of Recoating Costs
 Regulatory Treatment Of Recoating Costs Prepared for the INGAA Foundation, Inc., by: Brown, Williams, Scarbrough & Quinn, Inc. 815 Connecticut Ave., N.W. Suite 750 Washington, DC 20006 F-9302 Copyright
Comparative Study on Super Structure of Box Girder Bridge and Cable Stayedbridge with Extra Dosed Bridge
 International Journal of Engineering Science Invention (IJESI) ISSN (Online): 2319 6734, ISSN (Print): 2319 6726 Volume 7 Issue 5 Ver. II May 2018 PP 21-26 Comparative Study on Super Structure of Box Girder
Chapter 7: Thermal Study of Transmission Gearbox
 Chapter 7: Thermal Study of Transmission Gearbox 7.1 Introduction The main objective of this chapter is to investigate the performance of automobile transmission gearbox under the influence of load, rotational
FDOT S CRITERIA FOR WIND ON PARTIALLY CONSTRUCTED BRIDGES
 FDOT S CRITERIA FOR WIND ON PARTIALLY CONSTRUCTED BRIDGES DENNIS GOLABEK CHRISTINA FREEMAN BIOGRAPHY Mr. Golabek has recently joined Kisinger Campo & Associates and is the Chief Structures Engineer. He
NUMERICAL ANALYSIS OF LOAD DISTRIBUTION IN RAILWAY TRACK UNDER WHEELSET
 Journal of KONES Powertrain and Transport, Vol., No. 3 13 NUMERICAL ANALYSIS OF LOAD DISTRIBUTION IN RAILWAY TRACK UNDER WHEELSET Piotr Szurgott, Krzysztof Berny Military University of Technology Department
Rotorcraft Gearbox Foundation Design by a Network of Optimizations
 13th AIAA/ISSMO Multidisciplinary Analysis Optimization Conference 13-15 September 2010, Fort Worth, Texas AIAA 2010-9310 Rotorcraft Gearbox Foundation Design by a Network of Optimizations Geng Zhang 1
PIPE WHIP RESTRAINTS - PROTECTION FOR SAFETY RELATED EQUIPMENT OF WWER NUCLEAR POWER PLANTS
 IAEA-CN-155-009P PIPE WHIP RESTRAINTS - PROTECTION FOR SAFETY RELATED EQUIPMENT OF WWER NUCLEAR POWER PLANTS Z. Plocek a, V. Kanický b, P. Havlík c, V. Salajka c, J. Novotný c, P. Štěpánek c a The Dukovany
Effect of Police Control on U-turn Saturation Flow at Different Median Widths
 Effect of Police Control on U-turn Saturation Flow at Different Widths Thakonlaphat JENJIWATTANAKUL 1 and Kazushi SANO 2 1 Graduate Student, Dept. of Civil and Environmental Eng., Nagaoka University of
Live load distribution factors for multi-span girder bridges with plank decking subjected to farm vehicles
 Graduate Theses and Dissertations Graduate College 2015 Live load distribution factors for multi-span girder bridges with plank decking subjected to farm vehicles Chandra Teja Kilaru Iowa State University
KEYWORDS: ANSYS, Clamping effects, Leaf spring, Pro-E. International Journal of Computational Engineering Research Vol, 03 Issue, 10
 International Journal of Computational Engineering Research Vol, 03 Issue, 10 Leaf Spring Analysis with Eyes Using FEA B.Mahesh Babu 1, D.Muralidhar Yadav 2, N.Ramanaiah 3 1 Assistant Professor, Dr.Samuel
Design principles and Assumptions
 Design principles and Assumptions The design and use of concrete slabs that utilise ARMOURDECK 300 in composite construction may be carried out using either: the relevant Australian and international Standards
101 st T.H.E. Conference February 24,2015
 101 st T.H.E. Conference February 24,2015 Design & Construction of Skewed & Curved I-Girder Bridges How Do These Bridges FIT Together? Steel: The Bridge Material of Choice National Steel Bridge Alliance
FINITE ELEMENT METHOD IN CAR COMPATIBILITY PHENOMENA
 Journal of KONES Powertrain and Transport, Vol. 18, No. 4 2011 FINITE ELEMENT METHOD IN CAR COMPATIBILITY PHENOMENA Marcin Lisiecki Technical University of Warsaw Faculty of Power and Aeronautical Engineering
Constructability Testing of Folded Plate Girders
 University of Nebraska - Lincoln DigitalCommons@University of Nebraska - Lincoln Civil Engineering Theses, Dissertations, and Student Research Civil Engineering Summer 8-3-2010 Constructability Testing
Master of Engineering
 STUDIES OF FAULT CURRENT LIMITERS FOR POWER SYSTEMS PROTECTION A Project Report Submitted in partial fulfilment of the requirements for the Degree of Master of Engineering In INFORMATION AND TELECOMMUNICATION
Behavior & Design. Curved Girder. Curved Steel Girder Bridges. PDF Created with deskpdf PDF Writer - Trial ::
 Curved Steel Girder Bridges Curved Girder Behavior & Design Curved Steel Girder Design L1 L2 OUTSIDE GIRDER CROSS FRAME d C L PIER C L ABUT CL ABUT RADIUS INSIDE GIRDER CURVED BRIDGE - PLAN VIEW Crossframe
Design Modification and Optimization of Trolley in an Off-Bearer Mechanism Present In Concrete Block Making Machines
 Design Modification and Optimization of Trolley in an Off-Bearer Mechanism Present In Concrete Block Making Machines Aravindhan. V 1, Anantha Krishnan. P 2 1,2Final Year UG Students, Dept. of Mechanical
Cost Benefit Analysis of Faster Transmission System Protection Systems
 Cost Benefit Analysis of Faster Transmission System Protection Systems Presented at the 71st Annual Conference for Protective Engineers Brian Ehsani, Black & Veatch Jason Hulme, Black & Veatch Abstract
Quantifying Annual Bridge Cost by Overweight Trucks in South Carolina
 Clemson University TigerPrints All Theses Theses 5-2013 Quantifying Annual Bridge Cost by Overweight Trucks in South Carolina Linbo Chen Clemson University, linboc@clemson.edu Follow this and additional
MIKLOS Cristina Carmen, MIKLOS Imre Zsolt UNIVERSITY POLITEHNICA TIMISOARA FACULTY OF ENGINEERING HUNEDOARA ABSTRACT:
 1 2 THEORETICAL ASPECTS ABOUT THE ACTUAL RESEARCH CONCERNING THE PHYSICAL AND MATHEMATICAL MODELING CATENARY SUSPENSION AND PANTOGRAPH IN ELECTRIC RAILWAY TRACTION MIKLOS Cristina Carmen, MIKLOS Imre Zsolt
Analysis of Eclipse Drive Train for Wind Turbine Transmission System
 ISSN 2395-1621 Analysis of Eclipse Drive Train for Wind Turbine Transmission System #1 P.A. Katre, #2 S.G. Ganiger 1 pankaj12345katre@gmail.com 2 somu.ganiger@gmail.com #1 Department of Mechanical Engineering,
Development of a Finite Element Model of a Motorcycle
 Development of a Finite Element Model of a Motorcycle N. Schulz, C. Silvestri Dobrovolny and S. Hurlebaus Texas A&M Transportation Institute Abstract Over the past years, extensive research efforts have
Accepted for the Council:
 To the Graduate Council: I am submitting herewith a dissertation written by David P. Chapman entitled Evaluation of Experimental Bridges in Tennessee. I have examined the final electronic copy of this
Drop Simulation for Portable Electronic Products
 8 th International LS-DYNA Users Conference Drop/Impact Simulations Drop Simulation for Portable Electronic Products Raymon Ju and Brian Hsiao Flotrend Co., Taipei, Taiwan Abstract The portable electronic
Modeling the Lithium-Ion Battery
 Modeling the Lithium-Ion Battery Dr. Andreas Nyman, Intertek Semko Dr. Henrik Ekström, Comsol The term lithium-ion battery refers to an entire family of battery chemistries. The common properties of these
Increase Factor of Safety of Go-Kart Chassis during Front Impact Analysis
 IJIRST International Journal for Innovative Research in Science & Technology Volume 3 Issue 04 September 2016 ISSN (online): 2349-6010 Increase Factor of Safety of Go-Kart Chassis during Front Impact Analysis
MODELING SUSPENSION DAMPER MODULES USING LS-DYNA
 MODELING SUSPENSION DAMPER MODULES USING LS-DYNA Jason J. Tao Delphi Automotive Systems Energy & Chassis Systems Division 435 Cincinnati Street Dayton, OH 4548 Telephone: (937) 455-6298 E-mail: Jason.J.Tao@Delphiauto.com
Use of Flow Network Modeling for the Design of an Intricate Cooling Manifold
 Use of Flow Network Modeling for the Design of an Intricate Cooling Manifold Neeta Verma Teradyne, Inc. 880 Fox Lane San Jose, CA 94086 neeta.verma@teradyne.com ABSTRACT The automatic test equipment designed
Dynamic characteristics of railway concrete sleepers using impact excitation techniques and model analysis
 Dynamic characteristics of railway concrete sleepers using impact excitation techniques and model analysis Akira Aikawa *, Fumihiro Urakawa *, Kazuhisa Abe **, Akira Namura * * Railway Technical Research
INME 4011 Term Project Guideline
 INME 4011 Term Project Guideline Each team consists of four students (maximum). The projects are described in the attached document. First part of the project includes the calculation of the shaft diameter
Conventional Approach
 Session 6 Jack Broz, PE, HR Green May 5-7, 2010 Conventional Approach Classification required by Federal law General Categories: Arterial Collector Local 6-1 Functional Classifications Changing Road Classification
Improvement of Vehicle Dynamics by Right-and-Left Torque Vectoring System in Various Drivetrains x
 Improvement of Vehicle Dynamics by Right-and-Left Torque Vectoring System in Various Drivetrains x Kaoru SAWASE* Yuichi USHIRODA* Abstract This paper describes the verification by calculation of vehicle
1. Thank you for the opportunity to comment on the Low Emissions Economy Issues Paper ( Issues Paper ).
.") 20 September 2017 Low-emissions economy inquiry New Zealand Productivity Commission PO Box 8036 The Terrace Wellington 6143 info@productivity.govt.nz Dear Commission members, Re: Orion submission on Low
20 September 2017 Low-emissions economy inquiry New Zealand Productivity Commission PO Box 8036 The Terrace Wellington 6143 info@productivity.govt.nz Dear Commission members, Re: Orion submission on Low
Post-Tensioned Concrete U-Girder Design. Midas Elite Speaker Series. Doug Midkiff, PE AECOM
 Post-Tensioned Concrete U-Girder Midas Elite Speaker Series Doug Midkiff, PE AECOM POST-TENSIONED CONCRETE U-GIRDER BRIDGE DESIGN (I-49 LAFAYETTE CONNECTOR) Doug Midkiff Structural Engineer III AECOM E
Fatigue Life Estimation of Chassis Frame FESM Bracket for Commercial Vehicle
 Fatigue Life Estimation of Chassis Frame FESM Bracket for Commercial Vehicle Shivakumar M.M 1, Nirmala L 2 ¹M-Tech Student, Dept. of Mechanical Engineering,K.S Institute of Technology, Bangalore, India
MAXIMUM HORIZONTAL LONGITUDINAL FORCE DUE TO CRANE LOADING USING A COUPLED APPROACH
 MAXIMUM HORIZONTAL LONGITUDINAL FORCE DUE TO CRANE LOADING USING A COUPLED APPROACH Trevor Neville Haas Department of Civil Engineering, Stellenbosch University, Stellenbosch, South Africa ABSTRACT Horizontal
Passive Vibration Reduction with Silicone Springs and Dynamic Absorber
 Available online at www.sciencedirect.com Physics Procedia 19 (2011 ) 431 435 International Conference on Optics in Precision Engineering and Nanotechnology 2011 Passive Vibration Reduction with Silicone
A Cost Benefit Analysis of Faster Transmission System Protection Schemes and Ground Grid Design
 A Cost Benefit Analysis of Faster Transmission System Protection Schemes and Ground Grid Design Presented at the 2018 Transmission and Substation Design and Operation Symposium Revision presented at the
Design And Development Of Roll Cage For An All-Terrain Vehicle
 Design And Development Of Roll Cage For An All-Terrain Vehicle Khelan Chaudhari, Amogh Joshi, Ranjit Kunte, Kushal Nair E-mail : khelanchoudhary@gmail.com, amogh_4291@yahoo.co.in,ranjitkunte@gmail.com,krockon007@gmail.com
Abstract. 1. Introduction. 1.1 object. Road safety data: collection and analysis for target setting and monitoring performances and progress
 Road Traffic Accident Involvement Rate by Accident and Violation Records: New Methodology for Driver Education Based on Integrated Road Traffic Accident Database Yasushi Nishida National Research Institute
USING INSPIRE AS AN UPFRONT DESIGN, OPTIMIZATION & SIMULATION TOOL FOR EXISITNG MANUAL GEARBOX COMPONENTS
 USING INSPIRE AS AN UPFRONT DESIGN, OPTIMIZATION & SIMULATION TOOL FOR EXISITNG MANUAL GEARBOX COMPONENTS Lokesh Kumar Gupta Manager Drive Line Eicher Polaris Plot- SP1 & 2, Kukas Jaipur India 302028 Lkgupta@eicherpolaris.in
Replacing Through Girder Bridges Jones Road over Route 4
 Replacing Through Girder Bridges Jones Road over Route 4 Why did they build Thru-Girder Bridges anyway? Through Girder (Thru-Girder) bridge actually have a lot of advantages: Easy to build- very few moving
White Paper. Phone: Fax: Advance Lifts, Inc. All rights reserved.
 White Paper TURNTABLE AppLicATioN GUidE This section covers the full range of turntables manufactured by Advance Lifts. The basic information necessary to select an appropriate turntable for an application
Hydro Plant Risk Assessment Guide
 September 2006 Hydro Plant Risk Assessment Guide Appendix E8: Battery Condition Assessment E8.1 GENERAL Plant or station batteries are key components in hydroelectric powerplants and are appropriate for
Crashworthiness Evaluation of an Impact Energy Absorber in a Car Bumper for Frontal Crash Event - A FEA Approach
 Crashworthiness Evaluation of an Impact Energy Absorber in a Car Bumper for Frontal Crash Event - A FEA Approach Pravin E. Fulpagar, Dr.S.P.Shekhawat Department of Mechanical Engineering, SSBTS COET Jalgaon.
New Frontier in Energy, Engineering, Environment & Science (NFEEES-2018 ) Feb
 Feb") RESEARCH ARTICLE OPEN ACCESS DESIGN AND IMPACT ANALYSIS OF A ROLLCAGE FOR FORMULA HYBRID VEHICLE Aayush Bohra 1, Ajay Sharma 2 1(Mechanical department, Arya College of Engineering & I.T.,kukas, Jaipur)
RESEARCH ARTICLE OPEN ACCESS DESIGN AND IMPACT ANALYSIS OF A ROLLCAGE FOR FORMULA HYBRID VEHICLE Aayush Bohra 1, Ajay Sharma 2 1(Mechanical department, Arya College of Engineering & I.T.,kukas, Jaipur)