Transmission Planning for Wind Energy Resources in the Eastern United States. Dale Osborn
|
|
|
- Julianna Jordan
- 5 years ago
- Views:
Transcription
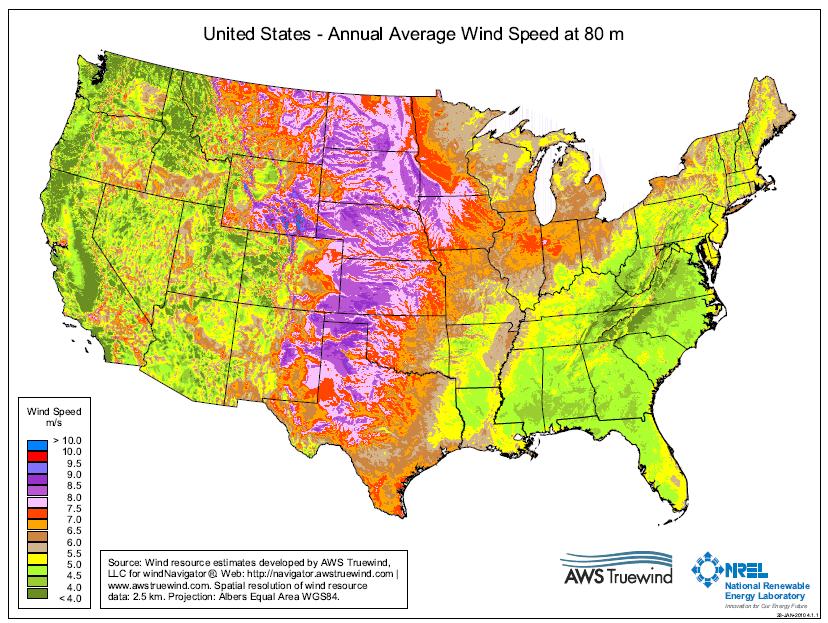
1 Transmission Planning for Wind Energy Resources in the Eastern United States Dale Osborn
2 Layered Design Typical utility planning Distribution delivery to loads Lower voltage transmission delivery from transmission and local Higher voltage transmission bulk energy delivery from base load generation and some interconnections. Regional transmission ( RTO) market delivery How does an energy market work What is an RTO Interconnection transmission market to market delivery
3 Possible layers to consider Individual utility Standard power flow and stability studies for planning More off peak studies Regional northern Africa collector system Economic studies to determine transmission Need databases to model Interconnection European market access Economic studies to determine transmission Capacity delivery Energy delivery Need databases to model
4 Rule of three for a new high voltage overlay One higher voltage line will not be economical generally due to the ability due to low levels of precontingent loadings due to the ability of the underlying system to withstand the outage of the line. Two higher voltage lines that can back up the contingent loss of the other generally break even with lower voltage alternatives. Three higher voltage lines that can back up the contingent loss of one other are generally economically superior to lower voltage alternatives. Economical loading levels must be possible on the higher voltage expansion
5
6 UMTDI Scenario B Plus Illinois Zones UMTDI Upper Midwest Transmission Development Initiative 6

7 Long Range Coordination with Other RTO s And Utilities Joint Coordinated System Planning Study Operations conditions for generation mix and characteristics


8 Eastern Wind Integration Transmission Study Overlays Scenario :11 Scenario :1 Scenario :1 Scenario :1 EIWTS Technical Review Committee Webinar October 2, 2009
9
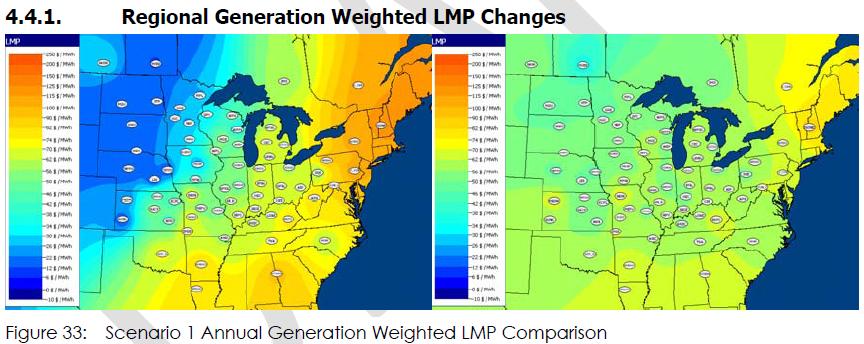
10 Potential Benefits Adjusted Production Costs $35B/Yr E_CAN 12% IMO 3% PJM 14% NYISO 13% ISO-NE 10% SERCNI 25% MISO 10% MHEB 3% TVASUB 6% SPP 4% MAPP 0% 10

11 Loop Flow Patterns Interface AC Flows without an Overlay Interface Flows with an Overlay including HVDC

12 Price and Quantity of Sources and Sinks Determine Transmission Requirements
13 West to East Interface Flows OH-PA MW Jan Feb Mar Apr May Jun Jul Aug Sep Oct Nov Dec Hour of the Year
14 Transmission Overlay Design Workshop Example Interface Flow Duration Curve Transmission Capacity designed to deliver 80% of desired energy flow Hours WAPA-MINN MW Flow
15 $/Mw-Mile 4,000 3,600 3,200 2,800 2,400 2,000 1,600 1, Transmission and Substation Costs per Mw-mile by Transmission Voltage And Type of Construction 345 kv Steel Wooded Areas 2-345kkV on Steel Lowest cost options 500 kv 765 kv 765 HSIL 800 kv GIL 1200 mile- 800kV HVDC Target typical planned loading Mw, use economics to choose voltage
16
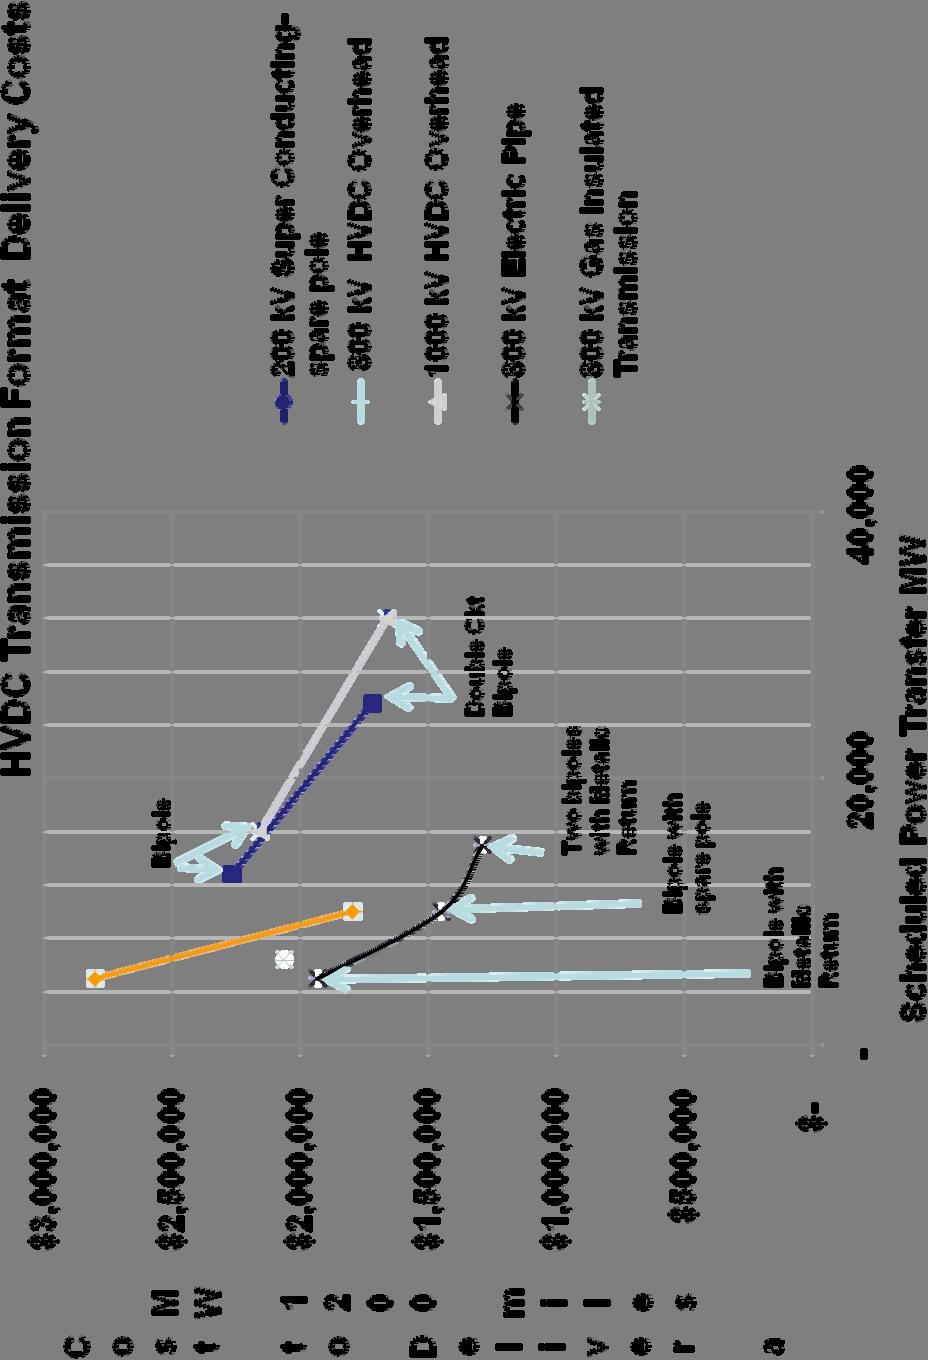
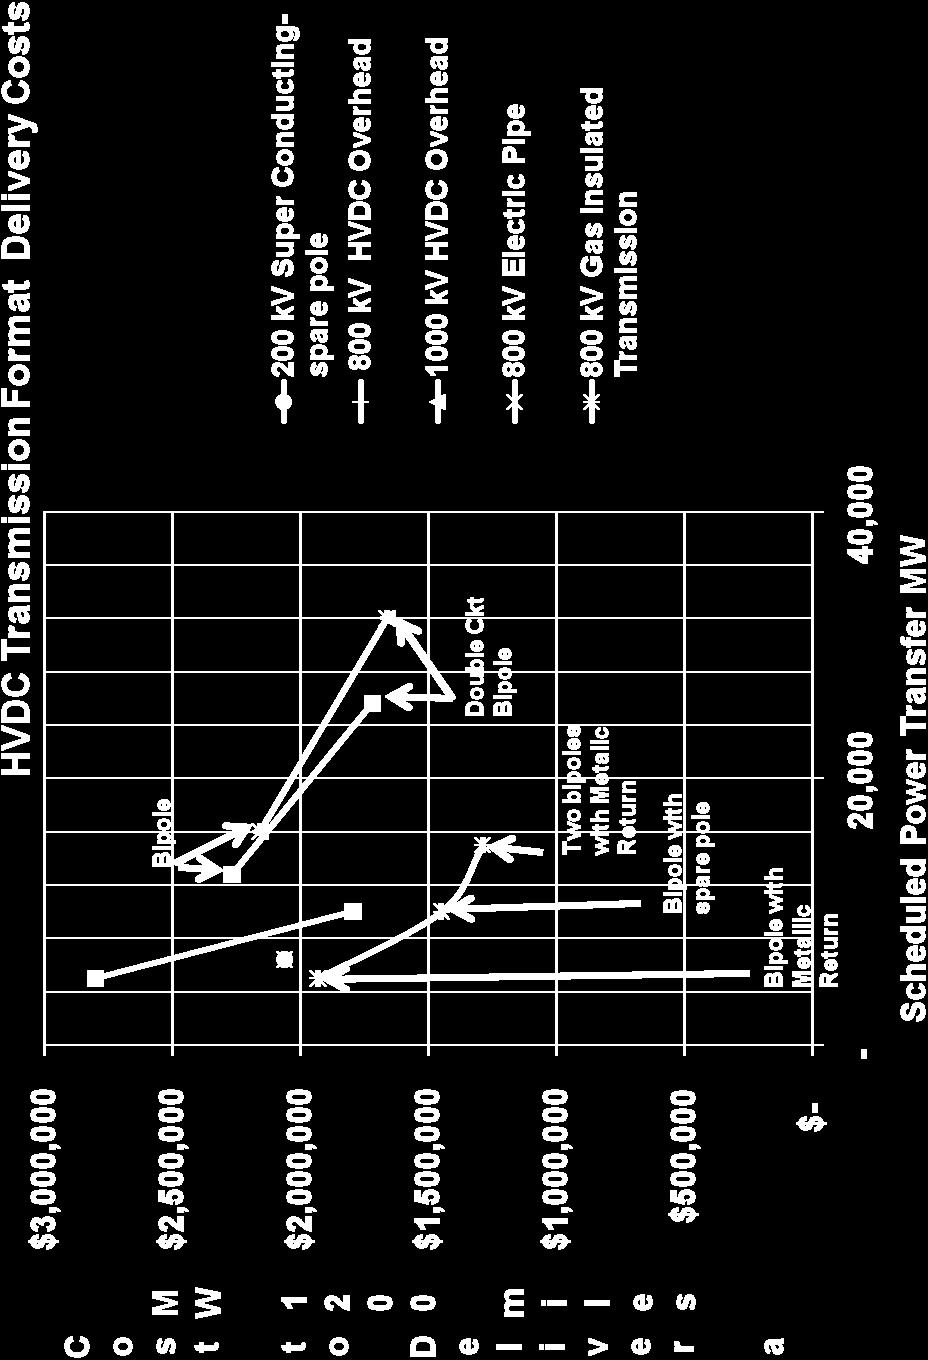
17 $/Mw Delivery Capacity $/MW $5,000,000 $4,500,000 $4,000,000 $3,500,000 $3,000,000 $2,500,000 $2,000,000 $1,500,000 $1,000,000 $500,000 $ Miles 345 kv AC 765 kv AC 800 kv HVDC 17
18 Power Transfer Breakover by Voltage Cost/Mile $16,000,000 $14,000,000 $12,000,000 $10,000,000 $8,000,000 $6,000,000 $4,000,000 $2,000,000 $0 345 kv AC+600 Mw 1-765kV AC kv HVDC 345 kv AC+1000 Mw 200 1,200 2,200 3,200 4,200 5,200 6,200 7,200 8,200 9,200 10,200 11,200 12,200 13,200 Power Transfer MW 18
19 765 kv AC 345 kv +800 kv 400 kv 1200/1600 MVA 1200/1600 MVA +800 kv Bi Polar Transmission line 400 kv 1200/1600 MVA 1200/1600 MVA 800 kv 800 kv 3 HVDC Lines could have 12 terminals at the source and 12 terminals at the sinks 14,400 MW self contingent

20 EWITS Total Future Cost 15%

 871 1,032 1,462 3,008 Actual Metered at Peak 103 1 11.8% 1 686 2 66.5% 2 24 3 1.6% 3 351 4 11.")
21 Maximum and Minimum Wind Data provided though the DOE Eastern Wind Integration and Transmission Study Simulated Maximum Power Output on April 29, 0600 GMT for calendar year 2004 Simulated Minimum Power Output on August 13, 1500 GMT for calendar year MW % of NP MW % of NP MW % of NP MW % of NP Nameplate Capacity (NP) 871 1,032 1,462 3,008 Actual Metered at Peak % % % % 4 1 Midwest ISO Peak Hour - August 3, :00 2 Midwest ISO Peak Hour - July 31, :00 3 Midwest ISO Peak Hour - August 8, :00 4 Midwest ISO Peak Hour - July 29, :00 21
22 Conclusions Transmission design methods depend on the planning area and ownerships markets Renewable Energy Zones are a practical method of managing the transmission planning problem Large amounts of renewable energy can be accommodated in large diverse areas using the rule of three Benefits can pay for transmission under certain conditions Geographical diversity linked by transmission produces a better wind product for the markets
23 Wind Diversity
24 Year to Year ELCC Variability Year to Year variation in the ELCC results is due to The different Hourly Load & Wind Profiles (2004, 2005 & 2006) And where the wind is located in each of the different Scenarios Study System ELCC Scenarios (1-4) Existing & Overlay Transmission Tie Limits - ELCC (%) {Shaded Area shows Increased ELCC of Overlay} 40% 35% 32.8% 30% 25% 20% 27.7% 28.0% 28.3% 28.1% 30.5% 27.3% 27.0% 25.4% 24.1% 26.4% 24.2% 23.8% 22.7% 20.2% 19.9% 18.8% 29.8% 26.6% 24.8% 24.6% 20.4% 20.6% Overlay Existing 15% 16.0% 10% 5% 0% As can be seen in the results a shift As more wind was located in the East (Scenario 3 & 4) The 2006 profile contained the higher ELCC As more wind was located in the West (Scenario 1) The 2004 profile contained the higher ELCC Scenario-1 System Scenario-2 System Scenario-3 System Scenario-4 System 2004 Profile 2005 Profile 2006 Profile
High Plains Regional Transmission Summit. Timelines for Planning Processes / Policy
 High Plains Regional Transmission Summit John Lawhorn Director Regulatory & Economic Studies Midwest ISO November 2, 2009 Timelines for Planning Processes / Policy 1 year 20 year Planning Horizons Queue
Commercial-in-Confidence Ashton Old Baths Financial Model - Detailed Cashflow
 Year 0 1 2 3 4 5 6 7 8 9 10 11 12 13 Oct-16 Nov-16 Dec-16 Jan-17 Feb-17 Mar-17 Apr-17 May-17 Jun-17 Jul-17 Aug-17 Sep-17 Oct-17 2,038 2,922 4,089 4,349 6,256 7,124 8,885 8,885 8,885 8,885 8,885 8,885 9,107
COMPARISON OF FIXED & VARIABLE RATES (25 YEARS) CHARTERED BANK ADMINISTERED INTEREST RATES - PRIME BUSINESS*
 CHARTERED BANK ADMINISTERED INTEREST RATES - PRIME BUSINESS*") COMPARISON OF FIXED & VARIABLE RATES (25 YEARS) 2 Fixed Rates Variable Rates For Internal Use Only. FIXED RATES OF THE PAST 25 YEARS AVERAGE RESIDENTIAL MORTGAGE LENDING RATE - 5 YEAR* (Per cent) Year
COMPARISON OF FIXED & VARIABLE RATES (25 YEARS) 2 Fixed Rates Variable Rates For Internal Use Only. FIXED RATES OF THE PAST 25 YEARS AVERAGE RESIDENTIAL MORTGAGE LENDING RATE - 5 YEAR* (Per cent) Year
COMPARISON OF FIXED & VARIABLE RATES (25 YEARS) CHARTERED BANK ADMINISTERED INTEREST RATES - PRIME BUSINESS*
 CHARTERED BANK ADMINISTERED INTEREST RATES - PRIME BUSINESS*") COMPARISON OF FIXED & VARIABLE RATES (25 YEARS) 2 Fixed Rates Variable Rates FIXED RATES OF THE PAST 25 YEARS AVERAGE RESIDENTIAL MORTGAGE LENDING RATE - 5 YEAR* (Per cent) Year Jan Feb Mar Apr May Jun
COMPARISON OF FIXED & VARIABLE RATES (25 YEARS) 2 Fixed Rates Variable Rates FIXED RATES OF THE PAST 25 YEARS AVERAGE RESIDENTIAL MORTGAGE LENDING RATE - 5 YEAR* (Per cent) Year Jan Feb Mar Apr May Jun
NEWS Release. U.S. Manufacturing Technology Orders. Year-to-date U.S. manufacturing technology orders up 4.1% over 2011
 U.S. Manufacturing Technology Orders A statistical program of AMT NEWS Release FOR RELEASE: October 8, 2012 Contact: Pat McGibbon, AMT, 703-827-5255 Year-to-date U.S. manufacturing technology orders up
What is the Future of Competitive Markets? Some Fundamental Preliminaries and View from Events in the PJM Market
 What is the Future of Competitive Markets? Some Fundamental Preliminaries and View from Events in the PJM Market Paul M. Sotkiewicz, Ph.D President December 7, 2016 What are the ideal properties of competitive
Michigan Thumb Loop Transmission Line Project
 Michigan Thumb Loop Transmission Line Project ITC Holdings Corp. Simon Whitelocke VP., Regulatory and External Affairs October 30, 2013 What is Transmission? The electric transmission system is the network
NJ Solar Market Update As of 6/30/15
 NJ Solar Market Update As of 6/30/ Prepared by Charlie Garrison July 17, 20 SOLAR INSTALLED CAPACITY DATA The preliminary installed solar capacity as of 6/30/ is approximately 1,500.7 MW. Approximately
NJ Solar Market Update
 NJ Solar Market Update April 16, 20 Renewable Energy Committee Meeting Trenton, NJ Prepared by Charlie Garrison Solar Installed Capacity Data The preliminary installed solar capacity as of 3/31/ is approximately
The Transmission Lay of the Land
 The Transmission Lay of the Land Overview Energy Markets Transmission Planning Beth Soholt John Moore April 21, 2010 Overview Regional Transmission Organizations Organizations of transmission owners, users,
EIPC HIGH LEVEL TRANSMISSION COST ESTIMATION TASK #5: DOE PROJECT NO. DE-OE
 EIPC HIGH LEVEL TRANSMISSION COST ESTIMATION TASK #5: DOE PROJECT NO. DE-OE0000343 Background: To support the SSC in assessing the results of the macroeconomic analysis and reaching consensus on the three
Jay Caspary Director Research, Development & Tariff Services
 Interconnection Seams Study Update CIGRE GOTF October 23, 2017 Jay Caspary Director Research, Development & Tariff Services jcaspary@spp.org 2 Disclaimer This deck includes materials which were presented
PDR Energy Baseline Alternative. Proposal for Discussion October 27, 2015
 PDR Energy Baseline Alternative Proposal for Discussion October 27, 2015 Update Since Last Meeting Since the October 12 th Working Group Meeting Stem, Solar City, AMS and CESA have had over a half-dozen
The Development of Competitive Renewable Energy Zones in Texas
 The Development of Competitive Renewable Energy Zones in Texas Warren Lasher Manager, System Assessment 4/23/2008 North American Electric Grids The ERCOT Region is one of 3 NERC grid interconnections.
THE TRES AMIGAS PROJECT
 UNITING THE NATION S ELECTRIC POWER GRID THE TRES AMIGAS PROJECT Project Development, Business Case, and Benefits -ERCOT Presentation Jan 22, 2010 Agenda Project Overview Project Objective Project Description,
The impact of electric vehicle development on peak demand and the load curve under different scenarios of EV integration and recharging options
 The impact of electric vehicle development on peak demand and the load curve under different scenarios of EV integration and recharging options Electricity demand in France: a paradigm shift Electricity
Deregulating Electricity Markets: Naïve Hopes vs. Market Reality
 Deregulating Electricity Markets: Naïve Hopes vs. Market Reality Lester Lave, Seth Blumsack, Jay Apt, & Sarosh Talukdar Electricity Center Carnegie Mellon University February 3, 2004 1 The U.S. Electricity
DMM 2017 Q4 Report Highlights
 DMM 2017 Q4 Report Highlights Gabe Murtaugh Senior Analyst Department of Market Monitoring Conference Call February 21, 2018 Outline Real-time market performance Higher prices in the 15-minute market Large
NE (SE) Beam
 Beam") Predicted clear day beam and diffuse irradiances (/ W m 2 ) on vertical and horizontal surfaces on specified days in northern (N) and southern (S) hemispheres (see notes at foot of table): LATITUDE 60
Predicted clear day beam and diffuse irradiances (/ W m 2 ) on vertical and horizontal surfaces on specified days in northern (N) and southern (S) hemispheres (see notes at foot of table): LATITUDE 60
Sunrise: 05:48 N (S) Beam
 Beam") Predicted clear day beam and diffuse irradiances (/ W m 2 ) on vertical and horizontal surfaces on specified days in northern (N) and southern (S) hemispheres (see notes at foot of table): LATITUDE 40
Predicted clear day beam and diffuse irradiances (/ W m 2 ) on vertical and horizontal surfaces on specified days in northern (N) and southern (S) hemispheres (see notes at foot of table): LATITUDE 40
Economics of Integrating Renewables DAN HARMS MANAGER OF RATE, TECHNOLOGY & ENERGY POLICY SEPTEMBER 2017
 Economics of Integrating Renewables DAN HARMS MANAGER OF RATE, TECHNOLOGY & ENERGY POLICY SEPTEMBER 2017 Presentation Outline Understanding LPEA s expenses and what drives them Economics of net metering
MONTHLY PERFORMANCE DASHBOARD
 AUSTIN ENERGY JULY MONTHLY PERFORMANCE DASHBOARD A report highlighting key Austin Energy metrics for e FY FINANCIAL HEALTH Standard and Poor s Bond Rating Austin Energy Rating AA AA Budget Based Revenues
NJ Solar Market Update As of 10/31/15
 NJ Solar Market Update As of 10/31/15 Prepared by Charlie Garrison Renewable Energy Committee Meeting November 10, 2015 SOLAR INSTALLED CAPACITY DATA The preliminary installed solar capacity as of 10/31/15
DIgSILENT Pacific PowerFactory Technical Seminar
 DIgSILENT Pacific PowerFactory Technical Seminar Topic: The Wonders of Optimal Power Flow Presenter: Wayne Ong Venue: Sydney Novotel Central / Brisbane Marriott Hotel Date: 16 th and 30 th November 2017
Regulation Update. Operating Committee September 12, PJM 2017
 Regulation Update Operating Committee September 12, 2017 Regulation Market Clearing Price *Data up to Aug 22 2 Mileage Ratio Mileage Ratio has increased since the new signal implementation Larger Utilization
Ameren Missouri. AMENDED Renewable Energy Standard Compliance Report Prepared in Compliance with 4 CSR
 Ameren Missouri AMENDED Renewable Energy Standard Compliance Report 2015 Prepared in Compliance with 4 CSR 240-20.100 June 23, 2016 NP Table of Contents Page INTRODUCTION...4 SECTION (8) (A) 1 A: TOTAL
Wholesale Electric Market Economics
 Wholesale Electric Market Economics Sponsored by the Institute for Policy Integrity 15 June 2011 Presented by Doug Hurley and Paul Peterson New England Markets and Relative Size All other ancillary services
Operational Opportunities to Minimize Renewables Curtailments
 Operational Opportunities to Minimize Renewables Curtailments Clyde Loutan Principal, Renewable Energy Integration July 24, 2017 2017 CAISO - Public Page 1 Agenda Background Real-time control performance
Port Botany. Trade Statistics Bulletin 1 July April 2018
 Port Botany Trade Statistics Bulletin 1 July 2017 30 April 2018 YTD April 2018 Port Botany Container Trade Jul 2017 Aug 2017 Sep 2017 Oct 2017 Nov 2017 Dec 2017 Jan 2018 Feb 2018 Mar 2018 Apr 2018 Export
Emera Maine Representative: Jeffrey Fenn, P.E., SGC Engineering LLC
 OCTOBER 22, 2014 Emera Maine s Local System Plan Bangor Hydro District Needs Assessment/Potential Solutions Local Planning Advisory Committee Meeting E M i R t ti Emera Maine Representative: Jeffrey Fenn,
4,1 '~ ~ ~ 1I1f lc/)~ul I Central Electricity Authority
~ul I Central Electricity Authority") ,.,.;i')!i,:;;',;~~~. 'ffrff mm I Government of India ~ ~.I Ministry of Power 4,1 '~ ~ ~ 1I1f lc/)~ul I Central Electricity Authority III ~~~~~~I"1",~~1 ;J' :. r System Planning & Project Appraisal Division
,.,.;i')!i,:;;',;~~~. 'ffrff mm I Government of India ~ ~.I Ministry of Power 4,1 '~ ~ ~ 1I1f lc/)~ul I Central Electricity Authority III ~~~~~~I"1",~~1 ;J' :. r System Planning & Project Appraisal Division
MONTHLY PERFORMANCE DASHBOARD
 AUSTIN ENERGY MARCH 21 MONTHLY PERFORMANCE DASHBOARD A report highlighting key Austin Energy metrics for uary FY 21 FINANCIAL HEALTH Standard and Poor s Bond Rating Current AA AA Budget Based Revenues
University of Michigan Eco-Driving Index (EDI) Latest data: October 2017
 Latest data: October 2017") University of Michigan Eco-Driving Index () http://www.ecodrivingindex.org Latest data: October 2017 Developed and issued monthly by Michael Sivak and Brandon Schoettle Sustainable Worldwide Transportation
University of Michigan Eco-Driving Index () http://www.ecodrivingindex.org Latest data: October 2017 Developed and issued monthly by Michael Sivak and Brandon Schoettle Sustainable Worldwide Transportation
Port Botany. Trade Statistics Bulletin 1 July June 2018
 Port Botany Trade Statistics Bulletin 1 July 2017 30 June 2018 FY 2017/18 Port Botany Container Trade Jul 2017 Aug 2017 Sep 2017 Oct 2017 Nov 2017 Dec 2017 Jan 2018 Feb 2018 Mar 2018 Apr 2018 May 2018
Local Market Update 2012 Year In Review
 Northwest Area Home Sales for the Year 2012 Sales of single-family homes reported in Toledo and the surrounding area by the Toledo Board of REALTORS totaled 6,793. This was an increase of 6% compared to
NEU Electric and Natural Gas Price Update
 $ / MWH Jan-11 May-11 Sep-11 Sep-12 Jan-13 Electric: Short-Term Outlook The NYMEX Northern Illinois Hub 12-month forward price at the end of August 2016 for the September 2016 to August 2017 period was
Storage in the energy market
 Storage in the energy market Richard Green Energy Transitions 216, Trondheim 1 including The long-run impact of energy storage on prices and capacity Richard Green and Iain Staffell Imperial College Business
FINAL FACILITY STUDY. 230/69/13.8 kv Transformer Addition(s) at Badwater Substation 2009 T1. September 10, 2010
 at Badwater Substation 2009 T1. September 10, 2010") FINAL FACILITY STUDY 230/69/13.8 kv Transformer Addition(s) at Badwater Substation 2009 T1 September 10, 2010 I. Introduction This is a revised facility study performed for Transmission Queue Request 2009
FINAL FACILITY STUDY 230/69/13.8 kv Transformer Addition(s) at Badwater Substation 2009 T1 September 10, 2010 I. Introduction This is a revised facility study performed for Transmission Queue Request 2009
MONTHLY PERFORMANCE DASHBOARD
 AUSTIN ENERGY MONTHLY PERFORMANCE DASHBOARD A report highlighting key Austin Energy metrics for uary FY 219 FINANCIAL HEALTH Standard and Poor s Bond Rating Austin Energy Rating AA AA Budget Based Revenues
W (W) Beam
 Beam") Predicted clear day beam and diffuse irradiances (/ W m 2 ) on vertical and horizontal surfaces on specified days in northern (N) and southern (S) hemispheres (see notes at foot of table): LATITUDE 0 N/S
Predicted clear day beam and diffuse irradiances (/ W m 2 ) on vertical and horizontal surfaces on specified days in northern (N) and southern (S) hemispheres (see notes at foot of table): LATITUDE 0 N/S
Up and Down Months of the Stock Market
 Up and Down Months of the Stock Market 1926-2017 Positive years (66) in the stock market were not good all year long and losing years (24) were not losers throughout the year. Winning years produce losing
Electricity Industry Code Minimum Service Standards & Guaranteed Service Levels Quarterly Report July September 2008
 Electricity Industry Code Minimum Service Standards & Guaranteed Service Levels Quarterly Report July September 2008 2 Table of Contents Administrative Data...3 Network Performance...3 Reliability Measures
Review of U.S. market reforms for renewable integration, flexibility, and storage
 Review of U.S. market reforms for renewable integration, flexibility, and storage Eric Hsieh Director Office of Energy Finance and Incentives Analysis U.S. Department of Energy 14 July 2017 Transformations
Implications of Alberta s Evolving Electricity Market for Solar
 Implications of Alberta s Evolving Electricity Market for Solar Matt Ayres CEO, Market Surveillance Administrator matt.ayres@albertamsa.ca What does the Market Surveillance Administrator do? Investigation
DRAFT. Total Month Average Point (MAP) A Massage 4/30/2014 8/1/2015 A CENTER E
 A Massage 4/30/2014 8/1/2015 A CENTER E") Total Month Average Point (MAP) A Massage 4/30/2014 8/1/2015 A CENTER E 2.25 2.00 2.00 2.25 2.00 2.00 1.00 2.25 2.00 2.25 2.00 A Massage 10/31/2017 9/1/2015 B MEZZANINE 2.25 2.00 2.00 2.25 2.25 2.25 2.25
Total Month Average Point (MAP) A Massage 4/30/2014 8/1/2015 A CENTER E 2.25 2.00 2.00 2.25 2.00 2.00 1.00 2.25 2.00 2.25 2.00 A Massage 10/31/2017 9/1/2015 B MEZZANINE 2.25 2.00 2.00 2.25 2.25 2.25 2.25
Year to Date Summary. Average and Median Sale Prices
 A Publication of RMLS, The Source for Real Estate Statistics in Your Community Residential Review: Southwest Washington September 2018 Reporting Period September Residential Highlights Southwest Washington
January Manufacturing Technology Orders Off After a Strong December
 Contact: Bonnie Gurney, AMT, 703-827-5277 bgurney@amtonline.org For Release: March 9, 2015 January Manufacturing Technology Orders Off After a Strong December January U.S. manufacturing technology orders
TRAFFIC VOLUME TRENDS July 2002
 TRAFFIC VOLUME TRENDS July 2002 Travel on all roads and streets changed by +2.3 percent for July 2002 as compared to July 2001. Estimated Vehicle-Miles of Travel by Region - July 2002 - (in Billions) West
ERCOT Overview. Paul Wattles Senior Analyst, Market Design & Development. Solar Energy Industries Association July 11, 2012
 ERCOT Overview Paul Wattles Senior Analyst, Market Design & Development Solar Energy Industries Association History of Electric Reliability Council of Texas, Inc. 1941 Utilities band together to aid war
Power Systems Fundamentals
 Power Systems Fundamentals Yachi Lin Senior Manager, Transmission Planning New York Independent System Operator Market Overview Course September 20, 2017 Rensselaer, NY 2017 New York Independent System
Facing the Crisis with a Strong Brand Iveco s Strategic Repositioning. Marco Monticelli Vice President External Relations and Communication
 Facing the Crisis with a Strong Brand Iveco s Strategic Repositioning Marco Monticelli Vice President External Relations and Communication Brussels July 3, 2009 Iveco: a Company of Fiat Group 2 Iveco Products
WIRES University Overview of ISO/RTOs. Mike Ross Senior Vice President Government Affairs and Public Relations Southwest Power Pool
 WIRES University Overview of ISO/RTOs Mike Ross Senior Vice President Government Affairs and Public Relations Southwest Power Pool 1 OUR MISSION Helping our members work together to keep the lights on
Capture The Power of Photovoltaics. IEEE Power Engineering Society Meeting May 2005
 Capture The Power of Photovoltaics IEEE Power Engineering Society Meeting May 2005 Agenda Photovoltaic Basics Applications Economics Grid Interconnection and Net Metering Grid-Tied System Components Net
Price Category Breakdown - February 2010
 SINGLE FAMILY RESIDENTIAL BREAKDOWN ruary 21 ruary Sales and Average Price Increase Annually TORONTO - Wednesday, March 3, 21 7.3 % 24.6 % 1.8 % 7.3%.2%.1 % Greater Toronto REALTORS reported 7,291 sales
2015 Grid of the Future Symposium
 21, rue d Artois, F-75008 PARIS CIGRE US National Committee http ://www.cigre.org 2015 Grid of the Future Symposium Flexibility in Wind Power Interconnection Utilizing Scalable Power Flow Control P. JENNINGS,
Advancements in Energy Storage: Utility-Scale Technologies and Demonstration Projects
 Advancements in Energy Storage: Utility-Scale Technologies and Demonstration Projects ASERTTI Webinar August 20, 2012 Barbara Tyran Director, Washington & State Relations The Electric Power Research Institute
MONTHLY PERFORMANCE DASHBOARD
 AUSTIN ENERGY MONTHLY PERFORMANCE DASHBOARD A report highlighting key Austin Energy metrics for ember FY 219 FINANCIAL HEALTH Standard and Poor s Bond Rating Austin Energy Rating AA AA Budget Based Revenues
MONTHLY PERFORMANCE DASHBOARD
 AUSTIN ENERGY MAY MONTHLY PERFORMANCE DASHBOARD A report highlighting key Austin Energy metrics for ch FY FINANCIAL HEALTH Standard and Poor s Bond Rating Current AA Target AA Budget Based Revenues and
Residential Load Profiles
 Residential Load Profiles TABLE OF CONTENTS PAGE 1 BACKGROUND... 1 2 DATA COLLECTION AND ASSUMPTIONS... 1 3 ANALYSIS AND RESULTS... 2 3.1 Load Profiles... 2 3.2 Calculation of Monthly Electricity Bills...
Energy Policy Implications: PJM Planning
 Energy Policy Implications: PJM Planning Chicago, Illinois November 14, 2012 Steven R. Herling Vice President, Planning PJM Interconnection PJM as Part of the Eastern Interconnection 26% of generation
ENERGY SLIDESHOW. Federal Reserve Bank of Dallas
 ENERGY SLIDESHOW Updated: January 16, 2019 ENERGY PRICES www.dallasfed.org/research/energy Brent & WTI & Crude Brent Oil Crude Oil Dollars per barrel 140 120 100 Brent (Jan 11 = $58.64) WTI (Jan 11 = $50.78)
Results of annual simulation
 2 x Vitosol 100-FM SVKF Total gross surface area:4,46 m² Azimuth: 0 Incl.: 30 160 Liters/Day 50 C Gas-fired boiler 26 kw Vitocell 100-B Vol : 250 l Results of annual simulation Installed collector power:
Design Criteria Data
 DAYTON/JAMES M COX OH Latitude = 39.9 N WMO No. 72429 Longitude = 84.2 W Elevation = 14 feet Period of Record = 1973 to 1996 Average Pressure = 28.95 inches Hg Design Criteria Data Mean Coincident (Average)
Demand Response - An End-to-End Approach from Markets to Consumers
 Demand Response - An End-to-End Approach from Markets to Consumers Rana Mukerji Senior Vice President Market Structures New York Independent System Operator EPRI PDU Sector Council Meeting Boston, MA September
Design Criteria Data
 PHILADELPHIA PA Latitude = 39.88 N WMO No. 7248 Longitude = 75.25 W Elevation = 3 feet Period of Record = 1973 to 1996 Average Pressure = 29.98 inches Hg Design Criteria Data Mean Coincident (Average)
Balancing Wind. Embracing the Challenge
 Balancing Wind Embracing the Challenge Rana Mukerji Senior Vice President Market Structures New York Independent System Operator Congressional Briefing American Wind Energy Association & the COMPETE Coalition
Renewable Energy Analysis For Afghanistan
 40 Years of Excellence in Analysis Renewable Energy Analysis For Afghanistan Approved for Public Release Distribution is unlimited David Carrier APGR-AMSA-MPE@us.army.mil 2 Agenda Purpose & Background
FERC 101 for Environmental Lawyers. Linda L. Walsh Hunton & Williams LLP February 11, 2015
 FERC 101 for Environmental Lawyers Linda L. Walsh Hunton & Williams LLP February 11, 2015 What is FERC FERC is an independent agency within the Dept. of Energy (DOE) Current Commission: 2 3 Electricity
Facilitated Discussion on the Future of the Power Grid
 Facilitated Discussion on the Future of the Power Grid EPRI Seminar: Integrated Grid Concept and Technology Development Tokyo Japan, August 20, 2015 Matt Wakefield, Director Information, Communication
ANCR CRU Statistics February 2007 to December 2007
 ANCR CRU Statistics February 2007 to December 2007 o Jan/07 Feb/07* Mar/07 Apr/07 May/07 Jun/07 Jul/07 Aug/07 Sep/07 Oct/07 Nov/07 Dec/07 Total notes data from Perimeter phone system unavailable prior
VEHICLE / PEDESTRIAN COLLISIONS
 Info item No. 1 Crosswalk Safety Advisory Committee March 31, 2016 VEHICLE / PEDESTRIAN COLLISIONS HRM: January December 20 DISCLAIMER: All figures presented in this report reflect the information held
PSCo 10-Year Transmission Plan/20-Year Scenario Assessment
 PSCo 10-Year Transmission Plan/20-Year Scenario Assessment May 2009 This report contains transmission planning data that may be conceptual in nature and is subject to change. The transmission projects
Ministério de Minas e Energia. Minister Eduardo Braga. Brazil - Texas Chamber of Commerce - BRATECC May/2015
 1 Minister Eduardo Braga Brazil - Texas Chamber of Commerce - BRATECC May/2015 2 3 World s 7 th largest economy; Investment grade Fiscal adjustment taking place; Inflation being controlled; Large and diversified
TRANSPACIFIC CUSTOMER ADVISORY Implementation of New BAF Formula Effective January 01, 2019
 December 7, 2018 TRANSPACIFIC CUSTOMER ADVISORY Implementation of New BAF Formula Effective January 01, 2019 Dear Valued Customer, Bunker is one of the important cost components for a container shipping
Accommodating High Levels of Variable Generation. EPRI Managing Complexity for Safety and Reliability September 14-15, 15, 2009
 Accommodating High Levels of Variable Generation EPRI Managing Complexity for Safety and Reliability September 14-15, 15, 2009 Agenda About NERC About the Integration of Variable Generation Task Force
Modeling and Comparison of Dynamics of AC and DC Coupled Remote Hybrid Power Systems
 Modeling and Comparison of Dynamics of AC and DC Coupled Remote Hybrid Power Systems Presenter: Tanjila Haque Supervisor : Dr. Tariq Iqbal Faculty of Engineering and Applied Science Memorial University
NJ Solar Market Update As of 2/29/16
 NJ Solar Market Update As of 2/29/16 Prepared by Charlie Garrison March 24, 2016 SOLAR INSTALLED CAPACITY DATA The installed solar capacity as of 2/29/16 is approximately 1,644.3 MW. Approximately 20.3
Total Production by Month (Acre Feet)
") Production by Month (acre-feet) 2008 2009 2010 2011 2012 2013 2014 2015 2016 January 25 339.10 228.90 249.50 297.99 243.06 327.14 247.66 212.37 February 234.00 218.80 212.10 241.52 245.82 279.08 234.16
Production by Month (acre-feet) 2008 2009 2010 2011 2012 2013 2014 2015 2016 January 25 339.10 228.90 249.50 297.99 243.06 327.14 247.66 212.37 February 234.00 218.80 212.10 241.52 245.82 279.08 234.16
100 MW Wind Generation Project
 A subsidiary of Pinnacle West Capital Corporation 100 MW Wind Generation Project CUSTOMER FINAL Feasibility Study Results By Transmission Planning, APS December 21, 2007 Executive Summary This Feasibility
California s Electricity Crises
 California s Electricity Crises Presented to IEEE-PES Summer 2001 Vikram S. Budhraja President, Electric Power Group, LLC Chair, Consortium for Electric Reliability Technology Solutions July 16, 2001 Vancouver,
CITY OF PASADENA APPLICATION FOR PARTICIPATING TRANSMISSION OWNER STATUS
 CITY OF PASADENA APPLICATION FOR PARTICIPATING TRANSMISSION OWNER STATUS July 15, 2004 TABLE OF CONTENTS Page No. 1. Description of Pasadena s Transmission Lines and Facilities...1 A. Overview:... 1 B.
TECHNICAL SERVICE BULLETIN
 TECHNICAL SERVICE BULLETIN To: Minuteman Dealers and Customers From: Minuteman Technical Support Date: 1/12/2011 Subject: TSB for the KIT # K-FRSPEEDSWT. For the FR17115, FR17220, FR20115 and FR20220 models.
Energy Markets in Turmoil The Consumer Perspective
 Energy Markets in Turmoil The Consumer Perspective Sonny Popowsky Consumer Advocate of Pennsylvania Illinois State University Institute for Regulatory Policy Studies 63682 Springfield, IL May 17, 2001
Transmission Coordination and Planning Committee 2014 Q4 Stakeholder Meeting. December 18, 2014
 Transmission Coordination and Planning Committee 2014 Q4 Stakeholder Meeting December 18, 2014 Agenda 1. Introductions 2. TCPC Policies 3. BHCE Planning Department Update 4. 2014 LTP Study Results 5. Stakeholder
ENERGY SLIDESHOW. Federal Reserve Bank of Dallas
 ENERGY SLIDESHOW Updated: March 13, 2018 ENERGY PRICES www.dallasfed.org/research/energy Brent & WTI & Crude Brent Oil Crude Oil Dollars per barrel 140 Brent (Mar 9 = $65.12) WTI (Mar 9 = $61.65) 120 100
Transmission Planning Attachment K Public Input Meeting
 Transmission Planning Attachment K Public Input Meeting FERC 890 6 th Quarter Meeting May 25, 2011 Agenda Mountain Time Topic Presenter 1:00 1:15 Greetings and Introduction Dennis Desmarais 1:15 1:30 Attachment
The Peoples Gas Light and Coke Company
 History of Gas Charges Due to the Operation of Rider 2 (Cents per Therm) Factors for Transportation Customers (Riders FST, SST, P, CFY and AGG) Non- Total Standby Standby Aggregation Commodity Commodity
ELECTRIC SERVICE RATE SCHEDULES. Effective November 1, 2017
 ELECTRIC SERVICE RATE SCHEDULES Effective November 1, 2017 SCHEDULE 100 RESIDENTIAL SERVICE Residential Customers for all domestic uses. CHARACTER OF SERVICE: Alternating current, sixty-hertz 120/240 volts
CLIMATOLOGICAL SUMMARY
 DEPARTMENT OF REGISTRATION AND EDUCATION CTATP OF ILLINOIS ILLINOIS STATE WATER SURVEY DIVISION URBANA, ILLINOIS ISWS MP-19 Archive ISWS Illinois State Water Survey )CAL CLIMATOLOGICAL DATA MP-19 LOCAL
Effects of Smart Grid Technology on the Bulk Power System
 Effects of Smart Grid Technology on the Bulk Power System Rana Mukerji Senior Vice President Market Structures New York Independent System Operator Union College 2013 Environmental Science, Policy & Engineering
Yield Reduction Due to Shading:
 x9 31 x SunPower 1 x Power-One SPR-E0-37 37 W TRIO-8.5-TL-OUTD 10 ; 1x13 1x13 1 x Power-One 10 ; -30 7.5kW 9 x SunPower 1 x Power-One SPR-E0-37 37 W 10 ; 59 7.5kW 7 x SunPower 1 x Power-One SPR-E0-37 37
Net Consumption (GWh)
") GEORGIAN ENERGY MARKET Over the last 20 years Georgia s power market has evolved from a vertically integrated single buyer utility, to a competitive regional power market model. The Georgian wholesale
GEORGIAN ENERGY MARKET Over the last 20 years Georgia s power market has evolved from a vertically integrated single buyer utility, to a competitive regional power market model. The Georgian wholesale
Design Criteria Data
 BURLINGTON VT Latitude = 44.47 N WMO No. 72617 Longitude = 73.15 W Elevation = 341 feet Period of Record = 1973 to 1996 Average Pressure = 29.61 inches Hg Design Criteria Data Mean Coincident (Average)
Design Criteria Data
 RAPID CITY SD Latitude = 44.5 N WMO No. 72662 Longitude =3. W Elevation = 3169 feet Period of Record = 1973 to 1996 Average Pressure = 26.67 inches Hg Design Criteria Data Mean Coincident (Average) Values
Design Criteria Data
 COLUMBIA SC Latitude = 33.95 N WMO No. 7231 Longitude = 81.12 W Elevation = 226 feet Period of Record = 1973 to 1996 Average Pressure = 29.8 inches Hg Design Criteria Data Mean Coincident (Average) Values
GAZIFÈRE INC. Prime Rate Forecasting Process 2017 Rate Case
 Overview A consensus forecast is used to estimate the prime rate charged by commercial banks. As the prime rate is subject to competitive pressures faced by individual lenders and is set on an individual
Design Criteria Data
 HONOLULU/OAHU HI Latitude = 21.35 N WMO No. 91182 Longitude =157.9 W Elevation = 16 feet Period of Record = 1967 to 1996 Average Pressure = 29.96 inches Hg Design Criteria Data Mean Coincident (Average)
Design Criteria Data
 MACON/LEWIS WILSON GA Latitude = 32.7 N WMO No. 72217 Longitude = 83.65 W Elevation = 361 feet Period of Record = 1973 to 1996 Average Pressure = 29.66 inches Hg Design Criteria Data Mean Coincident (Average)
Design Criteria Data
 PIERRE SD Latitude = 44.38 N WMO No. 726686 Longitude =1.2 W Elevation = 1742 feet Period of Record = 1973 to 1996 Average Pressure = 28.1 inches Hg Design Criteria Data Mean Coincident (Average) Values
Design Criteria Data
 INDIANAPOLIS IN Latitude = 39.73 N WMO No. 72438 Longitude = 86.27 W Elevation = 87 feet Period of Record = 1973 to 1996 Average Pressure = 29.15 inches Hg Design Criteria Data Mean Coincident (Average)