"Mobility for tomorrow"
|
|
|
- Augustus Holmes
- 6 years ago
- Views:
Transcription
1 "Mobility for tomorrow" Klaus Rosenfeld Chief Executive Officer / Chief Financial Officer Prof. Dr Peter Gutzmer Chief Technology Officer Analyst Conference Schaeffler Group March 20, 2014 Munich
2 Disclaimer This presentation contains forward-looking statements. The words "anticipate", "assume", "believe", "estimate", "expect", "intend", "may", "plan", "project", "should" and similar expressions are used to identify forward-looking statements. Forward-looking statements are statements that are not historical facts; they include statements about Schaeffler Group's beliefs and expectations and the assumptions underlying them. These statements are based on plans, estimates and projections as they are currently available to the management of Schaeffler AG. Forward-looking statements therefore speak only as of the date they are made, and Schaeffler Group undertakes no obligation to update any of them in light of new information or future events. By their very nature, forward-looking statements involve risks and uncertainties. These statements are based on Schaeffler AG management's current expectations and are subject to a number of factors and uncertainties that could cause actual results to differ materially from those described in the forward-looking statements. Actual results may differ from those set forth in the forwardlooking statements as a result of various factors (including, but not limited to, future global economic conditions, changed market conditions affecting the automotive industry, intense competition in the markets in which we operate and costs of compliance with applicable laws, regulations and standards, diverse political, legal, economic and other conditions affecting our markets, and other factors beyond our control). This presentation is intended to provide a general overview of Schaeffler Group s business and does not purport to deal with all aspects and details regarding Schaeffler Group. Accordingly, neither Schaeffler Group nor any of its directors, officers, employees or advisers nor any other person makes any representation or warranty, express or implied, as to, and accordingly no reliance should be placed on, the accuracy or completeness of the information contained in the presentation or of the views given or implied. Neither Schaeffler Group nor any of its directors, officers, employees or advisors nor any other person shall have any liability whatsoever for any errors or omissions or any loss howsoever arising, directly or indirectly, from any use of this information or its contents or otherwise arising in connection therewith. The material contained in this presentation reflects current legislation and the business and financial affairs of Schaeffler Group which are subject to change and audit. Page 2 Page 2
3 Agenda 1 Highlights 2013 K. Rosenfeld 2 "Mobility for tomorrow" Prof. Dr P. Gutzmer 3 Results FY 2013 K. Rosenfeld Page 3


4 1 Highlights An eventful year 1 Growth strategy continued Earnings quality maintained 2 Management change executed New organizational / leadership structure established 3 Program "ONE Schaeffler" Transparency, Trust and Teamwork 4 Strategy refocused "Mobility for tomorrow" 5 Strong foundation for future growth Ambitious targets for 2014 Page 4
5 1 Highlights Growth strategy continued Automotive growth +8.6% 1) Sales Schaeffler Group in EUR mn 11,125 10,694 11, % vs. FY FX-effect 11,445 Sales Automotive in EUR mn 7,157 6,325 7,658 8, % vs. FY FX-effect Share of total sales ~73% 8,315 9, FX-adjusted Sales Industrial in EUR mn 3,463 3, , , % vs. FY FX-effect 2013 FX-adjusted Share of total sales ~27% 3,129 1) FX-adjusted FX-adjusted Page 5
6 1 Highlights Above market growth Increasing content per vehicle Light Vehicle Production 1) in '000 units Content per Vehicle 1) in EUR per vehicle +4% vs. FY 2012 Germany ~300 67,554 5,581 18,546 59,528 4,862 15,743 74,389 5,566 18,592 15,847 76,868 5,908 19,785 17,142 81,511 5,735 18,662 19,477 84,787 5,833 18,420 20,478 Europe ~100 Americas ~70 16,127 8,691 12,074 12,857 16,858 17,332 18,315 21,017 Greater China ~40 18,609 13,993 17,526 16,701 19,322 19,039 Asia/Pacific ~ Schaeffler Group ~80 Germany Europe Americas Greater China Asia/Pacific 1) Source: IHS as of March 5, ) Indicative calculation with average figures based on Automotive sales per region and total production of light vehicles per region as per IHS figures; value diverges depending on vehicle size / category Page 6
7 1 Highlights Our key success factors Quality, Innovation and Technology Number of patent registrations in Germany 1) Key aspects 2,100 new patents in ,832 1,854 2,100 Schaeffler is ranked as the No. 2 most innovative company in Germany (Ranking in 2012: No. 4) 1,641 Share of new inventions outside Germany is increasing 1, Rank in Germany Schaeffler Group An integrated technology group with first class quality, innovation strength and global reach #5 #5 #4 #4 #4 #2 1) Source: Deutsches Patent- und Markenamt (DPMA) Page 7
8 1 Highlights New organizational and leadership structure "Structure follows strategy" 3-dimensional matrix Key aspects CEO Functions R&D Operations Finance Europe Gr. China Americas Asia/Pacific Automotive A Industrial C Regions Divisions New organizational and leadership structure introduced in November 2013 Streamlined matrix organization with three dimensions A B C 2 Divisions and 6 Business Divisions 5 Functions 4 Regions B Functional areas HR Structure aligned with long-term growth strategy and integrated business model High degree of implementation achieved One integrated business model Page 8
9 1 Highlights New regional Structure 4 regions with Regional CEOs Regional structure Schaeffler Group Europe Americas Greater China Asia/ Pacific - Germany - EU countries 1) - EMEA 2) - India - USA - South America - Canada - Mexico - China - Taiwan - Hong Kong - Korea - Japan - Southeast Asia 1) Western. Southern and Eastern Europe 2) Russia. Middle East and Africa Key aspects "Greater China" becomes a new region; Japan, Korea, and Southeast Asia form the new region "Asia/Pacific" Region "Europe" includes Germany, EU countries 1), EMEA 2), and India North America and South America are integrated into new region "Americas" All regions are led by Regional CEOs Sales by region 11% 21% 10% 58% Total sales 2013: EUR 11,205 mn Europe Americas Greater China Asia/Pacific Page 9
10 1 Highlights New leadership structure One integrated team New Executive Board setup Chief Executive Officer Key aspects New leadership structure integrates all three dimensions of the organizational structure CEOs Automotive Chief Technology Officer CEO Industrial The new extended Executive Board comprises 7 board members plus 4 Regional CEOs Chief Financial Officer Chief Operating Officer + Human Resources Group-wide roles and responsibilities globally aligned and streamlined Experienced leadership team with combined 183 years of service at Schaeffler Group CEO Europe CEO Americas CEO Greater China CEO Asia/Pacific Function Division Region Page 10
11 1 Highlights Three key focus areas Program "ONE Schaeffler" 3 key focus areas The 'House of Schaeffler' Executive Board CEO Functions 1 Performance Automotive Industrial 2 3 Structure Leadership R&D Program "ONE Schaeffler" Production Infrastructure, Processes & Systems Finance Human Resources Regions Page 11
12 1 Highlights Program "ONE Schaeffler" 20 key initiatives 20 Initiatives Program "ONE Schaeffler" Governance & Organization Compliance Management System Footprint SEA Business Portfolio Automotive Long-term positioning AAM 2020 Bearing Technology Business Portfolio Industrial European Distribution Center R&D Efficiency and Global Footprint Schaeffler Production System Schaeffler Logistics Schaeffler Purchasing Integrated Planning Business Process Management IT Strategy 2020 Cost Allocation Initiative Intercompany Processes Global Reporting Global Talent Management One Schaeffler India Priority A A C C C C A B A B B C B B C A A B B B Key aspects Clear prioritization of initiatives Full commitment by the Executive Board Program to be implemented by end of 2015 Strict project management with 4 phases Q4 Q1 Q2 Q3 Q4 Q1 Q2 Q3 Q4 Q1 Setup "ONE Schaeffler" Initiation phase Start Planning phase Goal: finish planning phase until mid-june Implementation phase Closing phase Page 12
13 1 Highlights Program "ONE Schaeffler" Development of leadership culture Schaeffler initiatives portfolio Main aspects Executive Board CEO Functions 1 2 Automotive Industrial Transparency R&D Program "ONE Schaeffler" Production 9 10 Infrastructure, Processes & Systems Trust Teamwork Finance Human Resources Regions Page 13


14 1 Highlights Strategy refocused "Mobility for tomorrow" Key mega trends 4 focus areas Society trends Urbanization Population growth Technology trends Environmental trends Increasing complexity Digitalization Renewable energies Availability of resources Environmentally 1 Urban mobility 2 friendly drives "Mobility for tomorrow" Economic trends Globalization Affordability 3 Interurban mobility Energy chain 4 Page 14
15 Agenda 1 Highlights 2013 K. Rosenfeld 2 "Mobility for tomorrow" Prof. Dr P. Gutzmer 3 Results FY 2013 K. Rosenfeld Page 15


16 2 Mobility for tomorrow Paradigm shift in the automotive industry Efficiency improvements and rapidly progressing electrification of the drive train Schaeffler creates "Mobility for tomorrow" Partially automatic / fully automatic driving Integrated information networks Page 16

17 2 Mobility for tomorrow Environmentally friendly drives 1 Environmentally friendly drives Page 17
18 2 Mobility for tomorrow Environmentally friendly drives Combustion engine remains dominant but will be further electrified Powertrain concepts CO 2 legislation worldwide Light vehicle production Trends Light vehicles in g CO 2 2% 1% 19% 9% Proposed target Enacted target USA: incl. light duty vehicles 35% % % 56% China: 117 g in 2020 USA: 109 g in Japan: 105 g in 2020 EU: 95 g in 2020 Combustion engine Hybrids Electric Source: University of Duisburg-Essen, 2012 Source: icct, 2013 Page 18


19 2 Mobility for tomorrow Environmentally friendly drives Schaeffler provides solutions for all main future mobility concepts Degree of electrification Degree of electrification Full Hybrid / Plug-in C CHybrid Electric / Electric Axle Micro-Hybrid / B B48V-Technology Hybrid module / 48V technology Optimization of the A conventional Optimization drivetrain of the A conventional drivetrain UniAir Hybrid module Electric Axle Drive Combustion Engine Micro Hybrid Hybrid / Electric drive Page 19

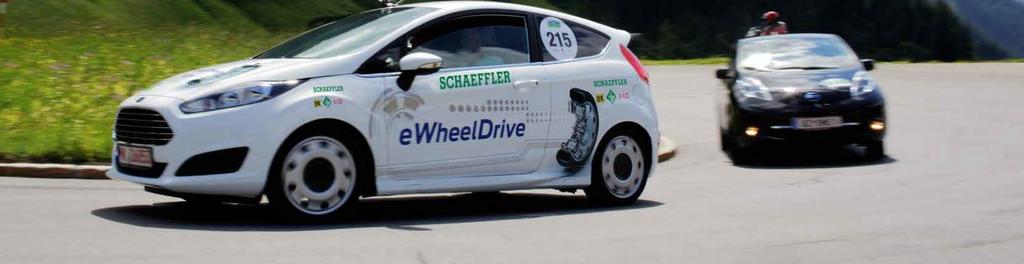
20 2 Mobility for tomorrow Environmentally friendly drives Market specific concepts to fulfill regional legislation requirements Schaeffler Schaeffler Hybrid Hybrid Fiesta ewheeldrive Fiesta ewheeldrive Schaeffler CO 2 ncept-10% Schaeffler CO 2 ncept-10% Schaeffler ACTIVeDRIVE Schaeffler ACTIVeDRIVE China Concept Car China Concept Car Schaeffler Efficient Future Schaeffler Mobility Efficient North America Future Mobility North America 1. Gasoline Technology 1. Gasoline Car 2. Diesel Technology Eco Drive Car 3. 48V 2. Diesel Democar Eco Drive 3. 48V Democar Schaeffler Efficient Future Schaeffler Mobility Efficient India Future Mobility India Page 20

21 2 Mobility for tomorrow Environmentally friendly drives Meeting stringent US emission targets of 2020 already today Efficient Future Mobility Schaeffler North America Demonstration Vehicle Developed in North America for market-specific demands and customer requirements Schaeffler shows solutions for optimizing North American combustion engines and drive trains Additional fuel savings potential up to 15% Fuel reduction in % Technology City Highway Belt Drive Friction Optimization Valve Train Friction Optimization Balance Shaft Bearings Thermal Management Module Adaptive Grill Shutters Engine Start-Stop AWD Disconnect Wheel Bearings Optimization TC with Centrifugal Pendulum-type Absorber Total: ~15 ~14 Page 21
 Ford Focus, 1.")
22 2 Mobility for tomorrow Environmentally friendly drives Newest concept car Conti/Schaeffler shows further fuel saving potential Gasoline Technology Car Fuel reduction in % (simulation according to NEDC) Ford Focus, 1.0l 3-Zylinder, turbo charger, 92 kw, 114 g/km CO 2, Start/Stop, EU5 Mild Hybridization 48V BSA, thermal management module, coated tappets, decoupling belt tensioner, optimized turbo charger, engine control unit, injection system, heated catalyst, low-pressure EGR, hydr. clutch actuator, DMF with centrifugal pendulum absorber Fuel savings potential ~15% (aim ~17%: 95 g/km) and emission reduction EU6c Measure Reduction Start/stop 20 km/h 1.1 Recuperation 2.6 Torque repartition 0.8 Dedicated braking pedal 0.5 Free gear selection 5.4 External exhaust gas recirculation (EGR) 2.0 Electric heatable catalyst 2.0 Thermal management module (real simulation) 1.0 Total ~15 Emission reduction In addition to fuel savings, emission reduction (NMHC, NO x, CO, PM) was achieved to comply with the guideline EU6c. Page 22
23 2 Mobility for tomorrow Environmentally friendly drives Successful cooperation with Continental adding value for our customers Product Development Advanced Development Research Transmission Systems Hybrid Double Clutch Transmission Mechatronics for Drivetrain Actuation Engine Systems Electric Cam Phasing Systems Turbo Charger Chassis Systems Anti Roll Stabilizer Hybridization Electric Axle Drives Automotive Concepts Gasoline Technology Car Diesel Eco Drive Industrial Concepts Initiative "Farming 2025" emobility Wheel Hub Drive Mechanics/ Mechatronics Expertise System-orientated approach creating customer value Electrics/ Electronics Expertise Page 23


24 2 Mobility for tomorrow Urban Mobility 2 Urban Mobility Page 24
25 2 Mobility for tomorrow Urban Mobility Urbanization megatrend changes urban mobility needs Today: 7.1 bn people 50% in metropolitan regions 2020: 8.3 bn people 60% in metropolitan regions Page 25


 NEVs are defined as fully electric or hybrid")
 and Hybrid Electric Vehicles (50 km range) Minimum speed")

26 2 Mobility for tomorrow Urban Mobility New concepts for urban mobility needs Strong focus on electric mobility in China E-bikes and e-scooters Openness towards new technologies Increasing income Pursuit of individual mobility Around million e-bikes and e-scooters are sold each year in China E-Wheel Drive Schaeffler innovation Electric motor, power electronics, brake, and cooling system are installed inside the wheel rim Schaeffler employees in China using e-bikes and e-scooters New Energy Vehicles (NEVs) NEVs are defined as fully electric or hybrid vehicles on four wheels Subsidies for Battery Electric Vehicles (150 km range) and Hybrid Electric Vehicles (50 km range) Minimum speed requirement: 100 km/h Concept vehicle Ford Fiesta ewheeldrive Driving systems especially for urban use Space-saving vehicle concept Increased maneuverability and safety Page 26


27 2 Mobility for tomorrow Interurban Mobility 3 Interurban Mobility Page 27
: China High-Speed Rail; On the Economist Fast Track Siemens AG Schaeffler test rigs for railway axlebox bearings,")

28 2 Mobility for tomorrow Interurban Mobility Key technology partner for high speed trains Chinese cities connected by high-speed trains Schaeffler solutions 100% 80% 80% 90% 95% 100% 60% 40% 45% 20% 20% Source: Morgan Stanley Research (May 15, 2011): China High-Speed Rail; On the Economist Fast Track Siemens AG Schaeffler test rigs for railway axlebox bearings, Schweinfurt, DE and Anting, CN More than 250 Chinese cities and regions with a total population of about 700 million will be connected by 2020 The China high-speed rail system will span 30,000 kilometers and will mobilize 4 billion travelers per year At peak speed, the high-speed rail grid can support speeds of 350 km/h Mechatronic functions in axlebox bearings: the integrated wheelset generator allows energy for freight transport to be supplied and includes a monitoring system for freight trains Page 28

: Boeing Commercial Airplanes, Estimated Growth Rates p.a., Market Outlook")
29 2 Mobility for tomorrow Interurban Mobility High precision components for the aerospace industry Air traffic growth until 2030 Schaeffler solutions +7.5% +7.0% +7.2% +6.7% +5.9% +3.6% Asia/ Pacific China Europe Middle East South America North America Boeing Source: Boing (2011): Boeing Commercial Airplanes, Estimated Growth Rates p.a., Market Outlook Assembly of aerospace bearings in Schweinfurt, Germany Air traffic will significantly grow in the next 15 years High growth rates in the Asia/Pacific region and China Schaeffler expects to over-proportionally benefit from market growth Main shaft and gearbox bearings, e.g. for Airbus A380 Page 29


30 2 Mobility for tomorrow Energy chain 4 Energy chain Page 30
 Wind 12% Nuclear 6% Oil 1% Gas 6% Coal12% Source: International Energy Agency (2011): World Energy Outlook")
31 2 Mobility for tomorrow Energy chain Renewable energies attract one third of total energy investments Wasserkraft Global Solar- investments und Windenergie new power plants and infrastructure Solar PV 7% Other Regenerative 4% Water 8% Power grids 44% (Infrastructure) Wind 12% Nuclear 6% Oil 1% Gas 6% Coal12% Source: International Energy Agency (2011): World Energy Outlook Page 31


32 2 Mobility for tomorrow Energy chain Renewable energy offers attractive growth possibilities Wave power Wind power Schaeffler uses a special steel that is resistant to corrosion for the rolling bearing rings. Large-size bearing test rig in Schweinfurt, Germany For ocean current power plants, Schaeffler develops bearing supports that can be directly installed in water. The water is the medium that provides the lubrication. Schaeffler's spherical roller bearing "X-life" is the classic bearing variant for the rotor main shaft in wind turbines. Page 32
33 2 Mobility for tomorrow We create "Mobility for tomorrow" 1 We are development partner for all mobility concepts in all markets. 2 We offer solutions along the entire value chain: from the production of energy over innovative mobility concepts to aftermarket services. 3 We help our customers to meet future legislation requirements in all regions. 4 We become more and more a systems supplier while keeping our strong positioning in components. 5 We drive future market trends and add customer value by combining our mechanics expertise with the electronics know-how of Continental. Page 33
34 Agenda 1 Highlights 2013 K. Rosenfeld 2 "Mobility for tomorrow" Prof. Dr P. Gutzmer 3 Results FY 2013 K. Rosenfeld Page 34
35 3 Results FY 2013 Solid performance in 2013 FY 2012 in EUR mn FY 2013 as reported in EUR mn in EUR mn / % FY 2013 adjusted 1) in EUR mn in EUR mn / % 1) 1 Sales 11,125 11, % 11, % EBITDA 2,031 1, % 2, % EBITDA margin 18.3% 14.6% -3.7%pts. 18.4% +0.1%pts. 2 EBIT 1, % 1, % EBIT margin 12.7% 8.8% -3.9%pts. 12.6% -0.1%pts. 3 4 Net income 2) mn 1, mn Free cash flow mn mn Gross debt 7,261 6,190-1,071 mn 6,190-1,071 mn Net debt 6,828 5, mn 5, mn 5 Leverage ratio 3) ) Without one-off effects (restructuring expense of EUR 48 mn and provision for EU antitrust investigation of EUR 380 mn) 3) Excluding shareholder loans 2) Attributable to shareholders of the parent company; prior year amount restated for initial application of net interest approach required by IAS 19 (rev. 2011) Page 35
36 3 Results FY Organic growth 2.9% p.a. Sales in EUR mn FY 2013 sales by region 1) in EUR mn and y-o-y growth 2,858 2,794 2,770 2, % vs. FY ,756 2,858 2,811 2,780 Asia/Pacific 1,130 / -2.0% Greater China 1,190 / +8.4% 11% 10% Americas 2,359 / +1.7% 21% EUR 11,205 mn 58% Europe 6,526 /-0.4% 11,125 11,205 Q1 Q2 Q3 Q4 Q1 Q2 Q3 Q Gross margin 31% 30% 31% 27% 29% 29% 27% 29% 30% 28% Sales by division in EUR mn FY 2012 FY 2013 D D excl. FX effects Automotive 7,658 8, % 8.6% Industrial 3,406 3, % -8.1% Total 11,125 2) 11, % 2.9% 1) Market view (= location of customers) 2) Incl. other sales of EUR 61 mn Page 36
37 3 Results FY Adjusted EBIT margin 12.6% Adjusted EBIT in EUR mn Significant one-off effects in EUR mn -3 mn vs Q1 Q2 Q3 Q4 FY ) 324 2) Reported EBIT Reported EBIT margin % 12.9% 11.2% -2.0% 8.8% Restructuring provision ,413 1,410 EU investigation provision Q1 Q2 Q3 Q4 Q1 Q2 Q3 Q4 Adjusted EBIT ,410 Adjusted EBIT margin % 13.6% 13.1% 10.0% 12.9% 12.9% 12.9% 11.7% Adjusted EBIT margin 12.9% 12.9% 12.9% 11.7% 12.6% 1) Excl. one-off effects of EUR 48 mn Q3: EUR 314 mn 2) Excl. one-off effects of EUR 380 mn Q4: EUR -56 mn Page 37
38 3 Results FY Net income EUR 865 million Net income 2013 in EUR mn Development net income in EUR mn per quarter 11, ) , Sales Costs EBIT Financial Investment Taxes/ result result minorities Net income 1) The amount includes a EUR 187 mn gain on the disposal of shares representing a 1.95 % interest in Continental AG in the third quarter of 2013 and EUR 3 mn other investment result Q1 Q2 Q3 Q Q1 Q2 Q3 Q4 Page 38
39 3 Results FY Financial result EUR 442 million Financial result¹ ) in EUR mn Composition of financial result¹ ) in EUR mn Q1 Q2 Q3 Q4 Q1 Q2 Q3 Q4 Non-Cash Cash Financial result (P&L) Fair value changes and FX effects Others accrued (mainly pension expenses) Transaction costs Accrued interest Cash financial result Cash interest expenses financial debt Hedging Transaction costs / other 1) For presentation purposes negative results are shown as positive figures 1) For presentation purposes negative results are shown as positive figures Page 39
40 3 Results FY At equity result Continental AG EUR 611 million Net income Continental in EUR mn At equity result from Continental in EUR mn ) Q1 Q2 Q3 Q4 FY Q1 Q2 Q3 Q4 FY Net Income Continental Conti shares (per 31/12/2013: 34,2%) , , PPA ,905 1,923 Dilution Loss/ Other Q1 Q2 Q3 Q4 Q1 Q2 Q3 Q4 At Equity Result Sales ,320 8,187 8,134 8,096 8,033 8,541 8,350 8,407 EBIT ) Before restatement for initial application of net interest approach required by IAS 19 (rev. 2011) Page 40
41 3 Results FY Free cash flow EUR 629 million Free Cash Flow in EUR mn Free cash flow FY 2013 in EUR mn 1, ) ) ) Q1 Q2 Q3 Q Q1 Q2 Q3 Q Q EBITDA Δ Net working capital Capex Dividends Interest payments Taxes Other Free cash flow ) Dividend from Continental AG 2) Including one-off payment for close-out of interest hedge derivatives Page 41
42 3 Results FY 2013 Working Capital efficiency 20.9% Capex 5.1% of sales Working Capital in EUR mn Capex spent 1) in EUR mn 2,642 2,723 2,677 2,432 2,616 2,613 2,650 2, Q1 Q2 Q3 Q4 Q1 Q2 Q3 Q4 Q1 Q2 Q3 Q4 Q1 Q2 Q3 Q in % of sales 1) in % of sales % 5.1% Inventories 1) Calculation based on LTM sales 1) Cash view Page 42
43 3 Results FY Gross debt reduced by approximately EUR 1.1 billion Net financial debt Leverage ratio in EUR mn 7,164 7,094 6,940 6,828 Gross debt -1,071 mn 6,834 6,475 5,729 5,890 in EUR mn FY 2012 FY 2013 Gross debt 7,261 6,190 - Cash = Net debt 6,828 5,890 - Shareholder loans = Net debt w/o shareholder loans 6,505 5,447 LTM EBITDA 2,031 1,634 = Leverage ratio LTM EBITDA adjusted 2, x x x x x x x ) 443 = Leverage ratio adjusted 2.6 Maturities in EUR bn 3.0 Gross debt 7,455 Cash position 291 7, , , , , , , Leverage ratio (Net financial debt without shareholder loans / LTM EBITDA) 1) Based on EBITDA without one-off effects Shareholder loans Bonds Senior Term Loans and RCF Page 43
44 3 Results FY 2013 Cash payments of EUR 104 million to HoldCo Corporate structure Chart simplified for illustration purposes Key aspects Schaeffler Holding Schaeffler Holding GmbH & Co. KG 100% Solid cash flow generation on Schaeffler Group (FCF in FY 2013: EUR 629 mn) Sufficient restricted payment basket to serve Holding cash needs for permitted uses HoldCo Debt Service Schaeffler Verwaltungs GmbH 100% Conti Dividend 11.8% Permitted HoldCo purposes of EUR 168 mn in 2013 Total cash payments to HoldCo of EUR 104 mn in 2013 FY FY Free Cash Flow OpCo RPB 1) Permitted HoldCo Purposes 2) Cash to HoldCo 3) 89 4) 104 Upstream Cash Payment Schaeffler Group Schaeffler AG Continental AG 1) RPB = Annual Restricted Payment Basket 2) Permitted purposes are administration cost, interest and taxes 3) Cash upstreamed to HoldCo under permitted purposes 4) Excluding withholding tax on Schaeffler AG dividend of EUR 79 mn Page 44
45 3 Results FY 2013 Balance sheet quality improved EUR 5.8 billion hidden reserves Balance sheet in EUR mn Assets Fixed 4,432 33% Assets as of December 31, 2013 Liabilities Balance sheet of Schaeffler Group with total assets of EUR 13.4 bn and quality improvement Equity 2,491 19% Key aspects Equity EUR 2.5 bn, equity ratio improved to 19% Shareholder loans 443 3% Financial debt 5,747 43% Market value of Continental shares significantly above book value leading to hidden reserves Continental 5,081 38% Share price Total Book value EUR 74.3 per share EUR 5,081 mn Inventories 1,536 11% Trade 1,676 12% receivables Provisions for 1,516 11% pensions Trade 1,014 8% payables Other 2,216 16% liabilities Market value 1) Hidden reserves EUR per share EUR 85.1 per share EUR 10,901 mn EUR 5,820 mn Others 402 3% Cash 300 2% Total Assets 13, % Total Liabilities 13, % 1) As of December 31, 2013 Page 45
46 3 Results FY 2013 Solid performance in Organic growth 2.9% driven by strong growth in Automotive 2 Earnings quality maintained, adjusted EBIT margin at 12.6% 3 Net income EUR 865 mn after EUR 870 mn in Strong free cash flow generation of EUR 629 mn Strong basis for future growth 5 Working capital efficiency improved, capex with 5.1% of sales on target 6 Gross debt reduced by EUR 1.1 bn, leverage ratio 2.6x 7 Balance sheet quality improved, EUR 5.8 bn of hidden reserves Page 46
47 3 Results FY 2013 Ambitious targets for 2014 Growth Profitability Sales growth 5-7% 1) EBIT margin 12-13% Capex 6-8% of sales Free cash flow Positive 1) Excl. FX effects Quality Innovation Quality policy Further improve R&D expenses 5% of sales Employees ~ 3,000 new jobs Innovation Maintain leading position in patent applications Page 47

48 "Mobility for tomorrow" by Schaeffler Page 48


49 Schaeffler IR contact Investor Relations phone: fax: ir@schaeffler.com Financial calendar 2014 FY 2013 results: March 20, 2014 Q results: May 21, 2014 Q results: August 27, 2014 Q results: November 20, 2014 Page 49
50 Backup Results FY 2013 Automotive and Industrial division show different growth dynamics Sales Automotive Sales Industrial in EUR mn 6.6% 1) vs. FY 2012 in EUR mn 1,933 1,904 1,918 1,903 1,988 2,088 2,053 2, % 1) vs. FY ,658 8,165 3,406 3,040 Q1 Q2 Q3 Q4 Q1 Q2 Q3 Q4 Q1 Q2 Q3 Q4 Q1 Q2 Q3 Q Gross profit margin Gross profit margin 28% 28% 29% 26% 27% 28% 27% 27% 39% 36% 36% 28% 33% 32% 29% 32% 28% 27% 35% 32% 1) Includes negative FX effects of 2.0% 1) Includes negative FX effects of 2.6% Page 50
51 Backup Results FY 2013 Automotive Sales growth strongly outpacing market growth Regional development Automotive 1) Key aspects Asia/Pacific +15% Europe Schaeffler Automotive significantly outgrew global automotive production in % -1% 1% All business divisons contributed to overall growth Revenue growth driven by Asia/Pacific and North America North America 5% World production: + 3% Schaeffler Automotive: + 9% (operational sales growth) +13% +6% South America +6% Engine systems: Growth driven by the top-selling product groups camshaft phasing units and valve train components Transmission systems: Growth driven by dry double clutches and top-selling product groups like variable transmission systems (CVT), tapered roller bearings and clutch components Production of light vehicles 2013 vs (IHS Global Insight) Operational sales growth Schaeffler Automotive (OEM) 2013 vs (by location of customer) Chassis systems: Growth driven by ball screw drives used for instance in electromechanical power steering systems and chassis solutions (e.g. in electromechanical parking brakes) 1) Schaeffler Automotive sales growth by region is not necessarily an indication of actual end-customer demand by region (e.g. European sales include components and systems sold to customers in Europe who ultimately export the final product to customer locations in North and South America as well as Asia/Pacific). Page 51
52 Backup Results FY 2013 Industrial A challenging year for industrial markets Sales development of key industrial business units Key aspects Other ~16% Industrial Aftermarket ~37% Sales 2013 vs Aftermarket Production Machinery Power Transmission Heavy Industries Off-Highway Equipment Renewable Energies Production Machinery Power Transmission Renewable Energies Off-Highway Equip. Aerospace Heavy Industries Aerospace Sales decreased in all sectors apart from Aerospace Aftermarket: Strong inventory reductions of distributors led to significant sales decrease, especially in Asia/Pacific Production Machinery: Significant cool-down of demand in all regions Power Transmission: Significant cool-down of demand, especially in Asia/Pacific and Europe Off-Highway Equipment: Decrease of demand especially in construction machinery Renewable Energies: Overcapacities and strong pricing competition in all regions Aerospace: Growth in civil aircraft engine bearings continues Page 52
53 Backup Results FY 2013 Automotive EBIT impacted by one-off restructuring expense in Q4 EBIT Automotive in EUR mn +13.4% vs. FY 2012 (before one-offs) EBIT Industrial in EUR mn ) ) % vs. FY 2012 (before one-offs) ) Q1 Q2 Q3 Q4-115 Q1 Q2 Q3 Q Q1 Q2 Q3 Q4 Q1 Q2 Q3 Q4 EBIT margin EBIT margin 12.6% 13.6% 13.6% 12.3% 13.9% 14.5% 13.2% 1) -7.6%% 2) 17.3% 13.8% 12.4% 4.4% 10.2% 8.7% 5.5% 3) 7.9% 13.0% 9.0% 12.2% 8.1% ) EBIT and EBIT margin before one-off restructuring expense: EUR 287 mn and 14.0% 2) EBIT and EBIT margin before one-off provision: EUR 265 mn and 13.0% 1) EBIT and EBIT margin before one-off restructuring expense: EUR 75 mn and 9.9% Page 53
54 Backup Financing and capital structure Overview corporate and capital structure Corporate structure Schaeffler Holding S Holding Finance B.V. Schaeffler Group 100% Schaeffler Finance B.V. 100% INA Beteiligungs GmbH INA-Holding Schaeffler GmbH & Co. KG 100% Schaeffler Holding GmbH & Co.KG Schaeffler Verwaltungs GmbH 100% 100% Schaeffler AG 100% 100% Schaeffler Technologies GmbH & Co. KG 34.2% Chart simplified for illustration purposes 11.8% Free float 54.0% Continental AG Capital structure Schaeffler Holding Schaeffler Group Debt instrument Nominal in EUR mn Interest Maturity Rating 6.875% SSNs 2018 (EUR) 1) % Aug 18 B1 / B 6.875% SSNs 2018 (USD) 1) 3) ~ % Aug 18 B1 / B Junior Term Loan B1 937 E+5.25% Jun-17 Not rated Junior Term Loan B % PIK Jun-17 Not rated Junior Term Loan B3 148 E+1.25% % PIK Jun-17 Not rated Junior Term Loan B4 263 E+5.25% Jun-17 Not rated Junior RCF (200mn) - E+5.25% Jun-17 Not rated Schaeffler Holding Debt 3,255 Senior Term Loan D 730 E+2.875% Jul 16 Not rated Senior Term Loan C (EUR) 299 E+3.75% 2) Jan 17 Ba2 /BB- Senior Term Loan C (USD) 3) 1,258 L+3.25% 2) Jan 17 Ba2 /BB- Senior RCF (EUR 1,000 mn) - E+2.875% Jul 16 Not rated Total Senior Facilities 2, % SSNs 2017 (EUR) % Jul-17 Ba2 / BB- 7.75% SSNs 2017 (EUR) % Feb-17 Ba2 / BB- 7.75% SSNs 2017 (USD) 3) ~ % Feb-17 Ba2 / BB- 4.25% SSNs 2018 (EUR) % May-18 Ba2 / BB- 8.75% SSNs 2019 (EUR) % Feb-19 Ba2 / BB- 8.50% SSNs 2019 (USD) 3) ~ % Feb-19 Ba2 / BB- 4.75% SSNs 2021 (USD) 3) ~ % May-21 Ba2 / BB- Total Outstanding Bonds 3,570 Schaeffler Group Debt 5,857 Total Total Debt 9,112 1) Senior Secured PIK Toggle Notes 2) Floor of 1.00 % 3) Assuming EUR/USD = 1.35 Page 54
2.2 Deep-dive E-Mobility
 Dr. Jochen Schröder President Business Division E-Mobility Capital Markets Day 2018 Berlin Disclaimer This presentation contains forward-looking statements. The words "anticipate", "assume", "believe",
2.1 Automotive OEM. Matthias Zink CEO Automotive OEM. September 20, 2018 Capital Markets Day 2018 Berlin
 2.1 Automotive OEM Matthias Zink CEO Automotive OEM Capital Markets Day 2018 Berlin Disclaimer This presentation contains forward-looking statements. The words "anticipate", "assume", "believe", "estimate",
CONFERENCE CALL RESULTS Q1 2017
 CONFERENCE CALL RESULTS Q1 2017 May 5, 2017 Marc Bunz (CFO) Nicolas-Fabian Schweizer (CTO) AGENDA Market & Strategy Update Financials 2016 Financials Q1 2017 Outlook SCHWEIZER Share Schweizer Electronic
Volvo Group THIRD QUARTER 2015 JAN GURANDER. Volvo Group Headquarters Third quarter
 Volvo Group THIRD QUARTER 2015 JAN GURANDER 1 VOLVO GROUP Third quarter highlights NET SALES SEK bn 12 months 310 bn IMPROVED PROFITABILITY ON FLAT VOLUMES UNDERLYING OPERATING MARGIN 6.9% 67 73 OPERATING
2003 fourth quarter and full-year results
 Dinesh Paliwal Member of Group Executive Committee, Head of Automation Technologies Division 2003 fourth quarter and full-year results Automation Technologies Copyright 2003 ABB. All rights reserved. -
ZF posts record sales in 2017; announces increased research and development activities
 Page 1/5, March 22, 2018 ZF posts record sales in 2017; announces increased research and development activities ZF chief executive officer announces further expansion of research and development activities
Europe Far East Trade Product Changes from April March 29, 2018
 Europe Far East Trade Product Changes from April 2018 March 29, 2018 Agenda 01 02 03 Trade Overview North Europe Far East Mediterranean Far East 01 North Trade Europe Overview North America Strengths of
Q Analyst Teleconference. 9 August 2018
 9 August 218 Disclaimer This presentation contains forward-looking statements that reflect the Company management s current views with respect to certain future events. Although it is believed that the
Earnings conference call
 Earnings conference call Full year 2017 Åke Bengtsson, President & CEO Andreas Ekberg, Acting CFO February 14, 2018 1 Agenda Business Summary Market Update Sales Financials Way forward 2 Business Summary
NAIAS Klaus Rosenfeld CEO Schaeffler AG January 15, 2018
 NAIAS 2018 Klaus Rosenfeld CEO Schaeffler AG January 15, 2018 Agenda 1 2 3 4 Overview Schaeffler Group Strategy "Mobility for tomorrow" Technology competence as a key growth driver Summary 2 1 Overview
THREE MONTHS REPORT, JAN MARCH 2016
 THREE MONTHS REPORT, JAN MARCH 2016 TELEPHONE CONFERENCE 26 APRIL, 2016, AT 14:30 CET TOMMY ANDERSSON, PRESIDENT AND CEO HELENA WENNERSTRÖM, EVP AND CFO TO PARTICIPATE, PLEASE CALL 5 MINUTES BEFORE THE
Earnings conference call. Q4 and Full year 2015
 Earnings conference call Q4 and Full year 2015 Bo Annvik, CEO / Åke Bengtsson, CFO 11 February 2016 1 Agenda Business Highlights Market Update Sales Financials Outlook 2 2015 in numbers Operating margin
BMW Group posts record earnings for 2010
 10.03.2011 BMW Group posts record earnings for 2010 Profit before tax rises to euro 4,836 million Profit before financial result climbs to euro 5,094 million Automobiles segment reports EBIT of euro 4,355
Valvoline Fourth-Quarter Fiscal 2016 Earnings Conference Call. November 9, 2016
 Valvoline Fourth-Quarter Fiscal 2016 Earnings Conference Call November 9, 2016 Forward-Looking Statements This presentation contains forward-looking statements within the meaning of Section 27A of the
third QUARTER 2012 October 26, 2012
 third QUARTER 212 October 26, 212 Helena norrman Senior Vice President Communications third QUARTER 212 October 26, 212 This presentation contains forward-looking statements. Such statements are based
GROUPE RENAULT NATIXIS CONFERENCE INDUSTRIALS PLENARY SESSION
 GROUPE RENAULT NATIXIS CONFERENCE INDUSTRIALS PLENARY SESSION DISCLAIMER Information contained within this document may contain forward looking statements. Although the Company considers that such information
Roadshow Presentation
 Roadshow Presentation June 2, Wilfried Trepels, CFO 1 SAF-HOLLAND - Components Fifth Wheels Kingpins Suspensions Landing Gear Axle Systems 2 SAF-HOLLAND - Business Units Trailer Systems Powered Vehicle
BERNSTEIN STRATEGIC DECISIONS CONFERENCE 2018
 ABB LTD, NEW YORK CITY, USA, 31 MAY 2018 Positioned for profitable growth BERNSTEIN STRATEGIC DECISIONS CONFERENCE 2018 Ulrich Spiesshofer, CEO Important notice This presentation includes forward-looking
Corporate Communications. Media Information 15 March 2011
 15 March 2011 BMW Group aims to further increase earnings in 2011 EBIT margin of over 8% expected in Automobiles segment Sales volume of well in excess of 1.5 million vehicles targeted Margin of 8% to
Kongsberg Automotive ASA. Fourth quarter February 28, 2019
 Kongsberg Automotive ASA Fourth quarter - February 28, 2019 Highlights Q4 Sales Revenues grew by 21 (7.3%) YoY to 288 including negative FX effects of 1. We booked new business with 77 in expected annual
Schaeffler AG dbaccess AutoTech Day
 Schaeffler AG dbaccess AutoTech Day 22 nd June 2018; Winchester House, London M. Zink & Dr. J. Schröder CEO Automotive OEM Schaeffler AG President Business Division E-Mobility Schaeffler at a glance Today's
Financial Statements Matti Lievonen, President & CEO 7 February 2017
 Financial Statements 2016 Matti Lievonen, President & CEO Agenda 1 2 3 4 Year 2016 Financials 2016 Segment reviews Current topics 5 Appendix 2 Disclaimer The following information contains, or may be deemed
FISCAL YEAR MARCH 2018 FIRST HALF FINANCIAL RESULTS
 FISCAL YEAR MARCH 2018 FIRST HALF FINANCIAL RESULTS PRESENTATION OUTLINE Highlights Fiscal Year March 2018 First Half Results Fiscal Year March 2018 Full Year Forecast Progress of Key Initiatives/ Business
Annual Press Conference 2011 Results
 Annual Press Conference 2011 Results Dr. Dieter Zetsche Chairman of the Board of Management Head of Mercedes-Benz Cars February 09, 2012 2 Last year s outlook Daimler results in 2011 Set all-time sales
2010 1Q Investor Meeting. May 2010
 2010 1Q Investor Meeting May 2010 This presentation contains preliminary figures which may be materially different from the final figures. While the statements in this presentation represent our current
Executing our strategy
 Entwurf 19.09.2018 15h00 Executing our strategy Schaeffler AG Global Auto Industry Conference January 15, 2018 Detroit Agenda 1 Schaeffler at a glance 9M 2018 results and current market environment 2 Strategy
Volkswagen Brand Financial Results January June 2017 Conference Call and Webcast
 Volkswagen Brand Financial Results January June 2017 Conference Call and Webcast Disclaimer The following presentations contain forward-looking statements and information on the business development of
MONRO MUFFLER BRAKE, INC. PROVIDES FOURTH QUARTER AND FISCAL 2017 FINANCIAL RESULTS
 CONTACT: John Van Heel Chief Executive Officer (585) 647-6400 Robert Gross Executive Chairman (585) 647-6400 FOR IMMEDIATE RELEASE Brian D Ambrosia Senior Vice President Finance Chief Financial Officer
1 st Half 2018 Results. August 1 st, 2018
 1 st Half 2018 Results August 1 st, 2018 H1 HIGHLIGHTS & CATEGORY SPOTLIGHTS Gonzalve BICH 2 First Half 2018 Key Messages Challenging market and business environment Continued investment in targeted Brand
RESULTS 3RD QUARTER AND NINE MONTHS OF 2016/17 1 APRIL 2016 TO 31 DECEMBER 2016
 RESULTS 3RD QUARTER AND NINE MONTHS OF 2016/17 1 APRIL 2016 TO 31 DECEMBER 2016 16 February 2017 Agenda 1. LEM at a Glance 2. Highlights and Business Review 3. Financial Review 4. Strategy and Outlook
Deutsche Bank Auto Industry Conference. January 17, 2018
 Deutsche Bank Auto Industry Conference January 17, 2018 Safe Harbor Statement Statements contained in, or incorporated by reference into this presentation, future filings by us with the Securities and
Months Investor Presentation
 2018 9 Months Investor Presentation 25.10.2018 Disclaimer Ereğli Demir Çelik Fabrikaları T.A.Ş. (Erdemir) may, when necessary, make written or verbal announcements about forward-looking information, expectations,
Volkswagen Group Capital Markets Day 2017 Volkswagen Truck & Bus
 Volkswagen Group Capital Markets Day 2017 Volkswagen Truck & Bus Andreas Renschler Board of Management, Commercial Vehicles Capital Markets Day, 14 th of March 2017 Disclaimer The following presentations
Proposed acquisition of Areva Distribution. December 2, 2009
 Proposed acquisition of Areva Distribution December 2, 2009 Disclaimer All forward-looking statements are Schneider Electric management s present expectations of future events and are subject to a number
Inland Truck Shortage in North America. February 2018
 Inland Truck Shortage in North America February 2018 1 Inland Truck Shortage in North America Continues Industry is experiencing severe truck shortages in certain locations in North America Challenges
Deep-dive E-Mobility
 Dr. Jochen Schröder President Business Division E-Mobility CES - 17th Annual J.P. Morgan Auto Tech Conference Las Vegas Automotive OEM at a glance Automotive OEM At a Glance Sales and EBIT margin 3) Sales
Strong performance by the Bolloré Group s operating activities in 2018 Mr Cyrille Bolloré unanimously appointed Chairman and Chief Executive Officer
 PRESS RELEASE 2018 results (1) March 14, 2019 Strong performance by the Bolloré Group s operating activities in 2018 Mr Cyrille Bolloré unanimously appointed Chairman and Chief Executive Officer Revenue:
Schaeffler Corporate Presentation
 Schaeffler Corporate Presentation Schaeffler A leading global technology company Schaeffler Group at a glance Integrated automotive and industrial supplier Continuous sales growth from in EUR bn Around
2010 Interim Results Presentation. August 23, 2010 Hong Kong
 Sinopec Corp. 21 Interim Results Presentation August 23, 21 Hong Kong Disclaimer i This presentation and the presentation materials distributed herein include forwardlooking statements. All statements,
Fact Sheet for Q April 22, 2016
 Fact Sheet for Q1 2016 April 22, 2016 Contents Daimler Group Stock Market Information 3 Earnings and Financial Situation 4-13 Information for Divisions Mercedes-Benz Cars 14-17 Daimler Trucks 18-22 Mercedes-Benz
Earnings conference call Q4 & FY 2016
 Earnings conference call Q4 & FY 2016 Bo Annvik, CEO / Åke Bengtsson, CFO February 10, 2016 1 Agenda Business Highlights Market Update Sales Financials Way forward 2 Business Summary FY 2016 A year with
Investor Presentation. March 2017
 Investor Presentation March 2017 Disclaimer During this presentation management may discuss certain forwardlooking statements concerning Nemak s future performance that should be considered as good faith
Earnings conference call Q3 2016
 Earnings conference call Q3 2016 Bo Annvik, CEO / Åke Bengtsson, CFO October 25, 2016 1 Agenda Business Highlights Market Update Sales Financials Outlook Public offer 2 Business Highlights Q3 2016 Solid
February Annual Results February 13, 2008
 February 2008 1 Annual Results February 13, 2008 AGENDA AGENDA 2007 Highlights 2007 Financial Results x Competitiveness Sales and products dynamic International 2008 Outlook February 2008 2 2007: performance
FISCAL YEAR MARCH 2014 FINANCIAL RESULTS
 FISCAL YEAR MARCH 214 FINANCIAL RESULTS Mazda CX-5 Mazda Atenza Mazda Motor Corporation April 25, 214 New Mazda Axela 1 PRESENTATION OUTLINE Highlights Fiscal Year March 214 Results Fiscal Year March 215
I remind you that our presentation is available on our website. We can start from the first 2 slides that show Piaggio Group First
 CONFERENCE CALL 2009 1 st HALF RESULTS Good afternoon and welcome to everybody. I remind you that our presentation is available on our website. We can start from the first 2 slides that show Piaggio Group
Investor presentation May The Origin of HighTech.
 Investor presentation May 2014 The Origin of HighTech. Agenda DEUTZ strategy & positioning Financials Outlook 2 DEUTZ at a glance 150 years DEUTZ a tradition of achievement Independent manufacturer of
Third quarter results Matti Lievonen, President & CEO 26 October 2017
 Third quarter results 2017 Matti Lievonen, President & CEO 26 October 2017 Agenda 1. Q3/17 Group financials 2. January-September 2017 review 3. Q3/17 Segment reviews 4. Current topics 5. Appendix 2 Disclaimer
Annual General Meeting Infineon Technologies AG
 Annual General Meeting Infineon Technologies AG Peter Bauer, Chief Executive Officer Infineon Technologies AG Munich, February 17, 2011 Infineon is in a better shape than ever before Restructuring Refinancing
Manz Automation AG. Conference Call, Full Year Results 2009 March 30, 2010, Reutlingen Dieter Manz/CEO, Martin Hipp/CFO
 Manz Automation AG Conference Call, Full Year Results 2009 March 30, 2010, Reutlingen Dieter Manz/CEO, Martin Hipp/CFO Manz Automation is a high-tech equipment supplier for high growth industries is an
FISCAL YEAR MARCH 2015 FIRST QUARTER FINANCIAL RESULTS. Mazda Roadster 25 th Anniversary Model
 FISCAL YEAR MARCH 2015 FIRST QUARTER FINANCIAL RESULTS Mazda Roadster 25 th Anniversary Model Mazda Motor Corporation July 31, 2014 1 PRESENTATION OUTLINE Highlights Fiscal Year March 2015 First Quarter
FISCAL YEAR END MARCH 2013 FIRST HALF FINANCIAL RESULTS. New Mazda6 (Atenza)
") FISCAL YEAR END MARCH 2013 FIRST HALF FINANCIAL RESULTS New Mazda6 (Atenza) Mazda Motor Corporation October 31, 2012 1 PRESENTATION OUTLINE Highlights Fiscal Year March 2013 First Half Results Fiscal Year
FISCAL YEAR END MARCH 2013 FIRST HALF FINANCIAL RESULTS New Mazda6 (Atenza) Mazda Motor Corporation October 31, 2012 1 PRESENTATION OUTLINE Highlights Fiscal Year March 2013 First Half Results Fiscal Year
Q Results. Bodo Uebber. Member of the Board of Management Finance & Controlling and Daimler Financial Services
 Q1 2014 Results Bodo Uebber Member of the Board of Management Finance & Controlling and Daimler Financial Services April 30, 2014 1 Contents Results for Q1 2014 Outlook for 2014 Information on the Divisions
Investor Presentation. November 2018
 Investor Presentation November 2018 Safe Harbor Statement Statements in this presentation may contain forward-looking statements as contemplated by the 1995 Private Securities Litigation Reform Act that
Capital Markets Day Vienna November 26, 2015 Horst Binnig, CEO Automotive
 RHEINMETALL AG THE TECHNOLOGY GROUP FOR SECURITY AND MOBILITY Capital Markets Day Vienna November 26, 2015 Horst Binnig, CEO Automotive RHEINMETALL AG 2015 What we achieved since the CMD 2014 2016-2020,
MONRO, INC. ANNOUNCES SECOND QUARTER FISCAL 2018 FINANCIAL RESULTS
 CONTACT: Brett Ponton Chief Executive Officer (585) 647-6400 FOR IMMEDIATE RELEASE Brian D Ambrosia Senior Vice President Finance Chief Financial Officer (585) 647-6400 Investors and Media: Effie Veres
Third quarter AB Volvo
 Third quarter 2013 Third quarter 2013 TRUCKS EUROPE Excellent reception of the new products decision to optimize manufacturing Highlights in Commercial launch of the new product ranges Strong order situation
Full-year Report 2009
 Full-year Report 2009 Joakim Olsson CEO and President February 12, 2009 Innovative Vehicle Technology 2010-02-12 Summary 2009 Sales of SEK 5,622m (8,403) Adjusted for currency effects sales decreased by
FISCAL YEAR MARCH 2015 FIRST HALF FINANCIAL RESULTS. New Mazda Demio
 FISCAL YEAR MARCH 2015 FIRST HALF FINANCIAL RESULTS New Mazda Demio Mazda Motor Corporation October 31, 2014 1 PRESENTATION OUTLINE Highlights Fiscal Year March 2015 First Half Results Fiscal Year March
Kongsberg Automotive ASA. Third quarter November 7, 2018
 Kongsberg Automotive ASA Third quarter - November 7, Q3 Highlights Continued improvements in turbulent times Revenues increased YoY by MEUR 18.3 (~8%) to MEUR 259 including negative FX effects of MEUR
Agenda. Review. Strategy. Outlook
 1 Agenda Review 2006 Strategy Outlook 2007 2 Highlights 2006 Focus on Transport-Related Engineering Strong operational performance in all business areas Strong market environment Initiative taken for truck
3 rd Quarter 2017 Results
 Inside your life! 3 rd Quarter 2017 Results October 25, 2017 Mobile Automotive Display Semiconductor IoT LED Contents Ⅰ. Q3 2017 Earnings Summary Ⅱ. Earnings Highlight & Outlook Ⅲ. Results & Outlook by
FY16 results. Business updates. FY17 outlook. Nissan Motor Co., Ltd. May 11 th, 2017
 Nissan Motor Co., Ltd. May 11 th, 2017 results Business updates FY17 outlook www.nissan-global.com Copyright NISSAN MOTOR CO., LTD. All rights reserved. 2 (TSE REPORT BASIS CHINA JV EQUITY BASIS) NET REVENUE
SKF Capital Markets Day Automotive Market
 SKF Capital Markets Day Automotive Market Agenda SKF Automotive Market Market and SKF reality Strategy Application driven innovation Core application/product Core capabilities Create and capture customer
Investor Presentation. January 2019
 Investor Presentation January 2019 Safe Harbor Statement Statements in this presentation may contain forward-looking statements as contemplated by the 1995 Private Securities Litigation Reform Act that
#Q3_2018. Orange financial results. Ramon Fernandez Deputy CEO, Finance, Performance and Europe. 25 October 2018
 #Q3_20 Orange financial results Ramon Fernandez Deputy CEO, Finance, Performance and Europe 25 October 20 Disclaimer This presentation may contain forward-looking statements about Orange, particularly
WashTec AG Baader Bank Investment Conference Karoline Kalb WashTec AG
 WashTec AG Baader Bank Investment Conference 2017 Karoline Kalb WashTec AG What do they have in common? 2 WashTec AG BIC Carwash is an attractive business model around the globe Market drivers Consumer
Executing our strategy
 Entwurf 19.09.2018 15h00 Executing our strategy Schaeffler AG Kepler German Corporate Conference Frankfurt Agenda 1 Schaeffler at a glance 9M 2018 results and current market environment 2 Strategy Mobility
Nancy Gioia Director, Global Electrification Ford Motor Company
 Electrification of Transportation It s s a matter of when, not if Key Trends and Drivers for the Future June 14, 2011 Nancy Gioia Director, Global Electrification Ford Motor Company From our Executive
9M 2003 Financial Results (US GAAP)
") 9M Financial Results (US GAAP) January 2004 LUKOIL Group Crude Oil Production* mln tonnes 82 80 78 76 74 72 70 68 66 64 Crude oil production 3.2 5.5 3.9 76.8 70.3 71.3 2001 Production by subsidiaries Share
9M Financial Results (US GAAP) January 2004 LUKOIL Group Crude Oil Production* mln tonnes 82 80 78 76 74 72 70 68 66 64 Crude oil production 3.2 5.5 3.9 76.8 70.3 71.3 2001 Production by subsidiaries Share
Results 3 rd quarter and nine months of 2015/16. 1 April 2015 to 31 December 2015
 Results 3 rd quarter and nine months of 2015/16 1 April 2015 to 31 December 2015 16 February 2016 Agenda 1. LEM at a Glance 2. Highlights and Business Review 3. Financial Review 4. Strategy and Outlook
FISCAL YEAR MARCH 2018 FIRST QUARTER FINANCIAL RESULTS
 FISCAL YEAR MARCH 2018 FIRST QUARTER FINANCIAL RESULTS PRESENTATION OUTLINE Highlights Fiscal Year March 2018 First Quarter Results Fiscal Year March 2018 Full Year Forecast Structural Reform Stage 2 Progress
2013 Final Results. 19 March 2014
 2013 Final Results 19 March 2014 Important Notice The information contained herein is meant for presentation purposes only and may not be used and relied upon by any other party. It is not to be taken
ENEL PUBLISHES 2018 SECOND QUARTER AND FIRST HALF GROUP OPERATING DATA REPORT
 Media Relations Investor Relations T +39 06 8305 5699 T +39 06 8305 7975 F +39 06 8305 3771 F +39 06 8305 7940 ufficiostampa@enel.com investor.relations@enel.com enel.com enel.com ENEL PUBLISHES 2018 SECOND
First in Mind First in Choice. Capital Markets Day 2006 Gunnar Brock, President and CEO
 First in Mind First in Choice Capital Markets Day 26 Gunnar Brock, President and CEO 1 December 4, 26 www.atlascopco.com Atlas Copco in a Snapshot Continuing operations A world leading provider of industrial
Q2 and Half-Year 2017 Results. July 26, Q2 and Half-Year 2017 Results / July 26, 2017 /
 Q2 and Half-Year 2017 Results July 26, 2017 Q2 and Half-Year 2017 Results / July 26, 2017 / Contents Results for Q2 2017 Outlook for 2017 Development at the divisions Q2 and Half-Year 2017 Results / July
Zur Rose Group Q Trading Update
 Zur Rose Group Q3 2017 Trading Update Walter Oberhänsli Marcel Ziwica 17 October 2017 Agenda Highlights Business Update Financial Update Outlook Zur Rose Group Conference call 23 August 2017 3 Highlights
Q3 & 9M 2018 Results Presentation. October 24 th, 2018
 Q3 & 9M 2018 Results Presentation October 24 th, 2018 Q3 & 9M HIGHLIGHTS & CATEGORY SPOTLIGHTS Gonzalve BICH 3Q and 9M 2018 Results Presentation 2 9 Months 2018 Key Messages Continued challenging trading
TOFAŞ Q ANALYST PRESENTATION
 TOFAŞ Q1 2016 ANALYST PRESENTATION 03.05.2016 1 2016 Q1 AGENDA Highlights Turkish Automotive Industry Production & Capacity Utilization Domestic Market Developments Tofaş Domestic Market Performance Export
Deutsche Bank db Access German, Swiss & Austrian Conference. June 19, 2015, Berlin. Hans M. Schabert CEO
 Deutsche Bank db Access German, Swiss & Austrian Conference June 19, 2015, Berlin Hans M. Schabert CEO Disclaimer Note: This presentation contains statements concerning the future business trend of the
FISCAL YEAR MARCH 2018 THIRD QUARTER FINANCIAL RESULTS
 FISCAL YEAR MARCH 2018 THIRD QUARTER FINANCIAL RESULTS PRESENTATION OUTLINE Highlights Fiscal Year March 2018 Nine Month Results Fiscal Year March 2018 Full Year Forecast Progress of Key Initiatives 1
2015 Interim Results Announcement
 China Petroleum & Chemical Corporation 2015 Interim Results Announcement August 27, 2015 Hong Kong Cautionary Statement This presentation and the presentation materials distributed herein include forward-looking
FISCAL YEAR MARCH 2015 THIRD QUARTER FINANCIAL RESULTS. Updated Mazda CX-5 (Japanese specification model)
") FISCAL YEAR MARCH 2015 THIRD QUARTER FINANCIAL RESULTS Updated Mazda CX-5 (Japanese specification model) Mazda Motor Corporation February 4, 2015 1 PRESENTATION OUTLINE Highlights Fiscal Year March 2015
FISCAL YEAR MARCH 2015 THIRD QUARTER FINANCIAL RESULTS Updated Mazda CX-5 (Japanese specification model) Mazda Motor Corporation February 4, 2015 1 PRESENTATION OUTLINE Highlights Fiscal Year March 2015
INCREASING SALES FOR MINING RELATED BUSINESS
 Investor Relations of PT UNITED TRACTORS Tbk INCREASING SALES FOR MINING RELATED BUSINESS In the first half 2001, the Company managed to record increase in net revenue from IDR 2.32 trillion to IDR 3.54
Q3 and January-September 2014 Results
 Q3 and January-September 2014 Results Bodo Uebber Member of the Board of Management Finance & Controlling and Daimler Financial Services October 23, 2014 1 2 Contents Results for Q3 2014 Outlook for 2014
Nissan Motor Co., Ltd. February 12 th, 2019
 Nissan Motor Co., Ltd. February 12 th, 2019 NET REVENUE 2,875.5 3,045.7 OPERATING PROFIT *1 NET INCOME 301.6 FREE CASH FLOW (AUTO) NET CASH (AUTO) 1,311.4 1,334.4 US TAX REFORM 207.7 82.4 103.3 93.9 *2
Voith Group On a good footing for future growth
 Voith Group On a good footing for future growth Stuttgart, December 7, 2017 Annual press conference Stuttgart December 7, 2017 Public 1 Contents 1. Where we now stand 1.1 Highlights in the 2016/17 fiscal
On track. Investor and Analyst Presentation On the Occasion of the Release of the Preliminary Figures for FY 2011 Hanover, 19 January 2012
 On track. Investor and Analyst Presentation On the Occasion of the Release of the Preliminary Figures for FY 2011 Agenda Delticom at a Glance Business Model Profit & Loss Balance Sheet Outlook 2 Agenda
Conference Call. Preliminary Key Figures Financial Year Bochum, February 7, GEA Group
 Conference Call Preliminary Key Figures Financial Year 2010 Bochum, February 7, 2011 GEA Group Disclaimer All figures for 2010 are preliminary and have therefore not yet been audited. The yearend financial
Embargoed until: March 5, 2019, 7 a.m. CET. Key Financial Data: January 1 to December 31, Evonik more robust as strategy takes effect
 Embargoed until: March 5, 2019, 7 a.m. CET Key Financial Data: January 1 to December 31, Evonik more robust as strategy takes effect Promised and delivered: adjusted EBITDA climbs to 2.6 billion rise 4
On track. Investor and Analyst Presentation On the Occasion of the Release of the Preliminary Figures for 9M 2011 Hanover, 18 October 2011
 On track. Investor and Analyst Presentation On the Occasion of the Release of the Preliminary Figures for 9M 2011 Agenda Delticom at a Glance Business Model Profit & Loss Balance Sheet Outlook 2 Agenda
Press release on the business development of the MAHLE Group in 2013
 Press release on the business development of the MAHLE Group in 2013 Stuttgart, April 17, 2014 2013 business year dominated by the ongoing strategic development of the product portfolio Sales Total sales
Q Matti Lievonen President and CEO
 Q1 2018 Matti Lievonen President and CEO CONTENTS 1. Q1 2018 review 2. Group financials 3. Segment reviews 4. Current topics 5. Appendix 2 Disclaimer The following information contains, or may be deemed
Q Financial Results
 Q3 2018 Financial Results 1 Forward-looking statement The statements on the future in this presentation, including expected sales and earnings, are associated with risks and uncertainties and may be affected
FISCAL YEAR END MARCH 2013 FIRST QUARTER FINANCIAL RESULTS
 FISCAL YEAR END MARCH 213 FIRST QUARTER FINANCIAL RESULTS New MAZDA CX-5 Mazda Motor Corporation July 31, 212 1 PRESENTATION OUTLINE Highlights Fiscal Year End March 213 Results Update of Structural Reform
FY17 RESULTS BUSINESS UPDATES FY18 OUTLOOK. Nissan Motor Co., Ltd. May 14 th, 2018
 Nissan Motor Co., Ltd. May 14 th, 2018 RESULTS BUSINESS UPDATES FY18 OUTLOOK www.nissan-global.com Copyright NISSAN MOTOR CO., LTD. All rights reserved. 2 GLOBAL 91.81 5.08 TIV * 1 vs. 93.52 GLOBAL +1.9%
Annual Press Conference
 Annual Press Conference Stuttgart, 16 December 2016 Prof. Dr. Michael Kaschke President & Chief Executive Officer Thomas Spitzenpfeil Chief Financial Officer ZEISS Group, 2015/16 Annual Press Conference
2018 Q3 results. Millicom International Cellular S.A. Cable expansion accelerating. Mauricio Ramos, CEO Tim Pennington, CFO October 24 th, 2018
 2018 Q3 results Cable expansion accelerating Mauricio Ramos, CEO Tim Pennington, CFO October 24 th, 2018 Millicom International Cellular S.A. Disclaimer This presentation may contain certain forward-looking
Valeo reports 14% growth in consolidated sales for third quarter 2011
 24.11 Valeo reports 14 growth in consolidated sales for third quarter 2011 Third quarter 2011-14 growth in consolidated sales (12 on a like-for-like basis 1 ) to 2,662 million euros - 17 growth in original
ElringKlinger Group. Analysts and Investors Conference on the 2012 Financial Year March 28, 2013
 ElringKlinger Group Analysts and Investors Conference on the 2012 Financial Year March 28, 2013 1 Business year 2012: Key developments ElringKlinger sales again outgrowing the market: plus 9.1% slightly