WEST CAMPUS Transportation Impact Assessment
|
|
|
- Laurel Woods
- 6 years ago
- Views:
Transcription


 273-3440")
1 WEST CAMPUS Transportation Impact Assessment #310, th Avenue NE Calgary, AB T2A 6K4 Phone: (403) Fax: (403) wattconsultinggroup.com
2
3 Civil, Municipal and Traffic Engineering Storm Water Management Legal Survey/Geomatics Transportation Planning TABLE OF CONTENTS EXECUTIVE SUMMARY 1.0 INTRODUCTION Site Location Scope of Work PROPOSED DEVELOPMENT Vision Alignment with the Calgary Transportation Plan Proposed Land Uses Proposed Cross-Sections TDM PROGRAM Approach to Transportation Demand Management Proximity to Major Employment Centres Control Parking Supply and Parking Pricing Other Parking Strategies for Residential Developments Other Parking Strategies for Office Developments Pedestrian and Cycling Facilities Transit Service Other TDM Measures EXISTING CONDITIONS Existing Road Network and Daily Volumes Traffic Associated with the Alberta Children s Hospital FUTURE CONDITIONS Trip Generation Comparison of Trip Generation Estimates Future External Road Network Review of RTM Land Use Assumptions Mode Split Future Modal Split POST-DEVELOPMENT CONDITIONS Post Development Traffic Volumes Post Development Pedestrian Volumes Post Development Bicycle Volumes Post Development Transit Volumes Post-Development Operating Conditions Discussion of Results and Intersection Improvement Options West Campus Transportation Impact Assessment
4 Civil, Municipal and Traffic Engineering Storm Water Management Legal Survey/Geomatics Transportation Planning 6.7 Potential for Roundabouts Intersection Capacity Analysis Summary Impact on Other Intersections Daily Volume Analysis Phasing ACTIVE MODES REVIEW Site Description Existing Pedestrian and Cyclist Facilities Future Pedestrian and Cyclist Facilities TRANSIT SERVICE Existing Transit Service Future Transit Service SUMMARY AND CONCLUSION APPENDIX A: SCOPE OF WORK APPENDIX B: LAND USE PLANS APPENDIX C: TRIP GENERATION METHODOLOGY APPENDIX D: SELECT ZONE PLOTS SPECIAL WEST CAMPUS MODEL RUN APPENDIX E: PROPOSED CROSS SECTIONS APPENDIX F: EXISTING TRAFFIC COUNTS APPENDIX G: FUTURE INTERSECTION VOLUMES AND ADJUSTMENTS APPENDIX H: POST DEVELOPMENT INTERSECTION OPERATIONS APPENDIX I: SYNCHRO ANALYSIS RESULTS APPENDIX J: SIDRA ANALYSIS RESULTS APPENDIX K: MODEL OUTPUT REGIONAL TRANSPORTATION MODEL FORECAST TRIP GENERATION West Campus Transportation Impact Assessment
5 Civil, Municipal and Traffic Engineering Storm Water Management Legal Survey/Geomatics Transportation Planning LIST OF FIGURES FIGURE 1: SITE LOCATION... 2 FIGURE 2: STUDY AREA AND INTERSECTIONS... 3 FIGURE 3: CONCEPT RENDERING OF THE WEST CAMPUS DEVELOPMENT... 4 FIGURE 4: SUSTAINABILITY TRIANGLE... 5 FIGURE 5: INTERNAL TRIP POTENTIAL FROM MAJOR EMPLOYMENT CENTRES... 9 FIGURE 6: POST-DEVELOPMENT TRAFFIC VOLUMES FIGURE 7: POST-DEVELOPMENT PEDESTRIAN AND BICYCLE VOLUMES FIGURE 8: WEST CAMPUS STREET NETWORK LANING AND SIGNAGE 2039 BASE SCENARIO FIGURE 9: WEST CAMPUS STREET NETWORK LANING AND SIGNAGE 2039 IMPROVED SCENARIO FIGURE 10: INFRASTRUCTURE IMPROVEMENTS FIGURE 11: LEVEL OF SERVICE SUMMARY IN STUDY AREA FIGURE 12: 2039 DAILY VOLUME ESTIMATES FIGURE 13: WEST CAMPUS PHASING PLAN FIGURE 14: TRAVEL DESTINATIONS AND PEDESTRIAN AND CYCLIST FACILITIES FIGURE 15: INTERNAL PEDESTRIAN AND CYCLIST FACILITIES FIGURE 16: EXISTING TRANSIT SERVICE FIGURE 17: FUTURE TRANSIT NETWORK LIST OF TABLES TABLE 1: PROPOSED LAND USE INTENSITIES (AUGUST 2013)... 7 TABLE 2: REGIONAL TRANSPORTATION MODEL WEST CAMPUS TRIP GENERATION TABLE 3: WEST CAMPUS TRIP GENERATION ESTIMATES TABLE 4: WEST CAMPUS TRIP GENERATION COMPARISON TABLE 5: RTM EMPLOYMENT AND POPULATIONS FORECASTS TABLE 6: RTM EMPLOYMENT AND POPULATIONS FORECASTS SPECIAL WEST CAMPUS MODEL RUN TABLE 7: EXISTING MODAL SPLIT TABLE 8: RTM MODAL SPLIT ESTIMATES FOR WEST CAMPUS TABLE 9: CURRENT PEAK HOUR PEDESTRIAN VOLUMES IN CALGARY TABLE 10: LEVEL OF SERVICE CRITERIA TABLE 11: LEVEL OF SERVICE CRITERIA FOR ROUNDABOUTS TABLE 12: WEST CAMPUS IMPACT ON NEARBY INTERSECTIONS TABLE 13: ROADWAY CLASSIFICATION SUMMARY TABLE 14: RECOMMENDED IMPROVEMENT PHASING TABLE 15: EXISTING TRANSIT SCHEDULE AND CONNECTIONS TABLE 16: FORECAST FUTURE TRANSIT SERVICES West Campus Transportation Impact Assessment
6 Civil, Municipal and Traffic Engineering Storm Water Management Legal Survey/Geomatics Transportation Planning EXECUTIVE SUMMARY West Campus Development Trust is planning to develop the 207 acre parcel of land located immediately west of the University of Calgary Campus. The vision for the West Campus lands is to be a complete, vibrant and sustainable community that enhances the University experience, while harmonizing with surrounding communities. The Plan vision and proposed land use designations reflect a built form framework that supports a diverse, mixed-use pedestrian oriented community, providing an opportunity for all demographics to live, work and play in a compact, walkable and accessible environment. A rendering of the proposed development concept is provided in Figure ES-1. FIGURE ES-1: WEST CAMPUS CONCEPT PLAN West Campus Transportation Impact Assessment ES-1

7 Civil, Municipal and Traffic Engineering Storm Water Management Legal Survey/Geomatics Transportation Planning The transportation network was generally laid out in a grid format to maximize pedestrian connectivity. The street cross-sections for West Campus were developed with the goal of enhancing the pedestrian environment, accommodating cyclists and meeting the needs of transit, emergency vehicles and other auto/truck traffic. Wherever possible, the specific elements of the cross-sections align with the City s Complete Streets Guidelines and provide ample space for all modes of transportation within the road right-of-way. Alignment with the Calgary Transportation Plan The West Campus Plan aligns very closely with a number of City policies including the Calgary Transportation Plan (CTP). The overarching goal of the CTP is: To develop an integrated, multi-modal transportation system that supports land use, provides increased mobility choices for citizens, promotes vibrant, connected communities, protects the natural environment, and supports a prosperous and competitive economy. A number of policies were established as part of the CTP that support more sustainable modes of transportation such as walking, cycling and transit. Once of the concepts highlighted in the CTP is the transportation sustainability triangle which ranks each mode of transportation based on their overall sustainability. The West Campus Plan was designed with the transportation sustainability triangle in mind. The design of the streets, sidewalks and pathway system as well as the layout of the road network reflect a strong desire by the planning team to create a walkable, Figure ES2 Sustainability Triangle pedestrian-friendly environment that promotes more sustainable modes of transportation. Given the proximity to major employment centres as well as the University, the West Campus Project Team believes that the development can achieve mode splits that surpass the goals established in the CTP. West Campus Transportation Impact Assessment ES-2


8 Civil, Municipal and Traffic Engineering Storm Water Management Legal Survey/Geomatics Transportation Planning Transportation Demand Management (TDM) A transportation demand management (TDM) program is a series of measures and strategies to promote the use of alternative modes of transportation and reduce the reliance on private passenger vehicles. By nature of its proximity to major activity centres, West Campus is well situated to reduce the reliance on the automobile and promote more walking and cycling trips. Increased transit service to the area as planned by the City of Calgary will also help to achieve the goals of TDM. The West Campus Development Trust supports the provision of TDM strategies to promote sustainable modes of transportation including: Controlled or restricted parking supply Car-sharing programs for individual residential buildings in combination with a reduced parking supply Designated carpool parking stalls Parking Cash-Out for office developments Unbundling Parking for residential and office developments Support for city-wide car-sharing program such as Car2Go Universal transit pass program for major employers Active Modes Assessment The site is ideally situated in close proximity to several major travel destinations including the U of C, Foothills Medical Centre and Alberta Children s Hospital. By nature of its location, many of the trips are expected to use active modes including walking and cycling. The proposed road network within West Campus will provide pedestrians with a variety of route options to nearby travel destinations. The sidewalks and pathways in the area also provide good connectivity to local amenities and transit stops. The proposed cycling and walking infrastructure within the West Campus development area is shown in Figure ES-3. As shown, sidewalks and pathways are proposed along major roadways within the development to enhance pedestrian mobility and provide a multitude of different route options. The sidewalks will be constructed as per the City of Calgary s Complete Streets Guidelines and will range in width from 1.5m to 3.0m based on anticipated levels of pedestrian traffic and to maximize safety and comfort. In addition to the multi-use pathways, on-street bike lanes and separate bike paths will further enhance connectivity and provide route options for cyclists travelling around West Campus and to external access points such as 37 Street NW to the north, 24 Avenue NW to the east, and West Campus Boulevard and 16 Avenue NW to the south and west, West Campus Transportation Impact Assessment ES-3

9 Civil, Municipal and Traffic Engineering Storm Water Management Legal Survey/Geomatics Transportation Planning respectively. A regional pathway will loop around much of the perimeter of West Campus to facilitate commuter and recreational cycling around the development. The sidewalk and pathway network will also provide direct connections to the nearby transit facilities and bus stops located within and in close proximity to the site. FIGURE ES-3: PROPOSED PEDESTRIAN AND CYCLING FACILITIES West Campus Transportation Impact Assessment ES-4

10 Civil, Municipal and Traffic Engineering Storm Water Management Legal Survey/Geomatics Transportation Planning The proposed active modes network within and in the vicinity of West Campus has been designed to accommodate and encourage a high level of pedestrian and cyclist activity. Transit Service West Campus is currently served by four transit routes with stops located primarily on West Campus Drive. The City of Calgary is currently assessing transit services in an area that includes West Campus, the University of Calgary, Brentwood, Market Mall and the Foothills Medical Centre. The NW-HUB Transit Enhancement Study is anticipated to be completed in The study will assess the need and feasibility of potential mobility improvement options, including new bus routes, bus rapid transit (BRT) services, cycling and pedestrian routes, and alternative improvement possibilities such as trams and urban gondolas. It is expected that upon completion of the study, the City of Calgary will begin introducing enhanced transit service and improved transit infrastructure in the West Campus area. The vision for the West Campus development includes the provision of high quality transit stations and convenient pedestrian connectivity to and from all of the transit stops. Based on the current development plans, all of the residents and employment areas are expected to be within 400m of a transit stop. Existing Traffic Conditions The existing road network in the West Campus area is partially developed and was mostly built in 2005 and 2006 as part of the Alberta Children s Hospital project. The ACH project also included the construction of three new accesses into the West Campus area including the new interchange at 16 Avenue NW at West Campus Boulevard, a new right-turn only ramp off of northbound Shaganappi Trail into the ACH site and a new signalized access off 32 Avenue NW at 39 Street NW (West Campus Gate NW). Daily traffic volumes on the streets in and around West Campus are within the acceptable ranges identified in the City s Environmental Design Guidelines and have spare capacity to accommodate the West Campus development. Alberta Children s Hospital is a large employment centre within West Campus and generates an estimated 700 vehicular trips during each of the AM and PM peak periods. Based on discussions with Alberta Health Services, ACH typically receives one inbound ambulance trip to the hospital per day. West Campus Transportation Impact Assessment ES-5
11 Civil, Municipal and Traffic Engineering Storm Water Management Legal Survey/Geomatics Transportation Planning Future Traffic Conditions Traffic volumes for all of the study intersections were projected for the year 2039 based on information provided by the City s Regional Transportation Model. The 2039 traffic projections included the current land use plan for West Campus as well as the following network improvements: Enhanced Transit Service to West Campus including higher frequency on the current routes as well as new routes such as the South Shaganappi BRT 16 Avenue NW widened to 6 lanes through 29 Street NW intersection NW LRT Extended to Tuscany Rocky Ridge Interchange at 16 Avenue NW / Bowfort Road The Stadium Shopping Centre redevelopment was not included in the City s model and therefore manual adjustments were made to the traffic projections to account for the fullbuild out of the Stadium Shopping Centre at the approved land use density. Capacity analysis was carried out for the study intersections with the projected 2039 volumes. The key issues/results are summarized below: The proposed new signalized access at Shaganappi Trail and West Campus Way is a key intersection for the development and will also improve emergency access to the Alberta Children s Hospital. The intersection of 32 Avenue NW and Shaganappi Trail is expected to be congested during the peak periods with the current geometric configuration. The analysis suggests that Shaganappi Trail will need to be widened to three travel lanes in each direction by 2039 to accommodate the anticipated traffic volumes. The widening of Shaganappi Trail as well as the addition of an eastbound right-turn lane are expected to address the identified operational issues at this intersection. Traffic signals are recommended along West Campus Way at West Campus Drive and 39 Street NW (West Campus Gate NW) to accommodate full development of West Campus. An eastbound right-turn lane could be considered at the intersection of 32 Avenue NW and 39 Street NW (West Campus Gate NW) to alleviate anticipated congestion on this leg. The benefits to traffic flow would have to be weighed against the potential impacts to the pedestrian and cyclist environment on the south side of 32 Avenue NW. West Campus Transportation Impact Assessment ES-6

12 Civil, Municipal and Traffic Engineering Storm Water Management Legal Survey/Geomatics Transportation Planning The intersection of 24 Avenue NW/Children s Way and West Campus Blvd can be stop controlled for the northbound movement. The north and south interchange terminals at 16 Avenue NW / West Campus Blvd. will need to be upgraded in the future to accommodate the anticipated 2039 traffic volumes. Although either signals or roundabouts will address the identified operational issues, through further investigation, a roundabout is recommended at the north terminal and a signal is recommended at the south terminal. A summary of the improvements requirements and the anticipated traffic controls is provided in Figure ES-4. FIGURE ES-4: PROPOSED INFRASTRUCTURE West Campus Transportation Impact Assessment ES-7
13 Civil, Municipal and Traffic Engineering Storm Water Management Legal Survey/Geomatics Transportation Planning Summary and Conclusion The Vision for West Campus includes many of the sustainability principles outlined in the Calgary Transportation Plan. The population and employment density is expected to exceed the minimum requirements for a Major Activity Centre and will generate enough critical mass to support frequent transit service. The mixed-use nature of the development, together with the proximity to major employment centres will generate a large number of internal trips and will also encourage other forms of sustainable transportation including walking and cycling. The sustainability principles that have been incorporated into the plan will reduce the proportion of trips made by automobile and will reduce the impact on the adjacent transportation network. With the recommended improvements outlined in this report, the transportation network will be able to support full development of West Campus. West Campus Transportation Impact Assessment ES-8
14 Civil, Municipal and Traffic Engineering Storm Water Management Legal Survey/Geomatics Transportation Planning 1.0 INTRODUCTION West Campus Development Trust (WCDT) is planning to develop the 207-acre (83.8 hectare) parcel of land that lies immediately west of the University of Calgary s Main Campus in Northwest Calgary. The vision for the land is a vibrant, mixed-use community, with a highquality public realm, a diversity of housing choices; a place where residents can walk to work while enjoying the richness of a green environment as they travel along pedestrian-friendly, tree-lined streets. The vision for the development includes a strong Transportation Demand Management (TDM) program that will reduce the number of auto trips generated by the site. To support the Outline Plan and Land Use Application to the City of Calgary, WCDT retained Watt Consulting Group (Watt) to prepare a Transportation Impact Assessment (TIA). 1.1 Site Location West Campus is located immediately west of the University of Calgary Main Campus in the northwest quadrant of the City of Calgary. The site offers many benefits for development and is a prime location for a new inner city neighbourhood with proximity to major employers such as the University, Foothills Medical Centre and the Alberta Children s Hospital. The site is currently served by several bus routes and it is located within walking distance of the NWLRT line. The quality and frequency of transit service to the area is expected to increase in the future after the City completes the NW-HUB Transit Enhancement Study and begins to implement some of the recommendations. West Campus is bound by 32 Avenue NW to the north, Shaganappi Trail to the west, and 16 Avenue NW to the south, making up approximately 207 acres (83.8 hectares) of developable land. The site location is provided in Figure 1. According to the Municipal Development Plan (MDP), West Campus is classified as a Major Activity Centre (MAC). Other MACs in the vicinity include the University of Calgary, McMahon Stadium and the Foothills Medical Centre (FMC). According to the MDP, a MAC is defined as: Major Activity Centres (MACs) provide for the highest concentration of jobs and population outside of the Centre City area. In addition to achieving higher concentrations of jobs and population, the design and character of the MACs must also create a high-quality environment that features amenities for a comfortable street environment. West Campus Transportation Impact Assessment 1

15 Civil, Municipal and Traffic Engineering Storm Water Management Legal Survey/Geomatics Transportation Planning From a transportation perspective, the importance of the MAC designation is that the emphasis is on more sustainable modes of transportation, primarily walking, cycling and transit. FIGURE 1: SITE LOCATION 1.2 Scope of Work A scope of work for this study was determined in consultation with the City of Calgary s Transportation Development Services Division. A summary of the major tasks is provided below with the more detailed scope included in Appendix A. Review current and future (2039) conditions for pedestrians, cyclists, transit users and West Campus Transportation Impact Assessment 2

16 Civil, Municipal and Traffic Engineering Storm Water Management Legal Survey/Geomatics Transportation Planning vehicular traffic for the peak a.m. and p.m. weekday periods for the key internal and external intersections, a graphic of the study intersections (in red) for detailed capacity analysis is shown in Figure 2; Provide a discussion on TDM measures that could be applied to the site; Review the anticipated modal split information from the model and provide commentary on the results versus expected results based on other developments; Use the City s Regional Transportation Model to estimate the traffic generation and distribution of the site traffic based on anticipated land uses and densities; Identify geometric road improvements that are required to support the development. FIGURE 2: STUDY AREA AND INTERSECTIONS West Campus Transportation Impact Assessment 3
17 Civil, Municipal and Traffic Engineering Storm Water Management Legal Survey/Geomatics Transportation Planning 2.0 PROPOSED DEVELOPMENT 2.1 Vision The vision for the West Campus lands is to be a complete, vibrant and sustainable community that enhances the University experience, while harmonizing with surrounding communities. The Plan vision and proposed land use designations reflect a built form framework that supports a diverse, mixed-use pedestrian oriented community, providing an opportunity for all demographics to live, work and play in a compact, walkable and accessible environment. A concept rendering of the West Campus development is provided in Figure 3. FIGURE 3: CONCEPT RENDERING OF THE WEST CAMPUS DEVELOPMENT West Campus Transportation Impact Assessment 4
18 Civil, Municipal and Traffic Engineering Storm Water Management Legal Survey/Geomatics Transportation Planning 2.2 Alignment with the Calgary Transportation Plan City Council approved and adopted the Calgary Transportation Plan (CTP) in September The overarching goal of the CTP is: To develop an integrated, multi-modal transportation system that supports land use, provides increased mobility choices for citizens, promotes vibrant, connected communities, protects the natural environment, and supports a prosperous and competitive economy. (CTP, pg 1-6, 2009) 1 Sustainability is a common theme that is reflected in the CTP. A number of policies were established as part of the CTP that support more sustainable modes of transportation such as walking, cycling and transit. These modes of transportation are considered more sustainable because they are less impactful on the environment, are accessible to most Calgarians and the infrastructure needed to support these modes of transportation are typically less costly to build. The concept of comparing the sustainability aspect of all modes of transportation is summarized in the transportation sustainability triangle shown in Figure 4. The CTP also builds on a number of Key Directions for Land Use and Mobility that were adopted by Council in November The West Campus Plan aligns closely with many of these Key Directions as described below: FIGURE 4: SUSTAINABILITY TRIANGLE 1) Achieve a balance of growth between established and greenfield communities o West Campus is one of the largest development areas available in an established area and this development will help to balance the City s growth pattern between established areas and greenfield communities. 1 Calgary Transportation Plan, City of Calgary, September 2009 Available at: West Campus Transportation Impact Assessment 5
19 Civil, Municipal and Traffic Engineering Storm Water Management Legal Survey/Geomatics Transportation Planning 2) Provide more choice within complete communities o The mixed-use aspect of the development will provide opportunities for people to live, work and play within an area that is walkable. The range of housing choices will accommodate citizens of all demographics. 3) Direct land use change within a framework of nodes and corridors o West Campus is considered a major activity centre in the MDP. The density proposed within the West Campus plan is consistent with this key direction. 4) Increase mobility choices o The West Campus plan provides an extensive network of walking and cycling paths that will encourage more of its residents and employees to use these modes of transportation. 5) Create Complete Streets o Although many of the streets within West Campus are already constructed, complete street guidelines were used wherever possible to ensure that the street design is consistent with this key direction. 6) Optimize infrastructure o The West Campus plan supports this key direction by utilizing available capacity that exists along some of the primary transportation corridors in the area. As shown above, the plan for West Campus aligns closely with many of the key directions that have been adopted by City Council to create a more sustainable City. 2.3 Proposed Land Uses The proposed development of West Campus will incorporate a diverse range of land uses, which include several retail and commercial centres, office space, a variety of residential housing developments, community facilities as well as parks and green space. The developments will be constructed in a combination of stand-alone and mixed-use facilities, such as shared office and commercial buildings, as well as mixed retail-residential towers. The proposed intensities of each land use are summarized in Table 1. West Campus Transportation Impact Assessment 6
20 Civil, Municipal and Traffic Engineering Storm Water Management Legal Survey/Geomatics Transportation Planning TABLE 1: PROPOSED LAND USE INTENSITIES (AUGUST 2013) LAND USE INTENSITY Multi-Family Residential 6,358 units Office 1,562,000 ft 2 Retail & Community Facilities 221,700 ft 2 The above land use development scenario is consistent with the current application in circulation at the City of Calgary. A previous version of the land use plan was submitted to the City s Geo-demographics Department in April 2013 to use as the basis for updating the City s Regional Transportation Model (RTM) and estimating future traffic volumes and mode split. Between April and the time of submission, the boundary of the West Campus development was changed and the area of development was reduced. Since the changes reflect a decrease in the density of development, it was decided to proceed with the results of the previous land use data with the understanding that the data being analyzed would be conservative (overstating the potential impacts). The April 2013 and the current land use plan are provided in Appendix B. 2.4 Proposed Cross-Sections The West Campus Project Team has developed cross-sections for all of the internal streets that support the City s Key Directions for Mobility and Land Use. In general, the proposed cross-sections follow the City s Complete Streets Guidelines by accommodating all modes of transportation. Since many of the roads in West Campus are already built, the proposed cross-sections attempted to maximize the use of the existing infrastructure. A detailed discussion of the proposed internal roads is included in the Outline Plan and Land Use Submission report (pages 91-97). A copy of the latest version of the proposed crosssections (January 20, 2014) is included in Appendix E. West Campus Transportation Impact Assessment 7
21 Civil, Municipal and Traffic Engineering Storm Water Management Legal Survey/Geomatics Transportation Planning 3.0 TDM PROGRAM 3.1 Approach to Transportation Demand Management Transportation Demand Management (TDM) was a key consideration throughout the planning process for the West Campus Development. The design of the streets, sidewalks and pathway system as well as the layout of the road network reflects a strong desire by the planning team to create a walkable, pedestrian-friendly environment. The purpose of this section is to provide information related to the TDM program that was prepared for this development. A transportation demand management (TDM) program is a series of measures and strategies to promote the use of more sustainable modes of transportation and reduce the reliance on private passenger vehicles (see transportation sustainability triangle). TDM supports efforts to create a more balanced transportation system. It does so by: accommodating all modes (private vehicle, transit, cycling, walking etc.) offering transportation choices; and encouraging non-automobile modes It is worth noting that the primary goal of a TDM program is to reduce automobile (especially SOV) use, but not to eliminate the car completely. A TDM program should recognize that most people need to drive occasionally. If that occasional requirement isn t addressed by the TDM program, then drivers won t switch to non-automobile modes. The measures and strategies that are applied to achieve TDM goals vary depending on the specific context and land uses. In 2012, the University of Calgary developed a TDM plan for implementation on the main campus. Some elements of this plan are applicable to the West Campus context, while others are not appropriate to the proposed land uses for the West Campus development. West Campus Transportation Impact Assessment 8


22 Civil, Municipal and Traffic Engineering Storm Water Management Legal Survey/Geomatics Transportation Planning The following sections identify various TDM programs or strategies that are applicable to the West Campus development and highlight shared components or differences from the U of C TDM plan. 3.2 Proximity to Major Employment Centres Although not a TDM program per se, the proximity of West Campus to major employment centres such as the Alberta Children s Hospital, the U of C main campus and the Foothills Medical Centre will significantly increase the potential number of walking and cycling trips to/from the development. In particular, the proximity to these large employment centres is expected to have a significant impact on the residential land uses as more people living in West Campus will be able to walk or cycle to work as illustrated in Figure 5. Information gathered from UBC s South Campus (a complete community located within walking distance of UBC campus) suggests that more than 50 percent of the 6,300 nonmarket and market households have at least one person that works or studies on campus. Based on this potential, it will be important to ensure the walking and cycling connections to the adjacent employment centres are direct and of high quality. FIGURE 5: INTERNAL TRIP POTENTIAL FROM MAJOR EMPLOYMENT CENTRES West Campus Transportation Impact Assessment 9
23 Civil, Municipal and Traffic Engineering Storm Water Management Legal Survey/Geomatics Transportation Planning 3.3 Control Parking Supply and Parking Pricing One of the most effective means of encouraging alternate transportation modes is to control the available parking in an area, and set appropriate pricing levels for the available parking. In the West Campus context the approach will vary according to land use: Office uses are the best candidates for restricted parking supply due to available transit service and active mode facilities. The University of Calgary will be constraining its parking supply relative to anticipated population growth, setting prices to exceed the cost of transit service (two-way) and with a premium on monthly parking (which tends to encourage all-in car driving rather than driving only when necessary). For the West Campus area, restricted parking supply for office users (combined with other TDM elements as outlined below), will support the use of active modes while still allowing the flexibility for employees to park on site when required. The potential for restricted office parking would however need to be considered in context of current market demand. Street-level retail will need to be supported by on-street parking and/or short-stay parking within nearby parking structures. Such parking should be time limited and priced to discourage longer stays (free or low-cost for first 30 minutes or 1 hour period, but significantly higher pricing beyond that). Residential uses typically need to provide at or near bylaw amounts of parking to be marketable. Other TDM programs that provide cost- and time- comparable alternatives will tend to result in cars being left at home for peak hour commuter trips. 3.4 Other Parking Strategies for Residential Developments Given the proximity of the site to major employment centres, it is likely that some of the residents in the area would not own a car. Therefore, one strategy to reduce auto travel in the area could be to build some of the residential developments with significantly less parking stalls than required by the City s land use bylaw. This would have the impact of reducing the cost of the residential development, passing on the savings to the purchasers that choose not to buy a parking stall. In order for this strategy to work, the parking stalls would need to be unbundled from the condo title. Another strategy for residential developments that could be considered is for the developer to provide a car-sharing program for use exclusively by residents. This would allow the developer to potentially replace a number of dedicated parking stalls on-site with parking West Campus Transportation Impact Assessment 10
24 Civil, Municipal and Traffic Engineering Storm Water Management Legal Survey/Geomatics Transportation Planning stalls that would be used by the car-sharing program. This type of program has been successful in other North American cities and is currently being considered by some residential developers in Calgary. 3.5 Other Parking Strategies for Office Developments There are a number of TDM strategies that could be applied to the office developments within West Campus to reduce the overall reliance on passenger cars. A summary of these strategies is provided below: Parking Cash-Out: A parking cash-out program for office developments is one in which employees are offered the opportunity to choose either a parking space or the cash equivalent of the space, based on the out-of-pocket costs to the employer. The employee can determine whether to use the cash for alternative modes of transportation or keep the funds. Offering the option of cashing out their subsidized parking space can incentivize employees to ride transit, bike, walk, or carpool to work, thereby reducing vehicle commute trips and emissions. Unbundling Parking: This strategy involves the separation of the cost of parking from office space leases to help tenants understand the true cost of parking. By consciously needing to pay for a block of parking stalls every month, tenants are more likely to reconsider how many parking spaces are required to operate their business. This strategy can be effective in reducing the overall parking demand for office buildings. This could be considered in tandem with the parking cash-out strategy. 3.6 Pedestrian and Cycling Facilities Section 7 of this report details recommendations with respect to pedestrian and cycling facilities in the West Campus area. As detailed, these facilities are intended to connect to other regional attractors in the area as well as the main U of C campus. For office and commercial uses, the provision of both short stay and secured bicycle parking is necessary to support TDM. Short stay parking is typically provided by bike racks which are located very close to the main entrance of retail and office developments to encourage shoppers, couriers, and other site visitors. Secured bicycle parking supports commuter cycling. Where structured parking is being considered for a specific office development, or to support multiple adjacent office and retail locations, bike cages (as opposed to individual bicycle lockers) are a cost effective way to add significant secured bike parking capacity. West Campus Transportation Impact Assessment 11
25 Civil, Municipal and Traffic Engineering Storm Water Management Legal Survey/Geomatics Transportation Planning The University of Calgary provides both types of bicycle parking and will continue to grow the capacity of each as the population expands. The University of Calgary makes use of existing recreation facilities to provide on-site shower facilities for commuter cyclists. For West Campus, the fragmented nature of the site (multiple buildings with their own populations) will require a different approach with each building or cluster of buildings providing a shower/locker room facility. Residential development in West Campus will be ideally located for cyclist commuting to the University of Calgary (for faculty or students) and other major employment centres in the City, so efforts to ensure a continuous and high quality bicycle network through the area are likely to be very beneficial from a TDM perspective. 3.7 Transit Service Section 8 of this report details recommendations with respect to transit service and facilities in the West Campus area. As detailed, these facilities will connect to major pedestrian routes on the main U of C campus, as well as providing connections to other regional attractors. The University of Calgary, West Campus, and the Foothills Medical Centre are currently working in partnership with Calgary Transit to review transit service to and through the area. Part of that review will be to assess the feasibility of a U of C circulator route which will likely extend into the West Campus area (potentially connecting West Campus to the transit hub and the University LRT station). The future size and location of the west transit hub (currently located next to the Children s Hospital) will also be assessed. The ultimate goal will be to ensure the area is well served by regular, reliable transit service, connecting to a broad area. To further incentivize transit use over private vehicle travel, the University of Calgary currently provides a universal transit pass for the student population. Transit passes or discounts on passes can be readily applied to office developments such as those proposed within the West Campus area, usually in conjunction with restricted or priced parking, but are not as easily applicable to residential development due to fragmented ownership. West Campus Transportation Impact Assessment 12
26 Civil, Municipal and Traffic Engineering Storm Water Management Legal Survey/Geomatics Transportation Planning 3.8 Other TDM Measures Other TDM measures that may be applicable to the West Campus development include the provision of preferentially located carpool parking stalls within structured parking areas. The University of Calgary provides discounted parking prices for car-pool drivers as well, though this program is not currently extensive enough to have a significant impact on travel mode. Carshare programs such as Car2Go can be encouraged in West Campus by working with the providers to ensure the area is within a coverage zone, and subsidizing registrations or giving out free trips to promote the program. The University of Calgary is currently considering implementing a Guaranteed Ride Home program which provides taxi vouchers for staff that use transit or car-pools if they need to go home for an emergency or stay late past their usual travel time. This may be feasible for larger employers within the West Campus development area, but may be difficult to implement at the current level of planning detail. Finally, all TDM programs need a designated representative with the mandate to monitor and support the programs over time. At the University of Calgary, a TDM coordinator position will be developed to monitor the program. For the West Campus development, individual developments may be required to identify a TDM coordinator (frequently managed by the condo board in residential developments or the building manager in office/retail developments) on a site-by-site basis. It may be worth exploring the idea of creating a collaborative arrangement between multiple developments to unify TDM efforts across the West Campus project over the lifetime of the development. West Campus Transportation Impact Assessment 13
27 Civil, Municipal and Traffic Engineering Storm Water Management Legal Survey/Geomatics Transportation Planning 4.0 EXISTING CONDITIONS 4.1 Existing Road Network and Daily Volumes The existing road network in the West Campus area is partially developed and was mostly built in the early 2000 s as part of the Alberta Children s Hospital project. The ACH project also included the construction of three new accesses into the West Campus area including the new interchange at 16 Avenue NW at West Campus Boulevard, a new right-turn only ramp off of northbound Shaganappi Trail into the ACH site and a new signalized access off 32 Avenue NW at 39 Street NW (West Campus Gate NW). A brief description of each of the primary streets that form the transportation network that will serve West Campus is provided below. The most recent traffic volumes provided by the City of Calgary are provided in Appendix F. Shaganappi Trail Shaganappi Trail currently provides two travel lanes in each direction in the vicinity of the site with a posted speed limit of 70 km/hr. Current average annual daily traffic (AADT) volumes along Shaganappi Trail are approximately 25,000 vehicles per day just south of 32 Avenue NW. It is noted that Shaganappi Trail was recently downgraded from a skeletal road to an arterial road. This reclassification of the roadway allows for more access points and better accommodates transit and active transportation modes. The City is currently undertaking a functional study of the Shaganappi Trail corridor and this study is anticipated to be completed by Spring The long term vision for Shaganappi Trail includes three travel lanes in each direction as well as separate cycle lanes and sidewalks. One of the travel lanes in each direction is planned to accommodate High Occupancy Vehicles (HOV). 32 Avenue NW 32 Avenue NW is classified as an urban boulevard within the City s Calgary Transportation Plan (CTP). The current configuration includes two travel lanes in each direction, a median and separate left-turn lanes at the major junctions. A regional pathway exists on the south side of the roadway for most of the length between Shaganappi Trail and Crowchild Trail. The posted speed limit is 60 km/hr. Existing AADT volumes along 32 Avenue NW are approximately 17,000 vehicles per day just east of Shaganappi Trail. No major changes to this roadway are planned in the next 30 years. West Campus Transportation Impact Assessment 14
28 Civil, Municipal and Traffic Engineering Storm Water Management Legal Survey/Geomatics Transportation Planning 24 Avenue NW 24 Avenue NW is classified as an arterial street within the CTP (east of West Campus Drive). The current configuration includes two travel lanes in each direction, a wide median, separate left-turn lanes at the major junctions, and sidewalks on both sides of the street. The posted speed limit is 50 km/hr and the existing AADT volumes along 24 Avenue NW are approximately 11,000 vehicles per day between University Drive and West Campus Drive. No major changes to this roadway are planned in the next 30 years. West Campus Boulevard As previously mentioned, this roadway was built as part of the Alberta Children s Hospital project in It connects the West Campus area to 16 Avenue NW and the Foothills Hospital via an interchange. It is currently marked as one wide travel lane in each direction with a posted speed limit of 40 km/hr. There is a regional pathway on the west side of the roadway but it only starts approximately midway between the ACH and 16 Avenue NW and then continues south across the 16 Avenue NW interchange. Current daily volumes along West Campus Boulevard are in the range of 5,700 vehicles per day. West Campus Drive West Campus Drive connects 24 Avenue NW to West Campus Way and provides the primary access into ACH. It currently provides one wide travel lane in each direction, a median and a wide pathway on the west side. The posted speed limit is 40 km/hr. Current daily volumes along West Campus Drive were not available from the City but are estimated at approximately 6,500 vehicles per day based on an intersection counts conducted at 24 Avenue NW, Oki Drive and West Campus Drive. In the future, this roadway is envisioned as a four-lane divided roadway. 4.2 Traffic Associated with the Alberta Children s Hospital A meeting was held with Alberta Health Services EMS staff on August 16, 2013 to document the current emergency vehicle operations associated with the site as well as to gain an understanding of the typical volume of staff and visitors that are travelling to/from the site during the street peak hours. The purpose of this section is to document the results of this review. West Campus Transportation Impact Assessment 15
29 Civil, Municipal and Traffic Engineering Storm Water Management Legal Survey/Geomatics Transportation Planning EMS staff were interviewed to understand the current travel patterns of ambulances that are accessing ACH. Based on this discussion, the following points were made: EMS generally responds to approximately calls per year where a patient will need to be transported to ACH in an emergency situation. A number of transfers are made as well but these are typically not done under emergency situations. EMS drivers currently use all routes to access ACH including Shaganappi Trail, 32 Avenue NW, 24 Avenue NW and West Campus Blvd. EMS drivers generally do not cut through the U of C campus to access the hospital due to the circuitous nature of the internal road network. There is no current policy or guidelines telling drivers which routes to use to access the hospital. It is up to the individual EMS drivers to select the route that they believe is quickest. Since there are generally no ambulances stationed at the ACH, there are no outbound emergency vehicle trips from ACH. Typically the ambulances will be dispatched from EMS stations nearest the incident and therefore the inbound trips come from all quadrants of the City depending on where the emergency is. Drivers will typically try and avoid routes with lots of curves or a rough pavement surface to avoid causing patient discomfort. Therefore, based on the information gathered from Alberta Health Services, the ACH generates on average approximately one inbound emergency vehicle trip per day. The drivers make use of all routes to the ACH and the addition of the new access on Shaganappi Trail is expected to improve the overall accessibility of the hospital. West Campus Transportation Impact Assessment 16
30 Civil, Municipal and Traffic Engineering Storm Water Management Legal Survey/Geomatics Transportation Planning 5.0 FUTURE CONDITIONS 5.1 Trip Generation Regional Transportation Model (RTM) Forecast Trip Generation The City s RTM was used to estimate the trip generation of the West Campus Development and the intersection turning movement volumes at the study intersections. Details of the adjustments that were made to the model output to reflect the most current land use plans in the area are provided in Appendix K. The estimated trip generation for the West Campus development based on the City s RTM is summarized in Table 2. TABLE 2: REGIONAL TRANSPORTATION MODEL WEST CAMPUS TRIP GENERATION ZONE TRIPS GENERATED AM IB AM OB PM IB PM OB TOTAL TZ West Campus Trips 1, ,485 TZ ,541 1,022 1,373 1,732 5,668 TZ , ,903 Total 2,867 2,187 2,864 3,138 5,054 6,002 Total West Campus Trips 11,056 Traditional Trip Generation Methods As a method of checking the total trip generation from the RTM, the total trip generation for the West Campus development was also calculated based on traditional trip generation methods using City-approved trip generation rates and multiplying them by the associated land use intensity. A summary of the calculations is provided below with details provided in Appendix C. In assessing the trip generating potential of the proposed mixed-use development, the following trip rates were used for the various land uses: The residential component of the site was assessed using the City of Calgary approved trip generation rate for TOD Multi-family Residential land uses o a.m. peak hour: 0.35 / unit (25% inbound / 75% outbound) o p.m. peak hour: 0.45 / unit (65% inbound / 35% outbound) West Campus Transportation Impact Assessment 17
31 Civil, Municipal and Traffic Engineering Storm Water Management Legal Survey/Geomatics Transportation Planning The office component of the site was assessed using the City of Calgary approved trip generation rate for TOD Offices o a.m. peak hour: 1.39 / 1000 ft 2 (88% inbound / 1 outbound) o p.m. peak hour: 1.57 / 1000 ft 2 (17% inbound / 8 outbound) The retail and community facilities components of the site were assessed using the City of Calgary approved Retail trip generation rate o a.m. peak hour: 2.00 / 1000 ft 2 (60% inbound / 40% outbound) o p.m. peak hour: 6.00 / 1000 ft 2 (50% inbound / 50% outbound) The hospital component of the site was assessed using the ITE Hospital (Land Use #610) trip generation rate o a.m. peak hour: 0.95 / 1000 ft 2 (6 inbound / 37% outbound) o p.m. peak hour: 0.93 / 1000 ft 2 (38% inbound / 6 outbound) With the exception of the hospital rates, the trip rates take into account the TOD nature of the area and the high availability of transit services and active mode connections that will be provided for the site. For the retail land use component, a 15% reduction in a.m. and p.m. peak hour trips was applied to account for pass-by trip capture, as agreed upon in the scope of the study. Internal trips are trips that have an origin and destination within the site. Although it is anticipated that most internal trips will be made by walking, cycling or transit, it is expected that some of the internal trips will be made by vehicles. Therefore, to account for this, a 10 percent reduction in the overall trip rates was applied. The trip generation for the proposed development using the application of trip rates to the proposed land uses and adding in traffic estimates for the ACH resulted in a total of 5,000 trips during the a.m. peak hour and 6,500 trips in the p.m. peak hour, as summarized in Table 3. West Campus Transportation Impact Assessment 18
32 Civil, Municipal and Traffic Engineering Storm Water Management Legal Survey/Geomatics Transportation Planning TABLE 3: WEST CAMPUS TRIP GENERATION ESTIMATES LAND USE TRIPS GENERATED - AM PEAK HOUR TRIPS GENERATED - PM PEAK HOUR TOTAL INBOUND OUTBOUND TOTAL INBOUND OUTBOUND Multi-family Residential 2, ,644 2,818 1, Office 2,172 1, , ,036 Alberta Children's Hospital Retail + Community Facilities , Passby Reduction (Retail Only) Internal Trip 10% Total West Campus Trips 4,943 2,841 2,102 6,493 2,823 3, Comparison of Trip Generation Estimates To ensure that the use of the City of Calgary RTM Forecast traffic volumes for site generated traffic associated with the development will provide an accurate representation of future traffic in the area, a comparison of these volumes was made to the trip generation estimates arising from application of the approved trip rates. The results of the comparison are summarized in Table 4. TABLE 4: WEST CAMPUS TRIP GENERATION COMPARISON METHOD TRIPS GENERATED AM IB AM OB PM IB PM OB TOTAL RTM Forecast Model 2,867 2,187 2,864 3,138 11,056 Trip Generation Rates 2,841 2,102 2,823 3,670 11,436 Difference (Rates - Model) % Difference 3. The results indicate that the traditional trip generation rate technique provided values for the West Campus development that were approximately 3 percent higher than the RTM estimates. Given the scale of the development and the uncertainties regarding the potential internal capture and pass-by rates, this difference in estimates is considered reasonable. Therefore, it is concluded that the RTM trip generation estimates can be used to assess the operational performance of the study intersections. West Campus Transportation Impact Assessment 19
33 Civil, Municipal and Traffic Engineering Storm Water Management Legal Survey/Geomatics Transportation Planning 5.3 Future External Road Network There are a few changes that are planned to the surrounding road network between 2013 and the 2039 horizon year. The City s Regional Transportation Model (RTM) which is used to estimate future traffic volumes assumes a number of improvements to the network. The projects that are assumed to be complete by 2039 that are relevant to this study include: Enhanced Transit Service to West Campus including higher frequency on the current routes as well as new routes such as the South Shaganappi BRT 16 Avenue NW widened to 6 lanes through 29 Street NW intersection NW LRT Extended to Tuscany / Rocky Ridge Interchange at 16 Avenue NW / Bowfort Road In addition to the above improvements, the City Forecasting Division updated the RTM to include the internal road network for West Campus based on the current plans. This included the new all-turns access onto Shaganappi Trail from West Campus Way / 28 Street NW. 5.4 Review of RTM Land Use Assumptions The City s RTM was used to estimate the future traffic volumes in West Campus. Therefore to ensure that the model is based on the most accurate information, all of the adjacent transportation zones adjacent to West Campus were reviewed to ensure that the most up to date land use projections for employment and population were included in the model. Traffic adjustments were made to account for population or employment increases that may not be reflected in the model. A summary of the assumptions that were included in the model for adjacent transportation zones as well as some commentary as to whether adjustments to the traffic volumes were justified are included in Table 5. The year 2006 is used as the current / base scenario in the jobs and populations that are assumed in the City s Regional Transportation Model (RTM). Since this base period, ACH has become fully operational. After consultations with Alberta Health Services staff, it was determined that the number of staff currently employed at ACH is 1,320 of which approximately 1,030 work the day shift. West Campus Transportation Impact Assessment 20
34 Civil, Municipal and Traffic Engineering Storm Water Management Legal Survey/Geomatics Transportation Planning TABLE 5: RTM EMPLOYMENT AND POPULATIONS FORECASTS Employment / Population Forecast (Forecast) % Change Comments TZ 2035 Stadium Shopping Centre and University Heights Employment The City s RTM did not account for Population % redevelopment of Stadium Shopping Centre. Traffic volumes were manually adjusted to account for anticipated traffic volumes. TZ 2304 Foothills Medical Centre Employment 11,246 17,816 58% Assumes significant growth of site Population 0 0 0% including Cancer Care Centre. Growth included in the model is higher than what is assumed in the 2006 FMC master plan. No changes recommended. TZ 2732 Market Mall Employment % Anticipates the conversion of some Population n/a retail to residential. Since this would reduce overall traffic it was decided not to adjust volumes. TZ McMahon Stadium and Foothills Athletic Centre Employment % Minor growth expected at FAC with Population 0 0 0% negligible impact on West Campus. No adjustments recommended. McMahon discussed below. McMahon Stadium Although some future redevelopment is anticipated at McMahon Stadium, no further information was available at the time of this study. TDS staff indicated that the impact of any future development at McMahon stadium will be evaluated under a separate study Stadium Shopping Center The RTM assumes some minor growth but does not include Stadium Shopping Centre redevelopment. Based on the Stadium Shopping Centre Transportation Impact Assessment, West Campus Transportation Impact Assessment 21
35 Civil, Municipal and Traffic Engineering Storm Water Management Legal Survey/Geomatics Transportation Planning the forecast traffic volumes for West Campus were adjusted to account for the redevelopment. This primarily involved the addition of trips along 24 Avenue NW, West Campus Drive and 39 Street NW (West Campus Gate NW). The employment and population forecasts included in the standard forecast series of the RTM for the transportation zones that encompass West Campus were out of date. Therefore, the City s Forecasting Department updated the model to reflect the current plans for West Campus including population and employment projections. A summary of the land use assumptions for West Campus that are based on the most up to land uses is shown in Table 6. TABLE 6: RTM EMPLOYMENT AND POPULATIONS FORECASTS SPECIAL WEST CAMPUS MODEL RUN Employment / Population Forecast (Forecast) % Change Comments TZ 2402 University of Calgary (Includes part of the West Campus Development) Employment 8,957 13,725 5 The majority of this growth is attributed Population 2,137 10, % to West Campus. TZ 2403 West Campus and Alberta Children s Hospital Employment 219 6,597 2,91 Most of this growth is attributed to Population 0 7,720 n/a West Campus while some of the growth is attributed to Alberta Children s Hospital. TZ 2405 West Campus Employment 0 1,039 n/a All of this growth is attributed to West Population 0 9,012 n/a Campus. In summary, inputting the latest land use plans for West Campus into the RTM ensures that the forecast traffic volumes are based on the best available data. This combined with the minor adjustments that were made to account for the Stadium Shopping Centre redevelopment provides confidence that the forecast volumes are reflective of full development of West Campus and the surrounding area. West Campus Transportation Impact Assessment 22
36 Civil, Municipal and Traffic Engineering Storm Water Management Legal Survey/Geomatics Transportation Planning 5.5 Mode Split Travel mode split measures the proportion of all person trips generated by a site or region (coming to or departing from an area) being carried out by each of the following transportation modes: As a driver in a vehicle As a cyclist As a passenger in a vehicle As a transit rider As a pedestrian Very little existing modal split data is available for the West Campus area. Statistics Canada did collect information regarding how people commute to work as part of the 2006 census. This data can provide some insight regarding the potential modal split that could be achieved with residential land uses in the area. A summary of the travel to work survey completed as part of the 2006 census (the most recent year available) is provided in Table 7 for University Heights. For comparison purposes, two typical suburban neighborhoods (Coventry Hills and Glamorgan) along with city wide data are also included in the table. TABLE 7: EXISTING MODAL SPLIT UNIVERSITY HEIGHTS RESIDENTS COMMUTE TO WORK* MODE UNIVERSITY COVENTRY CITY OF GLAMORGAN HEIGHTS HILLS CALGARY Auto Driver 47% 79% 66% 68% Auto Passenger 7% 6% 8% Walk and Cycle 26% 7% 7% Transit % 17% Other TOTAL 100% 100% 100% 100% * Based on 2006 Federal Census Data Numbers may add up to more than 100% because of rounding This data is relevant to this study since the future residents of West Campus would likely exhibit a similar mode split for peak hour travel. With the planned improvements to transit, walking and cycling, it is likely that the modal split could improve with less auto travel. West Campus Transportation Impact Assessment 23
37 Civil, Municipal and Traffic Engineering Storm Water Management Legal Survey/Geomatics Transportation Planning 5.6 Future Modal Split Future modal split information for the West Campus area was provided by the City s Regional Transportation Model and is summarized in Table 8 for the transportation zones that encompass the West Campus area. The modal split data is an output of the RTM based on the proposed land uses, proximity to other major employment centres, quality of transit and many other variables that influence travel behavior. The data from the RTM includes single occupant vehicles (SOV), high occupancy vehicles (HOV) as well as transit, walk and bike percentages. It is noted that the HOV percentage includes both the driver and passengers. It is further noted that zone 2405 includes the U of C main campus so the numbers below are reflective of the entire West Campus of U of C development. Some of the percentages do not add to 100 due to rounding. The model data suggests that the West Campus area modal split upon full build-out would be approximately 45 percent and 36 percent non-auto trips during the AM and PM peak periods, respectively. Over a 24-hour period, 36 percent of the trips are expected to be by non-auto modes. This mode split estimate is at the lower end of the City s 60-year target of percent non-auto trips over a 24-hour period city-wide. Considering that West Campus is an inner city development, its proximity to major employment centres, the planned transit improvements in the area and current mode split data from nearby residents, the estimated percentage of non-auto trips appears to be underestimated. With a more comprehensive transit network and increased frequency of transit service, it is estimated that the West Campus development could achieve mode splits that exceed that City-wide 60-year target. Based on what is currently being achieved by the residential land uses in University Heights and what is currently being achieved at UBC in Vancouver, it is estimated that the modal split for West Campus could be in the range of percent nonauto trips. TABLE 8: RTM MODAL SPLIT ESTIMATES FOR WEST CAMPUS 2039 AM Peak Percentages SOV HOV Transit Walk Bike TOTAL Study Area Inbound % 100% Outbound % (2402, 2403, Internal 26% 1 5% 5 100% 2405) TOTAL 40% 16% % West Campus Transportation Impact Assessment 24
38 Civil, Municipal and Traffic Engineering Storm Water Management Legal Survey/Geomatics Transportation Planning PM Peak Percentages SOV HOV Transit Walk Bike TOTAL Study Area Inbound 48% 27% 17% 6% 100% Outbound 4 18% 3 5% 100% (2402, 2403, Internal 28% 18% 5% 48% 100% 2405) TOTAL % 24 Hour Percentages SOV HOV Transit Walk Bike TOTAL Study Area Inbound % 100% (2402, 2403, 2405) Outbound % 7% 100% Internal 26% 19% 5 100% TOTAL 40% % West Campus Transportation Impact Assessment 25
39 Civil, Municipal and Traffic Engineering Storm Water Management Legal Survey/Geomatics Transportation Planning 6.0 POST-DEVELOPMENT CONDITIONS 6.1 Post Development Traffic Volumes The future traffic volumes at the study intersections were estimated by the City s Forecasting Division. A number of adjustments were made to the forecast volumes to account for some of the inherent problems associated with developing detailed traffic volume estimate from a macro model. In addition to the adjustments, some of the intersection turning movement volumes needed to be estimated based on adjacent forecast data as well as knowledge regarding the West Campus and U of C Master Plans. The original future intersection volumes as well as the adjustments and the resulting volumes are provided in Appendix G. The resulting turning movement traffic volumes for each of the study intersections are summarized in Figure 6 for the 2039 horizon. The aforementioned graphic s volumes were rounded to the nearest 10 vehicles for clarity and the distance to the horizon year (2039). 6.2 Post Development Pedestrian Volumes According to the City s RTM, the entire West Campus development and the University of Calgary main campus are expected to generate approximately 4,600 pedestrian trips in the AM peak period, and 4,900 trips in the PM peak period. In addition to these primary pedestrian trips, there are expected to be thousands of secondary pedestrian trips including those people that will walk to/from a transit station or walk to/from their car parked in an off-site or on-street location. On a scale such as this, it is too difficult to assign the individual pedestrian trips to the intersections because there would be too much variability in terms of where the pedestrian trips are generated from, where they are destined to, and the routes taken. Therefore, to estimate the pedestrian volumes at the study intersections, it was decided to use current pedestrian volume information from other well used pedestrian corridors in Calgary outside of downtown and the beltline as the basis for estimating pedestrian volumes in West Campus. The current peak hour pedestrian volumes along 4 Street SW in Mission, 33 Avenue SW in Marda Loop and along Kensington Road are summarized in Table 9. The information is divided into those pedestrians walking along the main retail street, versus those that are crossing the main street. West Campus Transportation Impact Assessment 26
40 Civil, Municipal and Traffic Engineering Storm Water Management Legal Survey/Geomatics Transportation Planning FIGURE 6: POST-DEVELOPMENT TRAFFIC VOLUMES West Campus Transportation Impact Assessment 27
41 Civil, Municipal and Traffic Engineering Storm Water Management Legal Survey/Geomatics Transportation Planning TABLE 9: CURRENT PEAK HOUR PEDESTRIAN VOLUMES IN CALGARY Street Average Pedestrians Crossing Minor Street Average Pedestrians Crossing Major Street AM PM AM PM 4 th 20 th and 21 st Avenues (Mission) rd 20 th and 22 nd Streets in Marda Loop Kensington 12 th Street, 10A Street and 13 th Street AVERAGE MAX Using the pedestrian volumes from the table, together with engineering judgment, the future pedestrian volumes crossing each leg of the West Campus study intersections were estimated. The crossing volumes ranged between 25 and 80 during the AM peak period and between 25 and 125 during the PM peak period. The highest pedestrian volumes were estimated to be along West Campus Way which is the primary retail area for the development. For sensitivity analysis purposes, a significantly high value of 500 pedestrians per hour per crossing was modeled along West Campus Way using the improved scenario infrastructure (per Figure 9). The results of the capacity analysis (provided in Appendix H.) show the number of pedestrians modelled on each intersection leg does not have a significant impact on the capacity analysis results. The intersections along West Campus Way still operate with respectable levels of service for a mixed-use, pedestrian friendly urban area. 6.3 Post Development Bicycle Volumes West Campus and U of C main campus are expected to generate approximately 600 bicycle trips during both the morning and afternoon peak periods. Due to the overlapping boundaries of the transportation zones in the RTM, it is unknown how many of these trips are associated with the West Campus development versus the U of C main campus. Given the uncertainty regarding the volume and the size of the development area, it was deemed to be too difficult to assign the individual bicycle trips to the West Campus road network. Therefore, to estimate the bicycle trips for the intersections, a different approach was taken that involved reviewing current bicycle volumes along higher density inner-city streets. Based on this review, it was concluded that most intersections along these types of streets experience between 5-10 bicycle movements per direction. Based on the vision for West West Campus Transportation Impact Assessment 28
42 Civil, Municipal and Traffic Engineering Storm Water Management Legal Survey/Geomatics Transportation Planning Campus as a sustainable community and given the robust cycling network that is planned for the site, higher cycling volumes are anticipated. Therefore, it was decided to group the study intersections into three level of cycling activity including: High= 50 cycle movements per hour per direction Medium = 25 cycle movements per hour per direction Low = 10 cycle movements per hour per direction Based on the cycling infrastructure that is planned for West Campus as well as the density of the land uses, cycle volumes were estimated for each leg of the study intersections. These volumes were incorporated into the capacity analysis. The post-development walk and bicycle volumes for the study intersections are summarized Figure 7. West Campus Transportation Impact Assessment 29
43 Civil, Municipal and Traffic Engineering Storm Water Management Legal Survey/Geomatics Transportation Planning FIGURE 7: POST-DEVELOPMENT PEDESTRIAN AND BICYCLE VOLUMES West Campus Transportation Impact Assessment 30
44 Civil, Municipal and Traffic Engineering Storm Water Management Legal Survey/Geomatics Transportation Planning 6.4 Post Development Transit Volumes The City s Forecasting Division provided information related to future transit service in the area. As discussed in Section 8 the City is planning to add some new routes in the area and substantially increase the frequency of some of the existing routes that serve West Campus. Based on the routing and frequency of the future transit service, the number of bus movements through the intersections was estimated and incorporated into the capacity analysis. The number of bus blockages for each intersection approach ranged between 0 and 32 blockages per hour. 6.5 Post-Development Operating Conditions As per the study scope, capacity analysis was conducted for the following study intersections: 32 Avenue NW / Shaganappi Trail 32 Avenue NW / 39 Street NW (West Campus Gate NW) 32 Avenue NW / Collegiate Blvd. West Campus Way (28 Avenue NW) / Shaganappi Trail (proposed new site access point) West Campus Way / West Campus Drive West Campus Way / 39 Street NW (West Campus Gate NW) West Campus Way (Collegiate Drive) / Collegiate Blvd. ACH access onto West Campus Blvd. 24 Avenue NW / West Campus Drive 24 Avenue NW / West Campus Blvd. West Campus Blvd (Hospital Drive) / 16 Avenue NW (interchange terminals) The base network laning and signage for the 2039 post development period is shown in Figure 8. The initial road network that was assumed for the future conditions was based on the existing infrastructure and the proposed cross-sections included in the Outline Plan and Land Use Submission. The results represent the base case in terms of travel lanes and turning lanes at each of the study intersections. West Campus Transportation Impact Assessment 31
45 Civil, Municipal and Traffic Engineering Storm Water Management Legal Survey/Geomatics Transportation Planning FIGURE 8: WEST CAMPUS STREET NETWORK LANING AND SIGNAGE 2039 BASE SCENARIO West Campus Transportation Impact Assessment 32
46 Civil, Municipal and Traffic Engineering Storm Water Management Legal Survey/Geomatics Transportation Planning The future operating conditions for the intersections within the study area were evaluated using the Synchro 7.0 software package (which is based on the methodology outlined in the Highway Capacity Manual 2 ). For unsignalized (stop-controlled) intersections, the level-ofservice (LOS) is based on the computed delays on each of the critical movements. LOS A represents minimal delays for minor street traffic movements, and LOS F represents a scenario with an insufficient number of gaps on the major street for minor street motorists to complete their movements without significant delays. For signalized intersections, the methodology considers the intersection geometry, traffic volumes, the traffic signal phasing/timing plan, and also pedestrian volumes. The average delay for each lane group is calculated, as well as the delay for the overall intersection. The operating conditions can also be expressed in terms of volume-to-capacity (v/c) ratio. The LOS criteria for signalized and unsignalized intersections, as summarized in the Highway Capacity Manual, in presented in Table 10. TABLE 10: LEVEL OF SERVICE CRITERIA Level of Service (LOS) Average Delay for Unsignalized Intersection Movements Average Delay for Signalized Intersection Movements A 0 10 seconds per vehicle 0 10 seconds per vehicle B > seconds per vehicle > seconds per vehicle C > seconds per vehicle > seconds per vehicle D > seconds per vehicle > seconds per vehicle E > seconds per vehicle > seconds per vehicle F > 50 seconds per vehicle > 80 seconds per vehicle All roundabouts reviewed in this study were evaluated using the SIDRA Intersection 5.1 software package. For roundabout approaches, the level-of-service is based on the computed delays on each of the approaches. LOS A represents minimal delays, and LOS F represents a scenario with an insufficient number of gaps on the circulating flow for motorists to enter to the roundabout without significant delays. The LOS criteria for roundabouts are shown in Table Transportation Research Board, National Research Council. Highway Capacity Manual Washington, D.C West Campus Transportation Impact Assessment 33
47 Civil, Municipal and Traffic Engineering Storm Water Management Legal Survey/Geomatics Transportation Planning TABLE 11: LEVEL OF SERVICE CRITERIA FOR ROUNDABOUTS Level of Service (LOS) A B C D E F Average Delay for Roundabout Movements 0 10 seconds per vehicle > seconds per vehicle > seconds per vehicle > seconds per vehicle > seconds per vehicle > 80 seconds per vehicle Applying the future vehicle, pedestrian and bicycle traffic volumes summarized in Figures 6 and 7 and the intersection geometry from Figure 8, the level of service results of the intersection capacity analysis for each of the study intersections are summarized in Appendix H. Detailed capacity analysis Synchro reports for the signalized and stopcontrolled intersections are included in Appendix I, while detailed capacity analysis SIDRA reports for the roundabouts are included in Appendix J. A discussion of the intersections where capacity issues were present including potential solutions is provided in the following section. 6.6 Discussion of Results and Intersection Improvement Options 32 Avenue NW & Shaganappi Trail: Based on the traffic projections provided by the RTM, this intersection is expected to operate at or over capacity during the peak periods upon full build-out of West Campus. In both the morning and afternoon peak periods, several of the movements are expected to operate at level of service (LOS) F with volume-to-capacity (v/c) ratios over New phasing or signal timing plans were tested but could not alleviate the anticipated congestion. Therefore, geometric improvements are warranted for this intersection to address the anticipated congestion. The improvement that was tested was the expansion of Shaganappi Trail to three travel lanes in each direction, dual northbound and southbound left turn lanes and the addition of an eastbound right-turn lane. With these improvements in place, the intersection is expected to improve from an overall LOS F in both peak periods to LOS D and LOS E in the AM and PM peak periods, respectively. Even with the additional lanes, some of the individual movements are still expected to operate at LOS F. It is noted that the City is currently looking at improving the access to Market Mall which may have the impact of reducing the traffic volumes at the 32 Avenue NW and Shaganappi West Campus Transportation Impact Assessment 34
48 Civil, Municipal and Traffic Engineering Storm Water Management Legal Survey/Geomatics Transportation Planning Trail intersection. If this improvement is implemented, the need for expanding Shaganappi Trail to three lanes in each direction could be delayed. West Campus Way & Shaganappi Trail: In the base case scenario, this new access onto Shaganappi Trail was assumed to provide two travel lanes in each direction along Shaganappi Trail with a dual southbound left-turn lane into West Campus and a separate northbound right-turn lane. The westbound approach was assumed to have a dual left-turn lane and a separate right-turn lane. With this configuration, the intersection is expected to have operational issues in 2039 during the peak period with some of the movements operating at LOS F with v/c ratios in the range of The expansion of Shaganappi Trail to three travel lanes in each direction as discussed in the previous section will alleviate the identified operational issues. In the future an add-lane merge operation may be required for the eastbound right turning vehicles, due to the p.m. peak volumes. However, the need for this improvement would need to be balanced against the potential impacts on the pedestrian and cycling traffic that crosses the east leg of this intersection. No other improvements are required at this location. The capacity analysis that was conducted for the intersection of West Campus Way and Shaganappi Trail assumed that pedestrians would only be allowed to cross Shaganappi Trail on the north side. This is primarily to avoid potential conflicts between the westbound dual left-turn movement and pedestrian traffic on the south side, and to maximize the efficiency of the overall intersection operation. 32 Avenue NW & 39 Street NW (West Campus Gate NW): This intersection is anticipated to operate within acceptable limits during the PM peak period. In the AM peak, there are a few movements that are expected to operate slightly above the City s acceptable limits. One potential improvement that could address these operational issues is to provide a separate eastbound right-turn lane. However, the need for this improvement would need to be balanced against the potential impacts on the pedestrian and cycling traffic that crosses the south leg of this intersection on the regional path. West Campus Way & 39 Street NW (West Campus Gate NW): This internal intersection was assumed to be controlled by a stop sign on the southbound approach in the base case scenario. The capacity analysis suggests that this type of traffic control will not work in the peak periods. Therefore, a traffic signal was tested at this intersection and the operations improve to within acceptable standards. West Campus Transportation Impact Assessment 35
49 Civil, Municipal and Traffic Engineering Storm Water Management Legal Survey/Geomatics Transportation Planning 24 Avenue NW & West Campus Drive: This internal intersection is anticipated to operate within acceptable limits during the AM peak period. In the PM peak, there are a few movements that are expected to operate slightly above the City s acceptable limits. One potential improvement that could address these operational issues is to provide a separate westbound right-turn lane. The recommended approach for this intersection is to build the intersection without the westbound right-turn lane and then monitor traffic operations at each development phase. There is sufficient right-of-way to add the turn lane in the future if deemed necessary. All other intersections are expected to operate satisfactorily with the base case network assumptions. The results of the analysis for the improved traffic control options are presented in Appendix H and the resulting improved network is shown in Figure 9. A summary of the infrastructure improvements to the final road network is provided in Figure 10. West Campus Transportation Impact Assessment 36
50 Civil, Municipal and Traffic Engineering Storm Water Management Legal Survey/Geomatics Transportation Planning FIGURE 9: WEST CAMPUS STREET NETWORK LANING AND SIGNAGE 2039 IMPROVED SCENARIO West Campus Transportation Impact Assessment 37

51 Civil, Municipal and Traffic Engineering Storm Water Management Legal Survey/Geomatics Transportation Planning FIGURE 10: INFRASTRUCTURE IMPROVEMENTS 6.7 Potential for Roundabouts Three of the study intersections were tested as roundabouts. A discussion of each of these intersections is provided below. West Campus Boulevard / 24 Avenue NW: In the base case, this intersection was tested as a northbound stop controlled intersection. The results of this analysis suggest that the West Campus Transportation Impact Assessment 38
52 Civil, Municipal and Traffic Engineering Storm Water Management Legal Survey/Geomatics Transportation Planning intersection could work with this type of traffic control. A roundabout at this location was reviewed however there are too many constraints to make it a viable alternative for traffic control at this location. West Campus Boulevard / 16 Avenue NW (north and south terminals): Both of these intersections were tested as a signalized intersection in the base case and as a roundabout. The analysis suggests that under both traffic control options, the intersections would perform at a very good LOS B or better during both peak periods. Roundabouts are expected to perform better in the off-peak period and are also considered to be safer and more sustainable as compared to signalized intersections. It is recommended that a more detailed assessment of the intersection geometry and right-of-way be conducted at both of these locations at further stages of the planning process to determine the appropriate form of traffic control at these intersections. The result of the analysis for a single-lane roundabout option for the north terminal is presented in Appendix H. 6.8 Intersection Capacity Analysis Summary The post development operating conditions of the study intersections in the vicinity of West Campus with the improved geometry and roundabouts are summarized in Figure 11. As shown, most intersections are expected to operate with a good level of service (LOS A or B) during the a.m. and p.m. peak periods. Some intersections are anticipated to operate with a moderate level of service (LOS C or D) and no intersections in the study area are expected to operate with a poor level of service (LOS E or F). West Campus Transportation Impact Assessment 39

53 Civil, Municipal and Traffic Engineering Storm Water Management Legal Survey/Geomatics Transportation Planning FIGURE 11: LEVEL OF SERVICE SUMMARY IN STUDY AREA 6.9 Impact on Other Intersections The Select Zone outputs from the model were used to estimate the percentage increase in peak hour traffic volumes as a result of the West Campus Development at the following intersections: 32 Avenue NW / 33 Street NW 32 Avenue NW / 31 Street NW (Campus Drive) 32 Avenue NW / Crowchild Trail (interchange terminals) West Campus Transportation Impact Assessment 40
54 Civil, Municipal and Traffic Engineering Storm Water Management Legal Survey/Geomatics Transportation Planning 24 Avenue NW / Crowchild Trail 24 Avenue NW / University Drive The results of this review are provided in Table 12. TABLE 12: WEST CAMPUS IMPACT ON NEARBY INTERSECTIONS Entering Volumes Intersection AM Peak PM Peak Existing Addition from WC (2039) Increase % Existing Addition from WC (2039) Increase % 32 Avenue NW / 33 Street NW % % 32 Avenue NW / 31 Street NW (Campus Drive) % % 32 Avenue NW / Crowchild Trail (East interchange terminal) % 32 Avenue NW / Crowchild Trail (West interchange terminal) % 24 Avenue / Crowchild Trail Avenue / University Drive Based on the projected traffic volumes, the West Campus development is expected to increase volumes at intersections outside the immediate area by between 3-33 percent Daily Volume Analysis The daily traffic volumes on the internal and external streets surrounding West Campus were estimated for the year The daily volumes were estimated at ten times the PM peak entering volumes (shown in Figure 6) at the adjacent intersections. As a comparison, the estimated daily vehicle volumes for external and internal streets adjacent to the development are shown in Figure 12 along with the existing daily volumes of the external roads. These daily volumes were considered along with the context and function of various roadways and the current usage to develop a road classification scheme for the road network. It is noted that many of the streets within West Campus are already built, therefore where possible the existing infrastructure was incorporated into the proposed classifications. West Campus Transportation Impact Assessment 41
55 Civil, Municipal and Traffic Engineering Storm Water Management Legal Survey/Geomatics Transportation Planning FIGURE 12: 2039 DAILY VOLUME ESTIMATES Shown in Table 13 are the five classifications of roadways to be used in West Campus with their respective Right-of-Way (ROW) widths and estimated daily traffic volumes in vehicles per day (vpd). Detailed cross sections of these planned roadways can be found in Appendix E. West Campus Transportation Impact Assessment 42
56 Civil, Municipal and Traffic Engineering Storm Water Management Legal Survey/Geomatics Transportation Planning TABLE 13: ROADWAY CLASSIFICATION SUMMARY Roadway West Campus Gate (39 Street NW) West Campus Way East of West Campus Drive West Campus Way West of West Campus Drive West Campus Drive Next to Hospital West Campus Crescent 24 Avenue NW South of Hospital West Campus Blvd. South of 24 Avenue NW West Campus Blvd. South of West Campus Drive West Campus Drive South of 24 Avenue NW Recommended Road Classification Primary Collector Activity Centre Street ROW Width (m) As Per Existing (~35.4) Estimated Future Volume (vpd) Daily Volume Ranges (2013 Complete Streets) 14,300 8,000 15, ,400 3,000 15,000 Local Arterial ,100 15,000 20,000 Local Arterial ,700 15,000 20,000 Collector ,100 2,000 8,000 Primary Collector Primary Collector ,300 8,000 15, ,000 8,000 15,000 Local Arterial ,000 15,000 20,000 Collector ,600 2,000 8,000- Collegiate Road Collector ,000 2,000 8, Phasing The West Campus Development Trust has prepared a preliminary phasing plan for the development of West Campus as shown in Figure 13. Based on this phasing plan, the first phase is expected to be the mixed-use portion of West Campus Way (the High Street). Based on the transportation analysis conducted as part of this study, the transportation infrastructure required to support this phase includes the addition of the new access onto Shaganappi Trail at West Campus Way and the construction of West Campus Way to its ultimate cross-section. Other phases in the development are only expected to require local West Campus Transportation Impact Assessment 43

57 Civil, Municipal and Traffic Engineering Storm Water Management Legal Survey/Geomatics Transportation Planning improvements/upgrades to the road network. Table 14 outlines the recommended phase each improvement should be included in. FIGURE 13: WEST CAMPUS PHASING PLAN West Campus Transportation Impact Assessment 44
58 Civil, Municipal and Traffic Engineering Storm Water Management Legal Survey/Geomatics Transportation Planning TABLE 14: RECOMMENDED IMPROVEMENT PHASING No. Improvement Description Estimated Time Required 1 New Intersection of Shaganappi Trail and West Phase 1 Campus Way 2 Construction of West Campus Way from Shaganappi Phase 1 Trail to Collegiate Blvd. 3 Reconstruction of West Campus Boulevard from 24 Phase 2 Avenue NW to South Boundary of site 4 Reconstruction of intersection of West Campus Phase 2 Boulevard and 24 Avenue NW 5 Reconstruction of 24 Avenue NW from West Campus Phase 2 Blvd. to West Campus Drive. 6 Reconstruction of West Campus Drive from 24 Avenue Phase 2 NW to West Campus Way 7 Traffic Signals at West Campus Way and West Campus Phase 3 Drive 8 Traffic Signals at West Campus Way and West Campus Gate 9 Traffic Signals at West Campus Way and Collegiate Blvd. 10 Construction of Roundabouts or Signals at 16 Avenue NW Interchange Terminals (to be confirmed through discussions with AHS and City) 11 Widening Shaganappi Trail from 32 Avenue NW to 16 Avenue NW and the addition of dual SBLT West Campus Way / Shaganappi Trail. 12 Intersection Improvements to Shaganappi Trail and 32 Avenue NW Responsibility for Funding Developer Developer Developer Developer Developer Developer Developer When Developer Warranted When Developer Warranted TBD Developer / City / AHS TBD Developer / City TBD Developer / City Shaganappi Trail Improvements: The construction of the new signalized access at Shaganappi Trail and West Campus Way is expected to be completed as part of the initial phase of the West Campus Development. The provision of a dual southbound left-turn lane and the widening of Shaganappi Trail between West Campus Way and 32 Avenue NW could West Campus Transportation Impact Assessment 45
59 Civil, Municipal and Traffic Engineering Storm Water Management Legal Survey/Geomatics Transportation Planning be phased as development proceeds and the need arises. A potential phasing strategy for these improvements is provided below: Stage 1 (Opening Day) Construct Shaganappi Trail / West Campus Way signalized intersection Maintain existing two through lanes northbound/southbound Revise median to add a single southbound left-turn lane Construct dual westbound left-turn lanes and a tapered westbound right-turn lane Stage 2 Add northbound through lane that extends from south of West Campus Way through 32 Avenue NW. This improvement would be accommodated by widening to the east while holding the median and west curb line. Stage 3 Add an additional southbound left-turn lane (dual lefts) Add southbound through lane that extends from north of 32 Avenue NW to south of West Campus Way (tapering back to existing two lanes). This improvement would require modifications to the median as well as widening to the west. It is recommended that the timing for the above improvements be tied to specific traffic operational triggers to ensure that the infrastructure is constructed only when needed. The specific triggers could be related to delays for individual intersection movements, queue lengths or level of service for the overall intersection. More discussion with the City is needed to determine appropriate triggers for these improvements. 16 Avenue NW / West Campus Boulevard Intersection Improvements: The north terminal of the interchange of West Campus Boulevard and 16 Avenue NW is currently operating satisfactorily as a stop controlled intersection with the right of way given to traffic headed northbound and southbound on West Campus Boulevard. To support full development of West Campus, the traffic control for this intersection will need to be upgraded to either a single lane roundabout or a traffic signal. Through discussions with WCDT, the preference for this intersection is a roundabout. This is subject to discussions with Alberta Health Services and the feasibility would need to be confirmed through detailed design. The upgrade of this intersection should be constructed only when needed. Rather than tie the upgrade to a specific phase of development, the preferred approach is to tie the upgrade to a specific trigger related to traffic operations at the intersection. The trigger West Campus Transportation Impact Assessment 46
60 Civil, Municipal and Traffic Engineering Storm Water Management Legal Survey/Geomatics Transportation Planning could be level of service for the intersection, delays to the stop-controlled traffic or queues along the off-ramp. More discussion with the City is needed to determine the appropriate trigger for this improvement. Whichever trigger is decided, regular monitoring of the traffic volumes at this intersection and capacity analysis is required on at least an annual basis. West Campus Transportation Impact Assessment 47
61 Civil, Municipal and Traffic Engineering Storm Water Management Legal Survey/Geomatics Transportation Planning 7.0 ACTIVE MODES REVIEW 7.1 Site Description The proposed West Campus development site is situated in the northwest quadrant of the City in an area within close proximity to several major travel destinations. A diverse range of land uses are proposed within West Campus and within walking distance of the development, which include offices, commercial and institutional destinations, residential areas, medical facilities, sports and recreation facilities, cultural amenities, open spaces, as well as transit stops and other active mode travel destinations. The site is also located within walking distance of Market Mall, the communities of Varsity Village, Montgomery, University Heights, and Parkdale, and is close to the extensive Bow River pathway system. 7.2 Existing Pedestrian and Cyclist Facilities The proposed road network within West Campus and in the vicinity of the site will provide pedestrians with a variety of alternative route options to nearby travel destinations. The sidewalks and pathways in the area also provide good connectivity to several local amenities and transit stops. Major pedestrian and cyclist destinations located close to the site are illustrated in Figure 14. Also shown is the existing pedestrian and bicycle pathway system within a 1 km radius and a 3 km radius from the site. The existing regional pathways and on-street bicycle routes bordering the proposed development provide connections from West Campus throughout the City, including routes leading south to the extensive Bow River pathway system. The regional pathway along the Bow River provides a direct and well-maintained connection to major beltline and downtown destinations, which are located at an approximate distance of 7 km from the site. The number of pedestrians that travel across Shaganappi Trail between Montgomery and the south end of the Alberta Children s Hospital was not quantified as part of this study. Aerial photographs showing a worn path connecting 22 Avenue NW on the west side to 24 Avenue NW on the east side suggest that the crossings do occur with some regularity. Due to the high operating speeds in the area and the steep grades on Shaganappi Trail, the preferred solution is to encourage pedestrians to use the new signalized at-grade crossing being provided at West Campus Way. As shown in Figure 15, strong pedestrian connections on the east side of Shaganappi Trail are being provided to help encourage pedestrians to cross at the new at-grade crossing. West Campus Transportation Impact Assessment 48

62 Civil, Municipal and Traffic Engineering Storm Water Management Legal Survey/Geomatics Transportation Planning FIGURE 14: TRAVEL DESTINATIONS AND PEDESTRIAN AND CYCLIST FACILITIES 7.3 Future Pedestrian and Cyclist Facilities In addition to the existing pedestrian and cyclist facilities in the vicinity of West Campus, the proposed development is anticipated to incorporate an extensive system within the site to accommodate active transportation modes and provide a safe and walkable environment aligning with the West Campus vision. Figure 15 from the West Campus Land Use Plan and Outline Plan report illustrates the proposed pedestrian and cyclist infrastructure internal to the West Campus development. West Campus Transportation Impact Assessment 49

63 Civil, Municipal and Traffic Engineering Storm Water Management Legal Survey/Geomatics Transportation Planning FIGURE 15: INTERNAL PEDESTRIAN AND CYCLIST FACILITIES West Campus Transportation Impact Assessment 50
64 Civil, Municipal and Traffic Engineering Storm Water Management Legal Survey/Geomatics Transportation Planning As shown, sidewalks and pathways are proposed along major roadways within the development to enhance pedestrian mobility and provide a multitude of different route options. The sidewalks will be constructed as per the City of Calgary s Complete Streets Guidelines and will range in width from 1.5 m to 3.0 m based on anticipated levels of pedestrian traffic and to maximize safety and comfort. In addition to the multi-use pathways, on-street bike lanes and separate bike paths will further enhance connectivity and provide route options for cyclists travelling around West Campus and to external access points such as 37 Street NW to the north, 24 Avenue NW to the east, and West Campus Boulevard and 16 Avenue NW to the south and west, respectively. A regional pathway will loop around much of the perimeter of West Campus to facilitate commuter and recreational cycling around the development. The sidewalk and pathway network will also provide direct connections to the nearby transit facilities and bus stops located within and in close proximity to the site. As per the Outline Plan report, additional infrastructure will be constructed to improve the quality of the active modes facilities in the area, including raised pedestrian crosswalks, median refuge islands, curb extensions and curb cut ramps to accommodate wheel chair and stroller use. Bike parking, bike lockers and shower facilities will be provided as per City of Calgary bylaw requirements. As such, the proposed layout and planned active modes network within and in the vicinity of West Campus has been designed to accommodate and encourage a high level of pedestrian and cyclist activity upon construction of the proposed development. West Campus Transportation Impact Assessment 51
65 Civil, Municipal and Traffic Engineering Storm Water Management Legal Survey/Geomatics Transportation Planning 8.0 TRANSIT SERVICE 8.1 Existing Transit Service The West Campus area is currently serviced by bus routes 9, 72, 73, and 91. The approximate service headways and possible connections for each route are summarized in Table 15. TABLE 15: EXISTING TRANSIT SCHEDULE AND CONNECTIONS Route 9 Varsity Acres / Bridgeland 72 Circle Route 73 Circle Route 91 Lions Park / Brentwood Connections Brentwood terminal, University of Calgary, Children s Hospital Brentwood terminal, University LRT, Shaganappi Point LRT, Children s Hospital, Westbrook terminal Brentwood terminal, University LRT, Shaganappi Point LRT, Children s Hospital, Westbrook terminal Brentwood LRT, Children s Hospital, Foothills, Lions Park LRT AM Peak Frequency (minutes) Mid PM Sat Sun Eve Peak Peak Day Eve Day Additional routes provide transit services to the area along 32 Street and on 16 Avenue. The existing transit facilities and routes servicing West Campus and the surrounding areas are shown in Figure 16 provided by Calgary Transit. The sidewalk network in the area provides a direct route to these transit stops. West Campus Transportation Impact Assessment 52

66 Civil, Municipal and Traffic Engineering Storm Water Management Legal Survey/Geomatics Transportation Planning FIGURE 16: EXISTING TRANSIT SERVICE 8.2 Future Transit Service The City of Calgary is currently in the process of evaluating transit services in an area that includes West Campus, the University of Calgary, Brentwood, Market Mall and the Foothills Medical Centre. The study, titled the NW-HUB Transit Enhancement Study, is anticipated to be completed in The study is aimed at assessing the need and feasibility of potential mobility improvement options, including bus lines and operations, bus rapid transit (BRT) services, cycling and pedestrian routes, and alternative improvement possibilities such as trams and urban gondolas. It is expected that upon completion of the study, the City of Calgary may introduce upgrades to transit services and infrastructure in the West Campus area. West Campus Transportation Impact Assessment 53

67 Civil, Municipal and Traffic Engineering Storm Water Management Legal Survey/Geomatics Transportation Planning As detailed in the West Campus Outline Plan and Land Use report, the proposed development is planned to incorporate several new bus stops within the site, such that all areas within West Campus are located within 400 m of a transit stop. In addition, the area is expected to be serviced by several new routes, as illustrated in Figure 17 from the Outline Plan report. FIGURE 17: FUTURE TRANSIT NETWORK West Campus Transportation Impact Assessment 54
68 Civil, Municipal and Traffic Engineering Storm Water Management Legal Survey/Geomatics Transportation Planning Although the anticipated routes and schedules may be subject to change in the future upon further discussions with Calgary Transit and based on the findings of the NW-HUB Transit Enhancement Study, Table 16 details the anticipated future transit routes and associated service headways expected. This data was provided by the City of Calgary Forecasting division as transit model assumptions used in the 2039 Regional Transportation Model forecast. TABLE 16: FORECAST FUTURE TRANSIT SERVICES Route Frequency (minutes) AM Peak Hour PM Peak Hour Off Peak Hour 8 - North Pointe / Brentwood Varsity Acres / Bridgeland Dalhousie / Southcentre Avenue North Heritage / Northmount Dalhousie Crowfoot / North Hill Circle Route Circle Route Lions Park / Brentwood Avenue North Varsity Northwest Loop Northwest Loop MRC N Express 4 4 N/A Rocky Ridge/552X LRT BRT North Crosstown BRT Hillhurst Shuttle Greenwood Lions Park Street Crosstown Foothills / Parkhill Based on the above information, Calgary Transit is planning to increase the frequency of existing transit service to the area significantly. In most cases, the frequency of transit service has doubled during the peak periods and more than doubled in the off-peak periods. Routes #309 and #320 are new BRT routes planned to service the area. West Campus Transportation Impact Assessment 55
69 Civil, Municipal and Traffic Engineering Storm Water Management Legal Survey/Geomatics Transportation Planning 9.0 SUMMARY AND CONCLUSION The Vision for West Campus includes many of the sustainability principles outlined in the Calgary Transportation Plan. The population and employment density is expected to exceed the minimum requirements for a Major Activity Centre and will generate enough critical mass to support frequent transit service. The mixed-use nature of the development, together with the proximity to major employment centres will generate a large number of internal trips and will also encourage other forms of sustainable transportation including walking and cycling. It is expected that the quality and accessibility of the future proposed transit infrastructure will align with the vision of providing users with safe, efficient and reliable transit service to encourage active and sustainable transportation modes in and around the West Campus development. The sustainability principles that have been incorporated into the plan will reduce the proportion of trips made by automobile thereby reducing the impact on the adjacent transportation network. With the recommended improvements outlined in this report, the transportation network will be able to support full development of West Campus. West Campus Transportation Impact Assessment 56
70 Civil, Municipal and Traffic Engineering Storm Water Management Legal Survey/Geomatics Transportation Planning APPENDIX A: SCOPE OF WORK West Campus Transportation Impact Assessment
71
72
73
74
75
76 Civil, Municipal and Traffic Engineering Storm Water Management Legal Survey/Geomatics Transportation Planning APPENDIX B: LAND USE PLANS West Campus Transportation Impact Assessment
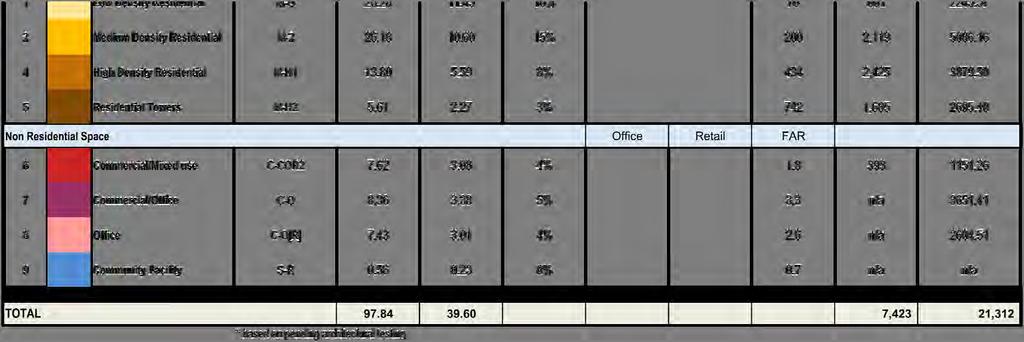
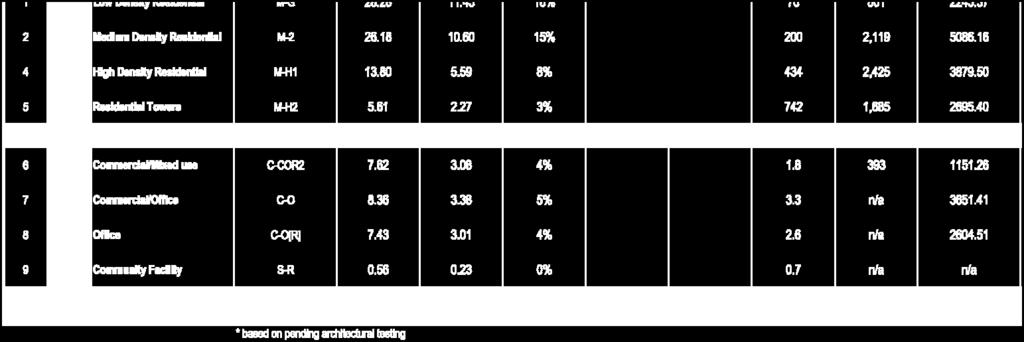
77
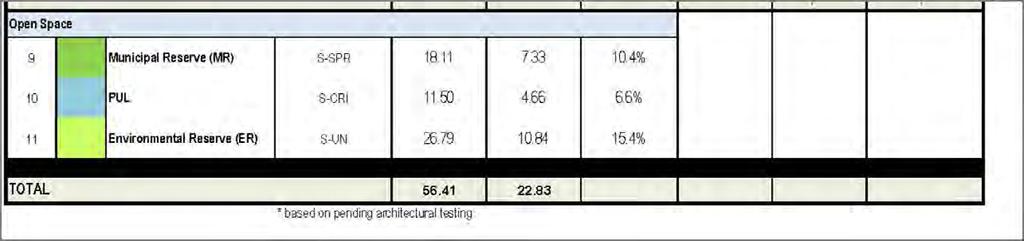
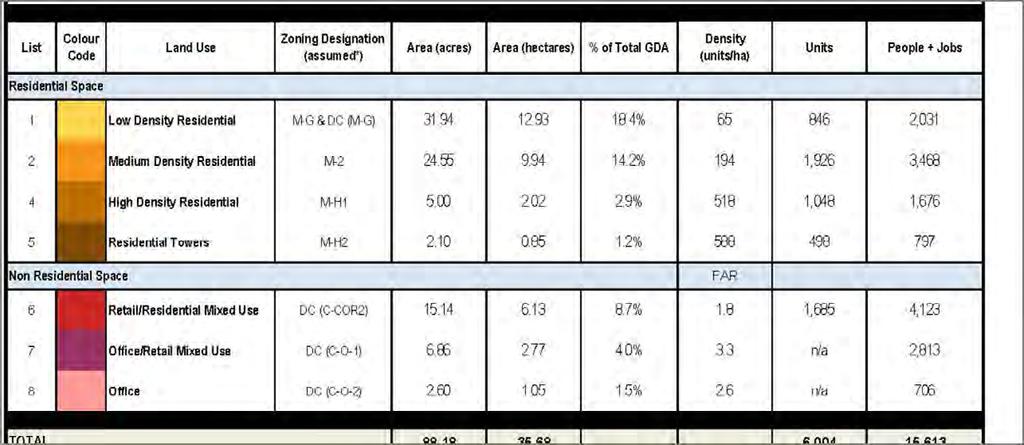
78
79 Civil, Municipal and Traffic Engineering Storm Water Management Legal Survey/Geomatics Transportation Planning APPENDIX C: TRIP GENERATION METHODOLOGY West Campus Transportation Impact Assessment
80 services hospital Gross Land Area (GLA) 830,032 sqm ronald hou new total ER 101,630 sqm Net land area (minus ER) 728,402 sqm Land Use NLA (sqm) Height % of GLA Coverage (%) (Storey) FAR GFA (sqm) Units Population residential SITE TOTALS 728, % ,942 6,263 18,814 % GLA % NLA NLA GFA units 154, , DEVELOPABLE SMARTPLAN ID 400,430 55% 847,942 6,263 18, , ,463 1,862 26, ,096 1,251 Residential 303,144 37% ,984 5,320 11,149 13,411 21, ,054 1, ,992 19% , , Low Density Residential LDR 35% % ,984 Medium Density Residential MDR 100, % ,463 1,862 4, % 4, , , High Density Residential HDR 26,747 55% ,096 1,251 2, % 697,340 Residential Towers RTOWER 21,009 55% ,054 1,251 2, % 2.9% total 340, ,115 6, , ,000 8,000 Commercial / Mixed Use MU RES RETAIL 43,452 5% 60% , , % 6,518 19, Retail 15% Residential 85% 36, , ,263 Assumptions: retail Commercial / Office MU COMM RETAIL 29,892 65% ,451 2, % 4. Unit Sizes (sqm) 6,518 19,964 Retail 897 2, ,083 2,730 Office 97% 28,996 84,827 2,828 Townhouse 150 7,601 22,694 Office OFFICE 23,755 65% ,306 2, % 3. Midrise Apartment 120 6,700 26,000 Highrise Apartment 80 Community Facilities CFACILITY 187 0% 55% Hotel 70 office Community Facility (Retail) 100% NLA GFA Residential 0% POPULATION (per unit) 28,996 84,827 23,755 60,306 Townhouse , ,133 NON-DEVELOPABLE 327,972 45% Midrise Apartment , ,000 Highrise Apartment 1.6 Open Space 125, Office 30 m2 / employee TOTALS Retail 40 m2 / employee 400, ,942 S-SPR S-SPR MR 78, % 9.5% 10.8% 397, ,000 S-UN S-UN ER - 0% % Institutional 30 m2 / employee S-CRI S-CRI PUL 46, % 6. NLA GFA easements 361,019 Infrastructure 202, % - FAR Roads 202,711 28% GFA/NLA PARCEL BY PARCEL FAR GFA/NLA PARCEL BY PARCEL WITHOUT EASEMENTS previous #'s SUMMARY TOTALS precise in Board of Governors PPT GROSS FLOOR AREA 847,942 sqm 884, ,000 GROSS DEVELOPABLE LAND AREA 830,032 sqm 841, ,222 NET DEVELOPABLE LAND AREA 728,402 sqm 739, ,592 FAR ON GROSS DEVELOPABLE AREA FAR ON NET DEVEOPABLE AREA RESIDENTIAL GFA 680,115 sqm 711, ,000 RETAIL GFA 22,694 sqm 20,988 20,000 OFFICE GFA 145,133 sqm 152, ,000 RESIDENTIAL UNITS 6,263 6,755 6,500 TOTAL PEOPLE + JOBS 18,814 19,618 n/a
81 Determination of TZ 2402 Traffic Associated with West Campus, and with U of C Forecast with Regular Model Run for 2039 AM IB AM OB PM IB PM OB TOTAL TZ TZ TZ TOTAL July Forecast for 2039 with West Campus Landuse Assumptions AM IB AM OB PM IB PM OB TOTAL TZ TZ TZ TOTAL Trips Added by including West Campus Land Use Assumptions (West Campus Run - Regular Run) AM IB AM OB PM IB PM OB TOTAL TZ % TZ TZ TOTAL % Percent of TZ 2402 trips (U of C zone) that are WC trips {(West Campus Run - Regular Run)/West Campus Run} - this assumed increase is attributed to West Campus
82 17% Trips of TZ 2402 assumed to be to/from West Campus Forecast for 2039 with West Campus Landuse Assumptions - with 17% of TZ 2402 AM IB AM OB PM IB PM OB TOTAL TZ TZ TZ TOTAL West Campus Trip Generation based on City of Calgary Trip Rates AM IB AM OB PM IB PM OB TOTAL Difference (Trip Gen - Forecast) % Difference = (Trip Gen-Forecast)/Trip Gen 2.
83 Civil, Municipal and Traffic Engineering Storm Water Management Legal Survey/Geomatics Transportation Planning APPENDIX D: SELECT ZONE PLOTS SPECIAL WEST CAMPUS MODEL RUN West Campus Transportation Impact Assessment

84 R1523c1: West Campus TIA Select Zone Distributions Request Number: R1523c1 Location: West Campus Forecast Requested by: Zoran Carkic Company: Development Services Date Requested: July 24, 2013 Forecast Prepared by: Xiaolin Qin Date Completed: July 26, 2013 Cost: N/A Notes: Database: 39P899_05_Target_WestCampus If you have any questions regarding this forecast, please ADVISORY: Prior to application in any study, all model inputs and outputs require interpretation and adjustment. DISCLAIMER: The City of Calgary provides this information in good faith but provides no warranty, nor accepts any liability arising from any incorrect, incomplete or misleading information or its improper use. If you have questions, require clarification or would like more details on this data please contact ISC: Protected
85 16% Project Title: R1523c1-W est Campus TIA Horizon: 2039 Target W est Campus Time of Day: AM Peak Hour Select Zone: TZ IB 19% 6% 19% Note: Values less than are suppressed for clarity. TRAIL 19% 1 19% 20% 8% N LAURIE 1 25% % 10% 10% BL 16% 17% 1 7% 7% 7% 7% 7% 16% 16% 17% 17% 1 6% 10% SHAGANAPPI AVENUE NW % % 30% 16% 19% 16% UNIVERSITY 6% 6% 6% 6% 6% % 5% 345 DRIVE 24 AVENUE NW 36% 3 OW 3 7% RIVER MEMORIAL DRIVE 25% 7% 25% 2 5% 5% 26% Scenario #: 31 Plotted by XQIN BOW TRAIL 33 ST SW 25% 5% 20% KENSINGTO ROAD 20% 5% 20% 1 1 5% 5%
86 % Project Title: R1523c1-W est Campus TIA Horizon: 2039 Target W est Campus Time of Day: AM Peak Hour Select Zone: TZ OB 7% Note: Values less than are suppressed for clarity. 7% 8% 6% 7% 6% 8% TRAIL 6% 6% 5% 5% 5% N LAURIE 9% 25% BL 6% 10% 8% 8%1 7% 7% 7% 7% 7% 8% 8% 6% 5% 10% 8% 6% 9% 7% 32 AVENUE NW 1 2 SHAGANAPPI 7% 7% UNIVERSITY DRIVE 24 AVENUE NW OW RIVER 10% 10% MEMORIAL DRIVE BOW TRAIL KENSINGTO ROAD 33 ST % % 4 9% 5% 5% 1 28% 5% 5% 28% 27% 28% 25% Scenario #: 32 Plotted by XQIN 5% 19% 19% 5% 5% 20% SW 16% 1 % 2
87 1 Project Title: R1523c1-W est Campus TIA Horizon: 2039 Target W est Campus Time of Day: PM Peak Hour Select Zone: TZ IB 1 5% RIVER 1 Note: Values less than are suppressed for clarity. 7% 7% 1 TRAIL 7% 7% 6% 6 N LAURIE 1 7% 7%19% 1 7% 7% 7% 7% 6% 6% 6% BL 7% 19% 10% 19% % 3 5% 7% SHAGANAPPI 32 AVENUE NW 8% 8% % % 366 UNIVERSITY AVENUE NW 37% 5% 5% 5% 9% 9% DRIVE 36% OW 5% % 8% 2 2 MEMORIAL DRIVE Scenario #: 33 Plotted by XQIN BOW TRAIL 6%7% 1 7% 7% 9% KENSINGTO 5% 1 ROAD 5% 5% 1 33 ST SW 10% 10%
88 Project Title: R1523c1-W est Campus TIA Horizon: 2039 Target W est Campus Time of Day: PM Peak Hour Select Zone: TZ OB 1 15% Note: Values less than are suppressed for clarity. 10% 10% 10% 10% 15% TRAIL 10% 10% 10% 10% 10 15% 16% N LAURIE % 2 BL 10% 15% 10% 6% 1 6% 5% 5% 10% 10% 10% 9% 9% 9% 6% 1 5% 6% 7% 6% 1 SHAGANAPPI 1 32 AVENUE NW 1 10% 10% 20% 9% 8% 19% OW 7% UNIVERSITY DRIVE 24 AVENUE NW RIVER 5% MEMORIAL DRIVE BOW TRAIL KENSINGTO ROAD 33 ST 29% 10% 20% 6% 6% 5% 5% 5% % 16% % 30% 6% 6% 6% 6% 7% 1 7% 7% 7% 10% 10% 10% 2 6% 6% Scenario #: 34 Plotted by XQIN 2 19% 19% 19% 17% SW 1 2
89 1 Project Title: R1523c1-W est Campus TIA Horizon: 2039 Target W est Campus Time of Day: AM Peak Hour Select Zone: TZ IB 1 1 Note: Values less than are suppressed for clarity. 6% 6% 6% 26% 26% 1 26% 26% 1 TRAIL N LAURIE 7% 7% 7% 7% 7% 7% 7% 7% BL 7% 8% 26% 26% 26% SHAGANAPPI 26% 8% 9% 8% 5% AVENUE NW % 8% 9% 15% % % % 6% 7% 8% 1 1 UNIVERSITY DRIVE 7% 24 AVENUE NW 5% 1 2 OW 1 8% 7% % % 8% 6% 6% 6% RIVER 1 10% 8% 8% 25% 1 BOW TRAIL MEMORIAL DRIVE 6% 1 1 6%6% 6% 6% 6% Scenario #: 41 Plotted by XQIN 6% ST 1 SW % 7% 7% 7% 6% KENSINGTO ROAD 6% 1 6% 1 10% 10% 7% 7%
90 % Project Title: R1523c1-W est Campus TIA Horizon: 2039 Target W est Campus Time of Day: AM Peak Hour Select Zone: TZ OB Note: Values less than are suppressed for clarity % 1 TRAIL 1 1 7% 6% 6% 5% 5% 1 9% 9% N LAURIE 8% BL SHAGANAPPI 1 16% 32 AVENUE NW 5% UNIVERSITY 24 AVENUE NW DRIVE OW RIVER 9% 9% MEMORIAL DRIVE BOW TRAIL KENSINGTO ROAD 33 ST 6% 5% 29% 6% 5% 555 7% 6% 1 9% % % 10% 6% 6% 6% 20% % % % 9% 1 1 5% 7% 5% 5% 9% 1 9% 9% % 9% 10% 9% 10% 9% 19% 19% 19% 19% 8% 7% 7% Scenario #: 42 Plotted by XQIN 6% 8% 6% 8% SW 1 10%
91 7% Project Title: R1523c1-W est Campus TIA Horizon: 2039 Target W est Campus Time of Day: PM Peak Hour Select Zone: TZ IB 8% 8% 8% Note: Values less than are suppressed for clarity. 16% 17% 8% 16% 16% 8% TRAIL 1 8% 8% 7% 7 N LAURIE 1 BL 17% 17% 2 SHAGANAPPI 17% 5% 1 32 AVENUE NW 7% 7% 5% 5% 5% 7% % 5% % 8% 9% 8% % 5% 7% 7% 25% 25% 7% UNIVERSITY 1 24 AVENUE NW 1 OW 5% 5% 5% 5% 17% % 2 2 DRIVE % 17% 1 8% 9% 5% 7% 8% 10% 10% RIVER 5% 1 1 5% 1 1 8% MEMORIAL DRIVE 7% 6% 6% 6% 6% Scenario #: 43 Plotted by XQIN BOW TRAIL 33 ST 6% SW 9% 9% % KENSINGTO ROAD 5% 1 5% 1 9% 9% 9% 8% 8%
92 0% Project Title: R1523c1-W est Campus TIA Horizon: 2039 Target W est Campus Time of Day: PM Peak Hour Select Zone: TZ OB 10% 1 Note: Values less than are suppressed for clarity % 10% 2 TRAIL 27% % N LAURIE BL 25% 26% 26% 5% 26% 5% 6% 6% 5% 32 AVENUE NW 8% 7% 6% 7% SHAGANAPPI 26% 30% 1 UNIVERSITY DRIVE 24 AVENUE NW OW RIVER 5% 5% MEMORIAL DRIVE BOW TRAIL KENSINGTO ROAD 33 ST 8% 7% 7% 7% 7% 7% 2 5 9% % 1 8% 18% % 18% 10% 7% 6% 6%6% % 2 7% 8% 8% 5% 5% 5% 2 1 7% 7% 7% 7% 5% 7% 27% 17% 16% 16% 15% Scenario #: 44 Plotted by XQIN 15% 15% 15% 15% 15% 5% 10% 10% 1 10% 6% 6% SW 8%
93 15% Project Title: R1523c1-W est Campus TIA Horizon: 2039 Target W est Campus Time of Day: AM Peak Hour Select Zone: TZ IB 18% 5% 18% Note: Values less than are suppressed for clarity. 7% 7% 7% 7% 7% 5% TRAIL 15% 16% 7% 5% 5% 15% 4 6% N LAURIE 1 20% % 9% 9% BL 7% 7% 1 15% 1 7% 7% 7% 7% 6% 6% 6% 6% 6% % 15% 1 7% 5% 9% 5% SHAGANAPPI 9% 10% 7% 7% 7% 7% 7% 9% 32 AVENUE NW % % 6% 16% 19% 1337 UNIVERSITY % 25% 1 17% 1 24 AVENUE NW 27% 25% OW RIVER 7% 7% 7% MEMORIAL DRIVE DRIVE 25% 5% 20% 7% 2 20% 5% 5% Scenario #: 51 Plotted by XQIN BOW TRAIL 33 ST SW 20% 16% KENSINGTO ROAD 18% 18% 1 1 5% 5%
94 % Project Title: R1523c1-W est Campus TIA Horizon: 2039 Target W est Campus Time of Day: AM Peak Hour Select Zone: TZ OB 5% Note: Values less than are suppressed for clarity. 5% 6% 10% 10% 10% 10% TRAIL 10% 10% 7% 6% 5% 5% 7% 7% N LAURIE 1 BL 10% AVENUE NW 9% SHAGANAPPI 1 10% UNIVERSITY 24 AVENUE NW DRIVE OW RIVER 10% 10% MEMORIAL DRIVE BOW TRAIL KENSINGTO ROAD 33 ST 9%9% 9% % 20% 555 5% % 7% 15% % 1 5% 20% 5% 20% 10% 2 5% 5% 5% 9% 1 6% % 9% 2 20% % 7% 8% 8% 5% 7% 1 16% 10% 7% 15% 8% 7% 7% 7% 7% 15% 7% 6% 7% 7% 6% Scenario #: 52 Plotted by XQIN 1 8% 5% 1 5% 10% 10% 16% SW 1 1 % 1
95 9% Project Title: R1523c1-W est Campus TIA Horizon: 2039 Target W est Campus Time of Day: PM Peak Hour Select Zone: TZ IB 10% 10% Note: Values less than are suppressed for clarity. 8% 8% 1 8% 8% 6% TRAIL 6% 8% 7% 6% 7% 7 N LAURIE 5% 1 5% 5% 5% BL 8% 10% 5% 5% 5% 5% 8% 10% 7% 8% 9% 1 8% 9% 10% 1 8% 9% 7% 2 5% SHAGANAPPI 5% 5% 1 6% 6% 6% 32 AVENUE NW 18% 792 6% 6% 5% 5% % 8% 5% 1 5% 7% 1 5% 10% 366 UNIVERSITY 264 DRIVE % % 9% AVENUE NW 18% 2 OW 5% 8% % 6% % 6% % 8% 5% 8% 15% 9% 9% RIVER 19% 18% 6% MEMORIAL DRIVE 18% Scenario #: 53 Plotted by XQIN BOW TRAIL 33 ST SW 5% 5% 9% 1 9% 9% 8% KENSINGTO ROAD 5% % 10% 6% 6%
96 Project Title: R1523c1-W est Campus TIA Horizon: 2039 Target W est Campus Time of Day: PM Peak Hour Select Zone: TZ OB 1 1 Note: Values less than are suppressed for clarity % 9% 1 1 TRAIL 9% 1 1 6% 1 10% N LAURIE % 15% BL 15% 15% 15% 1 8% 9% 5% 5% 5% 15% 7% 7% 7% 8% 9% 5% 9% 9% 9% 32 AVENUE NW 9% 7% 8% 1 15% 7% SHAGANAPPI UNIVERSITY DRIVE 24 AVENUE NW OW RIVER 5% 5% MEMORIAL DRIVE BOW TRAIL KENSINGTO ROAD 33 ST 8% 20% 8% 8% 9% 16% 7% 7% % 8% 17% % % 1 6% 1 6% % % 5% 8% 10% % 7% 7% 6% 8% 8% 1 9% 9% 9% 17% 6% 6% 18% 9% 17% 6% 5% 5% 5% 17% 5% 5% Scenario #: 54 Plotted by XQIN 5% 5% 5% 5% 5% 5% 15% % 15% SW 1 2
97 Civil, Municipal and Traffic Engineering Storm Water Management Legal Survey/Geomatics Transportation Planning APPENDIX E: PROPOSED CROSS SECTIONS West Campus Transportation Impact Assessment
98 Revised Sections Figures A1-2 to A1-21 In Reference to Transportation Comments Date of Issue: January 20, 2014 Appendices Prepared by: A1-1
99 C D D Key Plan for Sections C1 C1 A A B B G G B1 B1 C D1 legend D1 west campus gate west campus way (east of west campus drive) E E F F west campus way (west of west campus drive) west campus drive - east of the hospital west campus crescent - extension of west campus drive 24th avenue - east of west campus drive E1 E1 24th avenue - south of the hospital west campus Boulevard - north of west campus drive west campus Boulevard - south of west campus drive west campus drive - south of 24th avenue collegiate road nw. residential streets (18.4m north end; 16m south end) Dec. 11, 2013 STREET SECTIONS KEY PLAN Appendices A1-2

100 Section A-A : West Campus Gate Appendices A1-3
101 Section B-B (1): West Campus Way, East of West Campus Drive Off-Peak, On-street Parking Period - Two Vehicular Travel Lanes) Appendices A1-4
102 Plan B-B (1): West Campus Way, East of West Campus Drive Off-Peak, On-street Parking Period - Two Vehicular Travel Lanes) Appendices A1-5
 Appendices")
103 Section B-B (2): West Campus Way, East of West Campus Drive Peak Traffic Period - Four Vehicular Travel Lanes) Appendices A1-6
 Appendices A1-7")
104 Plan B-B (2): West Campus Way, East of West Campus Drive Peak Traffic Period - Four Vehicular Travel Lanes) Appendices A1-7

105 Section B1-B1 : West Campus Way, West of West Campus Drive Appendices A1-8

106 Plan B1-B1 : West Campus Way, West of West Campus Drive Appendices A1-9

107 Section C-C : West Campus Drive, East of the Hospital Appendices A1-10

108 Section C1-C1 : West Campus Crescent, West Portion of Crescent Appendices A1-11

109 Section D-D : 24th Avenue, East of West Campus Drive Appendices A1-12

110 Section D1-D1 : 24th Avenue, South of the Hospital Appendices A1-13

111 Section E-E : West Campus Boulevard NW - North of West Campus Drive Appendices A1-14

112 Plan E-E : West Campus Boulevard NW - North of West Campus Drive to be updated Appendices A1-15

113 Section E1-E1 : West Campus Boulevard NW - South of West Campus Drive Appendices A1-16

114 Section F-F : West Campus Drive - South of 24th Avenue Appendices A1-17

115 Section G-G : Collegiate Road NW Appendices A1-18
116 Residential Section: TYP. 18.4m R.O.W. Appendices A1-19
117 Residential Section: TYP. 16m R.O.W. Appendices A1-20


 Section")
118 Section TYP: 7.0m Laneway Section TYP: 6.1m Laneway (Residential) (Commercial) Section TYP: 10.0m Laneway (Residential) Appendices A1-21
119 legend lane residential street activity street collector primary collector arterial Dec. 11, 2013 road classification STREET HIERARCHY planplan Comment Number: 69 Appendices Date of Issue: January 20, 2014 Prepared by: A1-22
120 Civil, Municipal and Traffic Engineering Storm Water Management Legal Survey/Geomatics Transportation Planning APPENDIX F: EXISTING TRAFFIC COUNTS West Campus Transportation Impact Assessment
121 Location: S of the Intersection SHAGANAPPI TR NW & 32 AV NW Verified: Yes Study Date: Monday, Sep 12, 2011 To Friday, Sep 16, 2011 Comments: Direction: NORTH BOUND Count Date: Thursday, Sep 15, Hour Automatic Report Minutes START TIME TOTAL % TOTAL FLOW 00: : : : : : : : : : : : : : : : : : : : : : : : A.M. Peak Hour 11:15:00 AM - 12:15:00 PM Flow % P.M. Peak Hour 3:45:00 PM - 4:45:00 PM Flow % TOTAL 24 Hour Flow Hour Summary (7 AM to 7 PM) Flow Hour Summary (7 AM to 11 PM) Flow Hour Summary (7-9, 11-1, 4-6) Flow 5499
122 Direction: SOUTH BOUND Count Date: Thursday, Sep 15, Hour Automatic Report Minutes START TIME TOTAL % TOTAL FLOW 00: : : : : : : : : : : : : : : : : : : : : : : : A.M. Peak Hour 7:15:00 AM - 8:15:00 AM Flow % P.M. Peak Hour 2:15:00 PM - 3:15:00 PM Flow TOTAL 24 Hour Flow Hour Summary (7 AM to 7 PM) Flow Hour Summary (7 AM to 11 PM) Flow Hour Summary (7-9, 11-1, 4-6) Flow 5420
123 Direction: TOTAL Count Date: Thursday, Sep 15, Hour Automatic Report Minutes START TIME TOTAL % TOTAL FLOW 00: : : : : : : : : : : : : : : : : : : : : : : : A.M. Peak Hour 7:30:00 AM - 8:30:00 AM Flow P.M. Peak Hour 3:45:00 PM - 4:45:00 PM Flow % TOTAL 24 Hour Flow Hour Summary (7 AM to 7 PM) Flow Hour Summary (7 AM to 11 PM) Flow Hour Summary (7-9, 11-1, 4-6) Flow Daily Expansion Factor: 2.25
124 Location: E of the Intersection SHAGANAPPI TR NW and 32 AV NW Verified: Yes Study Date:Tuesday, Apr 9, 2013 To Wednesday, Apr 10, 2013 Comments: Direction: EAST BOUND Count Date: Wednesday, Apr 10, Hour Automatic Report Minutes START TIME TOTAL % TOTAL FLOW 00: : : : : : : : : : : : : : : : : : : : : : : : A.M. Peak Hour 7:45:00 AM - 8:45:00 AM Flow P.M. Peak Hour 4:00:00 PM - 5:00:00 PM Flow % TOTAL 24 Hour Flow Hour Summary (7 AM to 7 PM) Flow Hour Summary (7 AM to 11 PM) Flow Hour Summary (7-9, 11-1, 4-6) Flow 4110
125 Direction: WEST BOUND Count Date: Wednesday, Apr 10, Hour Automatic Report Minutes START TIME TOTAL % TOTAL FLOW 00: : : : : : : : : : : : : : : : : : : : : : : : A.M. Peak Hour 11:15:00 AM - 12:15:00 PM Flow P.M. Peak Hour 4:15:00 PM - 5:15:00 PM Flow % TOTAL 24 Hour Flow Hour Summary (7 AM to 7 PM) Flow Hour Summary (7 AM to 11 PM) Flow Hour Summary (7-9, 11-1, 4-6) Flow 3574
126 Direction: TOTAL Count Date: Wednesday, Apr 10, Hour Automatic Report Minutes START TIME TOTAL % TOTAL FLOW 00: : : : : : : : : : : : : : : : : : : : : : : : A.M. Peak Hour 7:45:00 AM - 8:45:00 AM Flow P.M. Peak Hour 4:00:00 PM - 5:00:00 PM Flow % TOTAL 24 Hour Flow Hour Summary (7 AM to 7 PM) Flow Hour Summary (7 AM to 11 PM) Flow Hour Summary (7-9, 11-1, 4-6) Flow 7684 Daily Expansion Factor: 2.2
127 Location: E of the Intersection 37 ST NW & 32 AV NW Verified: Yes Study Date: Monday, Sep 12, 2011 To Tuesday, Sep 13, 2011 Comments: Direction: EAST BOUND Count Date: Tuesday, Sep 13, Hour Automatic Report Minutes START TIME TOTAL % TOTAL FLOW 00: : : : : : : : : : : : : : : : : : : : : : : : A.M. Peak Hour 8:15:00 AM - 9:15:00 AM Flow P.M. Peak Hour 3:30:00 PM - 4:30:00 PM Flow % TOTAL 24 Hour Flow Hour Summary (7 AM to 7 PM) Flow Hour Summary (7 AM to 11 PM) Flow Hour Summary (7-9, 11-1, 4-6) Flow 3526
128 Direction: WEST BOUND Count Date: Tuesday, Sep 13, Hour Automatic Report Minutes START TIME TOTAL % TOTAL FLOW 00: : : : : : : : : : : : : : : : : : : : : : : : A.M. Peak Hour 8:30:00 AM - 9:30:00 AM Flow P.M. Peak Hour 4:30:00 PM - 5:30:00 PM Flow % TOTAL 24 Hour Flow Hour Summary (7 AM to 7 PM) Flow Hour Summary (7 AM to 11 PM) Flow Hour Summary (7-9, 11-1, 4-6) Flow 3095
129 Direction: TOTAL Count Date: Tuesday, Sep 13, Hour Automatic Report Minutes START TIME TOTAL % TOTAL FLOW 00: : : : : : : : : : : : : : : : : : : : : : : : A.M. Peak Hour 8:30:00 AM - 9:30:00 AM Flow P.M. Peak Hour 4:30:00 PM - 5:30:00 PM Flow TOTAL 24 Hour Flow Hour Summary (7 AM to 7 PM) Flow Hour Summary (7 AM to 11 PM) Flow Hour Summary (7-9, 11-1, 4-6) Flow 6621 Daily Expansion Factor: 2.29
130 Location: W of the Intersection 24 AV NW & UNIVERSITY DR NW Verified: Yes Study Date: Tuesday, Mar 25, 2003 Comments: Direction: EAST BOUND Count Date: Tuesday, Mar 25, Hour Automatic Report Minutes START TIME TOTAL % TOTAL FLOW 00: : : : : : : : : : : : : : : : : : : : : : : : A.M. Peak Hour 8:00:00 AM - 9:00:00 AM Flow P.M. Peak Hour 6:00:00 PM - 7:00:00 PM Flow % TOTAL 24 Hour Flow Hour Summary (7 AM to 7 PM) Flow Hour Summary (7 AM to 11 PM) Flow Hour Summary (7-9, 11-1, 4-6) Flow 2710
131 Direction: WEST BOUND Count Date: Tuesday, Mar 25, Hour Automatic Report Minutes START TIME TOTAL % TOTAL FLOW 00: : : : : : : : : : : : : : : : : : : : : : : : A.M. Peak Hour 11:15:00 AM - 12:15:00 PM Flow % P.M. Peak Hour 4:15:00 PM - 5:15:00 PM Flow TOTAL 24 Hour Flow Hour Summary (7 AM to 7 PM) Flow Hour Summary (7 AM to 11 PM) Flow Hour Summary (7-9, 11-1, 4-6) Flow 1747
132 Direction: WEST BOUND Count Date: Tuesday, Mar 25, Hour Automatic Report Minutes START TIME TOTAL % TOTAL FLOW 00: : : : : : : : : : : : : : : : : : : : : : : : A.M. Peak Hour 11:15:00 AM - 12:15:00 PM Flow % P.M. Peak Hour 4:15:00 PM - 5:15:00 PM Flow TOTAL 24 Hour Flow Hour Summary (7 AM to 7 PM) Flow Hour Summary (7 AM to 11 PM) Flow Hour Summary (7-9, 11-1, 4-6) Flow 1747
133 Location: N of the Intersection WEST CAMPUS BV NW & 16 AV NW Verified: Yes Study Date:Tuesday, Apr 9, 2013 To Wednesday, Apr 10, 2013 Comments: Direction: NORTH BOUND Count Date: Wednesday, Apr 10, Hour Automatic Report Minutes START TIME TOTAL % TOTAL FLOW 00: : : : : : : : : : : : : : : : : : : : : : : : A.M. Peak Hour 7:30:00 AM - 8:30:00 AM Flow P.M. Peak Hour 3:45:00 PM - 4:45:00 PM Flow % TOTAL 24 Hour Flow Hour Summary (7 AM to 7 PM) Flow Hour Summary (7 AM to 11 PM) Flow Hour Summary (7-9, 11-1, 4-6) Flow 1201
134 Direction: SOUTH BOUND Count Date: Wednesday, Apr 10, Hour Automatic Report Minutes START TIME TOTAL % TOTAL FLOW 00: : : : : : : : : : : : : : : : : : : : : : : : A.M. Peak Hour 7:15:00 AM - 8:15:00 AM Flow % P.M. Peak Hour 4:00:00 PM - 5:00:00 PM Flow % TOTAL 24 Hour Flow Hour Summary (7 AM to 7 PM) Flow Hour Summary (7 AM to 11 PM) Flow Hour Summary (7-9, 11-1, 4-6) Flow 1534
135 Direction: TOTAL Count Date: Wednesday, Apr 10, Hour Automatic Report Minutes START TIME TOTAL % TOTAL FLOW 00: : : : : : : : : : : : : : : : : : : : : : : : A.M. Peak Hour 7:30:00 AM - 8:30:00 AM Flow P.M. Peak Hour 4:00:00 PM - 5:00:00 PM Flow % TOTAL 24 Hour Flow Hour Summary (7 AM to 7 PM) Flow Hour Summary (7 AM to 11 PM) Flow Hour Summary (7-9, 11-1, 4-6) Flow 2735 Daily Expansion Factor: 2.07
136 Synchro Data Entry Format Location: Shaganappi Trail NW & 32 Avenue NW Shaganappi Trail NW & 32 Avenue NW Date : Observer(s) : Tuesday June 21, 2011 City of Calgary Job # : 2984.T01 Job Name: West Campus Transportation Management Plan & TDM AM Peak VOLUME WINDOW EBL EBT EBR WBL WBT WBR NBL NBT NBR SBL SBT SBR Traffic Volume (vph) Conflicting Peds (#/hr) Conflicting Bikes (#/hr) Peak Hour Factor Growth Factor Heavy Vehicles (%) Midday Peak VOLUME WINDOW EBL EBT EBR WBL WBT WBR NBL NBT NBR SBL SBT SBR Traffic Volume (vph) Conflicting Peds (#/hr) Conflicting Bikes (#/hr) Peak Hour Factor Growth Factor Heavy Vehicles (%) PM Peak VOLUME WINDOW EBL EBT EBR WBL WBT WBR NBL NBT NBR SBL SBT SBR Traffic Volume (vph) Conflicting Peds (#/hr) Conflicting Bikes (#/hr) Peak Hour Factor Growth Factor Heavy Vehicles (%)
137 Location : North Leg : Shaganappi Trail NW East Leg: 32 Avenue NW South Leg : Shaganappi Trail NW West Leg: 32 Avenue NW Date : Observer(s) : Job # : Job Name: Tuesday June 21, 2011 City of Calgary 2984.T01 West Campus Transportation Management Plan & TDM From the North On: Shaganappi Trail NW From the South On: Shaganappi Trail NW From the East On: 32 Avenue NW From the West On: 32 Avenue NW Time Starting Left Turn Straight Right Turn Total Total Left Turn Straight Right Turn Left Turn Straight Right Turn Left Turn Straight Right Turn Peds Peds Peds Peds Vehicles Cars Trucks Cars Trucks Cars Trucks Cars Trucks Cars Trucks Cars Trucks Cars Trucks Cars Trucks Cars Trucks Cars Trucks Cars Trucks Cars Trucks Cars Trucks Peds 07: : : : : : : : Hour Total Peak Hour: 7:30-8: Total Veh & % Trucks PHF 0.90 Peak Total = 1554 PHF 0.86 Peak Total = 330 PHF 0.95 Peak Total = 217 PHF 0.89 Peak Total = 790 From the North On: Shaganappi Trail NW From the South On: Shaganappi Trail NW From the East On: 32 Avenue NW From the West On: 32 Avenue NW Time Starting Left Turn Straight Right Turn Total Total Left Turn Straight Right Turn Left Turn Straight Right Turn Left Turn Straight Right Turn Peds Peds Peds Peds Vehicles Cars Trucks Cars Trucks Cars Trucks Cars Trucks Cars Trucks Cars Trucks Cars Trucks Cars Trucks Cars Trucks Cars Trucks Cars Trucks Cars Trucks Cars Trucks Peds 11: : : : : : : : Hour Total Peak Hour: 12:00-1: Total Veh & % Trucks PHF 1.06 Peak Total = 645 PHF 0.99 Peak Total = 736 PHF 0.73 Peak Total = 546 PHF 1.08 Peak Total = 694 From the North On: Shaganappi Trail NW From the South On: Shaganappi Trail NW From the East On: 32 Avenue NW From the West On: 32 Avenue NW Time Starting Left Turn Straight Right Turn Total Total Left Turn Straight Right Turn Left Turn Straight Right Turn Left Turn Straight Right Turn Peds Peds Peds Peds Vehicles Cars Trucks Cars Trucks Cars Trucks Cars Trucks Cars Trucks Cars Trucks Cars Trucks Cars Trucks Cars Trucks Cars Trucks Cars Trucks Cars Trucks Cars Trucks Peds 04: : : : : : : : Hour Total Peak Hour: 4:30-5: Total Veh & % Trucks PHF 0.97 Peak Total = 569 PHF 0.95 Peak Total = 1578 PHF 0.99 Peak Total = 835 PHF 0.91 Peak Total = Hour Total
138 BIKES Note: The City of Calgary does not count bicycles by North Leg : Shaganappi Trail NW East Leg : 32 Avenue NW movement, only by direction. All bicycles have South Leg : Shaganappi Trail NW West leg : 32 Avenue NW been allocated to the straight through movement. Date : Observer(s) : Job # : Job Name: Tuesday June 21, 2011 City of Calgary 2984.T01 West Campus Transportation Management Plan & TDM Time Starting From the North On: Shaganappi Trail NW From the South On: Shaganappi Trail NW From the East On: 32 Avenue NW From the West On: 32 Avenue NW Total Left Turn Straight Right Turn Left Turn Straight Right Turn Left Turn Straight Right Turn Left Turn Straight Right Turn Bikes 07: : : : : : : : Hour Total Peak Hour: 7:30-8: Time Starting From the North On: Shaganappi Trail NW From the South On: Shaganappi Trail NW From the East On: 32 Avenue NW From the West On: 32 Avenue NW Total Left Turn Straight Right Turn Left Turn Straight Right Turn Left Turn Straight Right Turn Left Turn Straight Right Turn Bikes 11: : : : : : : : Hour Total Peak Hour: 12:00-1: Time Starting From the North On: Shaganappi Trail NW From the South On: Shaganappi Trail NW From the East On: 32 Avenue NW From the West On: 32 Avenue NW Total Left Turn Straight Right Turn Left Turn Straight Right Turn Left Turn Straight Right Turn Left Turn Straight Right Turn Bikes 04: : : : : : : : Hour Total Peak Hour: 4:30-5: Hour Total
139 Synchro Data Entry Format Location: 39 Street NW & 32 Avenue NW 39 Street NW & 32 Avenue NW Date : Observer(s) : Wednesday November 8, 2006 City of Calgary Job # : 2984.T01 Job Name: West Campus Transportation Management Plan & TDM AM Peak VOLUME WINDOW EBL EBT EBR WBL WBT WBR NBL NBT NBR SBL SBT SBR Traffic Volume (vph) Conflicting Peds (#/hr) Conflicting Bikes (#/hr) Peak Hour Factor Growth Factor Heavy Vehicles (%) 6% 6% 6% 1 8% 1 Midday Peak VOLUME WINDOW EBL EBT EBR WBL WBT WBR NBL NBT NBR SBL SBT SBR Traffic Volume (vph) Conflicting Peds (#/hr) Conflicting Bikes (#/hr) Peak Hour Factor Growth Factor Heavy Vehicles (%) 5% 5% 0% 0% 0% PM Peak VOLUME WINDOW EBL EBT EBR WBL WBT WBR NBL NBT NBR SBL SBT SBR Traffic Volume (vph) Conflicting Peds (#/hr) Conflicting Bikes (#/hr) Peak Hour Factor Growth Factor Heavy Vehicles (%)
140 Location : North Leg : 39 Street NW East Leg: 32 Avenue NW South Leg : 39 Street NW West Leg: 32 Avenue NW Date : Observer(s) : Job # : Job Name: Wednesday November 8, 2006 City of Calgary 2984.T01 West Campus Transportation Management Plan & TDM From the North On: 39 Street NW From the South On: 39 Street NW From the East On: 32 Avenue NW From the West On: 32 Avenue NW Time Starting Left Turn Straight Right Turn Total Total Left Turn Straight Right Turn Left Turn Straight Right Turn Left Turn Straight Right Turn Peds Peds Peds Peds Vehicles Cars Trucks Cars Trucks Cars Trucks Cars Trucks Cars Trucks Cars Trucks Cars Trucks Cars Trucks Cars Trucks Cars Trucks Cars Trucks Cars Trucks Cars Trucks Peds 07: : : : : : : : Hour Total Peak Hour: 7:45-8: Total Veh & % Trucks % % 263 6% 12 6% PHF 0.77 Peak Total = 80 PHF 1.18 Peak Total = 123 PHF 0.99 Peak Total = 410 PHF 0.79 Peak Total = 1286 From the North On: 39 Street NW From the South On: 39 Street NW From the East On: 32 Avenue NW From the West On: 32 Avenue NW Time Starting Left Turn Straight Right Turn Total Total Left Turn Straight Right Turn Left Turn Straight Right Turn Left Turn Straight Right Turn Peds Peds Peds Peds Vehicles Cars Trucks Cars Trucks Cars Trucks Cars Trucks Cars Trucks Cars Trucks Cars Trucks Cars Trucks Cars Trucks Cars Trucks Cars Trucks Cars Trucks Cars Trucks Peds 11: : : : : : : : Hour Total Peak Hour: 12:00-1: Total Veh & % Trucks 10 0% 4 0% 18 0% 159 5% % PHF 0.80 Peak Total = 32 PHF 0.70 Peak Total = 225 PHF 0.81 Peak Total = 490 PHF 0.99 Peak Total = 529 From the North On: 39 Street NW From the South On: 39 Street NW From the East On: 32 Avenue NW From the West On: 32 Avenue NW Time Starting Left Turn Straight Right Turn Total Total Left Turn Straight Right Turn Left Turn Straight Right Turn Left Turn Straight Right Turn Peds Peds Peds Peds Vehicles Cars Trucks Cars Trucks Cars Trucks Cars Trucks Cars Trucks Cars Trucks Cars Trucks Cars Trucks Cars Trucks Cars Trucks Cars Trucks Cars Trucks Cars Trucks Peds 04: : : : : : : : Hour Total Peak Hour: 4:15-5: Total Veh & % Trucks PHF 0.86 Peak Total = 38 PHF 0.88 Peak Total = 614 PHF 0.86 Peak Total = 835 PHF 0.87 Peak Total = Hour Total
141 BIKES Note: The City of Calgary does not count bicycles by North Leg : 39 Street NW East Leg : 32 Avenue NW movement, only by direction. All bicycles have South Leg : 39 Street NW West leg : 32 Avenue NW been allocated to the straight through movement. Date : Observer(s) : Job # : Job Name: Wednesday November 8, 2006 City of Calgary 2984.T01 West Campus Transportation Management Plan & TDM Time Starting From the North On: 39 Street NW From the South On: 39 Street NW From the East On: 32 Avenue NW From the West On: 32 Avenue NW Total Left Turn Straight Right Turn Left Turn Straight Right Turn Left Turn Straight Right Turn Left Turn Straight Right Turn Bikes 07: : : : : : : : Hour Total Peak Hour: 7:45-8: Time Starting From the North On: 39 Street NW From the South On: 39 Street NW From the East On: 32 Avenue NW From the West On: 32 Avenue NW Total Left Turn Straight Right Turn Left Turn Straight Right Turn Left Turn Straight Right Turn Left Turn Straight Right Turn Bikes 11: : : : : : : : Hour Total Peak Hour: 12:00-1: Time Starting From the North On: 39 Street NW From the South On: 39 Street NW From the East On: 32 Avenue NW From the West On: 32 Avenue NW Total Left Turn Straight Right Turn Left Turn Straight Right Turn Left Turn Straight Right Turn Left Turn Straight Right Turn Bikes 04: : : : : : : : Hour Total Peak Hour: 4:15-5: Hour Total
142 Synchro Data Entry Format Location: & 32 Avenue NW Collegiate Blvd. NW & 32 Avenue NW Date : Wednesday September 10, 2008 Observer(s) : City of Calgary Job # : 2984.T01 Job Name: West Campus Transportation Management Plan & TIA AM Peak VOLUME WINDOW EBL EBT EBR WBL WBT WBR NBL NBT NBR SBL SBT SBR Traffic Volume (vph) Conflicting Peds (#/hr) Conflicting Bikes (#/hr) Peak Hour Factor Growth Factor Heavy Vehicles (%) 0% 5% 5% 0% 0% 0% 0% 0% Midday Peak VOLUME WINDOW EBL EBT EBR WBL WBT WBR NBL NBT NBR SBL SBT SBR Traffic Volume (vph) Conflicting Peds (#/hr) Conflicting Bikes (#/hr) Peak Hour Factor Growth Factor Heavy Vehicles (%) 0% 0% 0% 0% 0% 0% PM Peak VOLUME WINDOW EBL EBT EBR WBL WBT WBR NBL NBT NBR SBL SBT SBR Traffic Volume (vph) Conflicting Peds (#/hr) Conflicting Bikes (#/hr) Peak Hour Factor Growth Factor Heavy Vehicles (%) 0% 0% 0% 0% 0% 0% 0% 0%
143 Location : North Leg : East Leg: 32 Avenue NW South Leg : Collegiate Blvd. NW West Leg: 32 Avenue NW Date : Observer(s) : Job # : Job Name: Wednesday September 10, 2008 City of Calgary 2984.T01 West Campus Transportation Management Plan & TIA From the North On: From the South On: Collegiate Blvd. NW From the East On: 32 Avenue NW From the West On: 32 Avenue NW Time Starting Left Turn Straight Right Turn Total Total Left Turn Straight Right Turn Left Turn Straight Right Turn Left Turn Straight Right Turn Peds Peds Peds Peds Vehicles Cars Trucks Cars Trucks Cars Trucks Cars Trucks Cars Trucks Cars Trucks Cars Trucks Cars Trucks Cars Trucks Cars Trucks Cars Trucks Cars Trucks Cars Trucks Peds 07: : : : : : : : Hour Total Peak Hour: 8:00-9: Total Veh & % Trucks 0 0% 0 0% 0 0% % % 0 0% 522 5% 372 5% PHF 0.00 Peak Total = 0 PHF 0.82 Peak Total = 137 PHF 0.99 Peak Total = 943 PHF 0.98 Peak Total = 894 From the North On: From the South On: Collegiate Blvd. NW From the East On: 32 Avenue NW From the West On: 32 Avenue NW Time Starting Left Turn Straight Right Turn Total Total Left Turn Straight Right Turn Left Turn Straight Right Turn Left Turn Straight Right Turn Peds Peds Peds Peds Vehicles Cars Trucks Cars Trucks Cars Trucks Cars Trucks Cars Trucks Cars Trucks Cars Trucks Cars Trucks Cars Trucks Cars Trucks Cars Trucks Cars Trucks Cars Trucks Peds 11: : : : : : : : Hour Total Peak Hour: 12:00-1: Total Veh & % Trucks 0 0% 0 0% 0 0% % % 0 0% PHF 0.00 Peak Total = 0 PHF 0.85 Peak Total = 328 PHF 0.94 Peak Total = 550 PHF 1.14 Peak Total = 478 From the North On: From the South On: Collegiate Blvd. NW From the East On: 32 Avenue NW From the West On: 32 Avenue NW Time Starting Left Turn Straight Right Turn Total Total Left Turn Straight Right Turn Left Turn Straight Right Turn Left Turn Straight Right Turn Peds Peds Peds Peds Vehicles Cars Trucks Cars Trucks Cars Trucks Cars Trucks Cars Trucks Cars Trucks Cars Trucks Cars Trucks Cars Trucks Cars Trucks Cars Trucks Cars Trucks Cars Trucks Peds 04: : : : : : : : Hour Total Peak Hour: 4:30-5: Total Veh & % Trucks 0 0% 0 0% 0 0% 247 0% 0 0% 442 0% % 0 0% PHF 0.00 Peak Total = 0 PHF 0.84 Peak Total = 689 PHF 0.87 Peak Total = 584 PHF 0.91 Peak Total = Hour Total
144 BIKES Note: The City of Calgary does not count bicycles by North Leg : 0 East Leg : 32 Avenue NW movement, only by direction. All bicycles have South Leg : Collegiate Blvd. NW West leg : 32 Avenue NW been allocated to the straight through movement. Date : Observer(s) : Job # : Job Name: Wednesday September 10, 2008 City of Calgary 2984.T01 West Campus Transportation Management Plan & TIA Time Starting From the North On: 0 From the South On: Collegiate Blvd. NW From the East On: 32 Avenue NW From the West On: 32 Avenue NW Total Left Turn Straight Right Turn Left Turn Straight Right Turn Left Turn Straight Right Turn Left Turn Straight Right Turn Bikes 07: : : : : : : : Hour Total Peak Hour: 8:00-9: Time Starting From the North On: 0 From the South On: Collegiate Blvd. NW From the East On: 32 Avenue NW From the West On: 32 Avenue NW Total Left Turn Straight Right Turn Left Turn Straight Right Turn Left Turn Straight Right Turn Left Turn Straight Right Turn Bikes 11: : : : : : : : Hour Total Peak Hour: 12:00-1: Time Starting From the North On: 0 From the South On: Collegiate Blvd. NW From the East On: 32 Avenue NW From the West On: 32 Avenue NW Total Left Turn Straight Right Turn Left Turn Straight Right Turn Left Turn Straight Right Turn Left Turn Straight Right Turn Bikes 04: : : : : : : : Hour Total Peak Hour: 4:30-5: Hour Total
145 Synchro Data Entry Format Location: 39 Street NW & West Campus Way NW & West Campus Way NW Date : Observer(s) : Wednesday November 8, 2006 City of Calgary Job # : 2984.T01 Job Name: West Campus Transportation Management Plan & TIA AM Peak VOLUME WINDOW EBL EBT EBR WBL WBT WBR NBL NBT NBR SBL SBT SBR Traffic Volume (vph) Conflicting Peds (#/hr) Conflicting Bikes (#/hr) Peak Hour Factor Growth Factor Heavy Vehicles (%) 1 1 0% 0% 20% 10% 0% 0% 0% 0% Midday Peak VOLUME WINDOW EBL EBT EBR WBL WBT WBR NBL NBT NBR SBL SBT SBR Traffic Volume (vph) Conflicting Peds (#/hr) Conflicting Bikes (#/hr) Peak Hour Factor Growth Factor Heavy Vehicles (%) 9% 9% 0% 0% 1 1 0% 0% 0% 7% 0% 7% PM Peak VOLUME WINDOW EBL EBT EBR WBL WBT WBR NBL NBT NBR SBL SBT SBR Traffic Volume (vph) Conflicting Peds (#/hr) Conflicting Bikes (#/hr) Peak Hour Factor Growth Factor Heavy Vehicles (%) 0% 0% 6% 6% 0% 0% 0% 7% 0% 7%
146 Location : North Leg : 39 Street NW East Leg: West Campus Way NW South Leg : West Leg: West Campus Way NW Date : Observer(s) : Job # : Job Name: Wednesday November 8, 2006 City of Calgary 2984.T01 West Campus Transportation Management Plan & TIA From the North On: 39 Street NW From the South On: From the East On: West Campus Way NW From the West On: West Campus Way NW Time Starting Left Turn Straight Right Turn Total Total Left Turn Straight Right Turn Left Turn Straight Right Turn Left Turn Straight Right Turn Peds Peds Peds Peds Vehicles Cars Trucks Cars Trucks Cars Trucks Cars Trucks Cars Trucks Cars Trucks Cars Trucks Cars Trucks Cars Trucks Cars Trucks Cars Trucks Cars Trucks Cars Trucks Peds 07: : : : : : : : Hour Total Peak Hour: 7:30-8: Total Veh & % Trucks % % 0 0% 0 0% 0 0% 64 20% 2 10% % PHF 0.82 Peak Total = 714 PHF 0.00 Peak Total = 0 PHF 0.83 Peak Total = 66 PHF 0.90 Peak Total = 220 From the North On: 39 Street NW From the South On: From the East On: West Campus Way NW From the West On: West Campus Way NW Time Starting Left Turn Straight Right Turn Total Total Left Turn Straight Right Turn Left Turn Straight Right Turn Left Turn Straight Right Turn Peds Peds Peds Peds Vehicles Cars Trucks Cars Trucks Cars Trucks Cars Trucks Cars Trucks Cars Trucks Cars Trucks Cars Trucks Cars Trucks Cars Trucks Cars Trucks Cars Trucks Cars Trucks Peds 11: : : : : : : : Hour Total Peak Hour: 12:00-1: Total Veh & % Trucks 13 7% 0 0% 137 7% 0 0% 0 0% 0 0% 0 0% % 100 9% 0 0% PHF 0.96 Peak Total = 150 PHF 0.00 Peak Total = 0 PHF 0.62 Peak Total = 79 PHF 0.90 Peak Total = 280 From the North On: 39 Street NW From the South On: From the East On: West Campus Way NW From the West On: West Campus Way NW Time Starting Left Turn Straight Right Turn Total Total Left Turn Straight Right Turn Left Turn Straight Right Turn Left Turn Straight Right Turn Peds Peds Peds Peds Vehicles Cars Trucks Cars Trucks Cars Trucks Cars Trucks Cars Trucks Cars Trucks Cars Trucks Cars Trucks Cars Trucks Cars Trucks Cars Trucks Cars Trucks Cars Trucks Peds 04: : : : : : : : Hour Total Peak Hour: 4:00-5: Total Veh & % Trucks 30 7% 0 0% 110 7% 0 0% 0 0% 0 0% 0 0% 82 6% 105 6% % PHF 0.85 Peak Total = 140 PHF 0.00 Peak Total = 0 PHF 0.88 Peak Total = 187 PHF 0.88 Peak Total = Hour Total
147 BIKES Note: The City of Calgary does not count bicycles by North Leg : 39 Street NW East Leg : West Campus Way NW movement, only by direction. All bicycles have South Leg : 0 West leg : West Campus Way NW been allocated to the straight through movement. Date : Observer(s) : Job # : Job Name: Wednesday November 8, 2006 City of Calgary 2984.T01 West Campus Transportation Management Plan & TIA Time Starting From the North On: 39 Street NW From the South On: 0 From the East On: West Campus Way NW From the West On: West Campus Way NW Total Left Turn Straight Right Turn Left Turn Straight Right Turn Left Turn Straight Right Turn Left Turn Straight Right Turn Bikes 07: : : : : : : : Hour Total Peak Hour: 7:30-8: Time Starting From the North On: 39 Street NW From the South On: 0 From the East On: West Campus Way NW From the West On: West Campus Way NW Total Left Turn Straight Right Turn Left Turn Straight Right Turn Left Turn Straight Right Turn Left Turn Straight Right Turn Bikes 11: : : : : : : : Hour Total Peak Hour: 12:00-1: Time Starting From the North On: 39 Street NW From the South On: 0 From the East On: West Campus Way NW From the West On: West Campus Way NW Total Left Turn Straight Right Turn Left Turn Straight Right Turn Left Turn Straight Right Turn Left Turn Straight Right Turn Bikes 04: : : : : : : : Hour Total Peak Hour: 4:00-5: Hour Total
148 Synchro Data Entry Format Location: West Campus Drive NW & West Campus Way NW West Campus Drive NW & West Campus Way NW Date : Observer(s) : Wednesday November 8, 2006 City of Calgary Job # : 2984.T01 Job Name: West Campus Transportation Management Plan & TIA AM Peak VOLUME WINDOW EBL EBT EBR WBL WBT WBR NBL NBT NBR SBL SBT SBR Traffic Volume (vph) Conflicting Peds (#/hr) Conflicting Bikes (#/hr) Peak Hour Factor Growth Factor Heavy Vehicles (%) 0% 10% 9% 0% 0% 0% 1 0% 0% 0% Midday Peak VOLUME WINDOW EBL EBT EBR WBL WBT WBR NBL NBT NBR SBL SBT SBR Traffic Volume (vph) Conflicting Peds (#/hr) Conflicting Bikes (#/hr) Peak Hour Factor Growth Factor Heavy Vehicles (%) 0% 9% 9% 0% 9% 0% 8% 0% 0% 0% PM Peak VOLUME WINDOW EBL EBT EBR WBL WBT WBR NBL NBT NBR SBL SBT SBR Traffic Volume (vph) Conflicting Peds (#/hr) Conflicting Bikes (#/hr) Peak Hour Factor Growth Factor Heavy Vehicles (%) 0% 0% 0% 1 0% 0% 0% 0% 0% 0%
149 Location : North Leg : West Campus Drive NW East Leg: West Campus Way NW South Leg : West Campus Drive NW West Leg: West Campus Way NW Date : Observer(s) : Job # : Job Name: Wednesday November 8, 2006 City of Calgary 2984.T01 West Campus Transportation Management Plan & TIA From the North On: West Campus Drive NW From the South On: West Campus Drive NW From the East On: West Campus Way NW From the West On: West Campus Way NW Time Starting Left Turn Straight Right Turn Total Total Left Turn Straight Right Turn Left Turn Straight Right Turn Left Turn Straight Right Turn Peds Peds Peds Peds Vehicles Cars Trucks Cars Trucks Cars Trucks Cars Trucks Cars Trucks Cars Trucks Cars Trucks Cars Trucks Cars Trucks Cars Trucks Cars Trucks Cars Trucks Cars Trucks Peds 07: : : : : : : : Hour Total Peak Hour: 7:30-8: Total Veh & % Trucks 0 0% 0 0% 0 0% 0 0% 0 0% % 0 0% 31 10% 54 9% PHF 0.00 Peak Total = 0 PHF 0.87 Peak Total = 188 PHF 0.78 Peak Total = 737 PHF 0.82 Peak Total = 85 From the North On: West Campus Drive NW From the South On: West Campus Drive NW From the East On: West Campus Way NW From the West On: West Campus Way NW Time Starting Left Turn Straight Right Turn Total Total Left Turn Straight Right Turn Left Turn Straight Right Turn Left Turn Straight Right Turn Peds Peds Peds Peds Vehicles Cars Trucks Cars Trucks Cars Trucks Cars Trucks Cars Trucks Cars Trucks Cars Trucks Cars Trucks Cars Trucks Cars Trucks Cars Trucks Cars Trucks Cars Trucks Peds 11: : : : : : : : Hour Total Peak Hour: 12:00-1: Total Veh & % Trucks 0 0% 0 0% 0 0% 6 9% 0 0% 266 8% 183 9% 1 9% 0 0% 0 0% PHF 0.00 Peak Total = 0 PHF 0.89 Peak Total = 272 PHF 0.98 Peak Total = 184 PHF 0.55 Peak Total = 35 From the North On: West Campus Drive NW From the South On: West Campus Drive NW From the East On: West Campus Way NW From the West On: West Campus Way NW Time Starting Left Turn Straight Right Turn Total Total Left Turn Straight Right Turn Left Turn Straight Right Turn Left Turn Straight Right Turn Peds Peds Peds Peds Vehicles Cars Trucks Cars Trucks Cars Trucks Cars Trucks Cars Trucks Cars Trucks Cars Trucks Cars Trucks Cars Trucks Cars Trucks Cars Trucks Cars Trucks Cars Trucks Peds 04: : : : : : : : Hour Total Peak Hour: 4:00-5: Total Veh & % Trucks 0 0% 0 0% 0 0% 8 0 0% % 0 0% 0 0% 31 0% 14 0% PHF 0.00 Peak Total = 0 PHF 0.89 Peak Total = 596 PHF 0.88 Peak Total = 189 PHF 0.80 Peak Total = 45 6 Hour Total
150 BIKES Note: The City of Calgary does not count bicycles by North Leg : West Campus Drive NW East Leg : West Campus Way NW movement, only by direction. All bicycles have South Leg : West Campus Drive NW West leg : West Campus Way NW been allocated to the straight through movement. Date : Observer(s) : Job # : Job Name: Wednesday November 8, 2006 City of Calgary 2984.T01 West Campus Transportation Management Plan & TIA Time Starting From the North On: West Campus Drive NW From the South On: West Campus Drive NW From the East On: West Campus Way NW From the West On: West Campus Way NW Total Left Turn Straight Right Turn Left Turn Straight Right Turn Left Turn Straight Right Turn Left Turn Straight Right Turn Bikes 07: : : : : : : : Hour Total Peak Hour: 7:30-8: Time Starting From the North On: West Campus Drive NW From the South On: West Campus Drive NW From the East On: West Campus Way NW From the West On: West Campus Way NW Total Left Turn Straight Right Turn Left Turn Straight Right Turn Left Turn Straight Right Turn Left Turn Straight Right Turn Bikes 11: : : : : : : : Hour Total Peak Hour: 12:00-1: Time Starting From the North On: West Campus Drive NW From the South On: West Campus Drive NW From the East On: West Campus Way NW From the West On: West Campus Way NW Total Left Turn Straight Right Turn Left Turn Straight Right Turn Left Turn Straight Right Turn Left Turn Straight Right Turn Bikes 04: : : : : : : : Hour Total Peak Hour: 4:00-5: Hour Total
151 Synchro Data Entry Format Location: West Campus Drive & Collegiate Road NW West Campus Drive & Oki Drive NW Date : Observer(s) : Wednesday August 15, 2007 City of Calgary Job # : 2984.T01 Job Name: West Campus Transportation Management Plan & TIA AM Peak VOLUME WINDOW EBL EBT EBR WBL WBT WBR NBL NBT NBR SBL SBT SBR Traffic Volume (vph) Conflicting Peds (#/hr) Conflicting Bikes (#/hr) Peak Hour Factor Growth Factor Heavy Vehicles (%) 5% 1 17% 17% 16% 9% 9% 9% 7% 7% 7% Midday Peak VOLUME WINDOW EBL EBT EBR WBL WBT WBR NBL NBT NBR SBL SBT SBR Traffic Volume (vph) Conflicting Peds (#/hr) Conflicting Bikes (#/hr) Peak Hour Factor Growth Factor Heavy Vehicles (%) 16% 1 17% 1 10% 10% PM Peak VOLUME WINDOW EBL EBT EBR WBL WBT WBR NBL NBT NBR SBL SBT SBR Traffic Volume (vph) Conflicting Peds (#/hr) Conflicting Bikes (#/hr) Peak Hour Factor Growth Factor Heavy Vehicles (%) 0% 0% 0% 7% 7% 7% 1 1 1
152 Location : North Leg : West Campus Drive East Leg: Collegiate Road NW South Leg : West Campus Drive West Leg: Oki Drive NW Date : Observer(s) : Job # : Job Name: Wednesday August 15, 2007 City of Calgary 2984.T01 West Campus Transportation Management Plan & TIA From the North On: West Campus Drive From the South On: West Campus Drive From the East On: Collegiate Road NW From the West On: Oki Drive NW Time Starting Left Turn Straight Right Turn Total Total Left Turn Straight Right Turn Left Turn Straight Right Turn Left Turn Straight Right Turn Peds Peds Peds Peds Vehicles Cars Trucks Cars Trucks Cars Trucks Cars Trucks Cars Trucks Cars Trucks Cars Trucks Cars Trucks Cars Trucks Cars Trucks Cars Trucks Cars Trucks Cars Trucks Peds 07: : : : : : : : Hour Total Peak Hour: 7:45-8: Total Veh & % Trucks 57 7% 307 7% 59 7% 77 9% 160 9% 16 9% 20 17% 3 17% 19 16% 20 5% PHF 0.76 Peak Total = 423 PHF 1.11 Peak Total = 253 PHF 1.05 Peak Total = 42 PHF 0.80 Peak Total = 61 From the North On: West Campus Drive From the South On: West Campus Drive From the East On: Collegiate Road NW From the West On: Oki Drive NW Time Starting Left Turn Straight Right Turn Total Total Left Turn Straight Right Turn Left Turn Straight Right Turn Left Turn Straight Right Turn Peds Peds Peds Peds Vehicles Cars Trucks Cars Trucks Cars Trucks Cars Trucks Cars Trucks Cars Trucks Cars Trucks Cars Trucks Cars Trucks Cars Trucks Cars Trucks Cars Trucks Cars Trucks Peds 11: : : : : : : : Hour Total Peak Hour: 12:00-1: Total Veh & % Trucks % 18 10% 27 16% % PHF 0.98 Peak Total = 203 PHF 1.05 Peak Total = 223 PHF 0.69 Peak Total = 66 PHF 0.87 Peak Total = 132 From the North On: West Campus Drive From the South On: West Campus Drive From the East On: Collegiate Road NW From the West On: Oki Drive NW Time Starting Left Turn Straight Right Turn Total Total Left Turn Straight Right Turn Left Turn Straight Right Turn Left Turn Straight Right Turn Peds Peds Peds Peds Vehicles Cars Trucks Cars Trucks Cars Trucks Cars Trucks Cars Trucks Cars Trucks Cars Trucks Cars Trucks Cars Trucks Cars Trucks Cars Trucks Cars Trucks Cars Trucks Peds 04: : : : : : : : Hour Total Peak Hour: 4:00-5: Total Veh & % Trucks % 274 7% 4 7% 28 0% 0 0% 32 0% PHF 0.86 Peak Total = 258 PHF 0.88 Peak Total = 318 PHF 0.79 Peak Total = 60 PHF 0.73 Peak Total = Hour Total
153 BIKES Note: The City of Calgary does not count bicycles by North Leg : West Campus Drive East Leg : Collegiate Road NW movement, only by direction. All bicycles have South Leg : West Campus Drive West leg : Oki Drive NW been allocated to the straight through movement. Date : Observer(s) : Job # : Job Name: Wednesday August 15, 2007 City of Calgary 2984.T01 West Campus Transportation Management Plan & TIA Time Starting From the North On: West Campus Drive From the South On: West Campus Drive From the East On: Collegiate Road NW From the West On: Oki Drive NW Total Left Turn Straight Right Turn Left Turn Straight Right Turn Left Turn Straight Right Turn Left Turn Straight Right Turn Bikes 07: : : : : : : : Hour Total Peak Hour: 7:45-8: Time Starting From the North On: West Campus Drive From the South On: West Campus Drive From the East On: Collegiate Road NW From the West On: Oki Drive NW Total Left Turn Straight Right Turn Left Turn Straight Right Turn Left Turn Straight Right Turn Left Turn Straight Right Turn Bikes 11: : : : : : : : Hour Total Peak Hour: 12:00-1: Time Starting From the North On: West Campus Drive From the South On: West Campus Drive From the East On: Collegiate Road NW From the West On: Oki Drive NW Total Left Turn Straight Right Turn Left Turn Straight Right Turn Left Turn Straight Right Turn Left Turn Straight Right Turn Bikes 04: : : : : : : : Hour Total Peak Hour: 4:00-5: Hour Total
154 Synchro Data Entry Format Location: West Campus Drive NW & 24 Avenue NW West Campus Drive NW & 24 Avenue NW Date : Observer(s) : Wednesday November 8, 2006 City of Calgary Job # : 2984.T01 Job Name: West Campus Transportation Management Plan & TIA AM Peak VOLUME WINDOW EBL EBT EBR WBL WBT WBR NBL NBT NBR SBL SBT SBR Traffic Volume (vph) Conflicting Peds (#/hr) Conflicting Bikes (#/hr) Peak Hour Factor Growth Factor Heavy Vehicles (%) % 9% 9% 0% 0% 0% 8% 7% 8% Midday Peak VOLUME WINDOW EBL EBT EBR WBL WBT WBR NBL NBT NBR SBL SBT SBR Traffic Volume (vph) Conflicting Peds (#/hr) Conflicting Bikes (#/hr) Peak Hour Factor Growth Factor Heavy Vehicles (%) 8% 7% 10% 10% 10% 0% 7% 27% PM Peak VOLUME WINDOW EBL EBT EBR WBL WBT WBR NBL NBT NBR SBL SBT SBR Traffic Volume (vph) Conflicting Peds (#/hr) Conflicting Bikes (#/hr) Peak Hour Factor Growth Factor Heavy Vehicles (%) 5% 5% 5% 10% 7% 8% 0% 8% 46% 7% 6% 7%
155 Location : North Leg : West Campus Drive NW East Leg: 24 Avenue NW South Leg : West Campus Drive NW West Leg: 24 Avenue NW Date : Observer(s) : Job # : Job Name: Wednesday November 8, 2006 City of Calgary 2984.T01 West Campus Transportation Management Plan & TIA From the North On: West Campus Drive NW From the South On: West Campus Drive NW From the East On: 24 Avenue NW From the West On: 24 Avenue NW Time Starting Left Turn Straight Right Turn Total Total Left Turn Straight Right Turn Left Turn Straight Right Turn Left Turn Straight Right Turn Peds Peds Peds Peds Vehicles Cars Trucks Cars Trucks Cars Trucks Cars Trucks Cars Trucks Cars Trucks Cars Trucks Cars Trucks Cars Trucks Cars Trucks Cars Trucks Cars Trucks Cars Trucks Peds 07: : : : : : : : Hour Total Peak Hour: 7:45-8: Total Veh & % Trucks 392 8% 5 7% 142 8% 0 0% 0 0% 4 0% 3 9% 97 9% 221 9% PHF 0.78 Peak Total = 539 PHF 1.00 Peak Total = 4 PHF 0.84 Peak Total = 321 PHF 0.94 Peak Total = 94 From the North On: West Campus Drive NW From the South On: West Campus Drive NW From the East On: 24 Avenue NW From the West On: 24 Avenue NW Time Starting Left Turn Straight Right Turn Total Total Left Turn Straight Right Turn Left Turn Straight Right Turn Left Turn Straight Right Turn Peds Peds Peds Peds Vehicles Cars Trucks Cars Trucks Cars Trucks Cars Trucks Cars Trucks Cars Trucks Cars Trucks Cars Trucks Cars Trucks Cars Trucks Cars Trucks Cars Trucks Cars Trucks Peds 11: : : : : : : : Hour Total Peak Hour: 12:00-1: Total Veh & % Trucks % 2 7% 7 27% 7 10% 39 10% % 91 8% 34 7% 1 PHF 0.79 Peak Total = 267 PHF 0.32 Peak Total = 9 PHF 0.94 Peak Total = 221 PHF 0.98 Peak Total = 126 From the North On: West Campus Drive NW From the South On: West Campus Drive NW From the East On: 24 Avenue NW From the West On: 24 Avenue NW Time Starting Left Turn Straight Right Turn Total Total Left Turn Straight Right Turn Left Turn Straight Right Turn Left Turn Straight Right Turn Peds Peds Peds Peds Vehicles Cars Trucks Cars Trucks Cars Trucks Cars Trucks Cars Trucks Cars Trucks Cars Trucks Cars Trucks Cars Trucks Cars Trucks Cars Trucks Cars Trucks Cars Trucks Peds 04: : : : : : : : Hour Total Peak Hour: 4:00-5: Total Veh & % Trucks 267 7% 5 6% 85 7% 0 0% 3 8% 6 46% 2 10% 33 7% 292 8% 101 5% 87 5% 3 5% PHF 0.88 Peak Total = 357 PHF 0.56 Peak Total = 9 PHF 0.89 Peak Total = 327 PHF 0.75 Peak Total = Hour Total
156 BIKES Note: The City of Calgary does not count bicycles by North Leg : West Campus Drive NW East Leg : 24 Avenue NW movement, only by direction. All bicycles have South Leg : West Campus Drive NW West leg : 24 Avenue NW been allocated to the straight through movement. Date : Observer(s) : Job # : Job Name: Wednesday November 8, 2006 City of Calgary 2984.T01 West Campus Transportation Management Plan & TIA Time Starting From the North On: West Campus Drive NW From the South On: West Campus Drive NW From the East On: 24 Avenue NW From the West On: 24 Avenue NW Total Left Turn Straight Right Turn Left Turn Straight Right Turn Left Turn Straight Right Turn Left Turn Straight Right Turn Bikes 07: : : : : : : : Hour Total Peak Hour: 7:45-8: Time Starting From the North On: West Campus Drive NW From the South On: West Campus Drive NW From the East On: 24 Avenue NW From the West On: 24 Avenue NW Total Left Turn Straight Right Turn Left Turn Straight Right Turn Left Turn Straight Right Turn Left Turn Straight Right Turn Bikes 11: : : : : : : : Hour Total Peak Hour: 12:00-1: Time Starting From the North On: West Campus Drive NW From the South On: West Campus Drive NW From the East On: 24 Avenue NW From the West On: 24 Avenue NW Total Left Turn Straight Right Turn Left Turn Straight Right Turn Left Turn Straight Right Turn Left Turn Straight Right Turn Bikes 04: : : : : : : : Hour Total Peak Hour: 4:00-5: Hour Total
157 Synchro Data Entry Format Location: West Campus Blvd. NW & 24 Avenue NW & 24 Avenue NW Date : Observer(s) : Wednesday November 8, 2006 City of Calgary Job # : 2984.T01 Job Name: West Campus Transportation Management Plan & TIA AM Peak VOLUME WINDOW EBL EBT EBR WBL WBT WBR NBL NBT NBR SBL SBT SBR Traffic Volume (vph) Conflicting Peds (#/hr) Conflicting Bikes (#/hr) Peak Hour Factor Growth Factor Heavy Vehicles (%) 0% 0% 15% 2 25% 0% 6% 0% 7% 0% 0% 0% Midday Peak VOLUME WINDOW EBL EBT EBR WBL WBT WBR NBL NBT NBR SBL SBT SBR Traffic Volume (vph) Conflicting Peds (#/hr) Conflicting Bikes (#/hr) Peak Hour Factor Growth Factor Heavy Vehicles (%) 0% 0% % 0% 8% 0% 10% 0% 0% 0% PM Peak VOLUME WINDOW EBL EBT EBR WBL WBT WBR NBL NBT NBR SBL SBT SBR Traffic Volume (vph) Conflicting Peds (#/hr) Conflicting Bikes (#/hr) Peak Hour Factor Growth Factor Heavy Vehicles (%) 0% 0% 1 1 0% 8% 0% 10% 0% 0% 0%
158 Location : North Leg : West Campus Blvd. NW East Leg: 24 Avenue NW South Leg : West Leg: 24 Avenue NW Date : Observer(s) : Job # : Job Name: Wednesday November 8, 2006 City of Calgary 2984.T01 West Campus Transportation Management Plan & TIA From the North On: West Campus Blvd. NW From the South On: From the East On: 24 Avenue NW From the West On: 24 Avenue NW Time Starting Left Turn Straight Right Turn Total Total Left Turn Straight Right Turn Left Turn Straight Right Turn Left Turn Straight Right Turn Peds Peds Peds Peds Vehicles Cars Trucks Cars Trucks Cars Trucks Cars Trucks Cars Trucks Cars Trucks Cars Trucks Cars Trucks Cars Trucks Cars Trucks Cars Trucks Cars Trucks Cars Trucks Peds 07: : : : : : : : Hour Total Peak Hour: 8:00-9: Total Veh & % Trucks 0 0% 0 0% 0 0% 38 6% 0 0% 144 7% % 0 0% 0 0% 0 0% 13 15% PHF 0.00 Peak Total = 0 PHF 1.06 Peak Total = 182 PHF 0.80 Peak Total = 103 PHF 0.54 Peak Total = 13 From the North On: West Campus Blvd. NW From the South On: From the East On: 24 Avenue NW From the West On: 24 Avenue NW Time Starting Left Turn Straight Right Turn Total Total Left Turn Straight Right Turn Left Turn Straight Right Turn Left Turn Straight Right Turn Peds Peds Peds Peds Vehicles Cars Trucks Cars Trucks Cars Trucks Cars Trucks Cars Trucks Cars Trucks Cars Trucks Cars Trucks Cars Trucks Cars Trucks Cars Trucks Cars Trucks Cars Trucks Peds 11: : : : : : : : Hour Total Peak Hour: 12:00-1: Total Veh & % Trucks 0 0% 0 0% 0 0% 16 8% 0 0% 79 10% % 0 0% 0 0% 0 0% 24 2 PHF 0.00 Peak Total = 0 PHF 0.99 Peak Total = 95 PHF 0.77 Peak Total = 105 PHF 0.75 Peak Total = 24 From the North On: West Campus Blvd. NW From the South On: From the East On: 24 Avenue NW From the West On: 24 Avenue NW Time Starting Left Turn Straight Right Turn Total Total Left Turn Straight Right Turn Left Turn Straight Right Turn Left Turn Straight Right Turn Peds Peds Peds Peds Vehicles Cars Trucks Cars Trucks Cars Trucks Cars Trucks Cars Trucks Cars Trucks Cars Trucks Cars Trucks Cars Trucks Cars Trucks Cars Trucks Cars Trucks Cars Trucks Peds 04: : : : : : : : Hour Total Peak Hour: 4:00-5: Total Veh & % Trucks 0 0% 0 0% 0 0% 10 8% 0 0% 70 10% % 0 0% 0 0% 52 PHF 0.00 Peak Total = 0 PHF 0.80 Peak Total = 80 PHF 0.83 Peak Total = 149 PHF 0.65 Peak Total = 52 6 Hour Total
159 BIKES Note: The City of Calgary does not count bicycles by North Leg : West Campus Blvd. NW East Leg : 24 Avenue NW movement, only by direction. All bicycles have South Leg : 0 West leg : 24 Avenue NW been allocated to the straight through movement. Date : Observer(s) : Job # : Job Name: Wednesday November 8, 2006 City of Calgary 2984.T01 West Campus Transportation Management Plan & TIA Time Starting From the North On: West Campus Blvd. NW From the South On: 0 From the East On: 24 Avenue NW From the West On: 24 Avenue NW Total Left Turn Straight Right Turn Left Turn Straight Right Turn Left Turn Straight Right Turn Left Turn Straight Right Turn Bikes 07: : : : : : : : Hour Total Peak Hour: 8:00-9: Time Starting From the North On: West Campus Blvd. NW From the South On: 0 From the East On: 24 Avenue NW From the West On: 24 Avenue NW Total Left Turn Straight Right Turn Left Turn Straight Right Turn Left Turn Straight Right Turn Left Turn Straight Right Turn Bikes 11: : : : : : : : Hour Total Peak Hour: 12:00-1: Time Starting From the North On: West Campus Blvd. NW From the South On: 0 From the East On: 24 Avenue NW From the West On: 24 Avenue NW Total Left Turn Straight Right Turn Left Turn Straight Right Turn Left Turn Straight Right Turn Left Turn Straight Right Turn Bikes 04: : : : : : : : Hour Total Peak Hour: 4:00-5: Hour Total
160 Synchro Data Entry Format Location: West Campus Blvd. NW & 16 Avenue NW Date : Observer(s) : Wednesday November 8, 2006 City of Calgary Job # : 2818.T01 Job Name: Stadium Centre Traffic Engineering AM Peak VOLUME WINDOW EBL EBT EBR WBL WBT WBR NBL NBT NBR SBL SBT SBR Traffic Volume (vph) Conflicting Peds (#/hr) Conflicting Bikes (#/hr) Peak Hour Factor Growth Factor Heavy Vehicles (%) 0% 0% 0% 1 0% 1 0% 6% 8% 26% 2 0% PM Peak VOLUME WINDOW EBL EBT EBR WBL WBT WBR NBL NBT NBR SBL SBT SBR Traffic Volume (vph) Conflicting Peds (#/hr) Conflicting Bikes (#/hr) Peak Hour Factor Growth Factor Heavy Vehicles (%) 0% 0% 0% 1 0% 1 0% 9% 9% 0%
161 Location : North Leg : West Campus Blvd. NW East Leg: 16 Avenue NW South Leg : West Campus Blvd. NW West Leg 16 Avenue NW Date : Observer(s) : Job # : Job Name: Wednesday November 8, 2006 City of Calgary 2818.T01 Stadium Centre Traffic Engineering Time Starting From the North On: West Campus Blvd. NW From the South On: West Campus Blvd. NW From the East On: 16 Avenue NW From the West On: 16 Avenue NW Total Total Left Turn Straight Right Turn Left Turn Straight Right Turn Left Turn Straight Right Turn Left Turn Straight Right Turn Peds Peds Peds Peds Vehicles Cars Trucks Cars Trucks Cars Trucks Cars Trucks Cars Trucks Cars Trucks Cars Trucks Cars Trucks Cars Trucks Cars Trucks Cars Trucks Cars Trucks Cars Trucks Peds 07: : : : : : : : Hour Total Peak Hour: 8:00-9: Total Veh & % Trucks 13 26% % 0 0% 110 6% 11 8% % % 0 0% 0 0% Time Starting From the North On: West Campus Blvd. NW From the South On: West Campus Blvd. NW From the East On: 16 Avenue NW From the West On: 16 Avenue NW Total Total Left Turn Straight Right Turn Left Turn Straight Right Turn Left Turn Straight Right Turn Left Turn Straight Right Turn Peds Peds Peds Peds Vehicles Cars Trucks Cars Trucks Cars Trucks Cars Trucks Cars Trucks Cars Trucks Cars Trucks Cars Trucks Cars Trucks Cars Trucks Cars Trucks Cars Trucks Cars Trucks Peds 11: : : : : : : : Hour Total Peak Hour: 12:00-1: Total Veh & % Trucks 27 15% 78 15% 0 0% 0 0% 38 15% 29 18% 28 8% 0 0% 57 10% 0 0% 0 0% 0 0% Time Starting From the North On: West Campus Blvd. NW From the South On: West Campus Blvd. NW From the East On: 16 Avenue NW From the West On: 16 Avenue NW Total Total Left Turn Straight Right Turn Left Turn Straight Right Turn Left Turn Straight Right Turn Left Turn Straight Right Turn Peds Peds Peds Peds Vehicles Cars Trucks Cars Trucks Cars Trucks Cars Trucks Cars Trucks Cars Trucks Cars Trucks Cars Trucks Cars Trucks Cars Trucks Cars Trucks Cars Trucks Cars Trucks Peds 04: : : : : : : : Hour Total Peak Hour: 4:00-5: Total Veh & % Trucks 78 9% 107 9% 0 0% 0 0% % % 0 0% 0 0%
162 Synchro Data Entry Format Location: TCH Ramps & Hospital Drive NW Hospital Drive & West Campus Blvd. NW Date : Observer(s) : Wednesday August 10, 2011 City of Calgary Job # : 2984.T01 Job Name: West Campus Transportation Management Plan & TIA AM Peak VOLUME WINDOW EBL EBT EBR WBL WBT WBR NBL NBT NBR SBL SBT SBR Traffic Volume (vph) Conflicting Peds (#/hr) Conflicting Bikes (#/hr) Peak Hour Factor Growth Factor Heavy Vehicles (%) 7% 6% 6% 1 10% 0% 0% 0% Midday Peak VOLUME WINDOW EBL EBT EBR WBL WBT WBR NBL NBT NBR SBL SBT SBR Traffic Volume (vph) Conflicting Peds (#/hr) Conflicting Bikes (#/hr) Peak Hour Factor Growth Factor Heavy Vehicles (%) 7% 7% 7% 7% 7% 7% 8% 9% 1 PM Peak VOLUME WINDOW EBL EBT EBR WBL WBT WBR NBL NBT NBR SBL SBT SBR Traffic Volume (vph) Conflicting Peds (#/hr) Conflicting Bikes (#/hr) Peak Hour Factor Growth Factor Heavy Vehicles (%) 0% 0% 0% 0% 0% 0%
163 Location : North Leg : TCH Ramps East Leg: Hospital Drive NW South Leg : Hospital Drive West Leg: West Campus Blvd. NW Date : Observer(s) : Job # : Job Name: Wednesday August 10, 2011 City of Calgary 2984.T01 West Campus Transportation Management Plan & TIA From the North On: TCH Ramps From the South On: Hospital Drive From the East On: Hospital Drive NW From the West On: West Campus Blvd. NW Time Starting Left Turn Straight Right Turn Total Total Left Turn Straight Right Turn Left Turn Straight Right Turn Left Turn Straight Right Turn Peds Peds Peds Peds Vehicles Cars Trucks Cars Trucks Cars Trucks Cars Trucks Cars Trucks Cars Trucks Cars Trucks Cars Trucks Cars Trucks Cars Trucks Cars Trucks Cars Trucks Cars Trucks Peds 07: : : : : : : : Hour Total Peak Hour: 7:30-8: Total Veh & % Trucks 216 0% 71 0% 143 0% % % 102 6% 70 6% PHF 0.77 Peak Total = 430 PHF 0.62 Peak Total = 57 PHF 0.87 Peak Total = 73 PHF 0.83 Peak Total = 213 From the North On: TCH Ramps From the South On: Hospital Drive From the East On: Hospital Drive NW From the West On: West Campus Blvd. NW Time Starting Left Turn Straight Right Turn Total Total Left Turn Straight Right Turn Left Turn Straight Right Turn Left Turn Straight Right Turn Peds Peds Peds Peds Vehicles Cars Trucks Cars Trucks Cars Trucks Cars Trucks Cars Trucks Cars Trucks Cars Trucks Cars Trucks Cars Trucks Cars Trucks Cars Trucks Cars Trucks Cars Trucks Peds 11: : : : : : : : Hour Total Peak Hour: 11:30-12: Total Veh & % Trucks % 34 9% % 72 7% 34 7% 37 7% 30 7% 30 7% PHF 1.01 Peak Total = 105 PHF 0.85 Peak Total = 78 PHF 0.94 Peak Total = 128 PHF 0.90 Peak Total = 97 From the North On: TCH Ramps From the South On: Hospital Drive From the East On: Hospital Drive NW From the West On: West Campus Blvd. NW Time Starting Left Turn Straight Right Turn Total Total Left Turn Straight Right Turn Left Turn Straight Right Turn Left Turn Straight Right Turn Peds Peds Peds Peds Vehicles Cars Trucks Cars Trucks Cars Trucks Cars Trucks Cars Trucks Cars Trucks Cars Trucks Cars Trucks Cars Trucks Cars Trucks Cars Trucks Cars Trucks Cars Trucks Peds 04: : : : : : : : Hour Total Peak Hour: 4:00-5: Total Veh & % Trucks % 16 0% 8 0% 10 0% 381 0% 43 0% PHF 0.85 Peak Total = 88 PHF 0.74 Peak Total = 121 PHF 0.76 Peak Total = 434 PHF 0.84 Peak Total = Hour Total
164 BIKES Note: The City of Calgary does not count bicycles by North Leg : TCH Ramps East Leg : Hospital Drive NW movement, only by direction. All bicycles have South Leg : Hospital Drive West leg : West Campus Blvd. NW been allocated to the straight through movement. Date : Observer(s) : Job # : Job Name: Wednesday August 10, 2011 City of Calgary 2984.T01 West Campus Transportation Management Plan & TIA Time Starting From the North On: TCH Ramps From the South On: Hospital Drive From the East On: Hospital Drive NW From the West On: West Campus Blvd. NW Total Left Turn Straight Right Turn Left Turn Straight Right Turn Left Turn Straight Right Turn Left Turn Straight Right Turn Bikes 07: : : : : : : : Hour Total Peak Hour: 7:30-8: Time Starting From the North On: TCH Ramps From the South On: Hospital Drive From the East On: Hospital Drive NW From the West On: West Campus Blvd. NW Total Left Turn Straight Right Turn Left Turn Straight Right Turn Left Turn Straight Right Turn Left Turn Straight Right Turn Bikes 11: : : : : : : : Hour Total Peak Hour: 11:30-12: Time Starting From the North On: TCH Ramps From the South On: Hospital Drive From the East On: Hospital Drive NW From the West On: West Campus Blvd. NW Total Left Turn Straight Right Turn Left Turn Straight Right Turn Left Turn Straight Right Turn Left Turn Straight Right Turn Bikes 04: : : : : : : : Hour Total Peak Hour: 4:00-5: Hour Total
165 Location : North Leg : University Drive NW East Leg: 24 Avenue NW South Leg : University Drive NW West Leg: 24 Avenue NW Date : Observer(s) : Job # : Job Name: Monday September 13, 2012 City of Calgary 2984.T01 West Campus Transportation Management Plan & TDM From the North On: University Drive NW From the South On: University Drive NW From the East On: 24 Avenue NW From the West On: 24 Avenue NW Time Starting Left Turn Straight Right Turn Total Total Left Turn Straight Right Turn Left Turn Straight Right Turn Left Turn Straight Right Turn Peds Peds Peds Peds Vehicles Cars Trucks Cars Trucks Cars Trucks Cars Trucks Cars Trucks Cars Trucks Cars Trucks Cars Trucks Cars Trucks Cars Trucks Cars Trucks Cars Trucks Cars Trucks Peds 07: : : : : : : : Hour Total Peak Hour: 8:00-9: Total Veh & % Trucks 69 10% 138 9% % 118 5% 171 5% PHF 0.95 Peak Total = 232 PHF 1.03 Peak Total = 917 PHF 1.12 Peak Total = 529 PHF 0.97 Peak Total = 354 From the North On: University Drive NW From the South On: University Drive NW From the East On: 24 Avenue NW From the West On: 24 Avenue NW Time Starting Left Turn Straight Right Turn Total Total Left Turn Straight Right Turn Left Turn Straight Right Turn Left Turn Straight Right Turn Peds Peds Peds Peds Vehicles Cars Trucks Cars Trucks Cars Trucks Cars Trucks Cars Trucks Cars Trucks Cars Trucks Cars Trucks Cars Trucks Cars Trucks Cars Trucks Cars Trucks Cars Trucks Peds 11: : : : : : : : Hour Total Peak Hour: 11:30-12: Total Veh & % Trucks 95 7% 197 7% 31 7% PHF 0.84 Peak Total = 323 PHF 0.92 Peak Total = 634 PHF 1.06 Peak Total = 363 PHF 0.84 Peak Total = 277 From the North On: University Drive NW From the South On: University Drive NW From the East On: 24 Avenue NW From the West On: 24 Avenue NW Time Starting Left Turn Straight Right Turn Total Total Left Turn Straight Right Turn Left Turn Straight Right Turn Left Turn Straight Right Turn Peds Peds Peds Peds Vehicles Cars Trucks Cars Trucks Cars Trucks Cars Trucks Cars Trucks Cars Trucks Cars Trucks Cars Trucks Cars Trucks Cars Trucks Cars Trucks Cars Trucks Cars Trucks Peds 04: : : : : : : : Hour Total Peak Hour: 4:00-5: Total Veh & % Trucks 147 6% 244 6% 64 5% PHF 0.88 Peak Total = 455 PHF 0.97 Peak Total = 556 PHF 0.86 Peak Total = 576 PHF 0.95 Peak Total = Hour Total
166 Traffic Count Reports Land Use & Mobility Department Intersection Id: 8009 Study Name: 6 Hour Intersection Count Study Date: Wednesday, Nov 16, 2011 Verified: Yes Location: 24 AV NW & CROWCHILD TR NW Period Beginning North North Lef t Straight North South East West North North North North South Left Right Truck Pedestrian Bike 07:00: :15: :30: :45: :00: :15: :30: :45: South South Straight Right South South South East Left Truck Pedestrian Bike East East East East East Right West Left Straight Truck Pedestrian Bike West West Straight Right West West West Vehicle Truck Pedestrian Bike Totals TOTAL PEAK PHF 0.96 Peak Total 3650 Total Flow 19.9% Truck Flow 0.8 Total Volume PHF 0.95 Peak Total 1879 Total Flow 8.8% Truck Flow 4. Total Volume PHF 0.94 Peak Total 723 Total Flow 3.5% Truck Flow 1.8 Total Volume PHF 0.9 Peak Total 287 Total Flow 1. Truck Flow 2.27% Total Volume :00: :15: :30: :45: :00: :15: :30: :45: TOTAL PEAK PHF 0.97 Peak Total 2399 Total Flow 12.9% Truck Flow 2.3 Total Volume PHF 0.93 Peak Total 1835 Total Flow 9. Truck Flow 3.8 Total Volume PHF 0.88 Peak Total 537 Total Flow 2.9% Truck Flow 1.9 Total Volume PHF 0.88 Peak Total 498 Total Flow 2. Truck Flow 3.15% Total Volume :00: :15: :30: :45: :00: :15: :30: :45: TOTAL PEAK PHF 0.97 Peak Total 2345 Total Flow 12. Truck Flow 1.9 Total Volume PHF 0.98 Peak Total 3561 Total Flow 18. Truck Flow 0.8 Total Volume PHF 0.9 Peak Total 1009 Total Flow 5. Truck Flow 1.17% Total Volume PHF 0.95 Peak Total 659 Total Flow 3. Truck Flow 0.7% Total Volume 1278 GRAND Hour Total Total: Total: Total: Total: Total Hour Summary Total: Total: Total: Total: 2728 North Bound: % South Bound: Total: South Bound: % North Bound: % Total: East Bound: % West Bound: Total: 7072 West Bound: % East Bound: % Total: 4925 Information contained herein is intended, designed, and collected for specific municipal purposes and may not be suitable for other applications. The City of Calgary accepts no responsibility or liability which may arise from any incorrect or incomplete data or results, or for any improper or inappropriate use or interpretation made by any person Print Friendly Version 60 % View Graph
167 Traffic Count Reports Land Use & Mobility Department Intersection Id: 8008 Study Name: 6 Hour Intersection Count Study Date: Monday, Sep 21, 2009 Verified: Yes Location: CROWCHILD TR NW & 32 AV NW Period Beginning North North Lef t Straight North South East West North North North North South Left Right Truck Pedestrian Bike 07:00: :15: :30: :45: :00: :15: :30: :45: South South Straight Right South South South East Left Truck Pedestrian Bike East East East East East Right West Left Straight Truck Pedestrian Bike West West Straight Right West West West Vehicle Truck Pedestrian Bike Totals TOTAL PEAK PHF 0.88 Peak Total 858 Total Flow 1 Truck Flow 3. Total Volume PHF 0.92 Peak Total 686 Total Flow 9.8% Truck Flow 5.08% Total Volume PHF 0.97 Peak Total 533 Total Flow 7.9% Truck Flow 2.5% Total Volume PHF 0.87 Peak Total 163 Total Flow 2.9% Truck Flow 3.9% Total Volume :00: :15: :30: :45: :00: :15: :30: :45: TOTAL PEAK PHF 0.88 Peak Total 580 Total Flow 9.5% Truck Flow 2.7 Total Volume PHF 0.82 Peak Total 500 Total Flow 8. Truck Flow 3.3 Total Volume PHF 0.91 Peak Total 480 Total Flow 7.9% Truck Flow 2.29% Total Volume PHF 0.86 Peak Total 192 Total Flow 2.9% Truck Flow 5.85% Total Volume :00: :15: :30: :45: :00: :15: :30: :45: TOTAL PEAK PHF 0.95 Peak Total 666 Total Flow 11. Truck Flow 3.1 Total Volume PHF 0.96 Peak Total 994 Total Flow 16. Truck Flow 2.2 Total Volume PHF 0.87 Peak Total 427 Total Flow 7. Truck Flow 1.4 Total Volume PHF 0.8 Peak Total 207 Total Flow 3. Truck Flow 1.88% Total Volume 373 GRAND Hour Total Total: Total: Total: Total: Total Hour Summary Total: Total: Total: Total: 1048 North Bound: South Bound: % Total: 8441 South Bound: % North Bound: Total: 9270 East Bound: 0-0% West Bound: % Total: 2674 West Bound: East Bound: % Total: 2901 Crowchild Trail runs E/W. This counts the intersection of Charleswood Dr/32 Av and the WB ramps of Crowchild Tr. See also 8013 & for complete interchange analy sis. Information contained herein is intended, designed, and collected for specific municipal purposes and may not be suitable for other applications. The City of Calgary accepts no responsibility or liability which may arise from any incorrect or incomplete data or results, or for any improper or inappropriate use or interpretation made by any person Print Friendly Version 60 % View Graph
168 Traffic Count Reports Land Use & Mobility Department Intersection Id: Study Name: 6 Hour Intersection Count Study Date: Monday, Sep 21, 2009 Verified: Yes Location: 32 AV NW & CROWCHILD TR SOUTHBOUND RAMP Period Beginning North North Lef t Straight North South East West North North North North South Left Right Truck Pedestrian Bike 07:00: :15: :30: :45: :00: :15: :30: :45: South South Straight Right South South South East Left Truck Pedestrian Bike East East East East East Right West Left Straight Truck Pedestrian Bike West West Straight Right West West West Vehicle Truck Pedestrian Bike Totals TOTAL PEAK PHF 0.91 Peak Total 1188 Total Flow 18.8% Truck Flow 2.7 Total Volume PHF 0.88 Peak Total 470 Total Flow 7.5% Truck Flow 7.05% Total Volume PHF 0.9 Peak Total 560 Total Flow 7.8% Truck Flow 1.9 Total Volume PHF 0 Peak Total 0 Total Flow 0% Truck Flow 0% Total Volume 0 11:00: :15: :30: :45: :00: :15: :30: :45: TOTAL PEAK PHF 0.96 Peak Total 812 Total Flow 13.5% Truck Flow 2.6 Total Volume PHF 0.79 Peak Total 685 Total Flow 11. Truck Flow 3.4 Total Volume PHF 0.83 Peak Total 150 Total Flow 2.7% Truck Flow 3.9 Total Volume PHF 0 Peak Total 0 Total Flow 0% Truck Flow 0% Total Volume 0 16:00: :15: :30: :45: :00: :15: :30: :45: TOTAL PEAK PHF 0.91 Peak Total 772 Total Flow 13. Truck Flow 2.4 Total Volume PHF 0.9 Peak Total 1270 Total Flow 21.7% Truck Flow Total Volume PHF 0.86 Peak Total 207 Total Flow 3.5% Truck Flow 1.5 Total Volume PHF 0 Peak Total 0 Total Flow 0% Truck Flow 0% Total Volume 0 GRAND Hour Total Total: Total: Total: Total: Total Hour Summary Total: Total: Total: Total: 0 North Bound: South Bound: % Total: 9187 South Bound: % North Bound: Total: 8938 East Bound: % West Bound: % Total: 4525 West Bound: 0-0% East Bound: 0-0% Total: 0 Crowchild Trail runs E/W. This counts the intersection of Charleswood Dr/32 Av and the EB ramps of Crowchild Tr. See also 8013 & 8008 for complete interchange analy sis. Information contained herein is intended, designed, and collected for specific municipal purposes and may not be suitable for other applications. The City of Calgary accepts no responsibility or liability which may arise from any incorrect or incomplete data or results, or for any improper or inappropriate use or interpretation made by any person Print Friendly Version 60 % View Graph
169 Traffic Count Reports Land Use & Mobility Department Intersection Id: 8016 Study Name: 6 Hour Intersection Count Study Date: Thursday, Mar 11, 2004 Verified: Yes Location: 32 AV NW & CAMPUS DR NW Period Beginning North North Lef t Straight North South East West North North North North South Left Right Truck Pedestrian Bike 07:00: :15: :30: :45: :00: :15: :30: :45: South South Straight Right South South South East Left Truck Pedestrian Bike East East East East East Right West Left Straight Truck Pedestrian Bike West West Straight Right West West West Vehicle Truck Pedestrian Bike Totals TOTAL PEAK PHF 0.88 Peak Total 120 Total Flow 2. Truck Flow 51.66% Total Volume PHF 0.79 Peak Total 223 Total Flow 3.6% Truck Flow 5.8 Total Volume PHF 0.91 Peak Total 851 Total Flow 14.5% Truck Flow 1.6% Total Volume PHF 0.9 Peak Total 563 Total Flow 10. Truck Flow 4.1 Total Volume :00: :15: :30: :45: :00: :15: :30: :45: TOTAL PEAK PHF 0.86 Peak Total 134 Total Flow 2.7% Truck Flow 17.67% Total Volume PHF 0.77 Peak Total 292 Total Flow 4.7% Truck Flow 2.77% Total Volume PHF 0.86 Peak Total 577 Total Flow 10.5% Truck Flow 2. Total Volume PHF 0.94 Peak Total 629 Total Flow 11. Truck Flow 3.0 Total Volume :00: :15: :30: :45: :00: :15: :30: :45: TOTAL PEAK PHF 0.76 Peak Total 286 Total Flow 5. Truck Flow 18.6 Total Volume PHF 0.79 Peak Total 589 Total Flow 9. Truck Flow 2.8% Total Volume PHF 0.93 Peak Total 563 Total Flow 10.7% Truck Flow 0.47% Total Volume PHF 0.95 Peak Total 783 Total Flow 15% Truck Flow 1.68% Total Volume 1491 GRAND Hour Total Total: Total: Total: Total: Total Hour Summary Total: Total: Total: Total: 3633 North Bound: South Bound: % Total: 1288 South Bound: % North Bound: Total: 3447 East Bound: % West Bound: Total: 7980 West Bound: % East Bound: Total: 7107 NEIL Information contained herein is intended, designed, and collected for specific municipal purposes and may not be suitable for other applications. The City of Calgary accepts no responsibility or liability which may arise from any incorrect or incomplete data or results, or for any improper or inappropriate use or interpretation made by any person Print Friendly Version 60 % View Graph
170 Traffic Count Reports Land Use & Mobility Department Intersection Id: 8018 Study Name: 6 Hour Intersection Count Study Date: Thursday, Apr 4, 2002 Verified: Yes Location: 32 AV NW & 33 ST NW Period Beginning North North Lef t Straight North South East West North North North North South Left Right Truck Pedestrian Bike 07:00: :15: :30: :45: :00: :15: :30: :45: South South Straight Right South South South East Left Truck Pedestrian Bike East East East East East Right West Left Straight Truck Pedestrian Bike West West Straight Right West West West Vehicle Truck Pedestrian Bike Totals TOTAL PEAK PHF 0.59 Peak Total 38 Total Flow 0.9% Truck Flow 2.7% Total Volume PHF 0 Peak Total 0 Total Flow 0% Truck Flow 0% Total Volume PHF 0.92 Peak Total 599 Total Flow 13. Truck Flow 3.4 Total Volume PHF 0.89 Peak Total 759 Total Flow 16. Truck Flow 2.7 Total Volume :00: :15: :30: :45: :00: :15: :30: :45: TOTAL PEAK PHF 0.82 Peak Total 157 Total Flow 3. Truck Flow 1.08% Total Volume PHF 0 Peak Total 0 Total Flow 0% Truck Flow 0% Total Volume PHF 0.87 Peak Total 567 Total Flow 12.8% Truck Flow 2.76% Total Volume PHF 0.94 Peak Total 548 Total Flow 12.7% Truck Flow 2.6% Total Volume :00: :15: :30: :45: :00: :15: :30: :45: TOTAL PEAK PHF 0.87 Peak Total 222 Total Flow 5% Truck Flow 0.2 Total Volume PHF 0 Peak Total 0 Total Flow 0% Truck Flow 0% Total Volume PHF 0.95 Peak Total 840 Total Flow 18.5% Truck Flow 1.8 Total Volume PHF 0.92 Peak Total 757 Total Flow 17. Truck Flow 1.06% Total Volume 1415 GRAND Hour Total Total: Total: Total: Total: Total Hour Summary Total: Total: Total: Total: 3769 North Bound: % South Bound: Total: 1482 South Bound: 0-0% North Bound: 0-0% Total: 0 East Bound: West Bound: % Total: 7669 West Bound: % East Bound: Total: 7219 Information contained herein is intended, designed, and collected for specific municipal purposes and may not be suitable for other applications. The City of Calgary accepts no responsibility or liability which may arise from any incorrect or incomplete data or results, or for any improper or inappropriate use or interpretation made by any person Print Friendly Version 60 % View Graph
171 Civil, Municipal and Traffic Engineering Storm Water Management Legal Survey/Geomatics Transportation Planning APPENDIX G: FUTURE INTERSECTION VOLUMES AND ADJUSTMENTS West Campus Transportation Impact Assessment
172 Summary of adjustments to the City of Calgary 2039 Forecasted volumes and rationale Intersection Movement Peak Forecast Adjustment SBT NBT NBR* AM AM AM PM PM PM NBL* PM Avenue NW & Shaganappi AM SBL Trail PM EBL PM NBR* PM EBT AM EBR AM WBT AM PM NBL* PM SBT AM PM West Campus Way (28 Avenue AM NBT NW) & Shaganappi Trail PM SBL AM PM Avenue NW & 39 Street NW EBL AM 20 5 PM SBT AM PM 20 7 EBR AM PM AM WBL 32 Avenue NW & Collegiate PM Blvd AM NBL PM NBR AM PM *Multiple Adjustments on the same approach Rationale Addition for traffic travelling to and from the Stadium Shopping Centre (Post Redevelopment) using the total trips generated by the new site and the selected zone plots for the respective zone Traffic balanced and shifted from SBL at 28 Avenue NW (West Campus Way) due to capacity issues Increase to match existing (284) plus small growth Increase to match existing (88) plus small growth Volumes reduced to be closer to existing volumes since there are no major land use changes in the communities that generate the traffic associates with this movement. Addition for traffic travelling to and from the Stadium Shopping Centre (Post Redevelopment) using the total trips generated by the new site and the selected zone plots for the respective zone Traffic balanced and shifted to SBL at 32 Avenue NW due to capacity issues Addition for traffic travelling to and from the Stadium Shopping Centre (Post Redevelopment) using the total trips generated by the new site and the selected zone plots for the respective zone Reductions based on the University of Calgary Campus Master Plan Report which includes the conversion of the parking lots in the NW quadrant of the campus to buildings and net reduction of parking stalls in the area by 40% or 1,100 stalls
173 Collegiate Road & Collegiate Blvd Collegiate Blvd (West Campus Way) & 39 Street NW West Campus Way & West Campus Drive EBL EBT WBT WBR SBL SBR SBR SBL SBT SBR EBL EBT EBR NBL NBT NBR WBL* WBT WBR WBL* AM N/A 91 PM N/A 200 AM N/A 399 PM N/A 80 AM N/A 124 PM N/A 380 AM N/A 91 PM N/A 217 AM N/A 282 PM N/A 195 AM N/A 146 PM N/A 180 AM PM AM 0 40 PM 0 76 AM PM AM PM AM PM AM PM AM PM AM PM AM PM AM PM AM PM AM PM AM 0 84 PM 0 60 AM PM No volume data was received from the city for this intersection. Volumes were estimated using volumes from adjacent intersections, information contained in the University of Calgary Campus Master Plan Report and engineering judgement Addition for Stadium Shopping Centre (Post Redevelopment) Adjustments were required at this intersection to assign some of the traffic to the north leg which had no traffic in the original forecast data. The reassignment of traffic to this leg was made based on the proposed land use densities as well as the select zone plots for TZ 2403 and TZ Addition for Stadium Shopping Centre (Post Redevelopment)
174 Oki Drive (Alberta Children's Hospital) / Physical Plant Road & West Campus Drive SBL SBT* SBR EBL EBT EBR NBL NBT NBR WBL WBT WBR SBT* *Multiple Adjustments on the same approach AM N/A 80 PM N/A 10 AM N/A 849 PM N/A 552 AM N/A 61 PM N/A 34 AM N/A 33 PM N/A 58 AM N/A 15 PM N/A 10 AM N/A 38 PM N/A 79 AM N/A 83 PM N/A 56 AM N/A 651 PM N/A 914 AM N/A 56 PM N/A 20 AM N/A 33 PM N/A 36 AM N/A 5 PM N/A 5 AM N/A 28 PM N/A 38 AM N/A 20 PM N/A 7 No volume data was received from the City for this intersection. Volumes were estimated using current volumes, engineering judgement and on the TZ 2403 and TZ 2405 select zone plots. Addition for Stadium Shopping Centre (Post Redevelopment)
175 24 Avenue NW & West Campus Drive / West Campus Place 24 Avenue NW / Children's Way & West Campus Blvd. SBT SBR EBL EBT EBR NBL NBT NBR WBL WBT SBL EBT NBR WBL *Multiple Adjustments on the same approach AM 0 93 PM AM PM AM PM AM PM AM 0 13 PM 0 80 AM 0 79 PM 0 12 AM PM AM PM 0 26 AM 0 20 PM 0 99 AM PM AM PM AM 0 30 PM 0 20 AM PM AM PM Adjustments were required at this intersection to assign some of the traffic to the south leg which had no traffic in the original forecast data. The reassignment of traffic to this leg was made based on the proposed land use densities as well as the select zone plots for TZ 2403 and TZ Addition for Stadium Shopping Centre (Post Redevelopment) Increased to match opposing volume (WBT) from model Adjustments were required at this intersection to assign some of the traffic to the west leg which had no traffic in the original forecast data. The reassignment of traffic to this leg was made based on current traffic volumes and the select zone plots for TZ 2403 and TZ 2405.
176 Civil, Municipal and Traffic Engineering Storm Water Management Legal Survey/Geomatics Transportation Planning APPENDIX H: POST DEVELOPMENT INTERSECTION OPERATIONS West Campus Transportation Impact Assessment
177 Civil, Municipal and Traffic Engineering Storm Water Management Legal Survey/Geomatics Transportation Planning TABLE H1: 2039 POST DEVELOPMENT OPERATIONS INTERSECTION / MOVEMENT 32 Avenue NW / Shaganappi Trail (Signalized) EB WB NB SB AM PEAK HOUR PM PEAK HOUR v/c Ratio LOS Delay (s) Queue (m) v/c Ratio LOS Delay (s) Queue (m) Left 0.51 D F 159 #167 Through / Right 1.19 F 143 # F 130 #167 Left 0.60 D E 57 #44 Through 0.25 D F 127 #137 Right 0.16 A A 1 0 Left 0.87 F 81 # E 58 #150 Through 0.58 D F 82 #369 Right 0.14 A A 8 17 Left 0.94 D 50 # F 171 #165.9 Through 1.21 F 133 # D 42 #164.1 Right 0.05 B A 9 18 Intersection Summary - F F 81 - West Campus Way (28 Ave) / Shaganappi Trail (Signalized) 32 Avenue NW / 39 Street NW (West Campus Gate NW) (Signalized) 32 Avenue NW / Collegiate Blvd (Signalized) WB NB SB Left 0.57 C F 88 #108 Right 0.26 A A 2 0 Through 0.41 C D 47 #226 Right 0.64 A A 5 24 Left 0.71 C F 85 #92 Through 0.90 B A 6 34 Intersection Summary - B D 40 - EB WB NB Left Left Left A E E # B B D Through / Right Through / Right Right D B B # C C A SB Left / Through / Right 0.90 E 79 # D Intersection Summary EB WB NB - D C 28 - Through 0.75 C 26 # B Right 0.25 A A 0 0 Left 0.78 C 25 # A 9 21 Through 0.21 A A 7 34 Left 0.13 C C Right 0.35 A A 9 23 Intersection Summary - B B 12 - Collegiate Road / Collegiate Blvd (All-Way Stop- Controlled) West Campus Way / 39 Street NW (West Campus Gate NW) (Stop-Controlled) West Campus Way / West Campus Drive (Signalized) EB Left / Through 0.51 B B 13 - WB Through / Right 0.24 B A 9 - SB Left 0.58 C B 12 - Right 0.26 A A 9 - EB Left / Through 0.13 A B WB Through / Right 0.11 A A 0 0 SB EB WB Left Left Left F B D # F B D Error Error 24 #88 Right Through / Right Through / Right C C B # C C B #86 41 Left 0.28 B B NB Through 0.25 C D Right 0.35 A A 5 14 SB Left / Through / Right 0.82 C 35 # C 35 #61 Intersection Summary - C C 25 - West Campus Transportation Impact Assessment
178 Civil, Municipal and Traffic Engineering Storm Water Management Legal Survey/Geomatics Transportation Planning Oki Drive (Physical Plant Road) / West Campus Drive (Signalized) AM PEAK HOUR PM PEAK HOUR v/c Ratio LOS Delay (s) Queue (m) v/c Ratio LOS Delay (s) Queue (m) EB Left 0.08 B B Through / Right 0.13 A A 6 9 WB Left / Through / Right 0.09 A A 9 7 NB Left / Through / Right 0.49 A B SB Left / Through / Right 0.58 B 11 # A 8 33 INTERSECTION / MOVEMENT Intersection Summary - A A Avenue NW / West Campus Drive (Signalized) 24 Avenue NW (Children's Way) / West Campus Boulevard (Stop-Controlled) TCH Ramps (North) / West Campus Boulevard (Signalized) TCH Ramps (South) / West Campus Boulevard (Hospital Drive) (Signalized) EB Left 0.91 E 68 # E 77 #91 Through / Right 0.08 C B WB Left/ Through / Right 0.91 C 29 # E 79 #161 NB Left /Through / Right 0.79 D 49 # D SB Left 0.94 D 43 # F 139 #243 Through / Right 0.33 A C Intersection Summary - D E 76 - EB Right 0.03 A A 0 0 WB NB WB Left Left Left A C B A E D Through Right Right A B A A B A NB Through / Right 0.56 B 17 # C 27 #238 SB Left 0.43 A C 30 #151 Through 0.31 A A 2 14 Intersection Summary EB WB NB SB - A B 17 - Left 0.81 C 23 # A 9 19 Through / Right 0.38 A A 3 10 Left / Through 0.37 C C Right 0.12 A A 7 10 Left 0.23 B C Through / Right 0.07 B B Left 0.59 C 24 # C Through 0.27 B C Right 0.32 A A 5 16 Intersection Summary - B B 18 - The '#' symbol indicates that the 95th percentile volume exceeds capacity after two cycles, and that the queues shown are the maximum queues after two cycles. The actual queue lengths may be longer than the queues shown. West Campus Transportation Impact Assessment
179 Civil, Municipal and Traffic Engineering Storm Water Management Legal Survey/Geomatics Transportation Planning TABLE H2: 2039 POST DEVELOPMENT OPERATIONS IMPROVED INTERSECTION GEOMETRY INTERSECTION / MOVEMENT 32 Avenue NW / Shaganappi Trail (Signalized) EB WB NB SB AM PEAK HOUR PM PEAK HOUR v/c Ratio LOS Delay (s) Queue (m) v/c Ratio LOS Delay (s) Queue (m) Left 0.51 C E 56 #97 Through 0.87 E 61 # D Right 0.79 C 30 # A 8 23 Left 0.45 C C Through 0.28 D D Right 0.54 B F 179 #220 Left 0.56 E E 66 #77 Through 0.38 C E 68 #204 Right 0.13 A B Left 0.81 D E 77 #64 Through 0.91 D D Right 0.05 A A 7 14 Intersection Summary - D E 64 - West Campus Way (28 Ave) / Shaganappi Trail (Signalized) WB NB SB Left 0.41 C D Right 0.56 A E 66 #242 Through 0.42 C E 65 #205 Right 0.72 A A 8 36 Left 0.71 C E 78 #108 Through 0.74 B B Intersection Summary - B D 50 - West Campus Way / 39 Street NW (West Campus Gate NW) (Signalized) Left / Through 0.53 B EB* Left C 25 #125 Through A 6 24 WB Through / Right 0.26 B C 29 #59 SB Left 0.33 B C Right 0.76 B A 9 19 Intersection Summary - B C 22 - TCH Ramps (North) / West Campus Boulevard (Roundabout) WB Left / Right 0.39 A A 6 56 Through 0.23 A A 4 19 NB Right 0.14 A A 3 23 SB Left / Through 0.74 A A 2 43 Intersection Summary - A A 3 - *EB defacto left in p.m. peak hour The '#' symbol indicates that the 95th percentile volume exceeds capacity after two cycles, and that the queues shown are the maximum queues after two cycles. The actual queue lengths may be longer than the queues shown. West Campus Transportation Impact Assessment
180 Civil, Municipal and Traffic Engineering Storm Water Management Legal Survey/Geomatics Transportation Planning TABLE H3: 2039 POST DEVELOPMENT OPERATIONS IMPROVED NETWORK 500 PEDESTRIANS PER MOVEMENT INTERSECTION / MOVEMENT West Campus Way (28 Ave) / Shaganappi Trail (Signalized) WB NB SB AM PEAK HOUR PM PEAK HOUR v/c Ratio LOS Delay (s) Queue (m) v/c Ratio LOS Delay (s) Queue (m) Left 0.35 C D Right 0.65 A F 192 #294 Through 0.37 C E 59 #201 Right 0.84 B 16 # B Left 0.78 D E 78 #108 Through 0.75 B B Intersection Summary - C E 70 - West Campus Way / West Campus Drive (Signalized) EB WB Left Left D D #53 # C C Through / Right Through / Right D B # E C # Left 0.29 B D 44 #100 NB Through 0.24 C B Right 0.46 A D 43 #168 SB Left / Through / Right 0.86 D 40 # C 34 #92 Intersection Summary - C D 42 - West Campus Way / 39 Street NW (West Campus Gate NW) (Signalized) Left / Through 0.78 D 41 # EB* Left C 33 #134 Through A 7 26 WB Through / Right 0.36 C C 32 #66 SB Left 0.21 A C Right 0.93 D 42 # B Intersection Summary - C C 26 - Collegiate Road / Collegiate Blvd (All-Way Stop- Controlled) EB Left / Through 0.51 B B 13 - WB Through / Right 0.24 B A 9 - SB Left 0.58 C B 12 - Right 0.26 A A 9 - *EB defacto left in p.m. peak hour The '#' symbol indicates that the 95th percentile volume exceeds capacity after two cycles, and that the queues shown are the maximum queues after two cycles. The actual queue lengths may be longer than the queues shown. West Campus Transportation Impact Assessment
181 Civil, Municipal and Traffic Engineering Storm Water Management Legal Survey/Geomatics Transportation Planning APPENDIX I: SYNCHRO ANALYSIS RESULTS West Campus Transportation Impact Assessment
182 Lanes, Volumes, Timings 2039 Post Development 24: 32 Ave NW & Shaganappi Trail AM Peak Hour Lane Group EBL EBT EBR WBL WBT WBR NBL NBT NBR SBL SBT SBR Lane Configurations Volume (vph) Ideal Flow (vphpl) Storage Length (m) Storage Lanes Taper Length (m) Lane Util. Factor Ped Bike Factor Frt Flt Protected Satd. Flow (prot) Flt Permitted Satd. Flow (perm) Right Turn on Red Yes Yes Yes Yes Satd. Flow (RTOR) Link Speed (k/h) Link Distance (m) Travel Time (s) Confl. Peds. (#/hr) Confl. Bikes (#/hr) Peak Hour Factor Heavy Vehicles (%) 5% 5% 5% 5% 5% 5% 5% 5% 5% 5% 5% 5% Bus Blockages (#/hr) Adj. Flow (vph) Shared Lane Traffic (%) Lane Group Flow (vph) Enter Blocked Intersection No No No No No No No No No No No No Lane Alignment Left Left Right Left Left Right Left Left Right Left Left Right Median Width(m) Link Offset(m) Crosswalk Width(m) Two way Left Turn Lane Headway Factor Turning Speed (k/h) Number of Detectors Detector Template Left Thru Left Thru Right Left Thru Right Left Thru Right Leading Detector (m) Trailing Detector (m) Detector 1 Position(m) Detector 1 Size(m) Detector 1 Type Cl+Ex Cl+Ex Cl+Ex Cl+Ex Cl+Ex Cl+Ex Cl+Ex Cl+Ex Cl+Ex Cl+Ex Cl+Ex Detector 1 Channel Detector 1 Extend (s) Detector 1 Queue (s) Detector 1 Delay (s) Turn Type pm+pt pm+pt Free pm+pt Perm pm+pt Perm Protected Phases Permitted Phases 4 8 Free Detector Phase West Campus Transportation Impact Assessment Synchro 7 - Report Latest Geometry Page 10
183 Lanes, Volumes, Timings 2039 Post Development 24: 32 Ave NW & Shaganappi Trail AM Peak Hour Lane Group EBL EBT EBR WBL WBT WBR NBL NBT NBR SBL SBT SBR Switch Phase Minimum Initial (s) Minimum Split (s) Total Split (s) Total Split (%) 12.7% 26.7% 0.0% 10.0% 24.0% 0.0% 10.0% 32.7% 32.7% 30.7% Maximum Green (s) Yellow Time (s) All-Red Time (s) Lost Time Adjust (s) Total Lost Time (s) Lead/Lag Lead Lag Lead Lag Lead Lag Lag Lead Lag Lag Lead-Lag Optimize? Yes Yes Yes Yes Yes Yes Yes Yes Yes Yes Vehicle Extension (s) Recall Mode None None None None None Min Min None Min Min Walk Time (s) Flash Dont Walk (s) Pedestrian Calls (#/hr) Act Effct Green (s) Actuated g/c Ratio v/c Ratio Control Delay Queue Delay Total Delay LOS D F D D A F D A D F B Approach Delay Approach LOS F C D F Queue Length 50th (m) 47.0 ~ ~ Queue Length 95th (m) 70.3 # # #186.5 # Internal Link Dist (m) Turn Bay Length (m) Base Capacity (vph) Starvation Cap Reductn Spillback Cap Reductn Storage Cap Reductn Reduced v/c Ratio Intersection Summary Area Type: Other Cycle Length: 150 Actuated Cycle Length: Natural Cycle: 150 Control Type: Actuated-Uncoordinated Maximum v/c Ratio: 1.21 Intersection Signal Delay: 97.1 Intersection LOS: F Intersection Capacity Utilization 111.6% ICU Level of Service H Analysis Period (min) 15 ~ Volume exceeds capacity, queue is theoretically infinite. Queue shown is maximum after two cycles. # 95th percentile volume exceeds capacity, queue may be longer. West Campus Transportation Impact Assessment Synchro 7 - Report Latest Geometry Page 11
184 Lanes, Volumes, Timings 2039 Post Development 24: 32 Ave NW & Shaganappi Trail AM Peak Hour Queue shown is maximum after two cycles. Splits and Phases: 24: 32 Ave NW & Shaganappi Trail West Campus Transportation Impact Assessment Synchro 7 - Report Latest Geometry Page 12
185 Lanes, Volumes, Timings 2039 Post Development 28: West Campus Way & Shaganappi Trail AM Peak Hour Lane Group WBL WBR NBT NBR SBL SBT Lane Configurations Volume (vph) Ideal Flow (vphpl) Lane Width (m) Storage Length (m) Storage Lanes Taper Length (m) Lane Util. Factor Ped Bike Factor Frt Flt Protected Satd. Flow (prot) Flt Permitted Satd. Flow (perm) Right Turn on Red Yes Yes Satd. Flow (RTOR) Link Speed (k/h) Link Distance (m) Travel Time (s) Confl. Peds. (#/hr) Confl. Bikes (#/hr) Peak Hour Factor Heavy Vehicles (%) 5% 5% 5% 5% 5% 5% Adj. Flow (vph) Shared Lane Traffic (%) Lane Group Flow (vph) Enter Blocked Intersection No No No No No No Lane Alignment Left Right Left Right Left Left Median Width(m) Link Offset(m) Crosswalk Width(m) Two way Left Turn Lane Headway Factor Turning Speed (k/h) Number of Detectors Detector Template Left Right Thru Right Left Thru Leading Detector (m) Trailing Detector (m) Detector 1 Position(m) Detector 1 Size(m) Detector 1 Type Cl+Ex Cl+Ex Cl+Ex Cl+Ex Cl+Ex Cl+Ex Detector 1 Channel Detector 1 Extend (s) Detector 1 Queue (s) Detector 1 Delay (s) Turn Type Free Perm Prot Protected Phases Permitted Phases Free 2 Detector Phase West Campus Transportation Impact Assessment Synchro 7 - Report Latest Geometry Page 16
186 Lanes, Volumes, Timings 2039 Post Development 28: West Campus Way & Shaganappi Trail AM Peak Hour Lane Group WBL WBR NBT NBR SBL SBT Switch Phase Minimum Initial (s) Minimum Split (s) Total Split (s) Total Split (%) 27.8% 0.0% % 72. Maximum Green (s) Yellow Time (s) All-Red Time (s) Lost Time Adjust (s) Total Lost Time (s) Lead/Lag Lag Lag Lead Lead-Lag Optimize? Yes Yes Yes Vehicle Extension (s) Recall Mode None Min Min None Min Walk Time (s) Flash Dont Walk (s) Pedestrian Calls (#/hr) Act Effct Green (s) Actuated g/c Ratio v/c Ratio Control Delay Queue Delay Total Delay LOS C A C A C B Approach Delay Approach LOS B B C Queue Length 50th (m) Queue Length 95th (m) Internal Link Dist (m) Turn Bay Length (m) Base Capacity (vph) Starvation Cap Reductn Spillback Cap Reductn Storage Cap Reductn Reduced v/c Ratio Intersection Summary Area Type: Other Cycle Length: 90 Actuated Cycle Length: 75.9 Natural Cycle: 75 Control Type: Actuated-Uncoordinated Maximum v/c Ratio: 0.90 Intersection Signal Delay: 18.7 Intersection Capacity Utilization 75.7% Analysis Period (min) 15 Intersection LOS: B ICU Level of Service D West Campus Transportation Impact Assessment Synchro 7 - Report Latest Geometry Page 17
187 Lanes, Volumes, Timings 2039 Post Development 28: West Campus Way & Shaganappi Trail AM Peak Hour Splits and Phases: 28: West Campus Way & Shaganappi Trail West Campus Transportation Impact Assessment Synchro 7 - Report Latest Geometry Page 18
188 Lanes, Volumes, Timings 2039 Post Development 35: 32 Ave NW & 39 Street NW AM Peak Hour Lane Group EBL EBT EBR WBL WBT WBR NBL NBT NBR SBL SBT SBR Lane Configurations Volume (vph) Ideal Flow (vphpl) Lane Width (m) Storage Length (m) Storage Lanes Taper Length (m) Lane Util. Factor Ped Bike Factor Frt Flt Protected Satd. Flow (prot) Flt Permitted Satd. Flow (perm) Right Turn on Red Yes Yes Yes Yes Satd. Flow (RTOR) Link Speed (k/h) Link Distance (m) Travel Time (s) Confl. Peds. (#/hr) Confl. Bikes (#/hr) Peak Hour Factor Heavy Vehicles (%) 5% 5% 5% 5% 5% 5% 5% 5% 5% 5% 5% 5% Bus Blockages (#/hr) Adj. Flow (vph) Shared Lane Traffic (%) Lane Group Flow (vph) Enter Blocked Intersection No No No No No No No No No No No No Lane Alignment Left Left Right Left Left Right Left Left Right Left Left Right Median Width(m) Link Offset(m) Crosswalk Width(m) Two way Left Turn Lane Headway Factor Turning Speed (k/h) Number of Detectors Detector Template Left Thru Left Thru Left Right Left Thru Leading Detector (m) Trailing Detector (m) Detector 1 Position(m) Detector 1 Size(m) Detector 1 Type Cl+Ex Cl+Ex Cl+Ex Cl+Ex Cl+Ex Cl+Ex Cl+Ex Cl+Ex Detector 1 Channel Detector 1 Extend (s) Detector 1 Queue (s) Detector 1 Delay (s) Turn Type pm+pt pm+pt Prot custom Perm Protected Phases Permitted Phases West Campus Transportation Impact Assessment Synchro 7 - Report Latest Geometry Page 19
189 Lanes, Volumes, Timings 2039 Post Development 35: 32 Ave NW & 39 Street NW AM Peak Hour Lane Group EBL EBT EBR WBL WBT WBR NBL NBT NBR SBL SBT SBR Detector Phase Switch Phase Minimum Initial (s) Minimum Split (s) Total Split (s) Total Split (%) 10.0% 50.8% 0.0% % 11.5% 0.0% 33.8% % Maximum Green (s) Yellow Time (s) All-Red Time (s) Lost Time Adjust (s) Total Lost Time (s) Lead/Lag Lead Lag Lead Lag Lead Lag Lag Lead-Lag Optimize? Yes Yes Yes Yes Yes Yes Yes Vehicle Extension (s) Recall Mode None Min None Min None None None None Walk Time (s) Flash Dont Walk (s) Pedestrian Calls (#/hr) Act Effct Green (s) Actuated g/c Ratio v/c Ratio Control Delay Queue Delay Total Delay LOS A D E B E B E Approach Delay Approach LOS D D E Queue Length 50th (m) Queue Length 95th (m) 5.2 #228.0 # #133.1 Internal Link Dist (m) Turn Bay Length (m) Base Capacity (vph) Starvation Cap Reductn Spillback Cap Reductn Storage Cap Reductn Reduced v/c Ratio Intersection Summary Area Type: Other Cycle Length: 130 Actuated Cycle Length: Natural Cycle: 100 Control Type: Actuated-Uncoordinated Maximum v/c Ratio: 0.96 Intersection Signal Delay: 46.5 Intersection LOS: D Intersection Capacity Utilization 87.9% ICU Level of Service E Analysis Period (min) 15 # 95th percentile volume exceeds capacity, queue may be longer. Queue shown is maximum after two cycles. West Campus Transportation Impact Assessment Synchro 7 - Report Latest Geometry Page 20
190 Lanes, Volumes, Timings 2039 Post Development 35: 32 Ave NW & 39 Street NW AM Peak Hour Splits and Phases: 35: 32 Ave NW & 39 Street NW West Campus Transportation Impact Assessment Synchro 7 - Report Latest Geometry Page 21
191 Lanes, Volumes, Timings 2039 Post Development 37: 32 Ave NW & Collegiate Blvd AM Peak Hour Lane Group EBT EBR WBL WBT NBL NBR Lane Configurations Volume (vph) Ideal Flow (vphpl) Storage Length (m) Storage Lanes Taper Length (m) Lane Util. Factor Ped Bike Factor Frt Flt Protected Satd. Flow (prot) Flt Permitted Satd. Flow (perm) Right Turn on Red Yes Yes Satd. Flow (RTOR) Link Speed (k/h) Link Distance (m) Travel Time (s) Confl. Peds. (#/hr) Confl. Bikes (#/hr) Peak Hour Factor Heavy Vehicles (%) 5% 5% 5% 5% 5% 5% Bus Blockages (#/hr) Adj. Flow (vph) Shared Lane Traffic (%) Lane Group Flow (vph) Enter Blocked Intersection No No No No No No Lane Alignment Left Right Left Left Left Right Median Width(m) Link Offset(m) Crosswalk Width(m) Two way Left Turn Lane Headway Factor Turning Speed (k/h) Number of Detectors Detector Template Thru Right Left Thru Left Right Leading Detector (m) Trailing Detector (m) Detector 1 Position(m) Detector 1 Size(m) Detector 1 Type Cl+Ex Cl+Ex Cl+Ex Cl+Ex Cl+Ex Cl+Ex Detector 1 Channel Detector 1 Extend (s) Detector 1 Queue (s) Detector 1 Delay (s) Turn Type Free pm+pt Perm Protected Phases Permitted Phases Free 6 8 Detector Phase West Campus Transportation Impact Assessment Synchro 7 - Report Latest Geometry Page 22
192 Lanes, Volumes, Timings 2039 Post Development 37: 32 Ave NW & Collegiate Blvd AM Peak Hour Lane Group EBT EBR WBL WBT NBL NBR Switch Phase Minimum Initial (s) Minimum Split (s) Total Split (s) Total Split (%) 40.0% 0.0% % 27.8% Maximum Green (s) Yellow Time (s) All-Red Time (s) Lost Time Adjust (s) Total Lost Time (s) Lead/Lag Lag Lead Lead-Lag Optimize? Yes Yes Vehicle Extension (s) Recall Mode Min None Min None None Walk Time (s) Flash Dont Walk (s) Pedestrian Calls (#/hr) Act Effct Green (s) Actuated g/c Ratio v/c Ratio Control Delay Queue Delay Total Delay LOS C A C A C A Approach Delay Approach LOS B B B Queue Length 50th (m) Queue Length 95th (m) # # Internal Link Dist (m) Turn Bay Length (m) Base Capacity (vph) Starvation Cap Reductn Spillback Cap Reductn Storage Cap Reductn Reduced v/c Ratio Intersection Summary Area Type: Other Cycle Length: 90 Actuated Cycle Length: 71.4 Natural Cycle: 90 Control Type: Actuated-Uncoordinated Maximum v/c Ratio: 0.78 Intersection Signal Delay: 17.3 Intersection LOS: B Intersection Capacity Utilization 73. ICU Level of Service D Analysis Period (min) 15 # 95th percentile volume exceeds capacity, queue may be longer. Queue shown is maximum after two cycles. West Campus Transportation Impact Assessment Synchro 7 - Report Latest Geometry Page 23
193 Lanes, Volumes, Timings 2039 Post Development 37: 32 Ave NW & Collegiate Blvd AM Peak Hour Splits and Phases: 37: 32 Ave NW & Collegiate Blvd West Campus Transportation Impact Assessment Synchro 7 - Report Latest Geometry Page 24
194 HCM Unsignalized Intersection Capacity Analysis 2039 Post Development 38: Collegiate Rd & Collegiate Blvd AM Peak Hour Movement EBL EBT WBT WBR SBL SBR Lane Configurations Sign Control Stop Stop Stop Volume (vph) Peak Hour Factor Hourly flow rate (vph) Direction, Lane # EB 1 EB 2 WB 1 WB 2 SB 1 SB 2 Volume Total (vph) Volume Left (vph) Volume Right (vph) Hadj (s) Departure Headway (s) Degree Utilization, x Capacity (veh/h) Control Delay (s) Approach Delay (s) Approach LOS B B C Intersection Summary Delay 13.8 HCM Level of Service B Intersection Capacity Utilization 53.0% ICU Level of Service A Analysis Period (min) 15 West Campus Transportation Impact Assessment Synchro 7 - Report Latest Geometry Page 3
195 HCM Unsignalized Intersection Capacity Analysis 2039 Post Development 36: West Campus Way & 39 Street NW AM Peak Hour Movement EBL EBT WBT WBR SBL SBR Lane Configurations Volume (veh/h) Sign Control Free Free Stop Grade 0% 0% 0% Peak Hour Factor Hourly flow rate (vph) Pedestrians Lane Width (m) Walking Speed (m/s) Percent Blockage Right turn flare (veh) Median type None None Median storage veh) Upstream signal (m) 216 px, platoon unblocked vc, conflicting volume vc1, stage 1 conf vol vc2, stage 2 conf vol vcu, unblocked vol tc, single (s) tc, 2 stage (s) tf (s) p0 queue free % cm capacity (veh/h) Direction, Lane # EB 1 EB 2 WB 1 WB 2 SB 1 SB 2 Volume Total Volume Left Volume Right csh Volume to Capacity Queue Length 95th (m) Control Delay (s) Lane LOS A F C Approach Delay (s) Approach LOS E Intersection Summary Average Delay 17.8 Intersection Capacity Utilization 50.9% ICU Level of Service A Analysis Period (min) 15 West Campus Transportation Impact Assessment Synchro 7 - Report Latest Geometry Page 2
196 Lanes, Volumes, Timings 2039 Post Development 26: West Campus Way & West Campus Drive AM Peak Hour Lane Group EBL EBT EBR WBL WBT WBR NBL NBT NBR SBL SBT SBR Lane Configurations Volume (vph) Ideal Flow (vphpl) Lane Width (m) Storage Length (m) Storage Lanes Taper Length (m) Lane Util. Factor Ped Bike Factor Frt Flt Protected Satd. Flow (prot) Flt Permitted Satd. Flow (perm) Right Turn on Red Yes Yes Yes Yes Satd. Flow (RTOR) Link Speed (k/h) Link Distance (m) Travel Time (s) Confl. Peds. (#/hr) Confl. Bikes (#/hr) Peak Hour Factor Heavy Vehicles (%) 5% 5% 5% 5% 5% 5% 5% 5% 5% 5% 5% 5% Bus Blockages (#/hr) Parking (#/hr) 0 0 Adj. Flow (vph) Shared Lane Traffic (%) Lane Group Flow (vph) Enter Blocked Intersection No No No No No No No No No No No No Lane Alignment Left Left Right Left Left Right Left Left Right Left Left Right Median Width(m) Link Offset(m) Crosswalk Width(m) Two way Left Turn Lane Headway Factor Turning Speed (k/h) Number of Detectors Detector Template Left Thru Left Thru Left Thru Right Left Thru Leading Detector (m) Trailing Detector (m) Detector 1 Position(m) Detector 1 Size(m) Detector 1 Type Cl+Ex Cl+Ex Cl+Ex Cl+Ex Cl+Ex Cl+Ex Cl+Ex Cl+Ex Cl+Ex Detector 1 Channel Detector 1 Extend (s) Detector 1 Queue (s) Detector 1 Delay (s) Turn Type pm+pt pm+pt pm+pt Perm Perm Protected Phases West Campus Transportation Impact Assessment Synchro 7 - Report Latest Geometry Page 13
197 Lanes, Volumes, Timings 2039 Post Development 26: West Campus Way & West Campus Drive AM Peak Hour Lane Group EBL EBT EBR WBL WBT WBR NBL NBT NBR SBL SBT SBR Permitted Phases Detector Phase Switch Phase Minimum Initial (s) Minimum Split (s) Total Split (s) Total Split (%) 16.7% % % 0.0% 16.7% % 27.8% 0.0% Maximum Green (s) Yellow Time (s) All-Red Time (s) Lost Time Adjust (s) Total Lost Time (s) Lead/Lag Lead Lag Lead Lag Lead Lag Lag Lead-Lag Optimize? Yes Yes Yes Yes Yes Yes Yes Vehicle Extension (s) Recall Mode None Min None Min None None None None None Walk Time (s) Flash Dont Walk (s) Pedestrian Calls (#/hr) Act Effct Green (s) Actuated g/c Ratio v/c Ratio Control Delay Queue Delay Total Delay LOS B C D B B C A C Approach Delay Approach LOS C C B C Queue Length 50th (m) Queue Length 95th (m) 23.5 #86.1 # #60.7 Internal Link Dist (m) Turn Bay Length (m) Base Capacity (vph) Starvation Cap Reductn Spillback Cap Reductn Storage Cap Reductn Reduced v/c Ratio Intersection Summary Area Type: Other Cycle Length: 90 Actuated Cycle Length: 79.5 Natural Cycle: 90 Control Type: Actuated-Uncoordinated Maximum v/c Ratio: 0.84 Intersection Signal Delay: 24.5 Intersection LOS: C Intersection Capacity Utilization 93.7% ICU Level of Service F Analysis Period (min) 15 # 95th percentile volume exceeds capacity, queue may be longer. West Campus Transportation Impact Assessment Synchro 7 - Report Latest Geometry Page 14
198 Lanes, Volumes, Timings 2039 Post Development 26: West Campus Way & West Campus Drive AM Peak Hour Queue shown is maximum after two cycles. Splits and Phases: 26: West Campus Way & West Campus Drive West Campus Transportation Impact Assessment Synchro 7 - Report Latest Geometry Page 15
199 Lanes, Volumes, Timings 2039 Post Development 51: Oki Drive / ACH & West Campus Drive AM Peak Hour Lane Group EBL EBT EBR WBL WBT WBR NBL NBT NBR SBL SBT SBR Lane Configurations Volume (vph) Ideal Flow (vphpl) Lane Util. Factor Ped Bike Factor Frt Flt Protected Satd. Flow (prot) Flt Permitted Satd. Flow (perm) Right Turn on Red Yes Yes Yes Yes Satd. Flow (RTOR) Link Speed (k/h) Link Distance (m) Travel Time (s) Confl. Peds. (#/hr) Confl. Bikes (#/hr) Peak Hour Factor Heavy Vehicles (%) 5% 5% 5% 5% 5% 5% 5% 5% 5% 5% 5% 5% Bus Blockages (#/hr) Adj. Flow (vph) Shared Lane Traffic (%) Lane Group Flow (vph) Enter Blocked Intersection No No No No No No No No No No No No Lane Alignment Left Left Right Left Left Right Left Left Right Left Left Right Median Width(m) Link Offset(m) Crosswalk Width(m) Two way Left Turn Lane Headway Factor Turning Speed (k/h) Number of Detectors Detector Template Left Thru Left Thru Left Thru Left Thru Leading Detector (m) Trailing Detector (m) Detector 1 Position(m) Detector 1 Size(m) Detector 1 Type Cl+Ex Cl+Ex Cl+Ex Cl+Ex Cl+Ex Cl+Ex Cl+Ex Cl+Ex Detector 1 Channel Detector 1 Extend (s) Detector 1 Queue (s) Detector 1 Delay (s) Turn Type Perm Perm Perm Perm Protected Phases Permitted Phases Detector Phase Switch Phase Minimum Initial (s) Minimum Split (s) West Campus Transportation Impact Assessment Synchro 7 - Report Latest Geometry Page 25
200 Lanes, Volumes, Timings 2039 Post Development 51: Oki Drive / ACH & West Campus Drive AM Peak Hour Lane Group EBL EBT EBR WBL WBT WBR NBL NBT NBR SBL SBT SBR Total Split (s) Total Split (%) 41.7% 41.7% 0.0% 41.7% 41.7% 0.0% % % Maximum Green (s) Yellow Time (s) All-Red Time (s) Lost Time Adjust (s) Total Lost Time (s) Lead/Lag Lead-Lag Optimize? Vehicle Extension (s) Recall Mode None None None None Min Min Min Min Walk Time (s) Flash Dont Walk (s) Pedestrian Calls (#/hr) Act Effct Green (s) Actuated g/c Ratio v/c Ratio Control Delay Queue Delay Total Delay LOS B A A A B Approach Delay Approach LOS A A A B Queue Length 50th (m) Queue Length 95th (m) #77.2 Internal Link Dist (m) Turn Bay Length (m) Base Capacity (vph) Starvation Cap Reductn Spillback Cap Reductn Storage Cap Reductn Reduced v/c Ratio Intersection Summary Area Type: Other Cycle Length: 60 Actuated Cycle Length: 44.5 Natural Cycle: 60 Control Type: Actuated-Uncoordinated Maximum v/c Ratio: 0.58 Intersection Signal Delay: 9.9 Intersection LOS: A Intersection Capacity Utilization 78.7% ICU Level of Service D Analysis Period (min) 15 # 95th percentile volume exceeds capacity, queue may be longer. Queue shown is maximum after two cycles. West Campus Transportation Impact Assessment Synchro 7 - Report Latest Geometry Page 26
201 Lanes, Volumes, Timings 2039 Post Development 51: Oki Drive / ACH & West Campus Drive AM Peak Hour Splits and Phases: 51: Oki Drive / ACH & West Campus Drive West Campus Transportation Impact Assessment Synchro 7 - Report Latest Geometry Page 27
202 Lanes, Volumes, Timings 2039 Post Development 13: 24 Ave NW & West Campus Drive AM Peak Hour Lane Group EBL EBT EBR WBL WBT WBR NBL NBT NBR SBL SBT SBR Lane Configurations Volume (vph) Ideal Flow (vphpl) Lane Width (m) Storage Length (m) Storage Lanes Taper Length (m) Lane Util. Factor Ped Bike Factor Frt Flt Protected Satd. Flow (prot) Flt Permitted Satd. Flow (perm) Right Turn on Red Yes Yes Yes Yes Satd. Flow (RTOR) Link Speed (k/h) Link Distance (m) Travel Time (s) Confl. Peds. (#/hr) Confl. Bikes (#/hr) Peak Hour Factor Heavy Vehicles (%) 5% 5% 5% 5% 5% 5% 5% 5% 5% 5% 5% 5% Bus Blockages (#/hr) Parking (#/hr) 0 0 Adj. Flow (vph) Shared Lane Traffic (%) Lane Group Flow (vph) Enter Blocked Intersection No No No No No No No No No No No No Lane Alignment Left Left Right Left Left Right Left Left Right Left Left Right Median Width(m) Link Offset(m) Crosswalk Width(m) Two way Left Turn Lane Headway Factor Turning Speed (k/h) Number of Detectors Detector Template Left Left Left Left Leading Detector (m) Trailing Detector (m) Detector 1 Position(m) Detector 1 Size(m) Detector 1 Type Cl+Ex Cl+Ex Cl+Ex Cl+Ex Cl+Ex Cl+Ex Cl+Ex Cl+Ex Detector 1 Channel Detector 1 Extend (s) Detector 1 Queue (s) Detector 1 Delay (s) Turn Type pm+pt Perm Perm pm+pt Protected Phases West Campus Transportation Impact Assessment Synchro 7 - Report Latest Geometry Page 7
203 Lanes, Volumes, Timings 2039 Post Development 13: 24 Ave NW & West Campus Drive AM Peak Hour Lane Group EBL EBT EBR WBL WBT WBR NBL NBT NBR SBL SBT SBR Permitted Phases Detector Phase Switch Phase Minimum Initial (s) Minimum Split (s) Total Split (s) Total Split (%) % 0.0% % 20.8% 20.8% 0.0% 41.7% 62.5% 0.0% Maximum Green (s) Yellow Time (s) All-Red Time (s) Lost Time Adjust (s) Total Lost Time (s) Lead/Lag Lead Lag Lag Lag Lag Lead Lead-Lag Optimize? Yes Yes Yes Yes Yes Yes Vehicle Extension (s) Recall Mode None Min Min Min None None None None Walk Time (s) Flash Dont Walk (s) Pedestrian Calls (#/hr) Act Effct Green (s) Actuated g/c Ratio v/c Ratio Control Delay Queue Delay Total Delay LOS E C C D E A Approach Delay Approach LOS E C D D Queue Length 50th (m) Queue Length 95th (m) # #56.7 #55.2 # Internal Link Dist (m) Turn Bay Length (m) Base Capacity (vph) Starvation Cap Reductn Spillback Cap Reductn Storage Cap Reductn Reduced v/c Ratio Intersection Summary Area Type: Other Cycle Length: 120 Actuated Cycle Length: Natural Cycle: 100 Control Type: Actuated-Uncoordinated Maximum v/c Ratio: 0.94 Intersection Signal Delay: 46.4 Intersection LOS: D Intersection Capacity Utilization 113. ICU Level of Service H Analysis Period (min) 15 # 95th percentile volume exceeds capacity, queue may be longer. West Campus Transportation Impact Assessment Synchro 7 - Report Latest Geometry Page 8
204 Lanes, Volumes, Timings 2039 Post Development 13: 24 Ave NW & West Campus Drive AM Peak Hour Queue shown is maximum after two cycles. Splits and Phases: 13: 24 Ave NW & West Campus Drive West Campus Transportation Impact Assessment Synchro 7 - Report Latest Geometry Page 9
205 HCM Unsignalized Intersection Capacity Analysis 2039 Post Development 4: Childrens Way & West Campus Blvd AM Peak Hour Movement EBT EBR WBL WBT NBL NBR Lane Configurations Volume (veh/h) Sign Control Free Free Stop Grade 0% 0% 0% Peak Hour Factor Hourly flow rate (vph) Pedestrians Lane Width (m) Walking Speed (m/s) Percent Blockage Right turn flare (veh) Median type None None Median storage veh) Upstream signal (m) 270 px, platoon unblocked vc, conflicting volume vc1, stage 1 conf vol vc2, stage 2 conf vol vcu, unblocked vol tc, single (s) tc, 2 stage (s) tf (s) p0 queue free % cm capacity (veh/h) Direction, Lane # EB 1 WB 1 WB 2 NB 1 NB 2 Volume Total Volume Left Volume Right csh Volume to Capacity Queue Length 95th (m) Control Delay (s) Lane LOS A C B Approach Delay (s) Approach LOS B Intersection Summary Average Delay 10.4 Intersection Capacity Utilization 37. ICU Level of Service A Analysis Period (min) 15 West Campus Transportation Impact Assessment Synchro 7 - Report Latest Geometry Page 1
206 Lanes, Volumes, Timings 2039 Post Development 1: TCH Ramp & West Campus Blvd AM Peak Hour Lane Group WBL WBR NBT NBR SBL SBT Lane Configurations Volume (vph) Ideal Flow (vphpl) Lane Width (m) Storage Length (m) Storage Lanes Taper Length (m) Lane Util. Factor Ped Bike Factor Frt Flt Protected Satd. Flow (prot) Flt Permitted Satd. Flow (perm) Right Turn on Red Yes Yes Satd. Flow (RTOR) Link Speed (k/h) Link Distance (m) Travel Time (s) Confl. Peds. (#/hr) Peak Hour Factor Heavy Vehicles (%) 5% 5% 5% 5% 5% 5% Adj. Flow (vph) Shared Lane Traffic (%) Lane Group Flow (vph) Enter Blocked Intersection No No No No No No Lane Alignment Left Right Left Right Left Left Median Width(m) Link Offset(m) Crosswalk Width(m) Two way Left Turn Lane Headway Factor Turning Speed (k/h) Number of Detectors Detector Template Left Right Thru Left Thru Leading Detector (m) Trailing Detector (m) Detector 1 Position(m) Detector 1 Size(m) Detector 1 Type Cl+Ex Cl+Ex Cl+Ex Cl+Ex Cl+Ex Detector 1 Channel Detector 1 Extend (s) Detector 1 Queue (s) Detector 1 Delay (s) Turn Type Free pm+pt Protected Phases Permitted Phases Free 6 Detector Phase Switch Phase West Campus Transportation Impact Assessment Synchro 7 - Report Latest Geometry Page 1
207 Lanes, Volumes, Timings 2039 Post Development 1: TCH Ramp & West Campus Blvd AM Peak Hour Lane Group WBL WBR NBT NBR SBL SBT Minimum Initial (s) Minimum Split (s) Total Split (s) Total Split (%) 38.5% 0.0% 38.5% 0.0% % Maximum Green (s) Yellow Time (s) All-Red Time (s) Lost Time Adjust (s) Total Lost Time (s) Lead/Lag Lag Lead Lead-Lag Optimize? Yes Yes Vehicle Extension (s) Recall Mode None Min None Min Walk Time (s) Flash Dont Walk (s) Pedestrian Calls (#/hr) Act Effct Green (s) Actuated g/c Ratio v/c Ratio Control Delay Queue Delay Total Delay LOS B A B A A Approach Delay Approach LOS A B A Queue Length 50th (m) Queue Length 95th (m) # Internal Link Dist (m) Turn Bay Length (m) 30.0 Base Capacity (vph) Starvation Cap Reductn Spillback Cap Reductn Storage Cap Reductn Reduced v/c Ratio Intersection Summary Area Type: Other Cycle Length: 65 Actuated Cycle Length: 49.5 Natural Cycle: 65 Control Type: Actuated-Uncoordinated Maximum v/c Ratio: 0.56 Intersection Signal Delay: 7.7 Intersection LOS: A Intersection Capacity Utilization 59. ICU Level of Service B Analysis Period (min) 15 # 95th percentile volume exceeds capacity, queue may be longer. Queue shown is maximum after two cycles. West Campus Transportation Impact Assessment Synchro 7 - Report Latest Geometry Page 2
208 Lanes, Volumes, Timings 2039 Post Development 1: TCH Ramp & West Campus Blvd AM Peak Hour Splits and Phases: 1: TCH Ramp & West Campus Blvd West Campus Transportation Impact Assessment Synchro 7 - Report Latest Geometry Page 3
209 Lanes, Volumes, Timings 2039 Post Development 9: West Campus Blvd & TCH Ramp AM Peak Hour Lane Group EBL EBT EBR WBL WBT WBR NBL NBT NBR SBL SBT SBR Lane Configurations Volume (vph) Ideal Flow (vphpl) Storage Length (m) Storage Lanes Taper Length (m) Lane Util. Factor Ped Bike Factor Frt Flt Protected Satd. Flow (prot) Flt Permitted Satd. Flow (perm) Right Turn on Red Yes Yes Yes Yes Satd. Flow (RTOR) Link Speed (k/h) Link Distance (m) Travel Time (s) Confl. Peds. (#/hr) Peak Hour Factor Heavy Vehicles (%) 5% 5% 5% 5% 5% 5% 5% 5% 5% 5% 5% 5% Adj. Flow (vph) Shared Lane Traffic (%) Lane Group Flow (vph) Enter Blocked Intersection No No No No No No No No No No No No Lane Alignment Left Left Right Left Left Right Left Left Right Left Left Right Median Width(m) Link Offset(m) Crosswalk Width(m) Two way Left Turn Lane Headway Factor Turning Speed (k/h) Number of Detectors Detector Template Left Thru Left Thru Right Left Thru Left Thru Right Leading Detector (m) Trailing Detector (m) Detector 1 Position(m) Detector 1 Size(m) Detector 1 Type Cl+Ex Cl+Ex Cl+Ex Cl+Ex Cl+Ex Cl+Ex Cl+Ex Cl+Ex Cl+Ex Cl+Ex Detector 1 Channel Detector 1 Extend (s) Detector 1 Queue (s) Detector 1 Delay (s) Turn Type pm+pt Perm Perm Perm Perm Perm Protected Phases Permitted Phases Detector Phase Switch Phase Minimum Initial (s) West Campus Transportation Impact Assessment Synchro 7 - Report Latest Geometry Page 4
210 Lanes, Volumes, Timings 2039 Post Development 9: West Campus Blvd & TCH Ramp AM Peak Hour Lane Group EBL EBT EBR WBL WBT WBR NBL NBT NBR SBL SBT SBR Minimum Split (s) Total Split (s) Total Split (%) % 0.0% 38.5% 38.5% 38.5% 38.5% 38.5% 0.0% 38.5% 38.5% 38.5% Maximum Green (s) Yellow Time (s) All-Red Time (s) Lost Time Adjust (s) Total Lost Time (s) Lead/Lag Lead Lag Lag Lag Lead-Lag Optimize? Yes Yes Yes Yes Vehicle Extension (s) Recall Mode None None None None None Min Min Min Min Min Walk Time (s) Flash Dont Walk (s) Pedestrian Calls (#/hr) Act Effct Green (s) Actuated g/c Ratio v/c Ratio Control Delay Queue Delay Total Delay LOS C A C A B B C B A Approach Delay Approach LOS B B B B Queue Length 50th (m) Queue Length 95th (m) # # Internal Link Dist (m) Turn Bay Length (m) Base Capacity (vph) Starvation Cap Reductn Spillback Cap Reductn Storage Cap Reductn Reduced v/c Ratio Intersection Summary Area Type: Other Cycle Length: 65 Actuated Cycle Length: 54.2 Natural Cycle: 65 Control Type: Actuated-Uncoordinated Maximum v/c Ratio: 0.81 Intersection Signal Delay: 16.1 Intersection LOS: B Intersection Capacity Utilization 78.7% ICU Level of Service D Analysis Period (min) 15 # 95th percentile volume exceeds capacity, queue may be longer. Queue shown is maximum after two cycles. West Campus Transportation Impact Assessment Synchro 7 - Report Latest Geometry Page 5
211 Lanes, Volumes, Timings 2039 Post Development 9: West Campus Blvd & TCH Ramp AM Peak Hour Splits and Phases: 9: West Campus Blvd & TCH Ramp West Campus Transportation Impact Assessment Synchro 7 - Report Latest Geometry Page 6
212 Lanes, Volumes, Timings 2039 Post Development 24: 32 Ave NW & Shaganappi Trail PM Peak Hour Lane Group EBL EBT EBR WBL WBT WBR NBL NBT NBR SBL SBT SBR Lane Configurations Volume (vph) Ideal Flow (vphpl) Storage Length (m) Storage Lanes Taper Length (m) Lane Util. Factor Ped Bike Factor Frt Flt Protected Satd. Flow (prot) Flt Permitted Satd. Flow (perm) Right Turn on Red Yes Yes Yes Yes Satd. Flow (RTOR) Link Speed (k/h) Link Distance (m) Travel Time (s) Confl. Peds. (#/hr) Confl. Bikes (#/hr) Peak Hour Factor Heavy Vehicles (%) 5% 5% 5% 5% 5% 5% 5% 5% 5% 5% 5% 5% Bus Blockages (#/hr) Adj. Flow (vph) Shared Lane Traffic (%) Lane Group Flow (vph) Enter Blocked Intersection No No No No No No No No No No No No Lane Alignment Left Left Right Left Left Right Left Left Right Left Left Right Median Width(m) Link Offset(m) Crosswalk Width(m) Two way Left Turn Lane Headway Factor Turning Speed (k/h) Number of Detectors Detector Template Left Thru Left Thru Right Left Thru Right Left Thru Right Leading Detector (m) Trailing Detector (m) Detector 1 Position(m) Detector 1 Size(m) Detector 1 Type Cl+Ex Cl+Ex Cl+Ex Cl+Ex Cl+Ex Cl+Ex Cl+Ex Cl+Ex Cl+Ex Cl+Ex Cl+Ex Detector 1 Channel Detector 1 Extend (s) Detector 1 Queue (s) Detector 1 Delay (s) Turn Type pm+pt pm+pt Free pm+pt Perm pm+pt Perm Protected Phases Permitted Phases 4 8 Free Detector Phase West Campus Transportation Impact Assessment Synchro 7 - Report Updated Geometry Page 10
213 Lanes, Volumes, Timings 2039 Post Development 24: 32 Ave NW & Shaganappi Trail PM Peak Hour Lane Group EBL EBT EBR WBL WBT WBR NBL NBT NBR SBL SBT SBR Switch Phase Minimum Initial (s) Minimum Split (s) Total Split (s) Total Split (%) 14.7% % 10.0% 18.7% 0.0% 24.7% 52.7% 52.7% 14.0% 42.0% 42.0% Maximum Green (s) Yellow Time (s) All-Red Time (s) Lost Time Adjust (s) Total Lost Time (s) Lead/Lag Lead Lag Lead Lag Lead Lag Lag Lead Lag Lag Lead-Lag Optimize? Yes Yes Yes Yes Yes Yes Yes Yes Yes Yes Vehicle Extension (s) Recall Mode None None None None None Min Min None Min Min Walk Time (s) Flash Dont Walk (s) Pedestrian Calls (#/hr) Act Effct Green (s) Actuated g/c Ratio v/c Ratio Control Delay Queue Delay Total Delay LOS F F E F A E F A F D A Approach Delay Approach LOS F E E E Queue Length 50th (m) ~103.5 ~ ~ ~ ~ Queue Length 95th (m) #167.3 #167.0 #44.4 # #150.2 # # Internal Link Dist (m) Turn Bay Length (m) Base Capacity (vph) Starvation Cap Reductn Spillback Cap Reductn Storage Cap Reductn Reduced v/c Ratio Intersection Summary Area Type: Other Cycle Length: 150 Actuated Cycle Length: 150 Natural Cycle: 150 Control Type: Actuated-Uncoordinated Maximum v/c Ratio: 1.22 Intersection Signal Delay: 80.5 Intersection LOS: F Intersection Capacity Utilization 113. ICU Level of Service H Analysis Period (min) 15 ~ Volume exceeds capacity, queue is theoretically infinite. Queue shown is maximum after two cycles. # 95th percentile volume exceeds capacity, queue may be longer. West Campus Transportation Impact Assessment Synchro 7 - Report Updated Geometry Page 11
214 Lanes, Volumes, Timings 2039 Post Development 24: 32 Ave NW & Shaganappi Trail PM Peak Hour Queue shown is maximum after two cycles. Splits and Phases: 24: 32 Ave NW & Shaganappi Trail West Campus Transportation Impact Assessment Synchro 7 - Report Updated Geometry Page 12
215 Lanes, Volumes, Timings 2039 Post Development 28: West Campus Way & Shaganappi Trail PM Peak Hour Lane Group WBL WBR NBT NBR SBL SBT Lane Configurations Volume (vph) Ideal Flow (vphpl) Lane Width (m) Storage Length (m) Storage Lanes Taper Length (m) Lane Util. Factor Ped Bike Factor Frt Flt Protected Satd. Flow (prot) Flt Permitted Satd. Flow (perm) Right Turn on Red Yes Yes Satd. Flow (RTOR) Link Speed (k/h) Link Distance (m) Travel Time (s) Confl. Peds. (#/hr) Confl. Bikes (#/hr) Peak Hour Factor Heavy Vehicles (%) 5% 5% 5% 5% 5% 5% Adj. Flow (vph) Shared Lane Traffic (%) Lane Group Flow (vph) Enter Blocked Intersection No No No No No No Lane Alignment Left Right Left Right Left Left Median Width(m) Link Offset(m) Crosswalk Width(m) Two way Left Turn Lane Headway Factor Turning Speed (k/h) Number of Detectors Detector Template Left Right Thru Right Left Thru Leading Detector (m) Trailing Detector (m) Detector 1 Position(m) Detector 1 Size(m) Detector 1 Type Cl+Ex Cl+Ex Cl+Ex Cl+Ex Cl+Ex Cl+Ex Detector 1 Channel Detector 1 Extend (s) Detector 1 Queue (s) Detector 1 Delay (s) Turn Type Free Perm Prot Protected Phases Permitted Phases Free 2 Detector Phase West Campus Transportation Impact Assessment Synchro 7 - Report Updated Geometry Page 16
216 Lanes, Volumes, Timings 2039 Post Development 28: West Campus Way & Shaganappi Trail PM Peak Hour Lane Group WBL WBR NBT NBR SBL SBT Switch Phase Minimum Initial (s) Minimum Split (s) Total Split (s) Total Split (%) 25.0% 0.0% 54.0% 54.0% 21.0% 75.0% Maximum Green (s) Yellow Time (s) All-Red Time (s) Lost Time Adjust (s) Total Lost Time (s) Lead/Lag Lag Lag Lead Lead-Lag Optimize? Yes Yes Yes Vehicle Extension (s) Recall Mode None Min Min None Min Walk Time (s) Flash Dont Walk (s) Pedestrian Calls (#/hr) Act Effct Green (s) Actuated g/c Ratio v/c Ratio Control Delay Queue Delay Total Delay LOS F A D A F A Approach Delay Approach LOS D D D Queue Length 50th (m) ~ ~ Queue Length 95th (m) # # # Internal Link Dist (m) Turn Bay Length (m) Base Capacity (vph) Starvation Cap Reductn Spillback Cap Reductn Storage Cap Reductn Reduced v/c Ratio Intersection Summary Area Type: Other Cycle Length: 100 Actuated Cycle Length: 100 Natural Cycle: 100 Control Type: Actuated-Uncoordinated Maximum v/c Ratio: 1.04 Intersection Signal Delay: 39.6 Intersection LOS: D Intersection Capacity Utilization 88.7% ICU Level of Service E Analysis Period (min) 15 ~ Volume exceeds capacity, queue is theoretically infinite. Queue shown is maximum after two cycles. # 95th percentile volume exceeds capacity, queue may be longer. West Campus Transportation Impact Assessment Synchro 7 - Report Updated Geometry Page 17
217 Lanes, Volumes, Timings 2039 Post Development 28: West Campus Way & Shaganappi Trail PM Peak Hour Queue shown is maximum after two cycles. Splits and Phases: 28: West Campus Way & Shaganappi Trail West Campus Transportation Impact Assessment Synchro 7 - Report Updated Geometry Page 18
218 Lanes, Volumes, Timings 2039 Post Development 35: 32 Ave NW & 39 Street NW PM Peak Hour Lane Group EBL EBT EBR WBL WBT WBR NBL NBT NBR SBL SBT SBR Lane Configurations Volume (vph) Ideal Flow (vphpl) Lane Width (m) Storage Length (m) Storage Lanes Taper Length (m) Lane Util. Factor Ped Bike Factor Frt Flt Protected Satd. Flow (prot) Flt Permitted Satd. Flow (perm) Right Turn on Red Yes Yes Yes Yes Satd. Flow (RTOR) Link Speed (k/h) Link Distance (m) Travel Time (s) Confl. Peds. (#/hr) Confl. Bikes (#/hr) Peak Hour Factor Heavy Vehicles (%) 5% 5% 5% 5% 5% 5% 5% 5% 5% 5% 5% 5% Bus Blockages (#/hr) Adj. Flow (vph) Shared Lane Traffic (%) Lane Group Flow (vph) Enter Blocked Intersection No No No No No No No No No No No No Lane Alignment Left Left Right Left Left Right Left Left Right Left Left Right Median Width(m) Link Offset(m) Crosswalk Width(m) Two way Left Turn Lane Headway Factor Turning Speed (k/h) Number of Detectors Detector Template Left Thru Left Thru Left Right Left Thru Leading Detector (m) Trailing Detector (m) Detector 1 Position(m) Detector 1 Size(m) Detector 1 Type Cl+Ex Cl+Ex Cl+Ex Cl+Ex Cl+Ex Cl+Ex Cl+Ex Cl+Ex Detector 1 Channel Detector 1 Extend (s) Detector 1 Queue (s) Detector 1 Delay (s) Turn Type pm+pt pm+pt Prot custom Perm Protected Phases Permitted Phases West Campus Transportation Impact Assessment Synchro 7 - Report Updated Geometry Page 19
219 Lanes, Volumes, Timings 2039 Post Development 35: 32 Ave NW & 39 Street NW PM Peak Hour Lane Group EBL EBT EBR WBL WBT WBR NBL NBT NBR SBL SBT SBR Detector Phase Switch Phase Minimum Initial (s) Minimum Split (s) Total Split (s) Total Split (%) 10.8% 40.0% 0.0% % 25.0% 0.0% 45.8% 20.8% 20.8% 0.0% Maximum Green (s) Yellow Time (s) All-Red Time (s) Lost Time Adjust (s) Total Lost Time (s) Lead/Lag Lead Lag Lead Lag Lead Lag Lag Lead-Lag Optimize? Yes Yes Yes Yes Yes Yes Yes Vehicle Extension (s) Recall Mode None Min None Min None None None None Walk Time (s) Flash Dont Walk (s) Pedestrian Calls (#/hr) Act Effct Green (s) Actuated g/c Ratio v/c Ratio Control Delay Queue Delay Total Delay LOS B C B C D A D Approach Delay Approach LOS C C D Queue Length 50th (m) Queue Length 95th (m) Internal Link Dist (m) Turn Bay Length (m) Base Capacity (vph) Starvation Cap Reductn Spillback Cap Reductn Storage Cap Reductn Reduced v/c Ratio Intersection Summary Area Type: Other Cycle Length: 120 Actuated Cycle Length: 92.6 Natural Cycle: 90 Control Type: Actuated-Uncoordinated Maximum v/c Ratio: 0.73 Intersection Signal Delay: 28.2 Intersection Capacity Utilization 69. Analysis Period (min) 15 Intersection LOS: C ICU Level of Service C West Campus Transportation Impact Assessment Synchro 7 - Report Updated Geometry Page 20
220 Lanes, Volumes, Timings 2039 Post Development 35: 32 Ave NW & 39 Street NW PM Peak Hour Splits and Phases: 35: 32 Ave NW & 39 Street NW West Campus Transportation Impact Assessment Synchro 7 - Report Updated Geometry Page 21
221 Lanes, Volumes, Timings 2039 Post Development 37: 32 Ave NW & Collegiate Blvd PM Peak Hour Lane Group EBT EBR WBL WBT NBL NBR Lane Configurations Volume (vph) Ideal Flow (vphpl) Storage Length (m) Storage Lanes Taper Length (m) Lane Util. Factor Ped Bike Factor Frt Flt Protected Satd. Flow (prot) Flt Permitted Satd. Flow (perm) Right Turn on Red Yes Yes Satd. Flow (RTOR) Link Speed (k/h) Link Distance (m) Travel Time (s) Confl. Peds. (#/hr) Confl. Bikes (#/hr) Peak Hour Factor Heavy Vehicles (%) 5% 5% 5% 5% 5% 5% Bus Blockages (#/hr) Adj. Flow (vph) Shared Lane Traffic (%) Lane Group Flow (vph) Enter Blocked Intersection No No No No No No Lane Alignment Left Right Left Left Left Right Median Width(m) Link Offset(m) Crosswalk Width(m) Two way Left Turn Lane Headway Factor Turning Speed (k/h) Number of Detectors Detector Template Thru Right Left Thru Left Right Leading Detector (m) Trailing Detector (m) Detector 1 Position(m) Detector 1 Size(m) Detector 1 Type Cl+Ex Cl+Ex Cl+Ex Cl+Ex Cl+Ex Cl+Ex Detector 1 Channel Detector 1 Extend (s) Detector 1 Queue (s) Detector 1 Delay (s) Turn Type Free pm+pt Perm Protected Phases Permitted Phases Free 6 8 Detector Phase West Campus Transportation Impact Assessment Synchro 7 - Report Updated Geometry Page 22
222 Lanes, Volumes, Timings 2039 Post Development 37: 32 Ave NW & Collegiate Blvd PM Peak Hour Lane Group EBT EBR WBL WBT NBL NBR Switch Phase Minimum Initial (s) Minimum Split (s) Total Split (s) Total Split (%) 41.5% 0.0% 20.0% 61.5% 38.5% 38.5% Maximum Green (s) Yellow Time (s) All-Red Time (s) Lost Time Adjust (s) Total Lost Time (s) Lead/Lag Lag Lead Lead-Lag Optimize? Yes Yes Vehicle Extension (s) Recall Mode Min None Min None None Walk Time (s) Flash Dont Walk (s) Pedestrian Calls (#/hr) Act Effct Green (s) Actuated g/c Ratio v/c Ratio Control Delay Queue Delay Total Delay LOS B A A A C A Approach Delay Approach LOS B A B Queue Length 50th (m) Queue Length 95th (m) Internal Link Dist (m) Turn Bay Length (m) Base Capacity (vph) Starvation Cap Reductn Spillback Cap Reductn Storage Cap Reductn Reduced v/c Ratio Intersection Summary Area Type: Other Cycle Length: 65 Actuated Cycle Length: 56 Natural Cycle: 65 Control Type: Actuated-Uncoordinated Maximum v/c Ratio: 0.67 Intersection Signal Delay: 12.0 Intersection Capacity Utilization 55. Analysis Period (min) 15 Intersection LOS: B ICU Level of Service B West Campus Transportation Impact Assessment Synchro 7 - Report Updated Geometry Page 23
223 Lanes, Volumes, Timings 2039 Post Development 37: 32 Ave NW & Collegiate Blvd PM Peak Hour Splits and Phases: 37: 32 Ave NW & Collegiate Blvd West Campus Transportation Impact Assessment Synchro 7 - Report Updated Geometry Page 24
224 HCM Unsignalized Intersection Capacity Analysis 2039 Post Development 38: Collegiate Rd & Collegiate Blvd PM Peak Hour Movement EBL EBT WBT WBR SBL SBR Lane Configurations Sign Control Stop Stop Stop Volume (vph) Peak Hour Factor Hourly flow rate (vph) Direction, Lane # EB 1 EB 2 WB 1 WB 2 SB 1 SB 2 Volume Total (vph) Volume Left (vph) Volume Right (vph) Hadj (s) Departure Headway (s) Degree Utilization, x Capacity (veh/h) Control Delay (s) Approach Delay (s) Approach LOS B A B Intersection Summary Delay 10.8 HCM Level of Service B Intersection Capacity Utilization 47.6% ICU Level of Service A Analysis Period (min) 15 West Campus Transportation Impact Assessment Synchro 7 - Report Updated Geometry Page 3
225 HCM Unsignalized Intersection Capacity Analysis 2039 Post Development 36: West Campus Way & 39 Street NW PM Peak Hour Movement EBL EBT WBT WBR SBL SBR Lane Configurations Volume (veh/h) Sign Control Free Free Stop Grade 0% 0% 0% Peak Hour Factor Hourly flow rate (vph) Pedestrians Lane Width (m) Walking Speed (m/s) Percent Blockage Right turn flare (veh) Median type None None Median storage veh) Upstream signal (m) 216 px, platoon unblocked vc, conflicting volume vc1, stage 1 conf vol vc2, stage 2 conf vol vcu, unblocked vol tc, single (s) tc, 2 stage (s) tf (s) p0 queue free % cm capacity (veh/h) Direction, Lane # EB 1 EB 2 WB 1 WB 2 SB 1 SB 2 Volume Total Volume Left Volume Right csh Volume to Capacity Queue Length 95th (m) Err 22.1 Control Delay (s) Err 20.5 Lane LOS C F C Approach Delay (s) Approach LOS F Intersection Summary Average Delay Intersection Capacity Utilization 70.9% ICU Level of Service C Analysis Period (min) 15 West Campus Transportation Impact Assessment Synchro 7 - Report Updated Geometry Page 2
226 Lanes, Volumes, Timings 2039 Post Development 26: West Campus Way & West Campus Drive PM Peak Hour Lane Group EBL EBT EBR WBL WBT WBR NBL NBT NBR SBL SBT SBR Lane Configurations Volume (vph) Ideal Flow (vphpl) Lane Width (m) Storage Length (m) Storage Lanes Taper Length (m) Lane Util. Factor Ped Bike Factor Frt Flt Protected Satd. Flow (prot) Flt Permitted Satd. Flow (perm) Right Turn on Red Yes Yes Yes Yes Satd. Flow (RTOR) Link Speed (k/h) Link Distance (m) Travel Time (s) Confl. Peds. (#/hr) Confl. Bikes (#/hr) Peak Hour Factor Heavy Vehicles (%) 5% 5% 5% 5% 5% 5% 5% 5% 5% 5% 5% 5% Bus Blockages (#/hr) Parking (#/hr) 0 0 Adj. Flow (vph) Shared Lane Traffic (%) Lane Group Flow (vph) Enter Blocked Intersection No No No No No No No No No No No No Lane Alignment Left Left Right Left Left Right Left Left Right Left Left Right Median Width(m) Link Offset(m) Crosswalk Width(m) Two way Left Turn Lane Headway Factor Turning Speed (k/h) Number of Detectors Detector Template Left Thru Left Thru Left Thru Right Left Thru Leading Detector (m) Trailing Detector (m) Detector 1 Position(m) Detector 1 Size(m) Detector 1 Type Cl+Ex Cl+Ex Cl+Ex Cl+Ex Cl+Ex Cl+Ex Cl+Ex Cl+Ex Cl+Ex Detector 1 Channel Detector 1 Extend (s) Detector 1 Queue (s) Detector 1 Delay (s) Turn Type pm+pt pm+pt pm+pt Perm Perm Protected Phases West Campus Transportation Impact Assessment Synchro 7 - Report Updated Geometry Page 13
227 Lanes, Volumes, Timings 2039 Post Development 26: West Campus Way & West Campus Drive PM Peak Hour Lane Group EBL EBT EBR WBL WBT WBR NBL NBT NBR SBL SBT SBR Permitted Phases Detector Phase Switch Phase Minimum Initial (s) Minimum Split (s) Total Split (s) Total Split (%) 12.5% 35.0% 0.0% 12.5% 35.0% 0.0% 22.5% 52.5% 52.5% 30.0% 30.0% 0.0% Maximum Green (s) Yellow Time (s) All-Red Time (s) Lost Time Adjust (s) Total Lost Time (s) Lead/Lag Lead Lag Lead Lag Lead Lag Lag Lead-Lag Optimize? Yes Yes Yes Yes Yes Yes Yes Vehicle Extension (s) Recall Mode None Min None Min None None None None None Walk Time (s) Flash Dont Walk (s) Pedestrian Calls (#/hr) Act Effct Green (s) Actuated g/c Ratio v/c Ratio Control Delay Queue Delay Total Delay LOS C D C C D B B D Approach Delay Approach LOS D C C D Queue Length 50th (m) Queue Length 95th (m) # #81.2 Internal Link Dist (m) Turn Bay Length (m) Base Capacity (vph) Starvation Cap Reductn Spillback Cap Reductn Storage Cap Reductn Reduced v/c Ratio Intersection Summary Area Type: Other Cycle Length: 120 Actuated Cycle Length: Natural Cycle: 90 Control Type: Actuated-Uncoordinated Maximum v/c Ratio: 0.89 Intersection Signal Delay: 32.0 Intersection LOS: C Intersection Capacity Utilization 94.8% ICU Level of Service F Analysis Period (min) 15 # 95th percentile volume exceeds capacity, queue may be longer. West Campus Transportation Impact Assessment Synchro 7 - Report Updated Geometry Page 14
228 Lanes, Volumes, Timings 2039 Post Development 26: West Campus Way & West Campus Drive PM Peak Hour Queue shown is maximum after two cycles. Splits and Phases: 26: West Campus Way & West Campus Drive West Campus Transportation Impact Assessment Synchro 7 - Report Updated Geometry Page 15
229 Lanes, Volumes, Timings 2039 Post Development 51: Oki Drive / ACH & West Campus Drive PM Peak Hour Lane Group EBL EBT EBR WBL WBT WBR NBL NBT NBR SBL SBT SBR Lane Configurations Volume (vph) Ideal Flow (vphpl) Lane Util. Factor Ped Bike Factor Frt Flt Protected Satd. Flow (prot) Flt Permitted Satd. Flow (perm) Right Turn on Red Yes Yes Yes Yes Satd. Flow (RTOR) Link Speed (k/h) Link Distance (m) Travel Time (s) Confl. Peds. (#/hr) Confl. Bikes (#/hr) Peak Hour Factor Heavy Vehicles (%) 5% 5% 5% 5% 5% 5% 5% 5% 5% 5% 5% 5% Bus Blockages (#/hr) Adj. Flow (vph) Shared Lane Traffic (%) Lane Group Flow (vph) Enter Blocked Intersection No No No No No No No No No No No No Lane Alignment Left Left Right Left Left Right Left Left Right Left Left Right Median Width(m) Link Offset(m) Crosswalk Width(m) Two way Left Turn Lane Headway Factor Turning Speed (k/h) Number of Detectors Detector Template Left Thru Left Thru Left Thru Left Thru Leading Detector (m) Trailing Detector (m) Detector 1 Position(m) Detector 1 Size(m) Detector 1 Type Cl+Ex Cl+Ex Cl+Ex Cl+Ex Cl+Ex Cl+Ex Cl+Ex Cl+Ex Detector 1 Channel Detector 1 Extend (s) Detector 1 Queue (s) Detector 1 Delay (s) Turn Type Perm Perm Perm Perm Protected Phases Permitted Phases Detector Phase Switch Phase Minimum Initial (s) Minimum Split (s) West Campus Transportation Impact Assessment Synchro 7 - Report Updated Geometry Page 25
230 Lanes, Volumes, Timings 2039 Post Development 51: Oki Drive / ACH & West Campus Drive PM Peak Hour Lane Group EBL EBT EBR WBL WBT WBR NBL NBT NBR SBL SBT SBR Total Split (s) Total Split (%) 41.7% 41.7% 0.0% 41.7% 41.7% 0.0% % % Maximum Green (s) Yellow Time (s) All-Red Time (s) Lost Time Adjust (s) Total Lost Time (s) Lead/Lag Lead-Lag Optimize? Vehicle Extension (s) Recall Mode None None None None Min Min Min Min Walk Time (s) Flash Dont Walk (s) Pedestrian Calls (#/hr) Act Effct Green (s) Actuated g/c Ratio v/c Ratio Control Delay Queue Delay Total Delay LOS B A A B A Approach Delay Approach LOS A A B A Queue Length 50th (m) Queue Length 95th (m) Internal Link Dist (m) Turn Bay Length (m) Base Capacity (vph) Starvation Cap Reductn Spillback Cap Reductn Storage Cap Reductn Reduced v/c Ratio Intersection Summary Area Type: Other Cycle Length: 60 Actuated Cycle Length: 45.8 Natural Cycle: 55 Control Type: Actuated-Uncoordinated Maximum v/c Ratio: 0.61 Intersection Signal Delay: 9.9 Intersection Capacity Utilization 73.8% Analysis Period (min) 15 Intersection LOS: A ICU Level of Service D West Campus Transportation Impact Assessment Synchro 7 - Report Updated Geometry Page 26
231 Lanes, Volumes, Timings 2039 Post Development 51: Oki Drive / ACH & West Campus Drive PM Peak Hour Splits and Phases: 51: Oki Drive / ACH & West Campus Drive West Campus Transportation Impact Assessment Synchro 7 - Report Updated Geometry Page 27
232 Lanes, Volumes, Timings 2039 Post Development 13: 24 Ave NW & West Campus Drive PM Peak Hour Lane Group EBL EBT EBR WBL WBT WBR NBL NBT NBR SBL SBT SBR Lane Configurations Volume (vph) Ideal Flow (vphpl) Lane Width (m) Storage Length (m) Storage Lanes Taper Length (m) Lane Util. Factor Ped Bike Factor Frt Flt Protected Satd. Flow (prot) Flt Permitted Satd. Flow (perm) Right Turn on Red Yes Yes Yes Yes Satd. Flow (RTOR) Link Speed (k/h) Link Distance (m) Travel Time (s) Confl. Peds. (#/hr) Confl. Bikes (#/hr) Peak Hour Factor Heavy Vehicles (%) 5% 5% 5% 5% 5% 5% 5% 5% 5% 5% 5% 5% Bus Blockages (#/hr) Parking (#/hr) 0 0 Adj. Flow (vph) Shared Lane Traffic (%) Lane Group Flow (vph) Enter Blocked Intersection No No No No No No No No No No No No Lane Alignment Left Left Right Left Left Right Left Left Right Left Left Right Median Width(m) Link Offset(m) Crosswalk Width(m) Two way Left Turn Lane Headway Factor Turning Speed (k/h) Number of Detectors Detector Template Left Left Left Left Leading Detector (m) Trailing Detector (m) Detector 1 Position(m) Detector 1 Size(m) Detector 1 Type Cl+Ex Cl+Ex Cl+Ex Cl+Ex Cl+Ex Cl+Ex Cl+Ex Cl+Ex Detector 1 Channel Detector 1 Extend (s) Detector 1 Queue (s) Detector 1 Delay (s) Turn Type pm+pt Perm Perm pm+pt Protected Phases West Campus Transportation Impact Assessment Synchro 7 - Report Updated Geometry Page 7
233 Lanes, Volumes, Timings 2039 Post Development 13: 24 Ave NW & West Campus Drive PM Peak Hour Lane Group EBL EBT EBR WBL WBT WBR NBL NBT NBR SBL SBT SBR Permitted Phases Detector Phase Switch Phase Minimum Initial (s) Minimum Split (s) Total Split (s) Total Split (%) % 0.0% 38.6% 38.6% 0.0% 22.7% 22.7% 0.0% 25.5% % Maximum Green (s) Yellow Time (s) All-Red Time (s) Lost Time Adjust (s) Total Lost Time (s) Lead/Lag Lead Lag Lag Lag Lag Lead Lead-Lag Optimize? Yes Yes Yes Yes Yes Yes Vehicle Extension (s) Recall Mode None Min Min Min None None None None Walk Time (s) Flash Dont Walk (s) Pedestrian Calls (#/hr) Act Effct Green (s) Actuated g/c Ratio v/c Ratio Control Delay Queue Delay Total Delay LOS E B E D F C Approach Delay Approach LOS D E D F Queue Length 50th (m) ~ ~ Queue Length 95th (m) # # # Internal Link Dist (m) Turn Bay Length (m) Base Capacity (vph) Starvation Cap Reductn Spillback Cap Reductn Storage Cap Reductn Reduced v/c Ratio Intersection Summary Area Type: Other Cycle Length: 110 Actuated Cycle Length: 108 Natural Cycle: 110 Control Type: Actuated-Uncoordinated Maximum v/c Ratio: 1.17 Intersection Signal Delay: 75.9 Intersection Capacity Utilization 123.9% Analysis Period (min) 15 ~ Volume exceeds capacity, queue is theoretically infinite. Intersection LOS: E ICU Level of Service H West Campus Transportation Impact Assessment Synchro 7 - Report Updated Geometry Page 8
234 Lanes, Volumes, Timings 2039 Post Development 13: 24 Ave NW & West Campus Drive PM Peak Hour Queue shown is maximum after two cycles. # 95th percentile volume exceeds capacity, queue may be longer. Queue shown is maximum after two cycles. Splits and Phases: 13: 24 Ave NW & West Campus Drive West Campus Transportation Impact Assessment Synchro 7 - Report Updated Geometry Page 9
235 HCM Unsignalized Intersection Capacity Analysis 2039 Post Development 4: Childrens Way & West Campus Blvd PM Peak Hour Movement EBT EBR WBL WBT NBL NBR Lane Configurations Volume (veh/h) Sign Control Free Free Stop Grade 0% 0% 0% Peak Hour Factor Hourly flow rate (vph) Pedestrians Lane Width (m) Walking Speed (m/s) Percent Blockage Right turn flare (veh) Median type None None Median storage veh) Upstream signal (m) 270 px, platoon unblocked vc, conflicting volume vc1, stage 1 conf vol vc2, stage 2 conf vol vcu, unblocked vol tc, single (s) tc, 2 stage (s) tf (s) p0 queue free % cm capacity (veh/h) Direction, Lane # EB 1 WB 1 WB 2 NB 1 NB 2 Volume Total Volume Left Volume Right csh Volume to Capacity Queue Length 95th (m) Control Delay (s) Lane LOS A E B Approach Delay (s) Approach LOS B Intersection Summary Average Delay 9.8 Intersection Capacity Utilization 46. ICU Level of Service A Analysis Period (min) 15 West Campus Transportation Impact Assessment Synchro 7 - Report Updated Geometry Page 1
236 Lanes, Volumes, Timings 2039 Post Development 1: TCH Ramp & West Campus Blvd PM Peak Hour Lane Group WBL WBR NBT NBR SBL SBT Lane Configurations Volume (vph) Ideal Flow (vphpl) Lane Width (m) Storage Length (m) Storage Lanes Taper Length (m) Lane Util. Factor Ped Bike Factor Frt Flt Protected Satd. Flow (prot) Flt Permitted Satd. Flow (perm) Right Turn on Red Yes Yes Satd. Flow (RTOR) Link Speed (k/h) Link Distance (m) Travel Time (s) Confl. Peds. (#/hr) Peak Hour Factor Heavy Vehicles (%) 5% 5% 5% 5% 5% 5% Adj. Flow (vph) Shared Lane Traffic (%) Lane Group Flow (vph) Enter Blocked Intersection No No No No No No Lane Alignment Left Right Left Right Left Left Median Width(m) Link Offset(m) Crosswalk Width(m) Two way Left Turn Lane Headway Factor Turning Speed (k/h) Number of Detectors Detector Template Left Right Thru Left Thru Leading Detector (m) Trailing Detector (m) Detector 1 Position(m) Detector 1 Size(m) Detector 1 Type Cl+Ex Cl+Ex Cl+Ex Cl+Ex Cl+Ex Detector 1 Channel Detector 1 Extend (s) Detector 1 Queue (s) Detector 1 Delay (s) Turn Type Free pm+pt Protected Phases Permitted Phases Free 6 Detector Phase Switch Phase West Campus Transportation Impact Assessment Synchro 7 - Report Updated Geometry Page 1
237 Lanes, Volumes, Timings 2039 Post Development 1: TCH Ramp & West Campus Blvd PM Peak Hour Lane Group WBL WBR NBT NBR SBL SBT Minimum Initial (s) Minimum Split (s) Total Split (s) Total Split (%) % % 24.5% 73.6% Maximum Green (s) Yellow Time (s) All-Red Time (s) Lost Time Adjust (s) Total Lost Time (s) Lead/Lag Lag Lead Lead-Lag Optimize? Yes Yes Vehicle Extension (s) Recall Mode None Min None Min Walk Time (s) Flash Dont Walk (s) Pedestrian Calls (#/hr) Act Effct Green (s) Actuated g/c Ratio v/c Ratio Control Delay Queue Delay Total Delay LOS D A C C A Approach Delay Approach LOS A C B Queue Length 50th (m) Queue Length 95th (m) #237.7 # Internal Link Dist (m) Turn Bay Length (m) 30.0 Base Capacity (vph) Starvation Cap Reductn Spillback Cap Reductn Storage Cap Reductn Reduced v/c Ratio Intersection Summary Area Type: Other Cycle Length: 110 Actuated Cycle Length: 88.7 Natural Cycle: 110 Control Type: Actuated-Uncoordinated Maximum v/c Ratio: 0.83 Intersection Signal Delay: 17.4 Intersection LOS: B Intersection Capacity Utilization 92.6% ICU Level of Service F Analysis Period (min) 15 # 95th percentile volume exceeds capacity, queue may be longer. Queue shown is maximum after two cycles. West Campus Transportation Impact Assessment Synchro 7 - Report Updated Geometry Page 2
238 Lanes, Volumes, Timings 2039 Post Development 1: TCH Ramp & West Campus Blvd PM Peak Hour Splits and Phases: 1: TCH Ramp & West Campus Blvd West Campus Transportation Impact Assessment Synchro 7 - Report Updated Geometry Page 3
239 Lanes, Volumes, Timings 2039 Post Development 9: West Campus Blvd & TCH Ramp PM Peak Hour Lane Group EBL EBT EBR WBL WBT WBR NBL NBT NBR SBL SBT SBR Lane Configurations Volume (vph) Ideal Flow (vphpl) Storage Length (m) Storage Lanes Taper Length (m) Lane Util. Factor Ped Bike Factor Frt Flt Protected Satd. Flow (prot) Flt Permitted Satd. Flow (perm) Right Turn on Red Yes Yes Yes Yes Satd. Flow (RTOR) Link Speed (k/h) Link Distance (m) Travel Time (s) Confl. Peds. (#/hr) Peak Hour Factor Heavy Vehicles (%) 5% 5% 5% 5% 5% 5% 5% 5% 5% 5% 5% 5% Adj. Flow (vph) Shared Lane Traffic (%) Lane Group Flow (vph) Enter Blocked Intersection No No No No No No No No No No No No Lane Alignment Left Left Right Left Left Right Left Left Right Left Left Right Median Width(m) Link Offset(m) Crosswalk Width(m) Two way Left Turn Lane Headway Factor Turning Speed (k/h) Number of Detectors Detector Template Left Thru Left Thru Right Left Thru Left Thru Right Leading Detector (m) Trailing Detector (m) Detector 1 Position(m) Detector 1 Size(m) Detector 1 Type Cl+Ex Cl+Ex Cl+Ex Cl+Ex Cl+Ex Cl+Ex Cl+Ex Cl+Ex Cl+Ex Cl+Ex Detector 1 Channel Detector 1 Extend (s) Detector 1 Queue (s) Detector 1 Delay (s) Turn Type pm+pt Perm Perm Perm Perm Perm Protected Phases Permitted Phases Detector Phase Switch Phase Minimum Initial (s) West Campus Transportation Impact Assessment Synchro 7 - Report Updated Geometry Page 4
240 Lanes, Volumes, Timings 2039 Post Development 9: West Campus Blvd & TCH Ramp PM Peak Hour Lane Group EBL EBT EBR WBL WBT WBR NBL NBT NBR SBL SBT SBR Minimum Split (s) Total Split (s) Total Split (%) 16.7% % 47.8% 47.8% 47.8% 35.6% 35.6% 0.0% 35.6% 35.6% 35.6% Maximum Green (s) Yellow Time (s) All-Red Time (s) Lost Time Adjust (s) Total Lost Time (s) Lead/Lag Lead Lag Lag Lag Lead-Lag Optimize? Yes Yes Yes Yes Vehicle Extension (s) Recall Mode None None None None None Min Min Min Min Min Walk Time (s) Flash Dont Walk (s) Pedestrian Calls (#/hr) Act Effct Green (s) Actuated g/c Ratio v/c Ratio Control Delay Queue Delay Total Delay LOS A A C A C B C C A Approach Delay Approach LOS A C C B Queue Length 50th (m) Queue Length 95th (m) Internal Link Dist (m) Turn Bay Length (m) Base Capacity (vph) Starvation Cap Reductn Spillback Cap Reductn Storage Cap Reductn Reduced v/c Ratio Intersection Summary Area Type: Other Cycle Length: 90 Actuated Cycle Length: 66.5 Natural Cycle: 65 Control Type: Actuated-Uncoordinated Maximum v/c Ratio: 0.78 Intersection Signal Delay: 17.9 Intersection Capacity Utilization 82.9% Analysis Period (min) 15 Intersection LOS: B ICU Level of Service E West Campus Transportation Impact Assessment Synchro 7 - Report Updated Geometry Page 5
241 Lanes, Volumes, Timings 2039 Post Development 9: West Campus Blvd & TCH Ramp PM Peak Hour Splits and Phases: 9: West Campus Blvd & TCH Ramp West Campus Transportation Impact Assessment Synchro 7 - Report Updated Geometry Page 6
242 Lanes, Volumes, Timings 2039 Post Development - Improved 24: 32 Ave NW & Shaganappi Trail AM Peak Hour Lane Group EBL EBT EBR WBL WBT WBR NBL NBT NBR SBL SBT SBR Lane Configurations Volume (vph) Ideal Flow (vphpl) Storage Length (m) Storage Lanes Taper Length (m) Lane Util. Factor Ped Bike Factor Frt Flt Protected Satd. Flow (prot) Flt Permitted Satd. Flow (perm) Right Turn on Red Yes Yes Yes Yes Satd. Flow (RTOR) Link Speed (k/h) Link Distance (m) Travel Time (s) Confl. Peds. (#/hr) Confl. Bikes (#/hr) Peak Hour Factor Heavy Vehicles (%) 5% 5% 5% 5% 5% 5% 5% 5% 5% 5% 5% 5% Bus Blockages (#/hr) Adj. Flow (vph) Shared Lane Traffic (%) Lane Group Flow (vph) Enter Blocked Intersection No No No No No No No No No No No No Lane Alignment Left Left Right Left Left Right Left Left Right Left Left Right Median Width(m) Link Offset(m) Crosswalk Width(m) Two way Left Turn Lane Headway Factor Turning Speed (k/h) Number of Detectors Detector Template Left Thru Right Left Thru Right Left Thru Right Left Thru Right Leading Detector (m) Trailing Detector (m) Detector 1 Position(m) Detector 1 Size(m) Detector 1 Type Cl+Ex Cl+Ex Cl+Ex Cl+Ex Cl+Ex Cl+Ex Cl+Ex Cl+Ex Cl+Ex Cl+Ex Cl+Ex Cl+Ex Detector 1 Channel Detector 1 Extend (s) Detector 1 Queue (s) Detector 1 Delay (s) Turn Type pm+pt Perm pm+pt Free Prot Perm Prot Perm Protected Phases Permitted Phases Free 2 6 Detector Phase West Campus Transportation Impact Assessment Synchro 7 - Report Latest Geometry Page 1
243 Lanes, Volumes, Timings 2039 Post Development - Improved 24: 32 Ave NW & Shaganappi Trail AM Peak Hour Lane Group EBL EBT EBR WBL WBT WBR NBL NBT NBR SBL SBT SBR Switch Phase Minimum Initial (s) Minimum Split (s) Total Split (s) Total Split (%) 12.0% % % 12.0% 33.6% 33.6% 28.0% 49.6% 49.6% Maximum Green (s) Yellow Time (s) All-Red Time (s) Lost Time Adjust (s) Total Lost Time (s) Lead/Lag Lead Lag Lag Lead Lag Lead Lag Lag Lead Lag Lag Lead-Lag Optimize? Yes Yes Yes Yes Yes Yes Yes Yes Yes Yes Yes Vehicle Extension (s) Recall Mode None None None None None None Min Min None Min Min Walk Time (s) Flash Dont Walk (s) Pedestrian Calls (#/hr) Act Effct Green (s) Actuated g/c Ratio v/c Ratio Control Delay Queue Delay Total Delay LOS C D C C D A E C A E D A Approach Delay Approach LOS D C D D Queue Length 50th (m) Queue Length 95th (m) Internal Link Dist (m) Turn Bay Length (m) Base Capacity (vph) Starvation Cap Reductn Spillback Cap Reductn Storage Cap Reductn Reduced v/c Ratio Intersection Summary Area Type: Other Cycle Length: 125 Actuated Cycle Length: Natural Cycle: 110 Control Type: Actuated-Uncoordinated Maximum v/c Ratio: 0.93 Intersection Signal Delay: 39.6 Intersection Capacity Utilization 93. Analysis Period (min) 15 Intersection LOS: D ICU Level of Service F West Campus Transportation Impact Assessment Synchro 7 - Report Latest Geometry Page 2
244 Lanes, Volumes, Timings 2039 Post Development - Improved 24: 32 Ave NW & Shaganappi Trail AM Peak Hour Splits and Phases: 24: 32 Ave NW & Shaganappi Trail West Campus Transportation Impact Assessment Synchro 7 - Report Latest Geometry Page 3
245 Lanes, Volumes, Timings 2039 Post Development - Improved 28: West Campus Way & Shaganappi Trail AM Peak Hour Lane Group WBL WBR NBT NBR SBL SBT Lane Configurations Volume (vph) Ideal Flow (vphpl) Lane Width (m) Storage Length (m) Storage Lanes Taper Length (m) Lane Util. Factor Ped Bike Factor Frt Flt Protected Satd. Flow (prot) Flt Permitted Satd. Flow (perm) Right Turn on Red Yes Yes Satd. Flow (RTOR) Link Speed (k/h) Link Distance (m) Travel Time (s) Confl. Peds. (#/hr) Confl. Bikes (#/hr) Peak Hour Factor Heavy Vehicles (%) 5% 5% 5% 5% 5% 5% Adj. Flow (vph) Shared Lane Traffic (%) Lane Group Flow (vph) Enter Blocked Intersection No No No No No No Lane Alignment Left Right Left Right Left Left Median Width(m) Link Offset(m) Crosswalk Width(m) Two way Left Turn Lane Headway Factor Turning Speed (k/h) Number of Detectors Detector Template Left Right Thru Right Left Thru Leading Detector (m) Trailing Detector (m) Detector 1 Position(m) Detector 1 Size(m) Detector 1 Type Cl+Ex Cl+Ex Cl+Ex Cl+Ex Cl+Ex Cl+Ex Detector 1 Channel Detector 1 Extend (s) Detector 1 Queue (s) Detector 1 Delay (s) Turn Type Free Perm Prot Protected Phases Permitted Phases Free 2 Detector Phase West Campus Transportation Impact Assessment Synchro 7 - Report Latest Geometry Page 1
246 Lanes, Volumes, Timings 2039 Post Development - Improved 28: West Campus Way & Shaganappi Trail AM Peak Hour Lane Group WBL WBR NBT NBR SBL SBT Switch Phase Minimum Initial (s) Minimum Split (s) Total Split (s) Total Split (%) 36.7% 0.0% 35.6% 35.6% 27.8% 63. Maximum Green (s) Yellow Time (s) All-Red Time (s) Lost Time Adjust (s) Total Lost Time (s) Lead/Lag Lag Lag Lead Lead-Lag Optimize? Yes Yes Yes Vehicle Extension (s) Recall Mode None Min Min None Min Walk Time (s) Flash Dont Walk (s) Pedestrian Calls (#/hr) Act Effct Green (s) Actuated g/c Ratio v/c Ratio Control Delay Queue Delay Total Delay LOS C A C A C B Approach Delay Approach LOS B B B Queue Length 50th (m) Queue Length 95th (m) Internal Link Dist (m) Turn Bay Length (m) Base Capacity (vph) Starvation Cap Reductn Spillback Cap Reductn Storage Cap Reductn Reduced v/c Ratio Intersection Summary Area Type: Other Cycle Length: 90 Actuated Cycle Length: 68.4 Natural Cycle: 75 Control Type: Actuated-Uncoordinated Maximum v/c Ratio: 0.74 Intersection Signal Delay: 16.5 Intersection Capacity Utilization 65.5% Analysis Period (min) 15 Intersection LOS: B ICU Level of Service C West Campus Transportation Impact Assessment Synchro 7 - Report Latest Geometry Page 2
247 Lanes, Volumes, Timings 2039 Post Development - Improved 28: West Campus Way & Shaganappi Trail AM Peak Hour Splits and Phases: 28: West Campus Way & Shaganappi Trail West Campus Transportation Impact Assessment Synchro 7 - Report Latest Geometry Page 3
248 Lanes, Volumes, Timings 2039 Post Development - Improved 36: West Campus Way & 39 Street NW AM Peak Hour Lane Group EBL EBT WBT WBR SBL SBR Lane Configurations Volume (vph) Ideal Flow (vphpl) Lane Width (m) Lane Util. Factor Ped Bike Factor Frt Flt Protected Satd. Flow (prot) Flt Permitted Satd. Flow (perm) Right Turn on Red Yes Yes Satd. Flow (RTOR) Link Speed (k/h) Link Distance (m) Travel Time (s) Confl. Peds. (#/hr) Confl. Bikes (#/hr) Peak Hour Factor Heavy Vehicles (%) 5% 5% 5% 5% 5% 5% Bus Blockages (#/hr) Parking (#/hr) Adj. Flow (vph) Shared Lane Traffic (%) Lane Group Flow (vph) Enter Blocked Intersection No No No No No No Lane Alignment Left Left Left Right Left Right Median Width(m) Link Offset(m) Crosswalk Width(m) Two way Left Turn Lane Headway Factor Turning Speed (k/h) Number of Detectors Detector Template Left Thru Thru Left Right Leading Detector (m) Trailing Detector (m) Detector 1 Position(m) Detector 1 Size(m) Detector 1 Type Cl+Ex Cl+Ex Cl+Ex Cl+Ex Cl+Ex Detector 1 Channel Detector 1 Extend (s) Detector 1 Queue (s) Detector 1 Delay (s) Turn Type Perm Perm Protected Phases Permitted Phases 4 6 Detector Phase Switch Phase West Campus Transportation Impact Assessment Synchro 7 - Report Latest Geometry Page 7
249 Lanes, Volumes, Timings 2039 Post Development - Improved 36: West Campus Way & 39 Street NW AM Peak Hour Lane Group EBL EBT WBT WBR SBL SBR Minimum Initial (s) Minimum Split (s) Total Split (s) Total Split (%) 41.7% 41.7% 41.7% 0.0% Maximum Green (s) Yellow Time (s) All-Red Time (s) Lost Time Adjust (s) Total Lost Time (s) Lead/Lag Lead-Lag Optimize? Vehicle Extension (s) Recall Mode Min Min Min None None Walk Time (s) Flash Dont Walk (s) Pedestrian Calls (#/hr) Act Effct Green (s) Actuated g/c Ratio v/c Ratio Control Delay Queue Delay Total Delay LOS B B B B Approach Delay Approach LOS B B B Queue Length 50th (m) Queue Length 95th (m) Internal Link Dist (m) Turn Bay Length (m) Base Capacity (vph) Starvation Cap Reductn Spillback Cap Reductn Storage Cap Reductn Reduced v/c Ratio Intersection Summary Area Type: Other Cycle Length: 60 Actuated Cycle Length: 44 Natural Cycle: 50 Control Type: Actuated-Uncoordinated Maximum v/c Ratio: 0.76 Intersection Signal Delay: 14.0 Intersection Capacity Utilization 55.7% Analysis Period (min) 15 Intersection LOS: B ICU Level of Service B West Campus Transportation Impact Assessment Synchro 7 - Report Latest Geometry Page 8
250 Lanes, Volumes, Timings 2039 Post Development - Improved 36: West Campus Way & 39 Street NW AM Peak Hour Splits and Phases: 36: West Campus Way & 39 Street NW West Campus Transportation Impact Assessment Synchro 7 - Report Latest Geometry Page 9
251 Lanes, Volumes, Timings 2039 Post Development - Improved 24: 32 Ave NW & Shaganappi Trail PM Peak Hour Lane Group EBL EBT EBR WBL WBT WBR NBL NBT NBR SBL SBT SBR Lane Configurations Volume (vph) Ideal Flow (vphpl) Storage Length (m) Storage Lanes Taper Length (m) Lane Util. Factor Ped Bike Factor Frt Flt Protected Satd. Flow (prot) Flt Permitted Satd. Flow (perm) Right Turn on Red Yes Yes Yes Yes Satd. Flow (RTOR) Link Speed (k/h) Link Distance (m) Travel Time (s) Confl. Peds. (#/hr) Confl. Bikes (#/hr) Peak Hour Factor Heavy Vehicles (%) 5% 5% 5% 5% 5% 5% 5% 5% 5% 5% 5% 5% Bus Blockages (#/hr) Adj. Flow (vph) Shared Lane Traffic (%) Lane Group Flow (vph) Enter Blocked Intersection No No No No No No No No No No No No Lane Alignment Left Left Right Left Left Right Left Left Right Left Left Right Median Width(m) Link Offset(m) Crosswalk Width(m) Two way Left Turn Lane Headway Factor Turning Speed (k/h) Number of Detectors Detector Template Left Thru Right Left Thru Right Left Thru Right Left Thru Right Leading Detector (m) Trailing Detector (m) Detector 1 Position(m) Detector 1 Size(m) Detector 1 Type Cl+Ex Cl+Ex Cl+Ex Cl+Ex Cl+Ex Cl+Ex Cl+Ex Cl+Ex Cl+Ex Cl+Ex Cl+Ex Cl+Ex Detector 1 Channel Detector 1 Extend (s) Detector 1 Queue (s) Detector 1 Delay (s) Turn Type pm+pt Perm pm+pt Free Prot Perm Prot Perm Protected Phases Permitted Phases Free 2 6 Detector Phase West Campus Transportation Impact Assessment Synchro 7 - Report Updated Geometry Page 1
252 Lanes, Volumes, Timings 2039 Post Development - Improved 24: 32 Ave NW & Shaganappi Trail PM Peak Hour Lane Group EBL EBT EBR WBL WBT WBR NBL NBT NBR SBL SBT SBR Switch Phase Minimum Initial (s) Minimum Split (s) Total Split (s) Total Split (%) 15.0% % 0.0% % 41.7% 15.8% Maximum Green (s) Yellow Time (s) All-Red Time (s) Lost Time Adjust (s) Total Lost Time (s) Lead/Lag Lead Lag Lag Lead Lag Lead Lag Lag Lead Lag Lag Lead-Lag Optimize? Yes Yes Yes Yes Yes Yes Yes Yes Yes Yes Yes Vehicle Extension (s) Recall Mode None None None None None None Min Min None Min Min Walk Time (s) Flash Dont Walk (s) Pedestrian Calls (#/hr) Act Effct Green (s) Actuated g/c Ratio v/c Ratio Control Delay Queue Delay Total Delay LOS E D A C D A E D B E D A Approach Delay Approach LOS D C D D Queue Length 50th (m) Queue Length 95th (m) # # # Internal Link Dist (m) Turn Bay Length (m) Base Capacity (vph) Starvation Cap Reductn Spillback Cap Reductn Storage Cap Reductn Reduced v/c Ratio Intersection Summary Area Type: Other Cycle Length: 120 Actuated Cycle Length: Natural Cycle: 100 Control Type: Actuated-Uncoordinated Maximum v/c Ratio: 0.98 Intersection Signal Delay: 42.7 Intersection LOS: D Intersection Capacity Utilization 97.9% ICU Level of Service F Analysis Period (min) 15 # 95th percentile volume exceeds capacity, queue may be longer. Queue shown is maximum after two cycles. West Campus Transportation Impact Assessment Synchro 7 - Report Updated Geometry Page 2
253 Lanes, Volumes, Timings 2039 Post Development - Improved 24: 32 Ave NW & Shaganappi Trail PM Peak Hour Splits and Phases: 24: 32 Ave NW & Shaganappi Trail West Campus Transportation Impact Assessment Synchro 7 - Report Updated Geometry Page 3
254 Lanes, Volumes, Timings 2039 Post Development - Improved 28: West Campus Way & Shaganappi Trail PM Peak Hour Lane Group WBL WBR NBT NBR SBL SBT Lane Configurations Volume (vph) Ideal Flow (vphpl) Lane Width (m) Storage Length (m) Storage Lanes Taper Length (m) Lane Util. Factor Ped Bike Factor Frt Flt Protected Satd. Flow (prot) Flt Permitted Satd. Flow (perm) Right Turn on Red Yes Yes Satd. Flow (RTOR) Link Speed (k/h) Link Distance (m) Travel Time (s) Confl. Peds. (#/hr) Confl. Bikes (#/hr) Peak Hour Factor Heavy Vehicles (%) 5% 5% 5% 5% 5% 5% Adj. Flow (vph) Shared Lane Traffic (%) Lane Group Flow (vph) Enter Blocked Intersection No No No No No No Lane Alignment Left Right Left Right Left Left Median Width(m) Link Offset(m) Crosswalk Width(m) Two way Left Turn Lane Headway Factor Turning Speed (k/h) Number of Detectors Detector Template Left Right Thru Right Left Thru Leading Detector (m) Trailing Detector (m) Detector 1 Position(m) Detector 1 Size(m) Detector 1 Type Cl+Ex Cl+Ex Cl+Ex Cl+Ex Cl+Ex Cl+Ex Detector 1 Channel Detector 1 Extend (s) Detector 1 Queue (s) Detector 1 Delay (s) Turn Type Free Perm Prot Protected Phases Permitted Phases Free 2 Detector Phase West Campus Transportation Impact Assessment Synchro 7 - Report Updated Geometry Page 1
255 Lanes, Volumes, Timings 2039 Post Development - Improved 28: West Campus Way & Shaganappi Trail PM Peak Hour Lane Group WBL WBR NBT NBR SBL SBT Switch Phase Minimum Initial (s) Minimum Split (s) Total Split (s) Total Split (%) 40.7% 0.0% 37.8% 37.8% 21.5% 59. Maximum Green (s) Yellow Time (s) All-Red Time (s) Lost Time Adjust (s) Total Lost Time (s) Lead/Lag Lag Lag Lead Lead-Lag Optimize? Yes Yes Yes Vehicle Extension (s) Recall Mode None Min Min None Min Walk Time (s) Flash Dont Walk (s) Pedestrian Calls (#/hr) Act Effct Green (s) Actuated g/c Ratio v/c Ratio Control Delay Queue Delay Total Delay LOS D A C A D A Approach Delay Approach LOS C C C Queue Length 50th (m) Queue Length 95th (m) # Internal Link Dist (m) Turn Bay Length (m) Base Capacity (vph) Starvation Cap Reductn Spillback Cap Reductn Storage Cap Reductn Reduced v/c Ratio Intersection Summary Area Type: Other Cycle Length: 135 Actuated Cycle Length: Natural Cycle: 90 Control Type: Actuated-Uncoordinated Maximum v/c Ratio: 0.83 Intersection Signal Delay: 26.6 Intersection LOS: C Intersection Capacity Utilization 80. ICU Level of Service D Analysis Period (min) 15 # 95th percentile volume exceeds capacity, queue may be longer. Queue shown is maximum after two cycles. West Campus Transportation Impact Assessment Synchro 7 - Report Updated Geometry Page 2
256 Lanes, Volumes, Timings 2039 Post Development - Improved 28: West Campus Way & Shaganappi Trail PM Peak Hour Splits and Phases: 28: West Campus Way & Shaganappi Trail West Campus Transportation Impact Assessment Synchro 7 - Report Updated Geometry Page 3
257 Lanes, Volumes, Timings 2039 Post Development - Improved 36: West Campus Way & 39 Street NW PM Peak Hour Lane Group EBL EBT WBT WBR SBL SBR Lane Configurations Volume (vph) Ideal Flow (vphpl) Lane Width (m) Lane Util. Factor Ped Bike Factor Frt Flt Protected Satd. Flow (prot) Flt Permitted Satd. Flow (perm) Right Turn on Red Yes Yes Satd. Flow (RTOR) Link Speed (k/h) Link Distance (m) Travel Time (s) Confl. Peds. (#/hr) Confl. Bikes (#/hr) Peak Hour Factor Heavy Vehicles (%) 5% 5% 5% 5% 5% 5% Bus Blockages (#/hr) Parking (#/hr) Adj. Flow (vph) Shared Lane Traffic (%) Lane Group Flow (vph) Enter Blocked Intersection No No No No No No Lane Alignment Left Left Left Right Left Right Median Width(m) Link Offset(m) Crosswalk Width(m) Two way Left Turn Lane Headway Factor Turning Speed (k/h) Number of Detectors Detector Template Thru Thru Left Right Leading Detector (m) Trailing Detector (m) Detector 1 Position(m) Detector 1 Size(m) Detector 1 Type Cl+Ex Cl+Ex Cl+Ex Cl+Ex Cl+Ex Detector 1 Channel Detector 1 Extend (s) Detector 1 Queue (s) Detector 1 Delay (s) Turn Type pm+pt Perm Protected Phases Permitted Phases 4 6 Detector Phase Switch Phase West Campus Transportation Impact Assessment Synchro 7 - Report Updated Geometry Page 7
258 Lanes, Volumes, Timings 2039 Post Development - Improved 36: West Campus Way & 39 Street NW PM Peak Hour Lane Group EBL EBT WBT WBR SBL SBR Minimum Initial (s) Minimum Split (s) Total Split (s) Total Split (%) % 27.8% 0.0% 30.0% 30.0% Maximum Green (s) Yellow Time (s) All-Red Time (s) Lost Time Adjust (s) Total Lost Time (s) Lead/Lag Lead Lag Lead-Lag Optimize? Yes Yes Vehicle Extension (s) Recall Mode None Min Min None None Walk Time (s) Flash Dont Walk (s) Pedestrian Calls (#/hr) Act Effct Green (s) Actuated g/c Ratio v/c Ratio Control Delay Queue Delay Total Delay LOS C A C C A Approach Delay Approach LOS B C B Queue Length 50th (m) Queue Length 95th (m) # # Internal Link Dist (m) Turn Bay Length (m) Base Capacity (vph) Starvation Cap Reductn Spillback Cap Reductn Storage Cap Reductn Reduced v/c Ratio Intersection Summary Area Type: Other Cycle Length: 90 Actuated Cycle Length: 78.2 Natural Cycle: 80 Control Type: Actuated-Uncoordinated Maximum v/c Ratio: 0.81 Intersection Signal Delay: 21.8 Intersection LOS: C Intersection Capacity Utilization 76. ICU Level of Service D Analysis Period (min) 15 # 95th percentile volume exceeds capacity, queue may be longer. Queue shown is maximum after two cycles. West Campus Transportation Impact Assessment Synchro 7 - Report Updated Geometry Page 8
259 Lanes, Volumes, Timings 2039 Post Development - Improved 36: West Campus Way & 39 Street NW PM Peak Hour Splits and Phases: 36: West Campus Way & 39 Street NW West Campus Transportation Impact Assessment Synchro 7 - Report Updated Geometry Page 9
260 Lanes, Volumes, Timings 2039 Post Development Peds Sens 28: West Campus Way & Shaganappi Trail AM Peak Hour Lane Group WBL WBR NBT NBR SBL SBT Lane Configurations Volume (vph) Ideal Flow (vphpl) Lane Width (m) Storage Length (m) Storage Lanes Taper Length (m) Lane Util. Factor Ped Bike Factor Frt Flt Protected Satd. Flow (prot) Flt Permitted Satd. Flow (perm) Right Turn on Red Yes Yes Satd. Flow (RTOR) Link Speed (k/h) Link Distance (m) Travel Time (s) Confl. Peds. (#/hr) Confl. Bikes (#/hr) Peak Hour Factor Heavy Vehicles (%) 5% 5% 5% 5% 5% 5% Adj. Flow (vph) Shared Lane Traffic (%) Lane Group Flow (vph) Enter Blocked Intersection No No No No No No Lane Alignment Left Right Left Right Left Left Median Width(m) Link Offset(m) Crosswalk Width(m) Two way Left Turn Lane Headway Factor Turning Speed (k/h) Number of Detectors Detector Template Left Right Thru Right Left Thru Leading Detector (m) Trailing Detector (m) Detector 1 Position(m) Detector 1 Size(m) Detector 1 Type Cl+Ex Cl+Ex Cl+Ex Cl+Ex Cl+Ex Cl+Ex Detector 1 Channel Detector 1 Extend (s) Detector 1 Queue (s) Detector 1 Delay (s) Turn Type Perm Perm Prot Protected Phases Permitted Phases 8 2 Detector Phase West Campus Transportation Impact Assessment Synchro 7 - Report Latest Geometry Page 4
261 Lanes, Volumes, Timings 2039 Post Development Peds Sens 28: West Campus Way & Shaganappi Trail AM Peak Hour Lane Group WBL WBR NBT NBR SBL SBT Switch Phase Minimum Initial (s) Minimum Split (s) Total Split (s) Total Split (%) 36.7% 36.7% 35.6% 35.6% 27.8% 63. Maximum Green (s) Yellow Time (s) All-Red Time (s) Lost Time Adjust (s) Total Lost Time (s) Lead/Lag Lag Lag Lead Lead-Lag Optimize? Yes Yes Yes Vehicle Extension (s) Recall Mode None None Min Min None Min Walk Time (s) Flash Dont Walk (s) Pedestrian Calls (#/hr) Act Effct Green (s) Actuated g/c Ratio v/c Ratio Control Delay Queue Delay Total Delay LOS C A C B D B Approach Delay Approach LOS B C C Queue Length 50th (m) Queue Length 95th (m) # Internal Link Dist (m) Turn Bay Length (m) Base Capacity (vph) Starvation Cap Reductn Spillback Cap Reductn Storage Cap Reductn Reduced v/c Ratio Intersection Summary Area Type: Other Cycle Length: 90 Actuated Cycle Length: 83.3 Natural Cycle: 90 Control Type: Actuated-Uncoordinated Maximum v/c Ratio: 0.84 Intersection Signal Delay: 20.5 Intersection LOS: C Intersection Capacity Utilization 68.0% ICU Level of Service C Analysis Period (min) 15 # 95th percentile volume exceeds capacity, queue may be longer. Queue shown is maximum after two cycles. West Campus Transportation Impact Assessment Synchro 7 - Report Latest Geometry Page 5
262 Lanes, Volumes, Timings 2039 Post Development Peds Sens 28: West Campus Way & Shaganappi Trail AM Peak Hour Splits and Phases: 28: West Campus Way & Shaganappi Trail West Campus Transportation Impact Assessment Synchro 7 - Report Latest Geometry Page 6
263 Lanes, Volumes, Timings 2039 Post Development Peds Sens 26: West Campus Way & West Campus Drive AM Peak Hour Lane Group EBL EBT EBR WBL WBT WBR NBL NBT NBR SBL SBT SBR Lane Configurations Volume (vph) Ideal Flow (vphpl) Lane Width (m) Storage Length (m) Storage Lanes Taper Length (m) Lane Util. Factor Ped Bike Factor Frt Flt Protected Satd. Flow (prot) Flt Permitted Satd. Flow (perm) Right Turn on Red Yes Yes Yes Yes Satd. Flow (RTOR) Link Speed (k/h) Link Distance (m) Travel Time (s) Confl. Peds. (#/hr) Confl. Bikes (#/hr) Peak Hour Factor Heavy Vehicles (%) 5% 5% 5% 5% 5% 5% 5% 5% 5% 5% 5% 5% Bus Blockages (#/hr) Parking (#/hr) 0 0 Adj. Flow (vph) Shared Lane Traffic (%) Lane Group Flow (vph) Enter Blocked Intersection No No No No No No No No No No No No Lane Alignment Left Left Right Left Left Right Left Left Right Left Left Right Median Width(m) Link Offset(m) Crosswalk Width(m) Two way Left Turn Lane Headway Factor Turning Speed (k/h) Number of Detectors Detector Template Left Thru Left Thru Left Thru Right Left Thru Leading Detector (m) Trailing Detector (m) Detector 1 Position(m) Detector 1 Size(m) Detector 1 Type Cl+Ex Cl+Ex Cl+Ex Cl+Ex Cl+Ex Cl+Ex Cl+Ex Cl+Ex Cl+Ex Detector 1 Channel Detector 1 Extend (s) Detector 1 Queue (s) Detector 1 Delay (s) Turn Type Perm pm+pt pm+pt Perm Perm Protected Phases West Campus Transportation Impact Assessment Synchro 7 - Report Latest Geometry Page 1
264 Lanes, Volumes, Timings 2039 Post Development Peds Sens 26: West Campus Way & West Campus Drive AM Peak Hour Lane Group EBL EBT EBR WBL WBT WBR NBL NBT NBR SBL SBT SBR Permitted Phases Detector Phase Switch Phase Minimum Initial (s) Minimum Split (s) Total Split (s) Total Split (%) 36.7% 36.7% 0.0% 18.9% 55.6% 0.0% 16.7% % 27.8% 0.0% Maximum Green (s) Yellow Time (s) All-Red Time (s) Lost Time Adjust (s) Total Lost Time (s) Lead/Lag Lag Lag Lead Lead Lag Lag Lead-Lag Optimize? Yes Yes Yes Yes Yes Yes Vehicle Extension (s) Recall Mode Min Min None Min None None None None None Walk Time (s) Flash Dont Walk (s) Pedestrian Calls (#/hr) Act Effct Green (s) Actuated g/c Ratio v/c Ratio Control Delay Queue Delay Total Delay LOS D D D B B C A D Approach Delay Approach LOS D C B D Queue Length 50th (m) Queue Length 95th (m) #52.9 #107.0 # #68.9 Internal Link Dist (m) Turn Bay Length (m) Base Capacity (vph) Starvation Cap Reductn Spillback Cap Reductn Storage Cap Reductn Reduced v/c Ratio Intersection Summary Area Type: Other Cycle Length: 90 Actuated Cycle Length: 85.6 Natural Cycle: 90 Control Type: Actuated-Uncoordinated Maximum v/c Ratio: 0.97 Intersection Signal Delay: 34.3 Intersection LOS: C Intersection Capacity Utilization 102.0% ICU Level of Service G Analysis Period (min) 15 # 95th percentile volume exceeds capacity, queue may be longer. West Campus Transportation Impact Assessment Synchro 7 - Report Latest Geometry Page 2
265 Lanes, Volumes, Timings 2039 Post Development Peds Sens 26: West Campus Way & West Campus Drive AM Peak Hour Queue shown is maximum after two cycles. Splits and Phases: 26: West Campus Way & West Campus Drive West Campus Transportation Impact Assessment Synchro 7 - Report Latest Geometry Page 3
266 Lanes, Volumes, Timings 2039 Post Development Peds Sens 36: West Campus Way & 39 Street NW AM Peak Hour Lane Group EBL EBT WBT WBR SBL SBR Lane Configurations Volume (vph) Ideal Flow (vphpl) Lane Width (m) Lane Util. Factor Ped Bike Factor Frt Flt Protected Satd. Flow (prot) Flt Permitted Satd. Flow (perm) Right Turn on Red Yes Yes Satd. Flow (RTOR) 4 1 Link Speed (k/h) Link Distance (m) Travel Time (s) Confl. Peds. (#/hr) Confl. Bikes (#/hr) Peak Hour Factor Heavy Vehicles (%) 5% 5% 5% 5% 5% 5% Bus Blockages (#/hr) Parking (#/hr) Adj. Flow (vph) Shared Lane Traffic (%) Lane Group Flow (vph) Enter Blocked Intersection No No No No No No Lane Alignment Left Left Left Right Left Right Median Width(m) Link Offset(m) Crosswalk Width(m) Two way Left Turn Lane Headway Factor Turning Speed (k/h) Number of Detectors Detector Template Left Thru Thru Left Right Leading Detector (m) Trailing Detector (m) Detector 1 Position(m) Detector 1 Size(m) Detector 1 Type Cl+Ex Cl+Ex Cl+Ex Cl+Ex Cl+Ex Detector 1 Channel Detector 1 Extend (s) Detector 1 Queue (s) Detector 1 Delay (s) Turn Type Perm Perm Protected Phases Permitted Phases 4 6 Detector Phase Switch Phase West Campus Transportation Impact Assessment Synchro 7 - Report Latest Geometry Page 7
267 Lanes, Volumes, Timings 2039 Post Development Peds Sens 36: West Campus Way & 39 Street NW AM Peak Hour Lane Group EBL EBT WBT WBR SBL SBR Minimum Initial (s) Minimum Split (s) Total Split (s) Total Split (%) 30.0% 30.0% 30.0% 0.0% 70.0% 70.0% Maximum Green (s) Yellow Time (s) All-Red Time (s) Lost Time Adjust (s) Total Lost Time (s) Lead/Lag Lead-Lag Optimize? Vehicle Extension (s) Recall Mode Min Min Min None None Walk Time (s) Flash Dont Walk (s) Pedestrian Calls (#/hr) Act Effct Green (s) Actuated g/c Ratio v/c Ratio Control Delay Queue Delay Total Delay LOS D C A D Approach Delay Approach LOS D C C Queue Length 50th (m) Queue Length 95th (m) # #139.6 Internal Link Dist (m) Turn Bay Length (m) Base Capacity (vph) Starvation Cap Reductn Spillback Cap Reductn Storage Cap Reductn Reduced v/c Ratio Intersection Summary Area Type: Other Cycle Length: 90 Actuated Cycle Length: 80.9 Natural Cycle: 75 Control Type: Actuated-Uncoordinated Maximum v/c Ratio: 0.93 Intersection Signal Delay: 33.9 Intersection LOS: C Intersection Capacity Utilization 63.5% ICU Level of Service B Analysis Period (min) 15 # 95th percentile volume exceeds capacity, queue may be longer. Queue shown is maximum after two cycles. West Campus Transportation Impact Assessment Synchro 7 - Report Latest Geometry Page 8
268 Lanes, Volumes, Timings 2039 Post Development Peds Sens 36: West Campus Way & 39 Street NW AM Peak Hour Splits and Phases: 36: West Campus Way & 39 Street NW West Campus Transportation Impact Assessment Synchro 7 - Report Latest Geometry Page 9
269 HCM Unsignalized Intersection Capacity Analysis 2039 Post Development Peds Sens 38: Collegiate Rd & Collegiate Blvd AM Peak Hour Movement EBL EBT WBT WBR SBL SBR Lane Configurations Sign Control Stop Stop Stop Volume (vph) Peak Hour Factor Hourly flow rate (vph) Direction, Lane # EB 1 EB 2 WB 1 WB 2 SB 1 SB 2 Volume Total (vph) Volume Left (vph) Volume Right (vph) Hadj (s) Departure Headway (s) Degree Utilization, x Capacity (veh/h) Control Delay (s) Approach Delay (s) Approach LOS B B C Intersection Summary Delay 13.8 HCM Level of Service B Intersection Capacity Utilization 53. ICU Level of Service A Analysis Period (min) 15 West Campus Transportation Impact Assessment Synchro 7 - Report Latest Geometry Page 1
270 Lanes, Volumes, Timings 2039 Post Development Peds Sens 28: West Campus Way & Shaganappi Trail PM Peak Hour Lane Group WBL WBR NBT NBR SBL SBT Lane Configurations Volume (vph) Ideal Flow (vphpl) Lane Width (m) Storage Length (m) Storage Lanes Taper Length (m) Lane Util. Factor Ped Bike Factor Frt Flt Protected Satd. Flow (prot) Flt Permitted Satd. Flow (perm) Right Turn on Red Yes Yes Satd. Flow (RTOR) Link Speed (k/h) Link Distance (m) Travel Time (s) Confl. Peds. (#/hr) Confl. Bikes (#/hr) Peak Hour Factor Heavy Vehicles (%) 5% 5% 5% 5% 5% 5% Adj. Flow (vph) Shared Lane Traffic (%) Lane Group Flow (vph) Enter Blocked Intersection No No No No No No Lane Alignment Left Right Left Right Left Left Median Width(m) Link Offset(m) Crosswalk Width(m) Two way Left Turn Lane Headway Factor Turning Speed (k/h) Number of Detectors Detector Template Left Right Thru Right Left Thru Leading Detector (m) Trailing Detector (m) Detector 1 Position(m) Detector 1 Size(m) Detector 1 Type Cl+Ex Cl+Ex Cl+Ex Cl+Ex Cl+Ex Cl+Ex Detector 1 Channel Detector 1 Extend (s) Detector 1 Queue (s) Detector 1 Delay (s) Turn Type Perm Perm Prot Protected Phases Permitted Phases 8 2 Detector Phase West Campus Transportation Impact Assessment Synchro 7 - Report Updated Geometry Page 4
271 Lanes, Volumes, Timings 2039 Post Development Peds Sens 28: West Campus Way & Shaganappi Trail PM Peak Hour Lane Group WBL WBR NBT NBR SBL SBT Switch Phase Minimum Initial (s) Minimum Split (s) Total Split (s) Total Split (%) 40.0% 40.0% 38.5% 38.5% 21.5% 60.0% Maximum Green (s) Yellow Time (s) All-Red Time (s) Lost Time Adjust (s) Total Lost Time (s) Lead/Lag Lag Lag Lead Lead-Lag Optimize? Yes Yes Yes Vehicle Extension (s) Recall Mode None None Min Min None Min Walk Time (s) Flash Dont Walk (s) Pedestrian Calls (#/hr) Act Effct Green (s) Actuated g/c Ratio v/c Ratio Control Delay Queue Delay Total Delay LOS D F E B E B Approach Delay Approach LOS F D D Queue Length 50th (m) 72.5 ~ Queue Length 95th (m) 92.1 #293.9 # # Internal Link Dist (m) Turn Bay Length (m) Base Capacity (vph) Starvation Cap Reductn Spillback Cap Reductn Storage Cap Reductn Reduced v/c Ratio Intersection Summary Area Type: Other Cycle Length: 135 Actuated Cycle Length: Natural Cycle: 90 Control Type: Actuated-Uncoordinated Maximum v/c Ratio: 1.36 Intersection Signal Delay: 69.6 Intersection LOS: E Intersection Capacity Utilization 95. ICU Level of Service F Analysis Period (min) 15 ~ Volume exceeds capacity, queue is theoretically infinite. Queue shown is maximum after two cycles. # 95th percentile volume exceeds capacity, queue may be longer. West Campus Transportation Impact Assessment Synchro 7 - Report Updated Geometry Page 5
272 Lanes, Volumes, Timings 2039 Post Development Peds Sens 28: West Campus Way & Shaganappi Trail PM Peak Hour Queue shown is maximum after two cycles. Splits and Phases: 28: West Campus Way & Shaganappi Trail West Campus Transportation Impact Assessment Synchro 7 - Report Updated Geometry Page 6
273 Lanes, Volumes, Timings 2039 Post Development Peds Sens 26: West Campus Way & West Campus Drive PM Peak Hour Lane Group EBL EBT EBR WBL WBT WBR NBL NBT NBR SBL SBT SBR Lane Configurations Volume (vph) Ideal Flow (vphpl) Lane Width (m) Storage Length (m) Storage Lanes Taper Length (m) Lane Util. Factor Ped Bike Factor Frt Flt Protected Satd. Flow (prot) Flt Permitted Satd. Flow (perm) Right Turn on Red Yes Yes Yes Yes Satd. Flow (RTOR) Link Speed (k/h) Link Distance (m) Travel Time (s) Confl. Peds. (#/hr) Confl. Bikes (#/hr) Peak Hour Factor Heavy Vehicles (%) 5% 5% 5% 5% 5% 5% 5% 5% 5% 5% 5% 5% Bus Blockages (#/hr) Parking (#/hr) 0 0 Adj. Flow (vph) Shared Lane Traffic (%) Lane Group Flow (vph) Enter Blocked Intersection No No No No No No No No No No No No Lane Alignment Left Left Right Left Left Right Left Left Right Left Left Right Median Width(m) Link Offset(m) Crosswalk Width(m) Two way Left Turn Lane Headway Factor Turning Speed (k/h) Number of Detectors Detector Template Left Thru Left Thru Left Thru Right Left Thru Leading Detector (m) Trailing Detector (m) Detector 1 Position(m) Detector 1 Size(m) Detector 1 Type Cl+Ex Cl+Ex Cl+Ex Cl+Ex Cl+Ex Cl+Ex Cl+Ex Cl+Ex Cl+Ex Detector 1 Channel Detector 1 Extend (s) Detector 1 Queue (s) Detector 1 Delay (s) Turn Type pm+pt pm+pt pm+pt Perm Perm Protected Phases West Campus Transportation Impact Assessment Synchro 7 - Report Updated Geometry Page 1
274 Lanes, Volumes, Timings 2039 Post Development Peds Sens 26: West Campus Way & West Campus Drive PM Peak Hour Lane Group EBL EBT EBR WBL WBT WBR NBL NBT NBR SBL SBT SBR Permitted Phases Detector Phase Switch Phase Minimum Initial (s) Minimum Split (s) Total Split (s) Total Split (%) % 0.0% 12.5% 30.0% 0.0% 16.7% 56.7% 56.7% 40.0% 40.0% 0.0% Maximum Green (s) Yellow Time (s) All-Red Time (s) Lost Time Adjust (s) Total Lost Time (s) Lead/Lag Lead Lag Lead Lag Lead Lag Lag Lead-Lag Optimize? Yes Yes Yes Yes Yes Yes Yes Vehicle Extension (s) Recall Mode None Min None Min None None None None None Walk Time (s) Flash Dont Walk (s) Pedestrian Calls (#/hr) Act Effct Green (s) Actuated g/c Ratio v/c Ratio Control Delay Queue Delay Total Delay LOS C E C C D B D D Approach Delay Approach LOS D C D D Queue Length 50th (m) Queue Length 95th (m) 49.1 # # #167.9 #92.5 Internal Link Dist (m) Turn Bay Length (m) Base Capacity (vph) Starvation Cap Reductn Spillback Cap Reductn Storage Cap Reductn Reduced v/c Ratio Intersection Summary Area Type: Other Cycle Length: 120 Actuated Cycle Length: Natural Cycle: 90 Control Type: Actuated-Uncoordinated Maximum v/c Ratio: 0.98 Intersection Signal Delay: 42.7 Intersection LOS: D Intersection Capacity Utilization 105. ICU Level of Service G Analysis Period (min) 15 # 95th percentile volume exceeds capacity, queue may be longer. West Campus Transportation Impact Assessment Synchro 7 - Report Updated Geometry Page 2
275 Lanes, Volumes, Timings 2039 Post Development Peds Sens 26: West Campus Way & West Campus Drive PM Peak Hour Queue shown is maximum after two cycles. Splits and Phases: 26: West Campus Way & West Campus Drive West Campus Transportation Impact Assessment Synchro 7 - Report Updated Geometry Page 3
276 Lanes, Volumes, Timings 2039 Post Development Peds Sens 36: West Campus Way & 39 Street NW PM Peak Hour Lane Group EBL EBT WBT WBR SBL SBR Lane Configurations Volume (vph) Ideal Flow (vphpl) Lane Width (m) Lane Util. Factor Ped Bike Factor Frt Flt Protected Satd. Flow (prot) Flt Permitted Satd. Flow (perm) Right Turn on Red Yes Yes Satd. Flow (RTOR) Link Speed (k/h) Link Distance (m) Travel Time (s) Confl. Peds. (#/hr) Confl. Bikes (#/hr) Peak Hour Factor Heavy Vehicles (%) 5% 5% 5% 5% 5% 5% Bus Blockages (#/hr) Parking (#/hr) Adj. Flow (vph) Shared Lane Traffic (%) Lane Group Flow (vph) Enter Blocked Intersection No No No No No No Lane Alignment Left Left Left Right Left Right Median Width(m) Link Offset(m) Crosswalk Width(m) Two way Left Turn Lane Headway Factor Turning Speed (k/h) Number of Detectors Detector Template Thru Thru Left Right Leading Detector (m) Trailing Detector (m) Detector 1 Position(m) Detector 1 Size(m) Detector 1 Type Cl+Ex Cl+Ex Cl+Ex Cl+Ex Cl+Ex Detector 1 Channel Detector 1 Extend (s) Detector 1 Queue (s) Detector 1 Delay (s) Turn Type pm+pt Perm Protected Phases Permitted Phases 4 6 Detector Phase Switch Phase West Campus Transportation Impact Assessment Synchro 7 - Report Updated Geometry Page 7
277 Lanes, Volumes, Timings 2039 Post Development Peds Sens 36: West Campus Way & 39 Street NW PM Peak Hour Lane Group EBL EBT WBT WBR SBL SBR Minimum Initial (s) Minimum Split (s) Total Split (s) Total Split (%) % 28.9% 0.0% 30.0% 30.0% Maximum Green (s) Yellow Time (s) All-Red Time (s) Lost Time Adjust (s) Total Lost Time (s) Lead/Lag Lead Lag Lead-Lag Optimize? Yes Yes Vehicle Extension (s) Recall Mode None Min Min None None Walk Time (s) Flash Dont Walk (s) Pedestrian Calls (#/hr) Act Effct Green (s) Actuated g/c Ratio v/c Ratio Control Delay Queue Delay Total Delay LOS C A C C B Approach Delay Approach LOS C C B Queue Length 50th (m) Queue Length 95th (m) # # Internal Link Dist (m) Turn Bay Length (m) Base Capacity (vph) Starvation Cap Reductn Spillback Cap Reductn Storage Cap Reductn Reduced v/c Ratio Intersection Summary Area Type: Other Cycle Length: 90 Actuated Cycle Length: 86.1 Natural Cycle: 80 Control Type: Actuated-Uncoordinated Maximum v/c Ratio: 0.87 Intersection Signal Delay: 25.7 Intersection LOS: C Intersection Capacity Utilization 79. ICU Level of Service D Analysis Period (min) 15 # 95th percentile volume exceeds capacity, queue may be longer. Queue shown is maximum after two cycles. West Campus Transportation Impact Assessment Synchro 7 - Report Updated Geometry Page 8
278 Lanes, Volumes, Timings 2039 Post Development Peds Sens 36: West Campus Way & 39 Street NW PM Peak Hour Splits and Phases: 36: West Campus Way & 39 Street NW West Campus Transportation Impact Assessment Synchro 7 - Report Updated Geometry Page 9
279 HCM Unsignalized Intersection Capacity Analysis 2039 Post Development Peds Sens 38: Collegiate Rd & Collegiate Blvd PM Peak Hour Movement EBL EBT WBT WBR SBL SBR Lane Configurations Sign Control Stop Stop Stop Volume (vph) Peak Hour Factor Hourly flow rate (vph) Direction, Lane # EB 1 EB 2 WB 1 WB 2 SB 1 SB 2 Volume Total (vph) Volume Left (vph) Volume Right (vph) Hadj (s) Departure Headway (s) Degree Utilization, x Capacity (veh/h) Control Delay (s) Approach Delay (s) Approach LOS B A B Intersection Summary Delay 10.8 HCM Level of Service B Intersection Capacity Utilization 48.0% ICU Level of Service A Analysis Period (min) 15 West Campus Transportation Impact Assessment Synchro 7 - Report Updated Geometry Page 1
280 Civil, Municipal and Traffic Engineering Storm Water Management Legal Survey/Geomatics Transportation Planning APPENDIX J: SIDRA ANALYSIS RESULTS West Campus Transportation Impact Assessment
281 LANE SUMMARY West Campus Blvd and North TCH Interchange Terminal Roundabout Site: AM Peak Hour - Slip Lane Use and Performance Demand Flows Deg. Lane Average Level of 95% Back of Queue Lane SL Cap. Prob. L T R Total HV Cap. Satn Util. Delay Service Vehicles Distance Length Type Adj. Block. veh/h veh/h veh/h veh/h % veh/h v/c % sec veh m m % % South: West Campus Blvd. S Lane LOS A Lane LOS A Turn Bay Approach LOS A East: TCH Ramp Lane LOS A Approach LOS A North: West Campus Blvd. N Lane LOS A Approach LOS A Intersection LOS A Level of Service (LOS) Method: Delay (HCM 2000). Roundabout LOS Method: Same as Signalised Intersections. Lane LOS values are based on average delay per lane. Intersection and Approach LOS values are based on average delay for all lanes. Roundabout Capacity Model: SIDRA Standard. SIDRA Standard Delay Model used. 1 Reduced capacity due to a short lane effect Processed: Friday, May 02, :04:40 PM Copyright Akcelik and Associates Pty Ltd SIDRA INTERSECTION Project: T:\Projects\Open\2984.T01 - West Campus Transp Mngmt Plan & TIA\Modelling\UPDATED LANING - FOR REPORT\TCH Ramp and West Campus Drive.sip , D.A. WATT CONSULTING, SINGLE
282 LANE SUMMARY West Campus Blvd and North TCH Interchange Terminal 2039 Post Development Roundabout Site: PM Peak Hour - Slip Lane Use and Performance Demand Flows Deg. Lane Average Level of 95% Back of Queue Lane SL Cap. Prob. L T R Total HV Cap. Satn Util. Delay Service Vehicles Distance Length Type Adj. Block. veh/h veh/h veh/h veh/h % veh/h v/c % sec veh m m % % South: West Campus Blvd. S Lane LOS A Lane LOS A Turn Bay Approach LOS A East: TCH Ramp Lane LOS A Approach LOS A North: West Campus Blvd. N Lane LOS A Approach LOS A Intersection LOS A Level of Service (LOS) Method: Delay (HCM 2000). Roundabout LOS Method: Same as Signalised Intersections. Lane LOS values are based on average delay per lane. Intersection and Approach LOS values are based on average delay for all lanes. Roundabout Capacity Model: SIDRA Standard. SIDRA Standard Delay Model used. Processed: Friday, May 02, :05:35 PM Copyright Akcelik and Associates Pty Ltd SIDRA INTERSECTION Project: T:\Projects\Open\2984.T01 - West Campus Transp Mngmt Plan & TIA\Modelling\UPDATED LANING - FOR REPORT\TCH Ramp and West Campus Drive.sip , D.A. WATT CONSULTING, SINGLE
283 Civil, Municipal and Traffic Engineering Storm Water Management Legal Survey/Geomatics Transportation Planning APPENDIX K: MODEL OUTPUT REGIONAL TRANSPORTATION MODEL FORECAST TRIP GENERATION West Campus Transportation Impact Assessment
 that corresponds to the proposed land uses.")
284 Civil, Municipal and Traffic Engineering Storm Water Management Legal Survey/Geomatics Tr ansportation Planning Regional Transportation Model Forecast Trip Generation The RTM method involved inputting population and employment data into each transportation zone (TZ) that corresponds to the proposed land uses. In addition, the model was updated to reflect the current plans for the transportation network. The model output results provided traffic generation projections for the three TZ s that comprise the West Campus development lands. Two of these three zones have boundaries that coincide with the proposed West Campus site boundaries (TZ 2403 and TZ 2405), however the third zone (TZ 2402) spans across an area that only partially includes West Campus. The majority of TZ 2402 includes the University of Calgary campus and student residences. Figure K1 illustrates the transportation zone boundaries relative to the West Campus lands. FIGURE K1: WEST CAMPUS TRANSPORTATION ZONES
Address Land Use Approximate GSF
 M E M O R A N D U M To: Kara Brewton, From: Nelson\Nygaard Date: March 26, 2014 Subject: Brookline Place Shared Parking Analysis- Final Memo This memorandum presents a comparative analysis of expected
Parking Management Strategies
 Parking Management Strategies Policy Program Potential Effectiveness (percent reduction in demand) Comments Parking Pricing Unbundling and Cash-Out Options Reduced Parking Requirements Transit/TOD Supportive
TRANSPORTATION REVIEW
 TRANSPORTATION REVIEW - PROPOSED MIX OF LAND USES IS CONSISTENT WITH THE CITY S UNDER THE GRANVILLE BRIDGE POLICIES THAT AIM TO MEET NEIGHBOURING RESIDENTS SHOPPING NEEDS AND REDUCE RELIANCE ON AUTOMOBILE
APPENDIX VMT Evaluation
 APPENDIX 2.7-2 VMT Evaluation MEMORANDUM To: From: Mr. Jonathan Frankel New Urban West, Incorporated Chris Mendiara LLG, Engineers Date: May 19, 2017 LLG Ref: 3-16-2614 Subject: Villages VMT Evaluation
ACT Canada Sustainable Mobility Summit Planning Innovations in Practice Session 6B Tuesday November 23, 2010
 ACT Canada Sustainable Mobility Summit Planning Innovations in Practice Session 6B Tuesday November 23, 2010 Presentation Outline Context t of Mississauga i City Centre Implementing Paid Parking and TDM
West LRT. Alignment Update and Costing Report May Calgary Transit Transportation Planning Clifton ND Lea Consultants
 West LRT Alignment Update and Costing Report 2006 May Calgary Transit Transportation Planning Clifton ND Lea Consultants West LRT Update Background The service area for West LRT is generally described
METRO Orange Line BRT American Boulevard Station Options
 METRO Orange Line BRT American Boulevard Station Options Bloomington City Council Work Session November 18, 2013 Christina Morrison BRT/Small Starts Project Office Coordinating Planning and Design AMERICAN
Parking Management Element
 Parking Management Element The State Transportation Planning Rule, adopted in 1991, requires that the Metropolitan Planning Organization (MPO) area implement, through its member jurisdictions, a parking
The Engineering Department recommends Council receive this report for information.
 CORPORATE REPORT NO: R161 COUNCIL DATE: July 23, 2018 REGULAR COUNCIL TO: Mayor & Council DATE: July 19, 2018 FROM: General Manager, Engineering FILE: 8740-01 SUBJECT: Surrey Long-Range Rapid Transit Vision
CORE AREA SPECIFIC PLAN
 only four (A, B, D, and F) extend past Eighth Street to the north, and only Richards Boulevard leaves the Core Area to the south. This street pattern, compounded by the fact that Richards Boulevard is
Location Concept Plan Amendment Recommendation Approved 2011 Concept Plan
 Valley Line West LRT Concept Plan Recommended Amendments Lewis Farms LRT Terminus Site Location Concept Plan Amendment Recommendation Approved 2011 Concept Plan Lewis Farms LRT terminus site, 87 Avenue/West
Transportation Demand Management Element
 Transportation Demand Management Element Over the years, our reliance on the private automobile as our primary mode of transportation has grown substantially. Our dependence on the automobile is evidenced
appendix 4: Parking Management Study, Phase II
 appendix 4: Parking Management Study, Phase II A4-1 A4-2 Eastlake Parking Management Study Final Phase 2 Report Future Parking Demand & Supply January 6, 2017 Submitted by Denver Corp Center III 7900 E.
Executive Summary. Draft Environmental Impact Statement/Environmental Impact Report ES-1
 Executive Summary Introduction The Eastside Transit Corridor Phase 2 Project is a vital public transit infrastructure investment that would provide a transit connection to the existing Metro Gold Line
BROWARD BOULEVARD CORRIDOR TRANSIT STUDY
 BROWARD BOULEVARD CORRIDOR TRANSIT STUDY FM # 42802411201 EXECUTIVE SUMMARY July 2012 GOBROWARD Broward Boulevard Corridor Transit Study FM # 42802411201 Executive Summary Prepared For: Ms. Khalilah Ffrench,
2.0 Development Driveways. Movin Out June 2017
 Movin Out June 2017 1.0 Introduction The proposed Movin Out development is a mixed use development in the northeast quadrant of the intersection of West Broadway and Fayette Avenue in the City of Madison.
BARRHAVEN FELLOWSHIP CRC 3058 JOCKVALE ROAD OTTAWA, ONTARIO TRANSPORTATION BRIEF. Prepared for:
 BARRHAVEN FELLOWSHIP CRC 3058 JOCKVALE ROAD OTTAWA, ONTARIO TRANSPORTATION BRIEF Prepared for: Barrhaven Fellowship CRC 3058 Jockvale Road Ottawa, ON K2J 2W7 December 7, 2016 116-649 Report_1.doc D. J.
EUGENE-SPRINGFIELD, OREGON EAST WEST PILOT BRT LANE TRANSIT DISTRICT
 EUGENE-SPRINGFIELD, OREGON EAST WEST PILOT BRT LANE TRANSIT DISTRICT (BRIEF) Table of Contents EUGENE-SPRINGFIELD, OREGON (USA)... 1 COUNTY CONTEXT AND SYSTEM DESCRIPTION... 1 SYSTEM OVERVIEW... 1 PLANNING
Traffic Impact Analysis West Street Garden Plots Improvements and DuPage River Park Garden Plots Development Naperville, Illinois
 Traffic Impact Analysis West Street Garden Plots Improvements and DuPage River Park Garden Plots Development Naperville, Illinois Submitted by April 9, 2009 Introduction Kenig, Lindgren, O Hara, Aboona,
Calgary Transit and the Calgary Transportation Plan Chris Jordan, M.Sc., P.Eng. Coordinator, Strategic Transit Planning, Calgary Transit
 Calgary Transit and the Calgary Transportation Plan Chris Jordan, M.Sc., P.Eng. Coordinator, Strategic Transit Planning, Calgary Transit 1. Plan It Calgary the new Municipal Development Plan and Calgary
Green Line LRT: Beltline Recommendation Frequently Asked Questions
 Green Line LRT: Beltline Recommendation Frequently Asked Questions June 2017 Quick Facts Administration has evaluated several alignment options that would connect the Green Line in the Beltline to Victoria
Green Line LRT: Beltline Segment Update April 19, 2017
 Green Line LRT: Beltline Segment Update April 19, 2017 Quick Facts On April 11, 2017, City Council approved Administration s recommendation for the Green Line to be underground in the Beltline from 2 Street
Denver Car Share Program 2017 Program Summary
 Denver Car Share Program 2017 Program Summary Prepared for: Prepared by: Project Manager: Malinda Reese, PE Apex Design Reference No. P170271, Task Order #3 January 2018 Table of Contents 1. Introduction...
1 Downtown LRT Connector: Draft Concept
 Downtown LRT Connector: Draft Concept Plan November 2010 We re moving forward. Get involved. On June 21, 2010, City Council approved a street-level downtown LRT route, including a connector for the future
Metra Milwaukee District West Line Transit-Friendly Development Plan
 Metra Milwaukee District West Line Transit-Friendly Development Plan Community Input Workshop April 6, 2011 Overview of Presentation Workshop Goals Study Context Existing Conditions Market Overview Employment
V03. APTA Multimodal Operations Planning Workshop August Green Line LRT
 V03 APTA Multimodal Operations Planning Workshop August 2016 Green Line LRT 2 Presentation Outline Past Present Future 3 16/03/2016 RouteAhead Update 4 4 16/03/2016 RouteAhead Update 5 5 16/03/2016 6 6
West Broadway Transit Study. Community Advisory Committee September 17, 2015
 West Broadway Transit Study Community Advisory Committee September 17, 2015 Introductions Community Engagement Summer Outreach Fall Outreach Technical Analysis Process Update Alternatives Review Economic
Mississauga Bus Rapid Transit Preliminary Design Project
 Mississauga Bus Rapid Transit Preliminary Design Project PUBLIC INFORMATION CENTRE OCTOBER 2008 WELCOME The Mississauga Bus Rapid Transit (BRT) Project Thank you for attending this Public Information Centre.
Mercer Island Center for the Arts Parking Management Plan
 Parking Stalls Mercer Island Center for the Arts Parking Management Plan June 15, 2016 This Parking Management Plan (P) covers all tenants at the Mercer Island Center for the Arts (MICA) campus, including
King County Metro. Columbia Street Transit Priority Improvements Alternative Analysis. Downtown Southend Transit Study. May 2014.
 King County Metro Columbia Street Transit Priority Improvements Alternative Analysis Downtown Southend Transit Study May 2014 Parametrix Table of Contents Introduction... 1 Methodology... 1 Study Area...
Pedestrians, Cars, Buses and Trains? Considerations for Rapid Transit Service at Western University
 Pedestrians, Cars, Buses and Trains? Considerations for Rapid Transit Service at Western University Shift: The City of London s Rapid Transit Proposal Shift: The City of London s Rapid Transit Proposal
Click to edit Master title style
 Nelson/Nygaard Consulting Associates SERVICE IMPROVEMENT STRATEGIES September 22, 2015 1 PROJECT OVERVIEW & WORK TO DATE 1. Extensive stakeholder involvement Throughout 2. System and market assessment
Green Line Long-Term Investments
 Enhancements Short-term improvements to keep Austin moving. Investments Long-term projects to support our future. Mobility Hubs MetroRapid MetroRail MetroExpress Connectors Circulators Project Connect
Appendix C. Parking Strategies
 Appendix C. Parking Strategies Bremerton Parking Study Introduction & Project Scope Community concerns regarding parking impacts in Downtown Bremerton and the surrounding residential areas have existed
TORONTO TRANSIT COMMISSION REPORT NO.
 Form Revised: February 2005 TORONTO TRANSIT COMMISSION REPORT NO. MEETING DATE: October 24, 2012 SUBJECT: DOWNTOWN RAPID TRANSIT EXPANSION STUDY (DRTES) PHASE 1 STRATEGIC PLAN ACTION ITEM RECOMMENDATIONS
Executive Summary. Treasure Valley High Capacity Transit Study Priority Corridor Phase 1 Alternatives Analysis October 13, 2009.
 Treasure Valley High Capacity Transit Study Priority Corridor Phase 1 Alternatives Analysis October 13, 2009 Background As the Treasure Valley continues to grow, high-quality transportation connections
Transportation & Traffic Engineering
 Transportation & Traffic Engineering 1) Project Description This report presents a summary of findings for a Traffic Impact Analysis (TIA) performed by A+ Engineering, Inc. for the Hill Country Family
EXECUTIVE SUMMARY. The following is an outline of the traffic analysis performed by Hales Engineering for the traffic conditions of this project.
 EXECUTIVE SUMMARY This study addresses the traffic impacts associated with the proposed Shopko redevelopment located in Sugarhouse, Utah. The Shopko redevelopment project is located between 1300 East and
LEED v4 Building Design and Construction Quiz #3 LT
 LEED v4 Building Design and Construction Quiz #3 LT 1. How are walking and bicycling distance measured? A. Straight-line radius from a main building entrance B. Straight-line radius from any building entrance
Transportation Sustainability Program
 Transportation Sustainability Program Photo: Sergio Ruiz San Francisco 2016 Roads and public transit nearing capacity Increase in cycling and walking despite less than ideal conditions 2 San Francisco
TIMBERVINE TRANSPORTATION IMPACT STUDY FORT COLLINS, COLORADO JANUARY Prepared for:
 TIMBERVINE TRANSPORTATION IMPACT STUDY FORT COLLINS, COLORADO JANUARY 2014 Prepared for: Hartford Companies 1218 W. Ash Street Suite A Windsor, Co 80550 Prepared by: DELICH ASSOCIATES 2272 Glen Haven Drive
TRAFFIC IMPACT STUDY. USD #497 Warehouse and Bus Site
 TRAFFIC IMPACT STUDY for USD #497 Warehouse and Bus Site Prepared by: Jason Hoskinson, PE, PTOE BG Project No. 16-12L July 8, 216 145 Wakarusa Drive Lawrence, Kansas 6649 T: 785.749.4474 F: 785.749.734
2 EXISTING ROUTE STRUCTURE AND SERVICE LEVELS
 2 EXISTING ROUTE STRUCTURE AND SERVICE LEVELS In the Study Area, as in most of the Metro Transit network, there are two distinct route structures. The base service structure operates all day and the peak
THE WAY WE MOVE LRT FOR EVERYONE
 THE WAY WE MOVE LRT FOR EVERYONE 2 LRT for Everyone LRT FOR EVERYONE Light rail is about more than transit; it s about transforming Edmonton. As the city grows, so do its transportation needs. LRT is an
August 2, 2010 Public Meeting
 Public Meeting LYMMO Expansion Alternatives Analysis Study Purpose of study is to provide a fresh look at potential LYMMO expansion, following Federal Transit Administration (FTA) Alternatives Analysis
Car Sharing at a. with great results.
 Car Sharing at a Denver tweaks its parking system with great results. By Robert Ferrin L aunched earlier this year, Denver s car sharing program is a fee-based service that provides a shared vehicle fleet
Fresno County. Sustainable Communities Strategy (SCS) Public Workshop
 Public Workshop") Fresno County Sustainable Communities Strategy (SCS) Public Workshop Project Background Senate Bill 375 Regional Transportation Plan (RTP) Greenhouse gas emission reduction through integrated transportation
Fresno County Sustainable Communities Strategy (SCS) Public Workshop Project Background Senate Bill 375 Regional Transportation Plan (RTP) Greenhouse gas emission reduction through integrated transportation
Draft Marrickville Car Share Policy 2014
 Draft Marrickville Car Share Policy 2014 1. Background 1.1. Marrickville Council has supported car sharing in the LGA since 2007 as part of a holistic approach to encouraging more sustainable modes of
Otay Ranch Station 2020 MOBILITY SERVICES MAP REGIONAL MOBILITY HUB IMPLEMENTATION STRATEGY
 MAGDALENA REGIONAL MOBILITY HUB IMPLEMENTATION STRATEGY Otay Ranch Station Mobility hubs are transportation centers located in smart growth areas served by high frequency transit service. They provide
The City of Toronto s Transportation Strategy July 2007
 The City of Toronto s Transportation Strategy July 2007 Presentation Outline Transportation Statistics Transportation Building Blocks Toronto s Official Plan Transportation and City Building Vision Projects
2.4 TRANSIT VISION 2040 FROM VISION TO ACTION. Support the revitalization of urban cores STRATEGIC DIRECTION
 TRANSIT VISION 2040 FROM VISION TO ACTION TRANSIT VISION 2040 defines a future in which public transit maximizes its contribution to quality of life with benefits that support a vibrant and equitable society,
EXECUTIVE SUMMARY. Introduction
 EXECUTIVE SUMMARY Introduction The purpose of this study is to ensure that the Village, in cooperation and coordination with the Downtown Management Corporation (DMC), is using best practices as they plan
Attachment 5. High Speed Transit Planning Study REPORT SUMMARY. Prepared by: City of Edmonton Transportation Planning Branch. Stantec Consulting Ltd.
 Attachment 5 High Speed Transit Planning Study Prepared by: City of Edmonton Transportation Planning Branch Stantec Consulting Ltd. Transportation Management & Design, Inc. with Lea Consulting Ltd. [135-35130]
TRAVEL DEMAND FORECASTS
 Jiangxi Ji an Sustainable Urban Transport Project (RRP PRC 45022) TRAVEL DEMAND FORECASTS A. Introduction 1. The purpose of the travel demand forecasts is to assess the impact of the project components
Lacey Gateway Residential Phase 1
 Lacey Gateway Residential Phase Transportation Impact Study April 23, 203 Prepared for: Gateway 850 LLC 5 Lake Bellevue Drive Suite 02 Bellevue, WA 98005 Prepared by: TENW Transportation Engineering West
Chapter 4 : THEME 2. Transportation
 Chapter 4 : THEME 2 Strengthen connections to keep the Central Area easy to reach and get around 55 Figure 4.2.1 Promote region-wide transit investments. Metra commuter rail provides service to the east,
GTA West Corridor Planning and EA Study Stage 1
 GTA West Corridor Planning and EA Study Stage 1 Draft Development Strategy Presentation to Peel Goods Movement Task Force April 8 2011 Study Areas 2 Unique Approach Unprecedented two-stage EA process:
King Street & Wyman Road Transportation Impact Study & Transportation Demand Management. Paradigm Transportation Solutions Limited
 King Street & Wyman Road Transportation Impact Study & Transportation Demand Management Paradigm Transportation Solutions Limited April 28 Project Summary Project Number 822 April 28 Client RISE Commercial
6/6/2018. June 7, Item #1 CITIZENS PARTICIPATION
 June 7, 2018 Item #1 CITIZENS PARTICIPATION 1 Item #2 APPROVAL OF MINUTES Item #3 TRAC GOALS, FRAMEWORK & AGENDA REVIEW 2 COMMITTEE GOALS Learn about Southern Nevada s mobility challenges, new developments
CEDAR AVENUE TRANSITWAY Implementation Plan Update
 CEDAR AVENUE TRANSITWAY Implementation Plan Update EECUTIVE SUMMARY DECEMBER 2015 Executive Summary In 2013, the Twin Cities metropolitan area s first bus rapid transit (BRT) line, the METRO Red Line,
M E M O R A N D U M INTRODUCTION. POTENTIAL TDM STRATEGIES Marketing & Management. Residents & Employees. Exhibit 6
 Exhibit 6 M E M O R A N D U M To: From: Joe Ernst and Bryan Graves Nelson\Nygaard Date: February 6, 2015 Subject: Preliminary TDM Strategies INTRODUCTION The memorandum provides an overview of potential
5. OPPORTUNITIES AND NEXT STEPS
 5. OPPORTUNITIES AND NEXT STEPS When the METRO Green Line LRT begins operating in mid-2014, a strong emphasis will be placed on providing frequent connecting bus service with Green Line trains. Bus hours
4. Transportation Plan
 The sizes of the most suitable sites are indicated in Table 4.3.6.2. Table 4.3.6.2: Site Sizes and Potential Development Area Potential Development Site Site Size (m 2 ) Area m 2 (3 Floors) D1 29,000 87,000
Public Meeting. City of Chicago Department of Transportation & Department of Housing and Economic Development
 Public Meeting City of Chicago Department of Transportation & Department of Housing and Economic Development Funded by Regional Transportation Authority September 12, 2011 In partnership with Presentation
Newmarket GO Station Mobility Hub Study. Open House #1 MAY 18, 2017
 Newmarket GO Station Mobility Hub Study Open House #1 Naren Garg Metrolinx Advisor, RER Project Planning Amy Shepherd IBI Group Associate, Manager, Planning INTRODUCTIONS - METROLINX Metrolinx is an agency
Public Meeting. March 21, 2013 Mimosa Elementary School
 Public Meeting March 21, 2013 Mimosa Elementary School Today s Meeting Purpose 2 Where We Are The Process What We ve Heard and Findings Transit Technologies Station Types Break-out Session Where We Are
ANDERSON PROPERTY SITE ANALYSIS
 ANDERSON PROPERTY SITE ANALYSIS Introduction The Montgomery County Department of Transportation (MCDOT) initiated a feasibility study in the fall of 2012 to evaluate the need for transit service expansion
U N I V E R S I T Y O F B R I T I S H C O L U M B I A. Fall 2008 Transportation Status Report
 U N I V E R S I T Y O F B R I T I S H C O L U M B I A Fall 2008 Transportation Status Report 6 February 2009 U N I V E R S I T Y O F B R I T I S H C O L U M B I A Fall 2008 Transportation Status Report
Subarea Study. Manning Avenue (CSAH 15) Corridor Management and Safety Improvement Project. Final Version 1. Washington County.
 Corridor Management and Safety Improvement Project. Final Version 1. Washington County.") Subarea Study Manning Avenue (CSAH 15) Corridor Management and Safety Improvement Project Final Version 1 Washington County June 12, 214 SRF No. 138141 Table of Contents Introduction... 1 Forecast Methodology
Subarea Study Manning Avenue (CSAH 15) Corridor Management and Safety Improvement Project Final Version 1 Washington County June 12, 214 SRF No. 138141 Table of Contents Introduction... 1 Forecast Methodology
GASOLINE SERVICE STATION 1618, 1622 ROGER STEVENS DRIVE OTTAWA, ONTARIO TRANSPORTATION IMPACT ASSESSMENT. Prepared for:
 GASOLINE SERVICE STATION 1618, 1622 ROGER STEVENS DRIVE OTTAWA, ONTARIO TRANSPORTATION IMPACT ASSESSMENT Prepared for: Invecta Development (Ottawa) Corporation 758 Shanks Height Milton, ON L9T 7P7 May
4 Circulation & Transportation
 4.1 Mobility Network The mobility network at the new St. Paul s hospital and health campus is comprised of an interconnected system of sidewalks, cycle paths, transit routes and roadways. Figure 4-1: Indicative
What We Heard Report - Metro Line NW LRT
 What We Heard Report - Metro Line NW LRT by Metro Line NW LRT Project Team LRT Projects City of Edmonton April 11, 2018 Project / Initiative Background Name Date Location Metro Line Northwest Light Rail
Welcome. Green Line in Your Community
 Welcome Green Line in Your Community Today's session will provide you with information about Administration's recommendation for connecting the Green Line in the Beltline to Victoria Park and Inglewood/Ramsay
Table of Contents INTRODUCTION... 3 PROJECT STUDY AREA Figure 1 Vicinity Map Study Area... 4 EXISTING CONDITIONS... 5 TRAFFIC OPERATIONS...
 Crosshaven Drive Corridor Study City of Vestavia Hills, Alabama Table of Contents INTRODUCTION... 3 PROJECT STUDY AREA... 3 Figure 1 Vicinity Map Study Area... 4 EXISTING CONDITIONS... 5 TRAFFIC OPERATIONS...
Alpine Highway to North County Boulevard Connector Study
 Alpine Highway to North County Boulevard Connector Study prepared by Avenue Consultants March 16, 2017 North County Boulevard Connector Study March 16, 2017 Table of Contents 1 Summary of Findings... 1
TRAFFIC IMPACT ANALYSIS
 TRAFFIC IMPACT ANALYSIS Emerald Isle Commercial Development Prepared by SEPI Engineering & Construction Prepared for Ark Consulting Group, PLLC March 2016 I. Executive Summary A. Site Location The Emerald
2030 Multimodal Transportation Study
 2030 Multimodal Transportation Study City of Jacksonville Planning and Development Department Prepared by Ghyabi & Associates April 29,2010 Introduction Presentation Components 1. Study Basis 2. Study
4.0 TIER 2 ALTERNATIVES
 4.0 TIER 2 ALTERNATIVES The Tier 2 Alternatives represent the highest performing Tier 1 Alternatives. The purpose of the Tier 2 Screening was to identify the LPA utilizing a more robust list of evaluation
RE: A Traffic Impact Statement for a proposed development on Quinpool Road
 James J. Copeland, P.Eng. GRIFFIN transportation group inc. 30 Bonny View Drive Fall River, NS B2T 1R2 May 31, 2018 Ellen O Hara, P.Eng. Project Engineer DesignPoint Engineering & Surveying Ltd. 200 Waterfront
I-820 (East) Project Description. Fort Worth District. Reconstruct Southern I-820/SH 121 Interchange
 Project Description. Fort Worth District. Reconstruct Southern I-820/SH 121 Interchange") I-820 (East) Project Description Fort Worth District Reconstruct Southern I-820/SH 121 Interchange I-820 from approximately 2,000 feet north of Pipeline Road/Glenview Drive to approximately 3,200 feet
I-820 (East) Project Description Fort Worth District Reconstruct Southern I-820/SH 121 Interchange I-820 from approximately 2,000 feet north of Pipeline Road/Glenview Drive to approximately 3,200 feet
CITY OF LONDON STRATEGIC MULTI-YEAR BUDGET ADDITIONAL INVESTMENTS BUSINESS CASE # 6
 2016 2019 CITY OF LONDON STRATEGIC MULTI-YEAR BUDGET ADDITIONAL INVESTMENTS BUSINESS CASE # 6 STRATEGIC AREA OF FOCUS: SUB-PRIORITY: STRATEGY: INITIATIVE: INITIATIVE LEAD(S): BUILDING A SUSTAINABLE CITY
IV. ENVIRONMENTAL IMPACT ANALYSIS K.2. PARKING
 IV. ENVIRONMENTAL IMPACT ANALYSIS K.2. PARKING ENVIRONMENTAL SETTING The following analysis summarizes the findings and conclusions of the Traffic Analysis (Traffic Study), prepared by The Mobility Group,
Valley Metro Overview. ITE/IMSA Spring Conference March 6, 2014
 Valley Metro Overview ITE/IMSA Spring Conference March 6, 2014 Valley Metro Who Are We? Operate Regional Transit Services Valley Metro and Phoenix are region s primary service providers Light Rail and
STRATEGIC PRIORITIES AND POLICY COMMITTEE MAY 5, 2016
 STRATEGIC PRIORITIES AND POLICY COMMITTEE MAY 5, 2016 Shift Rapid Transit Initiative Largest infrastructure project in the city s history. Rapid Transit initiative will transform London s public transit
2. Valley Circle Boulevard/Andora Avenue/Baden Avenue and Lassen Street
 IV.J TRANSPORTATION 1. INTRODUCTION This section presents an overview of the existing traffic and circulation system in and surrounding the project site. This section also discusses the potential impacts
Downtown Lee s Summit Parking Study
 Downtown Lee s Summit Parking Study As part of the Downtown Lee s Summit Master Plan, a downtown parking and traffic study was completed by TranSystems Corporation in November 2003. The parking analysis
US 81 Bypass of Chickasha Environmental Assessment Public Meeting
 US 81 Bypass of Chickasha Environmental Assessment Public Meeting March 14, 2013 Introductions ODOT FHWA SAIC Meeting Purpose Present need for bypass Provide responses to 10/04/11 public meeting comments
TABLE OF CONTENTS 1.0 INTRODUCTION AND SUMMARY Purpose of Report and Study Objectives... 2
 TABLE OF CONTENTS 1.0 INTRODUCTION AND SUMMARY 1 1.1 Purpose of Report and Study Objectives... 2 1.2 Executive Summary... 3 1.2.1 Site Location and Study Area... 3 1.2.2 Development Description... 3 1.2.3
Chapter 740, Street Vending One Year Review
 STAFF REPORT ACTION REQUIRED Chapter 740, Street Vending One Year Review Date: April 7, 2015 To: From: Wards: Reference Number: Licensing and Standards Committee Executive Director, Municipal Licensing
Best Route. Best Care. The Milwaukee Regional Medical Center s Alternative Transportation Program
 Best Route to the Best Care Programs include: CARPOOL Make a friend; save the earth! PARK & RIDE SHUTTLE SERVICE Avoid the construction and the long walk from the parking lot. WASHINGTON COUNTY COMMUTER
Parks and Transportation System Development Charge Methodology
 City of Sandy Parks and Transportation System Development Charge Methodology March, 2016 Background In order to implement a City Council goal the City of Sandy engaged FCS Group in January of 2015 to update
APPENDIX E. Traffic Analysis Report
 APPENDIX E Traffic Analysis Report THIS PAGE INTENTIONALLY BLANK EAGLE RIVER TRAFFIC MITIGATION PHASE I OLD GLENN HIGHWAY/EAGLE RIVER ROAD INTERSECTION IMPROVEMENTS TRAFFIC ANALYSIS Eagle River, Alaska
Planned Development Application 1450 Sherman Avenue Evanston, IL TRAFFIC CIRCULATION IMPACT STUDY
 Planned Development Application 1450 Sherman Avenue Evanston, IL 60201 14 TRAFFIC CIRCULATION IMPACT STUDY Traffic Impact Study 1454 Sherman Mixed-Use Development Evanston, Illinois Prepared for Prepared
Executive Summary EXECUTIVE SUMMARY Parking Issues Trenton Downtown Parking Policy and Sidewalk Design Standards E.S. Page 1 Final Report 2008
 EXECUTIVE SUMMARY A walkable environment that accommodates market demand while minimizing the negative impacts of growth is an important element in promoting the City s downtown revitalization. There are
Craig Scheffler, P.E., PTOE HNTB North Carolina, P.C. HNTB Project File: Subject
 TECHNICAL MEMORANDUM To Kumar Neppalli Traffic Engineering Manager Town of Chapel Hill From Craig Scheffler, P.E., PTOE HNTB North Carolina, P.C. Cc HNTB Project File: 38435 Subject Obey Creek TIS 2022
The South Waterfront District and the Portland Aerial Tram
 The South Waterfront District and the Portland Aerial Tram How infrastructure investment can catalyze redevelopment and remove barriers to healthy lifestyles Role of transportation infrastructure in creating
IMPROVEMENT CONCEPTS
 IMPROVEMENT CONCEPTS for the South Novato Transit Hub Study Prepared by: January 11, 2010 DKS Associates With Wilbur Smith Associates IMPROVEMENT CONCEPTS Chapter 1: Introduction 1. INTRODUCTION The strategic
FREQUENTLY ASKED QUESTIONS
 FREQUENTLY ASKED QUESTIONS 2018 What is the More MARTA Atlanta program? The More MARTA Atlanta program is a collaborative partnership between MARTA and the City of Atlanta to develop and implement a program
Breakout Session. The Mobility Challenges of Our Growing & Sprawling Upstate
 Breakout Session The Mobility Challenges of Our Growing & Sprawling Upstate The Mobility Challenges of Our Growing & Sprawling Upstate Why is our suburban and sprawling development pattern a challenge
TRANSPORTATION MASTER PLAN AND TRANSPORTATION IMPACT ASSESSMENT FOR THREE SISTERS MOUNTAIN VILLAGE RESORT CENTRE ASP
 TRANSPORTATION MASTER PLAN AND TRANSPORTATION IMPACT ASSESSMENT FOR THREE SISTERS MOUNTAIN VILLAGE RESORT CENTRE ASP OCTOBER 2016 STANDARD LIMITATIONS This report was prepared by MMM Group Limited, a WSP