Appendix C Transportation. C-1: Chelsea Market Survey Results C-2: Transportation Demand Factors Memo C-3: Proposed Safety Improvements
|
|
|
- Roberta Bridges
- 6 years ago
- Views:
Transcription
1 Appendix C Transportation C-1: Chelsea Market Survey Results C-2: Transportation Demand Factors Memo C-3: Proposed Safety Improvements
2 Appendix C-1 Chelsea Market Survey Results
3
4 CHELSEA MARKET SURVEY RESULTS FEBRUARY 2011 Conducted by Sam Schwartz Engineering Saturday, February 12, 2011 and Wednesday, February 16, What was your primary mode of travel to Chelsea Market Today? Mode 1 Mode 2 Weekday Midday Weekday PM Saturday Midday Saturday Evening Auto 12.2% 6.6% 3.8% 14.1% Bike 2.4% 1.5% 3.8% 1.3% Bus 3.3% 3.6% 5.1% 1.9% Bus Subway 0.0% 0.0% 0.0% 0.0% Ferry Subway 0.8% 0.0% 0.0% 0.0% Rail LIRR Subway 0.8% 0.7% 0.0% 1.3% Rail LIRR 0.0% 0.7% 0.6% 1.3% Rail MetroNorth Subway 0.0% 0.0% 0.0% 0.0% Rail NJ Transit 0.8% 0.7% 1.3% 0.0% Rail Path 0.8% 0.7% 1.9% 3.2% Subway 33.3% 42.3% 30.6% 28.2% Subway Bus 1.6% 0.0% 0.0% 0.6% Taxi 5.7% 4.4% 15.3% 9.6% Walk Only 38.2% 38.7% 37.6% 38.5% Total Visitors Sample Size 100.0% 100.0% 100.0% 100.0% If you arrived via auto or taxi, how many people did you travel with, including yourself? Vehicle Occupancy Mode Weekday Saturday Auto Autos People Avg Taxi Taxis People Avg Are you visiting the market or do you work in the building? Total Visitors Total Non Visitors Total Weekday Midday Weekday PM Saturday Midday Saturday Evening What is the neighborhood (i.e. zip code) you traveled directly from? Origin Weekday Midday Weekday PM Saturday Midday Saturday PM Bronx 0.0% 0.0% 2.5% 1.9% Brooklyn 10.6% 10.9% 5.1% 6.4% Manhattan 68.3% 75.9% 81.5% 71.2% Queens 7.3% 2.9% 3.2% 4.5% Staten Island 0.0% 0.0% 1.3% 0.6% Upstate NY 5.7% 1.5% 1.3% 1.3% Long Island 0.8% 1.5% 0.6% 3.2% NJ/PA 6.5% 5.8% 4.5% 10.3% CT 0.8% 1.5% 0.0% 0.6% Total 100.0% 100.0% 100.0% 100.0% Sample Size
5 1. What was your primary mode of travel to Chelsea Market Today? Back Up Survey Data Mode 1 Mode 2 Weekday Midday Weekday PM Saturday Midday Saturday Evening Auto Bike Bus Bus Subway Ferry Subway Rail LIRR Subway Rail LIRR Rail MetroNorth Subway Rail NJ Transit Rail Path Subway Subway Bus Taxi Walk Only Total Visitors
6 4. What is the neighborhood (i.e. zip code) you traveled directly from? Back Up Survey Data Mode Auto Mode Bus Mode Subway Origin Weekday Weekday Saturday Saturday Midday PM Midday Evening Bronx/Upstate/Harlem Midtown/Downtown Upper East Side Battery Park Staten Island/Jersey Holland Tunne New Jersey Lincoln Tunnel/GWB Queens/Long Island Brooklyn New Jersey General Total Auto Origin Weekday Weekday Saturday Saturday Midday PM Midday Evening Bronx Brooklyn Port Authority/Hells Kitchen Uptown General East Village/Union Square Upper West Side Midtown Upper East Side Total Bus Origin Weekday Weekday Saturday Saturday Midday PM Midday Evening Chelsea Chinatown General East Village Financial District General Financial District Wall Street Financial District WTC Greenwich Village Harlem General Hell's Kitchen LIRR/Amtrak Penn Station Lower East Side MetroNorth Grand Central Midtown Midtown East Midtown General NJ Transit Port Authority NOHO SOHO Staten Island Ferry/Battery Park Times Square Upper East Side General Upper West Side General Uptown Washington Heights West Village Bronx General Brooklyn Brighton Brooklyn Downtown Brooklyn Flatbush Brooklyn Greenpoint Brooklyn Williamsburg Brooklyn General Queens Astoria Queen General Queensbridge Total Subway
7 Mode Taxi Mode Walk Mode Bike Origin Weekday Weekday Saturday Saturday Midday PM Midday Evening Midtown Queens JFK Upper West Side Upper East Side West Village East Side Brooklyn New Jersey General SOHO/Chinatown Chelsea Downtown Total Taxi Origin Weekday Weekday Saturday Saturday Midday PM Midday Evening Chelsea 15th Street Chelsea West Village East Village Brooklyn Midtown Midtown West Union Square Midtown East Upper West Side SOHO Chelsea 10th Ave Chelsea 9th Ave Gansvoort 9th Ave Gansvoort 8th Ave Upper East Side Lower East Side Greenwich Village Tribeca Chinatown Chelsea 11th Ave Total Walk Origin Weekday Weekday Saturday Saturday Midday PM Midday Evening Harlem West Village Lower East Side Midtown Chelsea NJ & West Total Bike Total Visitors
8 Appendix C-2 Transportation Demand Factors Memo
9
10 Memorandum To: Naim Rasheed, NYCDOT From: Jeffrey Smithline, PE, PTOE Date: June 2012 Re: Travel Demand Factors Memorandum Sam Schwartz Engineering (SSE) has prepared a preliminary transportation screening for an Environmental Impact Statement (EIS) for the proposed Pier 57 development located along the west side of Route 9A between West 14 th Street and West 16 th Street in Manhattan. This memorandum presents the Level 2 screening assessment, which is a trip assignment review to identify intersections with a net increase of 50 or more vehicle trips, pedestrian elements with a net increase of 200 or more pedestrian trips, a net increase of 50 bus trips in a single direction on a single route, or a net increase of 200 passengers at a subway station or line during any analysis peak hour. Locations that meet these thresholds may require more detailed analyses. The Level 1 screening assessment is included here as Appendix A. The responses to NYCDOT s comments on the original TDF memorandum dated July 8, 2011 are included in Appendices D and E. Based on the preliminary trip generation and assignment assumptions, the study area generally extends from Route 9A to the west, 8 th Avenue to the east, W. 24 th Street to the north, and W. 14 th Street to the south. Proposed Development Program The proposed Pier 57 development would include the following land uses: 24,450 square feet (SF) of quality restaurant 34,764 SF of food counter 202,686 SF of market (retail space) 110,000 SF rooftop (for park use and programmed events) 40,000 SF of art gallery/exhibit space (caisson level) 11,000 SF cultural use (300-seat theatre) 32,700 SF technical arts school 190-slip marina Potential water taxi landing Chicago Los Angeles Newark New York Philadelphia Tampa Washington D.C. 611 Broadway, Suite 415 New York, NY T F
11 Trip Assignment for Pier 57 Memorandum June 2012 Page 2 2 Land Use/Analysis Scenarios The trip generation and assignment estimates were prepared for two land use scenarios. As described in the Preliminary TDF Memorandum, the Typical scenario is the more common condition when the 110,000 SF rooftop will be used as a public open space with an exhibit space. Under the Pre-Event scenario, the rooftop space will be used for high attendance evening events. The remaining land uses will operate the same under both land use scenarios. The following critical peak hours were considered for the Typical land use scenario: Weekday Midday (MD) peak hour: 12-1 PM Weekday commuter peak (PM) peak hour: 5:30-6:30 PM Saturday Midday (SAT MD) peak hour: 12:45-1:45 PM The following critical peak hours were considered for the Pre-Event land use scenario: Weekday Evening Pre-Event peak (EVE) peak hour, representing the 7-8 PM pre-event time period Saturday Evening Pre-Event peak (SAT EVE) peak hour, representing the 7-8 PM preevent time period Trip Assignment Factors Trip assignment factors were generally obtained from trip-origin surveys collected for similar land uses located on the west side of Manhattan or near West Chelsea. The survey data was used to estimate the general direction project trips would come from/go to and to determine which transit routes would be used. Engineering judgment was applied to determine the specific routes within the study area that would be used to access the site. A description of trip assignment factors considered for each land use for auto, taxi, subway, bus, and walk modes is provided below, followed by a description of general trip assignment assumptions that apply to all land uses. Chelsea Market Survey Weekday and Saturday surveys were conducted at Chelsea Market in February 2011 to serve as a basis for trip assignment assumptions for the retail and restaurant space at Pier 57, as well as local walk-only trips to and from the site (SSE, 2011). The survey asked visitors about their origins and which modes they used to travel to Chelsea Market. The results of the survey considered only the mode they used to enter the study area; i.e., if they traveled on a NJ TRANSIT train and transferred to a bus, the bus was considered the mode of travel for analysis purposes. Chelsea Market is an appropriate source because it is a retail space that is primarily made up of small, boutique food shops that allow businesses to combine their manufacturing and retail assets under one roof. Pier 57 would provide similar work-sell spaces for food and fashionrelated businesses. Furthermore, Chelsea Market is located one block from the Pier 57 site.
12 Trip Assignment for Pier 57 Memorandum June 2012 Page 3 3 The Chelsea Market survey was conducted on Saturday, February 12, 2011, from 1:00 PM to 4:00 PM and from 5:00 PM to 8:00 PM and on Wednesday, February 16, 2011, from 11:30 AM to 2:30 PM and 4:30 PM to 7:30 PM. Therefore, the Chelsea Market survey data provided unique trip assignment percentages for the Weekday Midday, Weekday PM, Saturday Midday, and Saturday Evening Pre-Event peak hours. It was assumed that the Weekday Evening Pre- Event trip assignment was the same as the Weekday PM. Percentages were rounded where appropriate to account for variations in sample sizes. The results were correlated by travel mode and origin, such that trip assignment assumptions could be developed for all travel modes to Chelsea Market. The results of the survey are summarized in Appendix B. Market (Retail Space), Restaurant, and Food Counters The market is retail space that is expected to primarily be made up of small retail pods. In total, the space would comprise 202,686 SF of related retail space that is expected to have both a regional and local draw. The development would also include 24,450 SF of quality restaurant space, including an outdoor terrace and 34,764 SF of food counter space. Trip assignment for the retail, restaurant, and food counter land uses was assumed to be the same. Trip assignment assumptions for each travel mode are described below. Auto Trip Assignment Assumptions The Chelsea Market survey data was evaluated to determine the percentage of auto trips that would come from north of the project site, south of the project site, or east of the project site. The following routing assumptions were made: Trips to/from Brooklyn would use various bridges/tunnels to access Route 9A from the south Trips to/from Queens would use the Midtown Tunnel and Queensboro Bridge Half of the trips to/from New Jersey would use the George Washington Bridge/Lincoln Tunnel Half of the trips to/from New Jersey would use the Holland Tunnel Table 1 shows the directions of travel assumed for each peak hour.
13 Trip Assignment for Pier 57 Memorandum June 2012 Page 4 4 Destination Retail (1) Table 1 Market/Retail/Restaurant/Food Counter Land Use: Auto Trip Assignment Land Use From North From South From East Weekday MD 60% 35% 5% Weekday PM 60% 20% 20% Weekday EVE (2) 60% 20% 20% Sat MD 60% 35% 5% Sat EVE 60% 20% 20% Notes: 1. Results based on survey at Chelsea Market (SSE, February 12 and 16, 2011). 2. Assumed Weekday Evening Pre-Event trip assignment is equivalent to the Weekday PM estimates. Taxi Trip Assignment Assumptions The Chelsea Market survey data was evaluated to determine the percentage of taxi trips that would come from north of the project site, south of the project site, or east of the project site. The following routing assumptions were made: Trips to/from Brooklyn would use various bridges/tunnels to access Route 9A from the south Trips to/from Queens would use the Midtown Tunnel and Queensboro Bridge Table 2 shows the directions of travel assumed for each peak hour. Table 2 Market/Retail/Restaurant/Food Counter Land Use: Taxi Trip Assignment Land Use From North From South From East Weekday MD 30% 15% 55% Weekday PM 30% 5% 65% Weekday EVE (2) 30% 5% 65% Sat MD 20% 25% 55% Sat EVE 15% 10% 75% Destination Retail (1) Notes: 1. Results based on survey at Chelsea Market (SSE, February 12 and 16, 2011). 2. Assumed Weekday Evening PreEvent trip assignment is equivalent to the Weekday PM estimates. Subway Trip Assignment Assumptions The Chelsea Market survey data was evaluated to determine the percentage of subway trips that would use New York City Transit (NYCT) subway lines A, C, E, L, 1, 2, or 3. The following assumptions were made: In locations where the A, C, E, and L subway lines could be used to travel to/from the project site, two-thirds of the trips would use the A, C, and E lines, and one-third would use the L line. In locations where the A, C, E, L, 1, 2, and 3 subway lines could be used to travel to/from the project site, 40% were assumed to use the A, C, and E lines, 20% were assumed to use the L line, and 40% were assumed to use the 1, 2, and 3 lines. The percentage of trips that use the A, C, E, and L subway lines were combined since they will use the same subway station at 14 th Street.
14 Trip Assignment for Pier 57 Memorandum June 2012 Page 5 5 For the 1, 2, and 3 subway lines, 15% of the trips were assumed to use the 18 th Street station since it is only accessed by the local subway line (#1) and would likely only attract riders traveling to and from the north. The remaining trips were assumed to use the 14 th Street station. Table 3 shows the directions of travel assumed for each peak hour. Table 3 Market/Retail/Restaurant/Food Counter Land Use: Subway Trip Assignment Land Use ACE/L Lines 123 Lines from 14 th 1 Line from 18 th Street Street Weekday MD 90.0% 9.0% 1.0% Weekday PM 92.0% 6.0% 2.0% Weekday EVE (2) 92.0% 6.0% 2.0% Sat MD 85.0% 12.0% 3.0% Sat EVE 94.0% 5.0% 1.0% Destination Retail (1) Notes: 1. Results based on survey at Chelsea Market (SSE, February 12 and 16, 2011). 2. Assumed Weekday Evening Pre-Event trip assignment is equivalent to the Weekday PM estimates. Bus Trip Assignment Assumptions The Chelsea Market survey data was evaluated to determine the bus routes visitors would use to travel to/from the project site. The following assumptions were made: Bus riders traveling to/from the project site would transfer as necessary to access bus stops closest to the project site. Ultimately, they would all use NYCT routes M11, M14A, and M14D to reach their destination. For bus route M14 passengers, 20% would use route M14A and 80% would use route M14D. A greater percentage would take M14D because it provides closer access to the project site. Table 4 shows the directions of travel assumed for each peak hour. Table 4 Market/Retail/Restaurant/Food Counter Land Use: Bus Trip Assignment Land Use M11 M14A and M14D Destination Retail (1) All Study Periods 30% 70% Notes: 1. Results based on survey at Chelsea Market (SSE, February 12 and 16, 2011). 2. Assumed Weekday Evening Pre-Event trip assignment is equivalent to the Weekday PM estimates. Walk Trip Assignment Assumptions Walk trips generated by the project were assigned to origins external and internal to the study area. Due to the high number of apartment, office, restaurant, and retail uses within the study area, the internally and externally generated trips were assumed to be split 50/50. The Chelsea
15 Trip Assignment for Pier 57 Memorandum June 2012 Page 6 6 Market survey data was used to determine the direction of travel for visitors walking between the project site and external locations. The following assumption was made: Since the survey results were similar for the four survey time periods, the results were averaged and used for all peak hours. Table 5 shows the directions of travel assumed for each peak hour. Table 5 Market/Retail/Restaurant/Food Counter Land Use: Walk Trip Assignment Land Use From the East From the North From the South Destination Retail (1) All Study Periods 42.5% 36.0% 21.5% Notes: 1. Results based on survey at Chelsea Market (SSE, February 12 and 16, 2011). A review of the land uses on each block within the study area was used to estimate which block faces would generate project trips that would originate within the study area. The internal walk trip origins were added to the pedestrian network at the midblock location along each block face. Cultural Use and Rooftop Event The trip assignment assumptions for the Cultural Use were conservatively based on a 300-seat theater as it would generate the greatest number of trips for a cultural use in the space available. In general, the same trip assignment assumptions were used for the Rooftop Event. However, the Rooftop Event space would only be open during the Weekday and Saturday Evening Pre-Event peak hours and the theater would operate during additional peak hours. The trip assignment percentages for these land uses was based on a trip origin survey conducted at Pier 54 during a movie event on July 8, 2009 from 6:00 PM to 9:00 PM (AKRF, 2009). This survey data is an appropriate source because the 2009 Pier 54 event is similar to one that would be held at the project site and because it is located on Route 9A near the project site. The 2009 Pier 54 survey trip assignment percentages were applied to all peak hours. Trip assignment assumptions for each travel mode are described below. Auto and Taxi Trip Assignment Assumptions The 2009 Pier 54 survey data was evaluated to determine the percentage of auto and taxi trips that would come from north of the project site, south of the project site, or east of the project site. The following routing assumptions were made:
16 Trip Assignment for Pier 57 Memorandum June 2012 Page 7 7 Trips to/from Brooklyn would use various bridges/tunnels to access Route 9A from the south Trips to/from Queens would use the Midtown Tunnel and Queensboro Bridge Trips to/from Manhattan were split evenly between Route 9A to the north and south and other origins to the east. Half of the trips to/from New Jersey would use the George Washington Bridge/Lincoln Tunnel Half of the trips to/from New Jersey would use the Holland Tunnel Table 6 shows the directions of travel assumed for each peak hour. Table 6 Theater and Rooftop Event Land Use: Auto and Taxi Trip Assignment Land Use From North From South From East Theater and Rooftop Event (1) All Study Periods 32.2% 45.2% 22.7% Notes: 1. Results based on survey at Pier 54 (AKRF, July 8, 2009 from 6:00 PM to 9:00 PM). Subway Trip Assignment Assumptions The 2009 Pier 54 survey data was evaluated to determine the percentage of subway trips that would use NYCT subway lines A, C, E, L, 1, 2, or 3. The following assumptions were made: In locations where the A, C, E, and L subway lines could be used to travel to/from the project site, two-thirds of the trips would use the A, C, and E lines, and one-third would use the L line. In locations where the A, C, E, L, 1, 2, and 3 subway lines could be used to travel to/from the project site, 40% were assumed to use the A, C, and E lines, 20% were assumed to use the L line, and 40% were assumed to use the 1, 2, and 3 lines. The percentage of trips that use the A, C, E, and L subway lines were combined since they will use the same subway station at 14 th Street. 15% of the trips on the 1, 2, and 3 subway lines were assumed to use the 18 th Street station since it is only accessed by the local subway line. The remaining trips were assumed to use the 14 th Street station. Since the 2009 Pier 54 survey did not provide detailed information for origins within Manhattan, the average percentage breakdown from the Chelsea Market Survey for subway trips within Manhattan was applied. Table 7 shows the directions of travel assumed for each peak hour.
17 Trip Assignment for Pier 57 Memorandum June 2012 Page 8 8 Theater and Rooftop Event (1) Table 7 Theater and Rooftop Event Land Use: Subway Trip Assignment 123 Lines from 14 th 1 Line from 18 th Land Use ACE/L Lines Street Street All Study Periods 89.8% 8.7% 1.5% Notes: 1. Results based on survey at Pier 54 (AKRF, July 8, 2009 from 6:00 PM to 9:00 PM). Breakdown within Manhattan obtained from survey at Chelsea Market (SSE, February 12 and 16, 2011). Bus Trip Assignment Assumptions The 2009 Pier 54 survey data was evaluated to determine the bus routes visitors would use to travel to/from the project site. The following assumptions were made: Bus trips were only generated by people with origins in Manhattan and New Jersey (transferring from NJ TRANSIT at the Port Authority). Bus riders traveling to/from the project site would transfer as necessary to access bus stops closest to the project site. Ultimately, they would all use NYCT routes M11, M14A, and M14D to reach their destination. For bus route M14 passengers, 20% would use route M14A and 80% would use route M14D. A greater percentage would take M14D because it provides closer access to the project site. Table 8 shows the directions of travel assumed for each peak hour. Table 8 Theater and Rooftop Event Land Use: Bus Trip Assignment Land Use M11 M14A and M14D Theater and Rooftop Event (1) All Study Periods 52.1% 47.9% Notes: 1. Results based on survey at Pier 54 (AKRF, July 8, 2009 from 6:00 PM to 9:00 PM). Walk Trip Assignment Assumptions Walk trips generated by the project were assigned to origins external and internal to the study area using the same methodology as for the retail/restaurant walk trips. Table 9 shows the directions of travel assumed for each peak hour.
18 Trip Assignment for Pier 57 Memorandum June 2012 Page 9 9 Table 9 Theater and Rooftop Event Land Use: Walk Trip Assignment Land Use From the East From the North From the South Theater and Rooftop Event (1) All Study Periods 42.5% 36.0% 21.5% Notes: 1. Results based on survey at Chelsea Market (SSE, February 12 and 16, 2011.) Rooftop Open Space/Park/Marina During the Typical scenario, when the 110,000 SF rooftop is not being used for events, 100,000 square feet will function as a public open space. The remaining 10,000 square feet will be used for art exhibitions. There will also be a 190-slip marina on site. The trip assignment assumptions for these recreational uses were based on a survey conducted at Nelson Rockefeller (North) Park in Battery Park City. The survey was conducted from 10:00 AM to 6:00 PM and was presented in Technical Memorandum #1 for the park component of the Hudson River Park FEIS (Philip Habib and Associates (PHA), June 1994). This survey data is an appropriate source because the recreational land use is similarly located along Route 9A. The North Park survey trip assignment percentages were applied to all peak hours. Trip assignment assumptions for each travel mode are described below. Auto and Taxi Trip Assignment Assumptions The North Park survey data was evaluated to determine the percentage of auto and taxi trips that would come from north of the project site, south of the project site, or east of the project site. The following routing assumptions were made: Trips to/from Brooklyn would use various bridges/tunnels to access Route 9A from the south. Trips to/from Queens would use the Midtown Tunnel and Queensboro Bridge. Trips to/from Manhattan were split evenly between the north and south and other origins to the east. Half of the trips to/from New Jersey would use the George Washington Bridge/Lincoln Tunnel. Half of the trips to/from New Jersey would use the Holland Tunnel. Table 10 shows the directions of travel assumed for each peak hour.
19 Trip Assignment for Pier 57 Memorandum June 2012 Page Table 10 Rooftop Open Space/Park/Marina Land Use: Auto and Taxi Trip Assignment Land Use From North From South From East Rooftop Open Space /Marina (1) All Study Periods 35.0% 37.0% 28.0% Notes: 1. Results based on survey at North Park (PHA, June 1994 from 10:00 AM to 6:00 PM). Subway Trip Assignment Assumptions The North Park survey data was evaluated to determine the percentage of subway trips that would use NYCT subway lines A, C, E, L, 1, 2, or 3. The following assumptions were made: In locations where the A, C, E, and L subway lines could be used to travel to/from the project site, two-thirds of the trips would use the A, C, and E lines, and one-third would use the L line. In locations where the A, C, E, L, 1, 2, and 3 subway lines could be used to travel to/from the project site, 40% were assumed to use the A, C, and E lines, 20% were assumed to use the L line, and 40% were assumed to use the 1, 2, and 3 lines. The percentage of trips that use the A, C, E, and L subway lines were combined since they will use the same subway station at 14 th Street. 15% of the trips on the 1, 2, and 3 subway lines were assumed to use the 18 th Street station since it is only accessed by the local subway line. The remaining trips were assumed to use the 14 th Street station. Since the survey did not provide detailed information for origins within Manhattan, the average percentage breakdown from the Chelsea Market Survey for subway trips within Manhattan was applied. Table 11 shows the directions of travel assumed for each peak hour. Table 11 Rooftop Open Space/Park/Marina Land Use: Subway Trip Assignment 123 Lines from 14 th 1 Line from 18 th Land Use ACE/L Lines Street Street Rooftop Open Space /Marina (1) All Study Periods 88.6% 9.7% 1.7% Notes: 1. Results based on survey at North Park (PHA, June 1994 from 10:00 AM to 6:00 PM). Breakdown within Manhattan obtained from survey at Chelsea Market (SSE, February 12 and 16, 2011.) Bus Trip Assignment Assumptions The North Park survey data was evaluated to determine the bus routes visitors would use to travel to/from the project site. The following assumptions were made:
20 Trip Assignment for Pier 57 Memorandum June 2012 Page Bus trips were only generated by people with origins in Manhattan and New Jersey (transferring from NJ TRANSIT at the Port Authority). Bus riders traveling to/from the project site would transfer as necessary to access bus stops closest to the project site. Ultimately, they would all use NYCT routes M11, M14A, and M14D to reach their destination. For bus route M14 passengers, 20% would use route M14A and 80% would use route M14D. A greater percentage would take M14D because it provides closer access to the project site. Table 12 shows the directions of travel assumed for each peak hour. Table 12 Rooftop Open Space/Park/Marina Land Use: Bus Trip Assignment Land Use M11 M14A and M14D Rooftop Open Space /Marina (1) All Study Periods 52.3% 47.7% Notes: 1. Results based on survey at North Park (PHA, June 1994 from 10:00 AM to 6:00 PM). Walk Trip Assignment Assumptions Walk trips generated by the project were assigned to origins external and internal to the study area using the same methodology as for the retail/restaurant walk trips. Table 13 shows the directions of travel assumed for each peak hour. Table 13 Rooftop Open Space/Park/Marina Land Use: Walk Trip Assignment Land Use From the East From the North From the South Rooftop Open Space /Marina (1) All Study Periods 42.5% 36.0% 21.5% Notes: 1. Results based on survey at Chelsea Market (SSE, February 12 and 16, 2011). Exhibit Space (Caisson Level and Rooftop) The trip assignment assumptions for the 40,000 SF exhibit space on the caisson level and the 10,000 SF rooftop space used for art exhibits was based on a survey conducted at Pier 54 for the art installation Ashes and Snow (PHA, May 2005). The 2005 Pier 54 survey trip assignment percentages were applied to all peak hours. This survey data is an appropriate source because the 2005 Pier 54 event is similar to one that would be held at the project site
21 Trip Assignment for Pier 57 Memorandum June 2012 Page and because it is located on Route 9A near the project site. The 2005 Pier 54 survey trip assignment percentages were applied to all peak hours. Trip assignment assumptions for each travel mode are described below. Auto and Taxi Trip Assignment Assumptions The 2005 Pier 54 survey data was evaluated to determine the percentage of auto and taxi trips that would come from north of the project site, south of the project site, or east of the project site. The following routing assumptions were made: Trips to/from Brooklyn would use various bridges/tunnels to access Route 9A from the south Trips to/from Queens would use the Midtown Tunnel and Queensboro Bridge Half of the trips to/from New Jersey would use the George Washington Bridge/Lincoln Tunnel Half of the trips to/from New Jersey would use the Holland Tunnel Table 14 shows the directions of travel assumed for each peak hour. Table 14 Exhibit Space Uses: Auto and Taxi Trip Assignment Land Use From North From South From East Exhibit Space (1) All Study Periods 34.9% 33.9% 31.2% Notes: 1. Results based on survey at Pier 54 (PHA, May 2005). Subway Trip Assignment Assumptions The 2005 Pier 54 survey data was evaluated to determine the percentage of subway trips that would use NYCT subway lines A, C, E, L, 1, 2, or 3. The following assumptions were made: In locations where the A, C, E, and L subway lines could be used to travel to/from the project site, two-thirds of the trips would use the A, C, and E lines, and one-third would use the L line. In locations where the A, C, E, L, 1, 2, and 3 subway lines could be used to travel to/from the project site, 40% were assumed to use the A, C, and E lines, 20% were assumed to use the L line, and 40% were assumed to use the 1, 2, and 3 lines. The percentage of trips that use the A, C, E, and L subway lines were combined since they will use the same subway station at 14 th Street. 15% of the trips on the 1, 2, and 3 subway lines were assumed to use the 18 th Street station since it is only accessed by the local subway line. The remaining trips were assumed to use the 14 th Street station.
22 Trip Assignment for Pier 57 Memorandum June 2012 Page Table 15 shows the directions of travel assumed for each peak hour. Table 15 Exhibit Space Uses: Subway Trip Assignment 123 Lines from 14 th 1 Line from 18 th Land Use ACE/L Lines Street Street Exhibit Space (1) All Study Periods 71.7% 24.1% 4.2% Notes: 1. Results based on survey at Pier 54 (PHA, May 2005). Breakdown within Manhattan obtained from survey at Chelsea Market (SSE, February 12 and 16, 2011). Bus Trip Assignment Assumptions The 2005 Pier 54 survey data was evaluated to determine the bus routes visitors would use to travel to/from the project site. The following assumptions were made: Bus trips were only generated by people with origins in Manhattan and New Jersey (transferring from NJ TRANSIT at the Port Authority). Bus riders traveling to/from the project site would transfer as necessary to access bus stops closest to the project site. Ultimately, they would all use NYCT routes M11, M14A and M14D to reach their destination. For bus route M14 passengers, 20% would use route M14A and 80% would use route M14D. A greater percentage would take M14D because it provides closer access to the project site. Table 16 shows the directions of travel assumed for each peak hour. Table 16 Exhibit Space Uses: Bus Trip Assignment Land Use M11 M14A and M14D Exhibit Space (1) All Study Periods 55.2% 44.8% Notes: 1. Results based on survey at Pier 54 (PHA, May 2005). Walk Trip Assignment Assumptions Walk trips generated by the project were assigned to origins external and internal to the study area using the same methodology as for the retail/restaurant walk trips. Table 17 shows the directions of travel assumed for each peak hour.
23 Trip Assignment for Pier 57 Memorandum June 2012 Page Table 17 Exhibit Space Uses: Walk Trip Assignment Land Use From the East From the North From the South Exhibit Space (1) All Study Periods 42.5% 36.0% 21.5% Notes: 1. Results based on survey at Chelsea Market (SSE, February 12 and 16, 2011). Technical Arts School The trip assignment assumptions for the 32,000 SF Technical Arts School were based on 2000 Census Journey-to-Work data. The census data is an appropriate source because the trips generated by the technical arts school attendees should be comparable to commute patterns, as the majority of people would likely be coming from and heading to their place of residence. The 2000 Census Journey-to-Work data was applied to all peak hours. Trip assignment assumptions for each travel mode are described below. Auto and Taxi Trip Assignment Assumptions The 2000 Census data was evaluated to determine the percentage of auto and taxi trips that would come from north of the project site, south of the project site, or east of the project site. The following routing assumptions were made: Trips to/from Brooklyn would use various bridges/tunnels to access Route 9A from the south Trips to/from Queens would use the Midtown Tunnel and Queensboro Bridge Trips to/from Manhattan were split evenly between the north and south and other origins to the east. Half of the trips to/from New Jersey would use the George Washington Bridge/Lincoln Tunnel Half of the trips to/from New Jersey would use the Holland Tunnel Table 18 shows the directions of travel assumed for each peak hour. Table 18 Technical Arts School Use: Auto and Taxi Trip Assignment Land Use From North From South From East Technical Arts School (1) All Study Periods 55.4% 38.4% 6.2% Notes: 1. Results based on 2000 Census Journey to Work data.
24 Trip Assignment for Pier 57 Memorandum June 2012 Page Subway Trip Assignment Assumptions The 2000 Census data was used to determine the percentage of subway trips that would use NYCT subway lines A, C, E, L, 1, 2, or 3. The following assumptions were made: In locations where the A, C, E, and L subway lines could be used to travel to/from the project site, two-thirds of the trips would use the A, C, and E lines, and one-third would use the L line. In locations where the A, C, E, L, 1, 2, and 3 subway lines could be used to travel to/from the project site, 40% were assumed to use the A, C, and E lines, 20% were assumed to use the L line, and 40% were assumed to use the 1, 2, and 3 lines. The percentage of trips that use the A, C, E, and L subway lines were combined since they will use the same subway station at 14 th Street. 15% of the trips on the 1, 2, and 3 subway lines were assumed to use the 18 th Street station since it is only accessed by the local subway line. The remaining trips were assumed to use the 14 th Street station. The 2000 Census data used was broken down to the County level; therefore, to develop trip assignment for origins from within Manhattan, the average percentage breakdown from the Chelsea Market Survey (SSE, 2011) for subway trips within Manhattan was applied. Table 19 shows the directions of travel assumed for each peak hour. Table 19 Technical Arts School Use: Subway Trip Assignment 123 Lines from 14 th 1 Line from 18 th Land Use ACE/L Lines Street Street Technical Arts School (1) All Study Periods 92.8% 6.2% 1.1% Notes: 1. Results based on 2000 Census Journey to Work data. Breakdown within Manhattan obtained from survey at Chelsea Market (SSE, February 12 and 16, 2011). Bus Trip Assignment Assumptions The 2000 Census data was evaluated to determine the bus routes visitors would use to travel to/from the project site. The following assumptions were made: Bus trips were only generated by people with origins in Manhattan and New Jersey (transferring from NY TRANSIT at the Port Authority). Bus riders traveling to/from the project site would transfer as necessary to access bus stops closest to the project site. Ultimately, they would all use NYCT routes M11, M14A, and M14D to reach their destination. For bus route M14 passengers, 20% would use route M14A and 80% would use route M14D. A greater percentage would take M14D because it provides closer access to the project site.
25 Trip Assignment for Pier 57 Memorandum June 2012 Page Table 20 shows the directions of travel assumed for each peak hour. Table 20 Technical Arts School Use: Bus Trip Assignment Land Use M11 M14A and M14D Technical Arts School (1) All Study Periods 66.4% 33.6% Notes: 1. Results based on 2000 Census Journey to Work data. Walk Trip Assignment Assumptions Walk trips generated by the project were assigned to origins external and internal to the study area using the same methodology as for the retail/restaurant walk trips. Table 21 shows the directions of travel assumed for each peak hour. Table 21 Technical Arts School Use: Walk Trip Assignment Land Use From the East From the North From the South Technical Arts School (1) All Study Periods 42.5% 36.0% 21.5% Notes: 1. Results based on 2000 Census Journey to Work data. Potential Water Taxi Landing There is the potential for a water taxi landing to be constructed on Pier 57. Due to the potential modal shift to the water taxi service, this land use was conservatively not considered as part of the transportation analysis. General Trip Assignment Assumptions After the assumptions for each individual land use discussed above were applied to determine overall trip assignment to the study area, further assumptions were made to assign trips to specific roadways and routes within the study area. The following next level trip assignment assumptions apply to all land uses. Auto and Taxi Trip Assignment Assumptions Based on engineering judgment, the following assumptions were made to assign auto and taxi trips to and from the project site: Inbound trips from the north were distributed 75% on Route 9A, 10% on 11 th Avenue, and 15% on 9 th Avenue.
26 Trip Assignment for Pier 57 Memorandum June 2012 Page Inbound trips from the east were distributed 70% on 17 th Street and 30% on 14 th Street. Inbound trips from the south were distributed 85% on Route 9A and 15% on 8 th Avenue. Since many of the streets in the study area are one-way, outbound trips were assigned to the most logical reverse route Auto Trip Assignment Assumptions Parking Off-Site Visitors driving to the project site would park on-site if parking is available. A parking analysis was conducted that considered the hourly parking accumulation based on the parking demand for each land use. The results of the parking accumulation analysis were used to preliminarily estimate the number of visitors that would park off-site. Due to limited on-street parking availability in the study area, no auto trips were assigned to on-street parking spaces. Auto-trips that could not be accommodated on-site would use off-site parking facilities along their route to the project site and would be considered walk trips as they travel between the parking facility and the project site. Auto-trips were assigned to local parking facilities that had available capacity during the peak hours based on a field review and interviews. Truck Trip Assignment Assumptions Based on engineering judgment, the following assumptions were made to assign truck trips to and from the project site. Truck trips were distributed 75% to/from the north and 25% to/from the south All trips from the north use Route 9A (inbound and outbound) All trips from the south use Route 9A (inbound and outbound) Subway Trip Assignment Assumptions The A, C, E, and L subway trips would use the subway station at 14 th Street and 8 th Avenue, with entrances on 14 th, 15 th, and 16 th Streets. The distribution of trips to the station entrances on the west and east side of 8 th Avenue is 90%/10%, respectively. The distribution of trips to the subway entrances on the north and south side of each street is 50%/50%. The 1, 2, and 3 subway trips would use the 14 th Street and 18 th Street stations. 15% of the trips would use the 18 th Street station, and the remaining trips would use the 14 th Street station. The trips that use the 18 th Street station would enter the study area via 16 th Street, 17 th Street, and 18 th Street. The trips that use the 14 th Street station will enter the study area at the 14 th Street and 8 th Avenue intersection. Bus Trip Assignment Assumptions M11 passengers will use the bus stop at 14 th Street and Washington Street (inbound and outbound). M14A passengers will use the bus stop at 14 th Street and Hudson Street (inbound and outbound).
27 Trip Assignment for Pier 57 Memorandum June 2012 Page M14D passengers will use the bus stop on Route 9A between 15 th Street and 16 th Street (inbound and outbound). Walk Trip Assignment Assumptions Walk trip assignments were considered the same for all land uses and were based on the Chelsea Market survey and a review of the land uses on the blocks within the study area that would generate internal trips. Walk-only trips enter the study area from all possible external entry points along the perimeter of the study area as well as internally within the study area. Subway, bus, and auto walk trips enter the study area from subway station entrances/exits, bus stops, and off-site parking facilities. All walk, subway, bus, and auto trips (parking off-site) were combined to estimate the total number of walk trips in the study area. These trips were assumed to access the project site primarily along 15 th Street using both crosswalks at the intersection of 15 th Street and Route 9A. A smaller percentage of trips were assumed to use 14 th and 16 th Streets to access the project site. Level 2 Screening Results The application of the various assumptions for each land use scenario and peak hour result in project-trip estimates as shown in Appendix C for the Typical condition for the Weekday Midday, Weekday PM, and Saturday Midday peak hours and the Pre-Event condition for the Weekday Evening Pre-Event and Saturday Evening Pre-Event peak hours. The results show that the project would generate more than 50 vehicle trips, 200 subway and bus riders, and 200 pedestrian trips in a peak hour at the following intersections, crosswalks, corners, sidewalks, and subway entrances/stairwells: Intersections for Vehicular Traffic Analysis (see Figure 1) 1. Route 9A and West 24 th Street 2. Route 9A / 11 th Avenue and West 22 nd Street 3. Route 9A and West 18 th Street 4. Route 9A and West 17 th Street 5. Route 9A and West 16 th Street 6. Route 9A and West 15 th Street 7. Route 9A and West 14 th Street 8. Route 9A and 10 th Avenue 9. Tenth Avenue and West 17 th Street 10. Tenth Avenue and West 16 th Street 11. Tenth Avenue and West 15 th Street 12. Tenth Avenue and West 14 th Street 13. Ninth Avenue and West 17 th Street
28 Trip Assignment for Pier 57 Memorandum June 2012 Page Ninth Avenue and West 14 th Street 15. Ninth Avenue and West 17 th Street 16. Ninth Avenue and West 14 th Street Pedestrian Elements for Detailed Analysis (see Figure 2) Route 9A and West 17 th Street (1 element) Crosswalks Corners Sidewalks South crosswalk* Route 9A and West 16 th Street (8 elements) Crosswalks Corners Sidewalks South crosswalk Northeast corner South of intersection, west side East crosswalk Southeast corner South of intersection, east side East of intersection, south side East of intersection, north side Route 9A and West 15 th Street (11 elements) Crosswalks Corners Sidewalks North crosswalk Northeast corner North of intersection, west side East crosswalk Southeast corner North of intersection, east side South crosswalk East of intersection, north side East of intersection, south side South of intersection, west side West of intersection, within intersection Route 9A and West 14 th Street (3 elements) Crosswalks Corners Sidewalks South crosswalk Southeast corner East of intersection, south side Tenth Avenue and West 16 th Street (10 elements) Crosswalks Corners Sidewalks South crosswalk Southeast corner East of intersection, south side North crosswalk Southwest corner West of intersection, south side Northeast corner East of intersection, north side Northwest corner West of intersection, north side Tenth Avenue and West 15 th Street (11 elements) Crosswalks Corners Sidewalks North crosswalk Northwest corner West of intersection, north side South crosswalk Northeast corner West of intersection, south side
29 Trip Assignment for Pier 57 Memorandum June 2012 Page Southeast corner Southwest corner East of intersection, north side East of intersection, south side South of intersection, east side Tenth Avenue and West 14 th Street (7 elements) Crosswalks Corners Sidewalks South crosswalk Northeast corner North of intersection, east side Southeast corner East of intersection, north side Southwest corner East of intersection, south side Washington Street and West 14 th Street (5 elements) Crosswalks Corners Sidewalks South crosswalk Southwest corner West of intersection, south side Southeast corner East of intersection, south side Ninth Avenue and West 16 th Street (8 elements) Crosswalks Corners Sidewalks North crosswalk Northeast corner East of intersection, north side Northwest corner West of intersection, north side Southwest corner West of intersection, south side Southeast corner Ninth Avenue and West 15 th Street (11 elements) Crosswalks Corners Sidewalks North crosswalk Northwest corner West of intersection, north side South crosswalk Northeast corner West of intersection, south side Southeast corner East of intersection, north side Southwest corner South of intersection, east side South of intersection, west side Ninth Avenue, West 14 th Street, and Hudson Place (14 elements) Crosswalks Corners Sidewalks North crosswalk, west of median Northwest corner West of intersection, north side North crosswalk, east of median Northeast corner West of intersection, south side South crosswalk, across 9 th Ave Southeast corner North of intersection, east side South crosswalk, across Hudson Pl Southwest corner North of intersection, west side East of intersection, north side East of intersection, south side
30 Trip Assignment for Pier 57 Memorandum June 2012 Page Eighth Avenue and West 14 th Street (1 element) Crosswalks Corners Sidewalks Northwest corner * Element that does not meet threshold of 200 project-generated trips, but was included because geometry is changing as part of the site access plan. Total: 90 elements (20 crosswalks, 31 corners, 39 sidewalks) Bus Routes Bus Route M14D Subway Stations ACE/L Station - West 14 th Street at Eighth Avenue In accordance with the 2012 CEQR Technical Manual, detailed quantitative analysis will be performed at these 16 intersections, 90 pedestrian elements, 1 bus route, and 1 subway station. Subway line-haul analyses will not be performed. Subway trips will be distributed to seven subway lines in either direction and will not affect subway capacities over the course of the peak hours.
31
32 Appendix A Level 1 Screening: Transportation Demand Factors
33
34 Appendix A Level 1 Screening: Transportation Demand Factors Page 1 Sam Schwartz Engineering (SSE) has prepared a preliminary transportation screening for an Environmental Impact Statement (EIS) for the proposed Pier 57 development located along the west side of Route 9A between West 14 th Street and West 16 th Street in Manhattan. In accordance with the 2012 CEQR Technical Manual, this Transportation Demand Factors (TDF) memorandum estimates the projected trips from the proposed development following a twotiered screening process: a Level 1 screening assessment includes a trip generation analysis to determine whether the project would result in more than 50 vehicle trips, 200 subway/rail or bus riders, or 200 pedestrian trips in a peak hour; the Level 2 screening is a trip assignment review that identifies intersections with 50 or more vehicle trips, pedestrian elements with 200 or more pedestrian trips, 50 bus trips in a single direction on a single route, or 200 passengers at a subway station or line during any analysis peak hour which would require detailed analyses. Proposed Development Program The proposed Pier 57 development would include the following land uses: 24,450 square feet (SF) of quality restaurant 34,764 SF of food counters 202,686 SF of market (retail space) 110,000 SF rooftop (for park use and programmed events) 40,000 SF of art gallery/exhibit space (caisson level) 11,000 SF cultural use (300-seat theatre) 32,700 SF technical arts school 190-slip marina Potential water taxi landing Transportation Planning Factors The transportation planning factors used in forecasting travel demand for the proposed development are shown in Table 1, and the trip generation results are shown in Table 2A and Table 2B. Trip generation estimates were prepared for the following critical weekday peak hours: Weekday Midday (MD) peak hour Weekday commuter peak (PM) peak hour Weekday Evening Pre-Event peak (EVE) peak hour, representing the pre-event time period Saturday Midday (SAT MD) peak hour Saturday Evening Pre-Event peak (SAT EVE) peak hour, representing the pre-event time period
35 Appendix A Level 1 Screening: Transportation Demand Factors Page 2 2 With the project located along Route 9A, transportation planning factors were generally obtained from previous studies performed for other riverfront uses and/or projects located on the west edge of Manhattan in or near West Chelsea. A description of the transportation planning factors assumed for each individual land use is provided below. Market (Retail Space) The market is retail space that is expected to primarily be made up of small retail pods. In total, the space would comprise 202,686 SF of related retail space that is expected to have both a regional and local draw. As such, it was assumed that the market space would operate most similar to the destination retail land use, and the total Weekday and Saturday daily trip generation rates were obtained from Table 16-2 of the 2012 CEQR Technical Manual. A survey was conducted at Chelsea Market to serve as a basis for modal split and vehicle occupancy assumptions for the retail space at Pier 57. Chelsea Market is an appropriate source because it is a retail space that is primarily made up of small, boutique food shops that allow businesses to combine their manufacturing and retail assets under one roof. Pier 57 would provide similar work-sell spaces for food and fashion-related businesses. Furthermore, Chelsea Market is located one block from the Pier 57 site. This survey was conducted on Saturday, February 12, 2011, from 1:00 PM to 4:00 PM and from 5:00 PM to 8:00 PM and on Wednesday, February 16, 2011, from 11:30 AM to 2:30 PM and 4:30 PM to 7:30 PM. The results of the survey are summarized below: Chelsea Market Mode Splits February 2011 Weekday Saturday Saturday Weekday PM Mode 1 Mode 2 Midday Midday Evening Auto 12.2% 6.6% 3.8% 14.1% Bike 2.4% 1.5% 3.8% 1.3% Bus 3.3% 3.6% 5.1% 1.9% Bus Subway 0.0% 0.0% 0.0% 0.0% Ferry Subway 0.8% 0.0% 0.0% 0.0% Rail LIRR Subway 0.8% 0.7% 0.0% 1.3% Rail LIRR 0.0% 0.7% 0.6% 1.3% Rail MetroNorth Subway 0.0% 0.0% 0.0% 0.0% Rail NJ Transit 0.8% 0.7% 1.3% 0.0% Rail Path 0.8% 0.7% 1.9% 3.2% Subway 33.3% 42.3% 30.6% 28.2% Subway Bus 1.6% 0.0% 0.0% 0.6% Total Visitors 100.0% 100.0% 100.0% 100.0% Sample Size
36 Appendix A Level 1 Screening: Transportation Demand Factors Page 3 3 Chelsea Market Vehicle Occupancies February 2011 Mode Weekday Saturday Auto Taxi Weekday Midday, Weekday PM, and Saturday Midday temporal distributions, directional distributions, and truck trip generation/distributions were obtained from the 2012 CEQR Technical Manual Table Weekday and Saturday Evenings Pre-Event temporal distributions, directional distributions, and truck trip generation/distributions were obtained from the Hudson Yards FGEIS (2004), Appendix S-1, Tables 1 and 2, from the Destination Retail Trip Generation Transportation Planning Assumptions memorandum. The Saturday Evening Pre-Event truck distributions were assumed to be equal to the Weekday Midday factors. Quality Restaurant The development would include 24,450 SF of quality restaurant space, including an outdoor terrace. For weekdays, the total daily trip generation rate was based on Table 2.3 in Urban Space for Pedestrians (Pushkarev & Zupan, 1975). Since Table 2.3 does not include Saturday information, the Saturday trip rate was estimated from the daily trip rate and average vehicle occupancy reported for a Quality Restaurant (Land Use Code 931) from the Institute of Transportation Engineers (ITE) Trip Generation, 8 th Edition manual. Specifically, the daily trip rate in the ITE manual, which was assumed to be made up of 100 percent auto trips, was divided by the average vehicle occupancy to estimate total daily person trips. For the Saturday trip rate, the proportion of Saturday trips to Weekday trips in the ITE manual was used to adjust the weekday trip rate in Urban Space for Pedestrians. Modal splits and vehicle occupancies were obtained from Table II.F.7 of the Chelsea Piers FEIS for the restaurant use, and the modal splits were modified based on discussions with NYCDOT to reflect a lower bus mode share and higher walk-only and subway mode shares. Temporal splits and directional distributions were obtained from ITE s Trip Generation, 8 th Edition for a Quality Restaurant (Land Use Code 931), and truck trip generation rates were obtained from the Hudson River Park FEIS (1998), Table 11-25, for the restaurant land use. Food Counters The development would include 34,764 SF of food counter space that would operate similar to the counter-service style food establishments at Chelsea Market. It is expected that most of the patrons of these food counters will also be shopping at the retail pods and, as such, are expected to have similar trip generation characteristics as the destination retail. However, to be
37 Appendix A Level 1 Screening: Transportation Demand Factors Page 4 4 conservative, the total daily trip generation rates were based on daily trip rates calculated for Quality Restaurant, which provides higher rates than for destination retail. As with the Quality Restaurant land use, modal splits and vehicle occupancies were obtained from Table II.F.7 of the Chelsea Piers FEIS for the restaurant use, and the modal splits were modified based on discussions with NYCDOT. Temporal splits and directional distributions were obtained from ITE s Trip Generation, 8 th Edition for a High Turnover (Sit-Down) Restaurant (Land Use Code 932), and truck trip generation rates were obtained from the Hudson River Park FEIS (1998), Table 11-25, for the restaurant land use. Rooftop While the 110,000 SF (2.30 acres) rooftop space would typically be open to public and serve as open space, the Pier would also occasionally host evening events during the year, with approximately two weeks in late April/early May dedicated to the Tribeca Film Festival. Since events on the rooftop will only occur occasionally, trip generation estimates were performed for both a Typical and Pre-Event condition. Typical Condition: In the typical condition, the rooftop would draw visitors to the pier to enjoy the rooftop space and the waterfront views. Also, the anticipated programming for the rooftop includes art installations and exhibits that would take up approximately 10,000 SF of the rooftop. These installations would occur three to four times per year and run for approximately two months each, with one week to set up and one week to take down the exhibits. Therefore, this condition could be considered Typical, as four installations at 10 weeks each would comprise 40 weeks over the course of a year. To generate trips for such a condition, it was assumed that this exhibition space would operate similar to a museum, while the remaining 100,000 SF would operate with the same trip generation characteristics as open/park space. The open space on the rooftop would be a passive use, and daily trip generation rates and temporal distribution for the rooftop space were based on the 2012 CEQR Technical Manual, Table The active park rate was conservatively applied. Weekday Evening Pre-Event and Saturday Evening Pre-Event temporal distributions were assumed to be half of the Weekday PM and Saturday Midday temporal distributions, respectively. Mode share, vehicle occupancy, and directional distribution assumptions were based on the Special West Chelsea District Rezoning and High Line Open Space FEIS (2010), Table 16-6, for the High Line open space land use. Saturday mode share and vehicle occupancy were assumed to be same as the Weekday. Weekday Evening Pre-Event and Saturday Evening Pre-Event directional distributions were assumed to be the same as the Weekday PM, and the Saturday Midday directional distribution was assumed to be 50% in and 50% out. Truck trip generation for the open space was assumed to be zero, consistent with the West Chelsea FEIS.
38 Appendix A Level 1 Screening: Transportation Demand Factors Page 5 5 For the art installation on the rooftop, daily trip generation rates were based on the museum land use on Table 16-2 of the 2012 CEQR Technical Manual. Modal splits and vehicle occupancies were obtained from a survey conducted in May 2005 for a temporary art and film installation called Ashes and Show that ran for three months on Pier 54. This was a prototype for the types of art installations envisioned for Pier 57 and, given its location, is a very relevant source for travel demand factors. Truck trip generation and distributions for a museum were obtained from the Hudson Yards FGEIS (2004), Appendix S-1, Table 1, from the Museum Trip Generation Transportation Planning Assumptions memorandum. Pre-Event Condition (Tribeca Film Festival): The Tribeca Film Festival would stage a limited number of events on the rooftop; however, to represent a worst-case scenario, trip generation estimates were performed for a Tribeca Film Festival event condition. The rooftop event space has a 2,500-person capacity; however, events would typically not exceed 1,500 people. In addition to the Film Festival events, which would occur for two weeks in late April and early May, other special interest programming may also take place on the rooftop. The worst-case scenario of a 2,500-person event condition will be analyzed for the Weekday Evening Pre-Event and Saturday Evening Pre-Event peaks. Only these peaks will be analyzed, as a 2,500-person event would require significant set-up time that would take up most or all of the rooftop space during the day of the event. The total daily trip generation rate was based on the Brooklyn Bridge Park FEIS (2005), Table 14-6, for the multi-use / theatre land use, and assumed a capacity of 2,500 people ( seats ). The mode share, vehicle occupancy, temporal distribution, and directional distribution rates for both a Weekday and Saturday Evening Pre-Event were based on a survey performed in June 2009 for an outdoor movie event on Pier 54. Mode share and vehicle occupancy survey data was collected between the hours of 6:00 PM and 9:00 PM, and temporal distribution observations were made between 6:00 PM and 11:30 PM. The movie event was open to the public, with people arriving and departing throughout the duration of the event. Saturday Evening Pre-Event and Weekday PM directional distributions were assumed to be the same as the Weekday Evening Pre-Event assumptions. At the Pier 54 events, people tend to arrive early to secure a location and/or bring a picnic meal. A similar arrival/departure pattern would be expected for a Tribeca Film Festival event due to the presence of retail space, restaurants, and related exhibits that would attract people before, during, and after the event. Also, since Pier 54 is just a few blocks south of Pier 57, modal splits and vehicle occupancies were also assumed to be representative of a rooftop Tribeca Film Festival event.
39 Appendix A Level 1 Screening: Transportation Demand Factors Page 6 6 The Weekday and Saturday truck trip generation rates and truck temporal and directional distributions were based on the Brooklyn Bridge Park FEIS Table 14-6, multi-use / theatre land use. Cultural Use The transportation planning assumptions for the Cultural Use were conservatively based on a 300-seat theatre as it would generate the greatest number of trips for a cultural use in the space available. In general, the same trip assignment assumptions were used for the Rooftop Event. However, it was assumed that the theatre could be operational during the Weekday Midday and Saturday Midday periods. The transportation planning assumptions were obtained from the Brooklyn Bridge Park FEIS, Table 14-6, for the multi-use / theatre land use. Technical Arts School The 32,700-SF technical arts school would be an educational facility with a specialized focus, be it cooking, fashion, photography, graphic arts, or similar area. Examples of technical arts schools in Manhattan include the Institute for Culinary Education (ICE), the Fashion Institute of Technology (FIT), and the Art Institute of New York City. Typically, these schools focus on a single technical arts area, such as the culinary arts, and also provide a recreational curriculum. Daily trip rates were obtained from the ITE Trip Generation, 8 th Edition manual for the Junior/Community College (Land Use Code 540) land use, which is described as including twoyear junior, community, or technical colleges. It also states that a number of the institutions studied have sizeable evening programs. Therefore, this should be an applicable source, since technical arts schools typically provide one- to two-year programs. Also, similar to junior, community, and technical colleges, technical arts schools have evening programs that are open for students with full-time jobs and have recreational and continuing education classes for the general public. Technical arts schools allow admission directly from high school. Comparing technical arts schools to community/technical colleges is conservative, since the majority of classrooms in these schools are made up of specialized classrooms that accommodate less students per square foot than a typical college classroom (cooking schools have teaching kitchens, photography schools have darkrooms and studios, fashion schools have production rooms and machinery, etc.). At a cooking school, for example, teaching kitchens represent the majority of classrooms, and at ICE, 11 of the 14 classrooms are teaching kitchens. The three remaining regular classrooms are generally used for the culinary management and hospitality management programs. Other sources were reviewed to develop assumptions for modal splits and vehicle occupancies. Continuing with the cooking school example, the average enrollment age at ICE, which comprises approximately 43,000 SF of space, is 26 years old; therefore, travel characteristics
40 Appendix A Level 1 Screening: Transportation Demand Factors Page 7 7 were assumed to be similar to that of graduate-level students, and thus was based on the graduate/full-time student land use from the Fordham University Lincoln Center Master Plan FEIS (2009), Table Since the mode share used in that FEIS included dorm-based trips (8.4%), this mode share was redistributed proportionally among the auto, taxi, bus, and subway mode shares. Also, the shuttle mode share (0.5% for Weekday Midday and 20.3% for Weekday PM/Evening Pre-Event) was redistributed proportionally among the bus and subway mode shares. Truck trip generation rates were based on the rates from the Fordham University Lincoln Center Master Plan FEIS (2009), Table Class schedules at several technical arts schools were reviewed to estimate temporal distributions. Classes at ICE run from 8 AM to 12 PM, 1 PM to 5 PM, and 6 PM to 10 PM on weekdays. There are also weekday recreational classes that generally occur from 10 AM to 2 PM (approx 1 per day) and 6 PM to 10 PM (approx 2 per day). On Saturday, classes typically run from 9 AM to 2 PM or 9 AM to 5 PM. Given this distribution, there is overlap during the Weekday Midday (12 PM to 1 PM) and Weekday PM (5 PM to 6 PM) peak hours, when some students are leaving and some are arriving. During these hours, a 20% temporal distribution was assumed, with 50% entering and 50% exiting the school. During the Weekday Evening Pre-Event, Saturday Midday, and Saturday Evening Pre-Event peak hours, there would be little entering and exiting activity, as classes do not start or end during those times. As such, a lower temporal distribution of 5% was assumed for those time periods. Directional distribution was assumed to be 50% entering and exiting during those hours. Marina Weekday trip generation assumptions for the proposed 190-slip marina were based on the Brooklyn Bridge Park FEIS Table 14-6 for the marina land use. The remaining travel demand assumptions were obtained from the Hudson River Park FEIS (1998), Table 11-25, for the marina land use. The Weekday Evening Pre-Event temporal and directional distributions were assumed to be same as the Weekday PM, and the Saturday Evening Pre-Event temporal and directional distributions were assumed to be same as the Saturday Midday. Potential Water Taxi Landing There is the potential for a water taxi landing to be constructed on Pier 57. The landing could become a stop along the Hudson River water taxi route that currently stops at various locations including Pier 45 at Christopher Street and Pier 84 at West 44th Street. As a stand-alone use, it is expected that the water taxi landing would primarily attract pedestrians from along the Hudson River Park Waterside Esplanade; some of which would be included in the Pier 57 trip generation. Additionally, water taxi access to Pier 57 would also provide an alternative mode for visitors to travel to and from the site and would therefore result in a modal shift that would reduce the number of pedestrians coming from subway stations, bus stops, and taxis on the
41 Appendix A Level 1 Screening: Transportation Demand Factors Page 8 8 local streets. As such, since the presence of the water taxi would likely reduce the transportation impact of the project, the transportation planning analysis conservatively did not consider the water taxi landing. Linked Trips Linked trips are trips that have multiple destinations are typical for multi-use sites. The Pier 57 redevelopment plan calls for a major concentration of food-based uses surrounded by a variety of international cuisines, educational programs, broadcast venues, and retail merchandise, with the technical arts school most likely being a cooking school. This food-based theme is not unlike that of Chelsea Market, where specialty markets, food counters, restaurants, and the Food Network studios and offices are all located within a single retail experience that produce a variety of linked trips. In fact, the Chelsea Market survey showed that 15-20% of the weekday respondents were employees from within the building. Similarly, the Pier 57 site will produce linked trips with visitors traveling between the open space, retail market, restaurants, food counters, and theatre. Other linked trips will occur between the technical arts school, food market, food counters, and restaurants. Furthermore, the Tribeca Film Festival experience will draw linked trips between the restaurant, retail, and rooftop spaces. As such, a 20% linked trip credit in trip generation was taken for all land uses except for the food counters, for which a 25% linked trip credit was taken, and for the marina, for which no linked trip credit (0%) was taken. Trip Generation Results The results of the trip generation estimates for the Typical and Pre-Event scenarios are shown in the tables below. To represent the worst-case scenario for each of the study peak hours, the Typical condition was used for the Weekday Midday, Weekday PM, and Saturday Midday conditions, while the Pre-Event condition was used for the Weekday Evening and Saturday Evening conditions: Peak Hour Typical Condition Vehicle Trips (auto/taxi/truck) Subway Trips Bus Trips Pedestrian Trips Total Walk Trips (includes transit) Weekday MD ,662 Weekday PM ,704 Saturday MD ,979 Pre-Event Condition Weekday EVE 475 1, ,401 3,332 Saturday EVE 380 1, ,020 2,473
42 Appendix A Level 1 Screening: Transportation Demand Factors Page 9 9 The results show that the project would generate more than 50 vehicle trips, 200 subway and bus riders, and 200 pedestrian trips in a peak hour; therefore, in accordance with the 2012 CEQR Technical Manual a Level 2 screening will be performed to distribute the new trips to the surrounding roadway network and identify study locations for quantitative analyses.
43
44 DRAFT Table 1 Pier 57 Transportation Demand Factors Destination Retail (Market) Quality Restaurant Food Counter Theatre Museum/Exhibit Space (Caissons) Technical Arts School Marina Rooftop Open Space Rooftop Exhibit (Museum) Rooftop Event Project Component Person Trip Generation Rate Truck Generation Rate Size Unit Weekday Saturday Unit Weekday Saturday Unit 202,686 gsf (1) ,450 gsf Weekday (3), Saturday (5) ,764 gsf (16) Seats (6) ,000 gsf (1) ,700 gsf (11) per 1,000 gsf per 1,000 gsf per 1,000 gsf per seat per 1,000 gsf per 1,000 gsf (14) 0.35 (12) 3.60 (12) 3.60 (6) 0.01 (13) 0.05 (8) per 1,000 gsf per 1,000 gsf per 1,000 gsf per seat per 1,000 gsf per 1,000 gsf 190 slips Weekday (6), Saturday (12) per slip (12) per slip 2.30 acres (1) per acre (7) per acre 10,000 gsf (1) per 1,000 gsf (13) per 1,000 gsf 2,500 people (6) per person (6) per person Weekday Saturday Weekday Saturday Weekday Saturday Weekday Saturday Weekday Saturday Weekday MD Weekday PM/EVE Weekday Saturday Weekday Saturday Weekday Saturday Weekday Saturday (2) (18) (18) (9) (4) (8) (12) (7) (4) (9) Auto 9.2% 10.5% 25.0% 25.0% 25.0% 25.0% 9.0% 9.0% 19.5% 19.5% 7.5% 2.4% 75.0% 75.0% 5.0% 5.0% 19.5% 19.5% 9.0% 9.0% Modal Split Taxi 5.0% 14.2% 20.0% 20.0% 15.0% 15.0% 2.0% 2.0% 10.0% 10.0% 6.3% 3.6% 10.0% 10.0% 1.0% 1.0% 10.0% 10.0% 2.0% 2.0% Subway 40.0% 29.6% 30.0% 30.0% 35.0% 35.0% 49.0% 49.0% 33.0% 33.0% 61.6% 59.9% 5.0% 5.0% 3.0% 3.0% 33.0% 33.0% 49.0% 49.0% Bus 4.2% 3.7% 5.0% 5.0% 5.0% 5.0% 3.0% 3.0% 7.0% 7.0% 7.5% 8.6% 5.0% 5.0% 4.0% 4.0% 7.0% 7.0% 3.0% 3.0% Walk/Other 41.6% 42.0% 20.0% 20.0% 20.0% 20.0% 37.0% 37.0% 30.5% 30.5% 17.1% 25.6% 5.0% 5.0% 87.0% 87.0% 30.5% 30.5% 37.0% 37.0% 100.0% 100.0% 100.0% 100.0% 100.0% 100.0% 100.0% 100.0% 100.0% 100.0% 100.0% 100.0% 100.0% 100.0% 100.0% 100.0% 100.0% 100.0% 100.0% 100.0% (2) (15) (15) Auto (9), Taxi (6) (4) (8) (12) (7) (4) Auto (9), Taxi (6) Vehicle Occupancy Auto Taxi Linked Trips (10) 20% 20% 20% 20% 25% 25% 20% 20% 20% 20% 20% 20% 0% 0% 20% 20% 20% 20% 20% 20% (14) (5) (16) MD and PM (6), EVE (9) (1) (8) (12) (1) (1) (9) Temporal Distribution MD (12-1) PM (5-6) EVE (7-8) Sat MD (1-2) Sat EVE (7-8) 9.0% 9.0% 8.4% 11.0% 1.7% (14) 6.2% 8.3% 10.0% 11.0% 11.5% (12) 10.6% 8.8% 14.5% 11.0% 8.9% (12) 0.0% 10.0% 32.0% 10.0% 32.0% (6) 16.0% 13.0% 13.0% 17.0% 13.0% (13) 20.0% 20.0% 5.0% 5.0% 5.0% (12) 4.6% 6.4% 6.4% 4.8% 4.8% (12) 5.0% 6.0% 3.0% 6.0% 3.0% (7) 16.0% 13.0% 13.0% 17.0% 13.0% (13) 0.0% 0.0% 32.0% 0.0% 32.0% (6) Truck Temporal Distribution MD (12-1) PM (5-6) EVE (7-8) Sat MD (1-2) Sat EVE (7-8) 11.0% 1.0% 0.0% 11.0% 1.0% 6.0% 1.0% 0.0% 6.0% 0.0% 6.0% 1.0% 0.0% 6.0% 0.0% 6.0% 1.0% 0.0% 0.0% 0.0% 11.0% 1.0% 0.0% 1.0% 0.0% 6.0% 1.0% 0.0% 6.0% 0.0% 6.0% 1.0% 1.0% 1.0% 1.0% 0.0% 0.0% 0.0% 0.0% 0.0% 11.0% 1.0% 0.0% 1.0% 0.0% 6.0% 1.0% 0.0% 0.0% 0.0% IN OUT IN OUT IN OUT IN OUT IN OUT IN OUT IN OUT IN OUT IN OUT IN OUT (14) (5) (16) (7,9) (13) (17) (12) (7) (13) (7,9) MD (12-1) 55.0% 45.0% 50.0% 50.0% 50.0% 50.0% 50.0% 50.0% 63.0% 37.0% 50.0% 50.0% 50.0% 50.0% 50.0% 50.0% 63.0% 37.0% 50.0% 50.0% Directional PM (5-6) 48.0% 52.0% 67.0% 33.0% 59.0% 41.0% 75.0% 25.0% 52.0% 48.0% 50.0% 50.0% 60.0% 40.0% 45.0% 55.0% 52.0% 48.0% 75.0% 25.0% Distribution EVE (7-8) 55.0% 45.0% 62.0% 38.0% 54.0% 46.0% 75.0% 25.0% 34.0% 66.0% 50.0% 50.0% 60.0% 40.0% 45.0% 55.0% 34.0% 66.0% 75.0% 25.0% Sat MD (1-2) 71.0% 29.0% 50.0% 50.0% 50.0% 50.0% 50.0% 50.0% 50.0% 50.0% 50.0% 50.0% 50.0% 50.0% 50.0% 50.0% 50.0% 50.0% 50.0% 50.0% Sat EVE (7-8) 40.0% 60.0% 59.0% 41.0% 53.0% 47.0% 75.0% 25.0% 34.0% 66.0% 50.0% 50.0% 50.0% 50.0% 45.0% 55.0% 34.0% 66.0% 75.0% 25.0% (1) (1) (1) (1) (1) (1) (1) (1) (1) (1) Truck Directional Distribution MD (12-1) 50.0% 50.0% 50.0% 50.0% 50.0% 50.0% 50.0% 50.0% 50.0% 50.0% 50.0% 50.0% 50.0% 50.0% 50.0% 50.0% 50.0% 50.0% 50.0% 50.0% PM (5-6) 50.0% 50.0% 50.0% 50.0% 50.0% 50.0% 50.0% 50.0% 50.0% 50.0% 50.0% 50.0% 50.0% 50.0% 50.0% 50.0% 50.0% 50.0% 50.0% 50.0% EVE (7-8) 50.0% 50.0% 50.0% 50.0% 50.0% 50.0% 50.0% 50.0% 50.0% 50.0% 50.0% 50.0% 50.0% 50.0% 50.0% 50.0% 50.0% 50.0% 50.0% 50.0% Sat MD (1-2) 50.0% 50.0% 50.0% 50.0% 50.0% 50.0% 50.0% 50.0% 50.0% 50.0% 50.0% 50.0% 50.0% 50.0% 50.0% 50.0% 50.0% 50.0% 50.0% 50.0% Sat EVE (7-8) 50.0% 50.0% 50.0% 50.0% 50.0% 50.0% 50.0% 50.0% 50.0% 50.0% 50.0% 50.0% 50.0% 50.0% 50.0% 50.0% 50.0% 50.0% 50.0% 50.0% Notes 1. CEQR Technical Manual 2012, Table For open space, Active Park Space was used; temporal distribution for Weekday EVE assumed to be half of Weekday PM and Sat EVE assumed to be half of Sat MD. For Rooftop Exhibit (Museum), Weekday EVE and Saturday EVE temporal distribution assumed to be same as Weekday PM temporal distribution. 2. Sam Schwartz Engineering survey at Chelsea Market, February Weekday person trip rate based on Urban Space for Pedestrians (Pushkarev & Zupan, 1975), Table PHA Survey of temporary art installation/exhibit at Pier 54, May ITE Trip Generation, 8th Edition, Land Use Code 931, Quality Restaurant. Weekday PM is same as weekday peak of Adjacent Street Traffic, Weekday EVE is same as weekday PM Peak of Generator, Satruday EVE is same proportion as Saturday Peak of Generator and Daily Saturday trip rate. Saturday MD trip rate based on ITE ratio of Saturday to weekday daily trip generation (see note 3). Temporal and directional distributions based on ITE as follows: Weekday MD assumed to be 6. Brooklyn Bridge Park FEIS (2005), Table 14-6, Multi-use (Theater) land use. Truck temporal distribution for EVE and Sat EVE assumed to be 0%. Restaurant vehicle occupancies were used for taxi. Marina land use used weekday trip generation rates for Marina. 7. Special West Chelsea District Rezoning and High Line Open Space FEIS, May 2010, Table 16-6, High Line Open Space land use. Saturday mode share and vehicle occupancy assumed to be same as weekday. Weekday EVE temporal distribution assumed to be half of Weekday PM; Sat EVE temporal assumed to be half of Sat MD. Weekday EVE and Sat EVE directional distribution is assumed to be same as Weekday PM. Saturday MD directional assumed 50/ Fordham University Lincoln Center Master Plan FEIS, 2009, Table 15-2, for Graduate Students Day/Full-Time. Dorm-based mode share redistributed proportionally among auto, taxi, bus and subway. Shuttle mode share redistributed proportionally among bus and subway. SSE determined Weekday MD and PM temporal distribution based on published class schedules for the Institute of Culinary Education. Weekday EVE temporal distribution assumed be half of weekday PM. Assumed 9. Based on Pier 54 movie event survey on 7/8/2009 performed by AKRF. Saturday EVE and Weekday PM temporal distribution and directional distribution assumed to be same as weekday EVE. Assumed no rooftop events for weekday MD and Saturday MD. During these times, open space assumptions were used. Taxi vehicle occupancy did not have good data from the AKRF survey; therefore, the restaurant assumption was used. (see note 6) 10. Assumed 20% linked trips for all uses except Marina, which assumes 0% linked trips. 11. ITE 8th Edition, Land Use Code 540, Junior/Community College 12. Hudson River Park FEIS (1998), Table For Marina, Weekday EVE temporal distribution and directional distribution assumed to be same as weekday PM. For Marina, Sat EVE temporal distribution and directional distribution assumed to be same as Sat MD. For Restaurant, assume Saturday MD is the same as Weekday MD and assume Weekday EVE and Saturday EVE are zero. 13. Hudson Yards FGEIS (2004) App S-1, Table 1, "Museum Trip Generation Transportation Planning Assumptions" Memorandum. Saturday EVE directional distribution assumed to be same as Weekday EVE. Saturday MD directional distribution assumed to be 50/50. Saturday EVE temporal distribution assumed to be CEQR Technical Manual 2012, Table 16-2, for MD, PM, Saturday midday.hudson Yards FGEIS (2004) App S-1, Table 1 and 2, "Destination Retail Trip Generation Transportation Planning Assumptions" Memorandum for Weekday EVE and Saturday EVE. Truck distribution for Sat MD assumed to be same as Weekday MD. 15. Chelsea Piers, FEIS (1993), Table II.F.7. Saturday mode share and vehicle occupancy assumed to be same as weekday. 16. ITE Trip Generation, 8th Edition, Land Use Code 932, High-Turnover (Sit Down) Restaurant. Saturday MD temporal distribution assumed to be same as Destination Retail for Saturday MD. 17. SSE assumptions based on review of class schedules at several technical art schools, including the Institiute of Culinary Education in NYC. 18. SSE and NYCDOT Assumptions. M:\AK Pier 57 EIS\Engineering Data\Trip Generation\ Pier 57 Preliminary Trip Generation.xlsxSSE Trip Gen Daytime Exhibit
45 DRAFT Table 2A Pier 57 Trip Generation (Typical Scenario) Person Trips Destination Retail (Market) Quality Restaurant Food Counter Theatre Museum/Exhibit Space (Caissons) Technical Arts School Marina Rooftop Open Space Rooftop Exhibit (Museum) TOTAL Daily Trips Weekday Saturday 12,680 14,999 3,384 3,550 4,511 4, ,184 2, ,535 27,866 Peak Hour Trips MD (12-1) PM (5-6) EVE (7-8) Sat MD (1-2) Sat EVE (7-8) 1,141 1,141 1,065 1, ,230 2,274 2,530 2,920 1,542 IN OUT IN OUT IN OUT IN OUT IN OUT IN OUT IN OUT IN OUT IN OUT IN OUT TOTAL MD PM EVE Sat MD Sat EVE Auto Taxi Subway Bus Walk/Other Total Auto Taxi Subway Bus Walk/Other Total Auto Taxi Subway Bus Walk/Other Total Auto Taxi Subway Bus Walk/Other Total Auto Taxi Subway Bus Walk/Other Total Vehicle Trips IN OUT IN OUT IN OUT IN OUT IN OUT IN OUT IN OUT IN OUT IN OUT IN OUT TOTAL MD PM EVE Sat MD Sat EVE Auto Taxi Taxi (Balanced) Truck Total Auto Taxi Taxi (Balanced) Truck Total Auto Taxi Taxi (Balanced) Truck Total Auto Taxi Taxi (Balanced) Truck Total Auto Taxi Taxi (Balanced) Truck Total Notes 1. A 50% taxi overlap rate was assumed (i.e., 50% of inbound full taxis are assumed to be available for outbound demand), based on the CEQR 2012 Technical Manual. Total Walk Trips In Out In Out In Out In Out In Out In Out In Out In Out In Out In Out TOTAL MD PM EVE SAT MD SAT EVE Total Walk Trips ,662 Total Walk Trips ,704 Total Walk Trips , ,832 Total Walk Trips , ,979 Total Walk Trips Notes 1. Total walk trips includes all trips via transit plus walk only trips. M:\AK Pier 57 EIS\Engineering Data\Trip Generation\ Pier 57 Preliminary Trip Generation.xlsxSSE Trip Gen Daytime Exhibit
46 DRAFT Table 2B Pier 57 Trip Generation (Evening Pre-Event Scenario) Person Trips Daily Trips Peak Hour Trips Weekday Saturday MD (12-1) PM (5-6) EVE (7-8) Sat MD (1-2) Sat EVE (7-8) Destination Retail Museum/Exhibit Space Rooftop Event Quality Restaurant Food Counter Theatre Technical Arts School Marina (Market) (Caissons) (2) TOTAL 12,680 3,384 4, ,184 5,360 29,424 14,999 3,550 4, ,432 5,360 32,701 1, ,183 1, ,231 1, ,715 4,209 1, , ,715 3,225 IN OUT IN OUT IN OUT IN OUT IN OUT IN OUT IN OUT IN OUT IN OUT TOTAL MD Auto Taxi Subway Bus Walk/Other Total PM Auto Taxi Subway Bus Walk/Other Total EVE Auto Taxi Subway , ,763 Bus Walk/Other ,401 Total Sat MD Auto Taxi Subway Bus Walk/Other Total Sat EVE Auto Taxi Subway ,331 Bus Walk/Other ,020 Total Vehicle Trips IN OUT IN OUT IN OUT IN OUT IN OUT IN OUT IN OUT IN OUT IN OUT TOTAL MD Auto Taxi Taxi (Balanced) Truck Total PM Auto Taxi Taxi (Balanced) Truck Total EVE Auto Taxi Taxi (Balanced) Truck Total Sat MD Auto Taxi Taxi (Balanced) Truck Total Sat EVE Auto Taxi Taxi (Balanced) Truck Total Notes 1. A 50% taxi overlap rate was assumed (i.e., 50% of inbound full taxis are assumed to be available for outbound demand), based on the CEQR 2012 Technical Manual. 2. It was assumed that there would be no rooftop events during the Weekday MD and Saturday MD peaks. During those times, the rooftop trip generation would match the Weekday MD and Saturday MD for the Typical Scenario (ie, open space).; Total Walk Trips In Out In Out In Out In Out In Out In Out In Out In Out In Out TOTAL MD PM EVE SAT MD SAT EVE Total Walk Trips ,626 Total Walk Trips ,669 Total Walk Trips , ,166 1,166 3,332 Total Walk Trips , ,939 Total Walk Trips , , ,473 Notes 1. Total walk trips includes all trips via transit plus walk only trips. M:\AK Pier 57 EIS\Engineering Data\Trip Generation\ Pier 57 Preliminary Trip Generation.xlsxSSE Trip Gen Evening Event
47
48 Appendix B Chelsea Market Survey Results
49
50 CHELSEA MARKET SURVEY RESULTS FEBRUARY 2011 Conducted by Sam Schwartz Engineering Saturday, February 12, 2011 and Wednesday, February 16, What was your primary mode of travel to Chelsea Market Today? Mode 1 Mode 2 Weekday Midday Weekday PM Saturday Midday Saturday Evening Auto 12.2% 6.6% 3.8% 14.1% Bike 2.4% 1.5% 3.8% 1.3% Bus 3.3% 3.6% 5.1% 1.9% Bus Subway 0.0% 0.0% 0.0% 0.0% Ferry Subway 0.8% 0.0% 0.0% 0.0% Rail LIRR Subway 0.8% 0.7% 0.0% 1.3% Rail LIRR 0.0% 0.7% 0.6% 1.3% Rail MetroNorth Subway 0.0% 0.0% 0.0% 0.0% Rail NJ Transit 0.8% 0.7% 1.3% 0.0% Rail Path 0.8% 0.7% 1.9% 3.2% Subway 33.3% 42.3% 30.6% 28.2% Subway Bus 1.6% 0.0% 0.0% 0.6% Taxi 5.7% 4.4% 15.3% 9.6% Walk Only 38.2% 38.7% 37.6% 38.5% Total Visitors Sample Size 100.0% 100.0% 100.0% 100.0% If you arrived via auto or taxi, how many people did you travel with, including yourself? Vehicle Occupancy Mode Weekday Saturday Auto Autos People Avg Taxi Taxis People Avg Are you visiting the market or do you work in the building? Total Visitors Total Non Visitors Total Weekday Midday Weekday PM Saturday Midday Saturday Evening What is the neighborhood (i.e. zip code) you traveled directly from? Origin Weekday Midday Weekday PM Saturday Midday Saturday PM Bronx 0.0% 0.0% 2.5% 1.9% Brooklyn 10.6% 10.9% 5.1% 6.4% Manhattan 68.3% 75.9% 81.5% 71.2% Queens 7.3% 2.9% 3.2% 4.5% Staten Island 0.0% 0.0% 1.3% 0.6% Upstate NY 5.7% 1.5% 1.3% 1.3% Long Island 0.8% 1.5% 0.6% 3.2% NJ/PA 6.5% 5.8% 4.5% 10.3% CT 0.8% 1.5% 0.0% 0.6% Total 100.0% 100.0% 100.0% 100.0% Sample Size
51 1. What was your primary mode of travel to Chelsea Market Today? Back Up Survey Data Mode 1 Mode 2 Weekday Midday Weekday PM Saturday Midday Saturday Evening Auto Bike Bus Bus Subway Ferry Subway Rail LIRR Subway Rail LIRR Rail MetroNorth Subway Rail NJ Transit Rail Path Subway Subway Bus Taxi Walk Only Total Visitors
52 4. What is the neighborhood (i.e. zip code) you traveled directly from? Back Up Survey Data Mode Auto Mode Bus Mode Subway Origin Weekday Weekday Saturday Saturday Midday PM Midday Evening Bronx/Upstate/Harlem Midtown/Downtown Upper East Side Battery Park Staten Island/Jersey Holland Tunne New Jersey Lincoln Tunnel/GWB Queens/Long Island Brooklyn New Jersey General Total Auto Origin Weekday Weekday Saturday Saturday Midday PM Midday Evening Bronx Brooklyn Port Authority/Hells Kitchen Uptown General East Village/Union Square Upper West Side Midtown Upper East Side Total Bus Origin Weekday Weekday Saturday Saturday Midday PM Midday Evening Chelsea Chinatown General East Village Financial District General Financial District Wall Street Financial District WTC Greenwich Village Harlem General Hell's Kitchen LIRR/Amtrak Penn Station Lower East Side MetroNorth Grand Central Midtown Midtown East Midtown General NJ Transit Port Authority NOHO SOHO Staten Island Ferry/Battery Park Times Square Upper East Side General Upper West Side General Uptown Washington Heights West Village Bronx General Brooklyn Brighton Brooklyn Downtown Brooklyn Flatbush Brooklyn Greenpoint Brooklyn Williamsburg Brooklyn General Queens Astoria Queen General Queensbridge Total Subway
53 Mode Taxi Mode Walk Mode Bike Origin Weekday Weekday Saturday Saturday Midday PM Midday Evening Midtown Queens JFK Upper West Side Upper East Side West Village East Side Brooklyn New Jersey General SOHO/Chinatown Chelsea Downtown Total Taxi Origin Weekday Weekday Saturday Saturday Midday PM Midday Evening Chelsea 15th Street Chelsea West Village East Village Brooklyn Midtown Midtown West Union Square Midtown East Upper West Side SOHO Chelsea 10th Ave Chelsea 9th Ave Gansvoort 9th Ave Gansvoort 8th Ave Upper East Side Lower East Side Greenwich Village Tribeca Chinatown Chelsea 11th Ave Total Walk Origin Weekday Weekday Saturday Saturday Midday PM Midday Evening Harlem West Village Lower East Side Midtown Chelsea NJ & West Total Bike Total Visitors
54 Appendix C Trip Assignment Flow Diagrams
55
56 In 188 Out W 24th Street W 23rd Street W 18th Street W 22nd Street th Avenue 11th Avenue 0 8 Chelsea Piers Exit ## ## W 17th Street 0 10th Avenue 9th Avenue 8th Avenue W 16th Street W 15th Street W 14th Street th Avenue 53 9th Avenue 8th Avenue Project Site Study Area Intersections Street Direction FIGURE C 1 Pier 57 Total Vehicular Trip Assignment (Weekday MD Exhibit Condition)
57
58 In 186 Out W 24th Street W 23rd Street W 18th Street W 22nd Street th Avenue 11th Avenue Chelsea Piers Exit ## ## W 17th Street 5 10th Avenue 9th Avenue 8th Avenue W 16th Street W 15th Street W 14th Street th Avenue 40 9th Avenue 8th Avenue Project Site Study Area Intersections Street Direction FIGURE C 2 Pier 57 EIS Total Vehicular Trip Assignment (Weekday PM Exhibit Condition)
59
60 In 264 Out th Avenue th Avenue W 24th Street W 23rd Street W 22nd Street W 18th Street Chelsea Piers Exit ## ## W 17th Street 10 10th Avenue 9th Avenue 8th Avenue W 16th Street W 15th Street W 14th Street th Avenue 50 9th Avenue 8th Avenue Project Site Study Area Intersections Street Direction FIGURE C 3 Pier 57 EIS Total Vehicular Trip Assignment (Weekday EVE Pre Event Condition)
61
62 In 288 Out W 24th Street W 23rd Street W 18th Street W 22nd Street th Avenue 10 11th Avenue Chelsea Piers Exit W 17th Street 10 10th Avenue 9th Avenue 8th Avenue ## W 16th Street W 15th Street W 14th Street th Avenue 81 9th Avenue 8th Avenue Project Site Study Area Intersections Street Direction FIGURE C 4 Pier 57 Total Vehicular Trip Assignment (SAT MD Exhibit Condition)
63
64 In 210 Out th Avenue 11th Avenue 7 W 24th Street W 23rd Street W 22nd Street W 18th Street Chelsea Piers Exit th Avenue 9th Avenue 8th Avenue ## ## W 17th Street W 16th Street Project Site W 15th Street W 14th Street th Avenue 14 8th Avenue th Avenue 48 Study Area Intersections Street Direction FIGURE C 5 Pier 57 EIS Total Vehicular Trip Assignment (Saturday EVE Pre Event Condition)
65
66 Auto Parking Auto Parking 13 Auto Parking 0 Auto Parking 15 7 Auto Parking Auto Parking A, C, E, L (18th (18th (18th (18th (18th (18th (18th 8 8 A, C, E, L (18th (18th (18th (18th) 123 (18th (18th) 123 (18th 1 54 A, C, E, L A, C, E, L W 16th Street W 16th Street W 16th Street A, C, E, L (18th 1 A, C, E, L 3 M 14D (18th 1 M 14D Route 9A 10th Ave 9th Ave 8th Ave Pier Auto Parking Auto Parking A, C, E, L A, C, E, L 9 91 A, C, E, L A, C, E, L W 15th Street W 15th Street 4 3 W 15th Street Auto Parking Auto Parking (14th A, C, E, L A, C, E, L 123 (14th A, C, E, L A, C, E, L M11 M11 16 W 14th Street W 14th Street W 14th Street A, C, E, L M14A (14th) A, C, E, L A, C, E, L 123 (14th 22 M14A (14th) 123 (14th 18 Washington Street th Ave Hudson Place A, C, E, L 11 Pedestrian Route FIGURE C 6 Pedestrian Portal Inbound Portal Pier 57 EIS Outbound Portal Pedestrian Trip Assignment (Weekday MD Exhibit Condition)
67
68 Auto Parking 8 22 Auto Parking 5 Auto Parking 8 Auto Parking 15 8 Auto Parking Auto Parking A, C, E, L (18th (18th (18th (18th (18th (18th (18th 9 8 A, C, E, L (18th (18th (18th (18th) 123 (18th (18th) 123 (18th 2 56 A, C, E, L A, C, E, L W 16th Street W 16th Street W 16th Street A, C, E, L (18th 1 A, C, E, L 3 M 14D (18th 1 M 14D Route 9A 10th Ave 9th Ave 8th Ave Pier A, C, E, L A, C, E, L 9 93 A, C, E, L A, C, E, L W 15th Street W 15th Street 4 3 W 15th Street Auto Parking Auto Parking (14th A, C, E, L A, C, E, L 123 (14th A, C, E, L A, C, E, L M11 M11 16 W 14th Street W 14th Street W 14th Street A, C, E, L M14A (14th) A, C, E, L A, C, E, L 123 (14th 17 M14A (14th) 123 (14th 15 Washington Street th Ave Hudson Place A, C, E, L 11 Pedestrian Route FIGURE C 7 Pedestrian Portal Inbound Portal Pier 57 EIS Outbound Portal Pedestrian Trip Assignment (Weekday PM Exhibit Condition)
69
70 Auto Parking Auto Parking 21 Auto Parking 19 Auto Parking Auto Parking Auto Parking A, C, E, L (18th (18th (18th (18th (18th (18th (18th A, C, E, L (18th (18th (18th (18th) 123 (18th (18th) 123 (18th A, C, E, L A, C, E, L W 16th Street W 16th Street W 16th Street Pier A, C, E, L (18th 2 A, C, E, L 4 M 14D (18th 1 M 14D A, C, E, L A, C, E, L A, C, E, L A, C, E, L Route 9A 10th Ave 50 W 15th Street W 15th Street 10 8 W 15th Street Auto Parking Auto Parking (14th A, C, E, L A, C, E, L 123 (14th A, C, E, L A, C, E, L M11 M11 39 W 14th Street W 14th Street W 14th Street th Ave 8th Ave A, C, E, L M14A (14th) A, C, E, L A, C, E, L 123 (14th 45 M14A (14th) 123 (14th 24 Washington Street th Ave Hudson Place A, C, E, L 17 Pedestrian Route FIGURE C 8 Pedestrian Portal Inbound Portal Pier 57 EIS Outbound Portal Pedestrian Trip Assignment (Weekday EVE Pre Event Condition)
71
72 Auto Parking Auto Parking 12 Auto Parking 17 Auto Parking Auto Parking Auto Parking A, C, E, L (18th (18th (18th (18th (18th (18th (18th 9 8 A, C, E, L (18th (18th (18th (18th) 123 (18th (18th) 123 (18th 3 63 A, C, E, L A, C, E, L W 16th Street W 16th Street W 16th Street A, C, E, L (18th 1 A, C, E, L 2 M 14D (18th 1 M 14D Route 9A 10th Ave 9th Ave 8th Ave Pier A, C, E, L A, C, E, L A, C, E, L A, C, E, L W 15th Street W 15th Street 6 5 W 15th Street Auto Parking Auto Parking (14th A, C, E, L A, C, E, L 123 (14th A, C, E, L A, C, E, L M11 M11 22 W 14th Street W 14th Street W 14th Street A, C, E, L M14A (14th) A, C, E, L A, C, E, L 123 (14th 32 M14A (14th) 123 (14th 20 Washington Street th Ave Hudson Place A, C, E, L 9 Pedestrian Route FIGURE C 9 Pedestrian Portal Inbound Portal Pier 57 EIS Outbound Portal Pedestrian Trip Assignment (SAT MD Exhibit Condition)
73
74 p Pier Auto Parking Auto Parking 11 Auto Parking 18 Auto Parking Auto Parking Auto Parking A, C, E, L (18th (18th (18th (18th (18th (18th (18th 9 8 A, C, E, L (18th (18th (18th (18th) 123 (18th (18th) 123 (18th A, C, E, L A, C, E, L W 16th Street W 16th Street W 16th Street A, C, E, L (18th 1 A, C, E, L 3 M 14D (18th 1 M 14D A, C, E, L A, C, E, L A, C, E, L A, C, E, L Route 9A 10th Ave 40 W 15th Street W 15th Street 8 6 W 15th Street Auto Parking Auto Parking (14th A, C, E, L A, C, E, L 123 (14th A, C, E, L A, C, E, L M11 M11 30 W 14th Street W 14th Street W 14th Street A, C, E, L M14A (14th) A, C, E, L A, C, E, L 123 (14th 37 M14A (14th) 123 (14th 17 9th Ave 8th Ave Washington Street th Ave e Hudson Place A, C, E, L 12 Pedestrian Route FIGURE C 10 Pedestrian Portal Inbound Portal Pier 57 EIS Outbound Portal Pedestrian Trip Assignment (SAT EVE Pre Event Condition)
75
76 Appendix D Response to NYCDOT s Comments on Original TDF Memo Submission
77
78 Memorandum To: Naim Rasheed, Director Traffic Planning, NYCDOT From: Jeff Smithline, PE, PTOE Date: October 25, 2011 Re: Response to NYCDOT Comments on TDF Memorandum Pier 57 Environmental Impact Statement CEQR No.: 11HRP001M Project No: AK Sam Schwartz Engineering (SSE) has prepared the following response to comments received from Marjorie Bryant of NYCDOT, which were provided on September 6, Comments 1. Comment: Please have the consultant update the travel demand assumptions to reflect the specific type of restaurants (i.e., high end quality restaurant, fast food restaurant, or even the counter-type food service found at Chelsea Market). A total of 43,500 SF of restaurant space is programmed for Pier 57. Two restaurants totaling 20,100 SF (including an outdoor terrace with some seating) are expected to be of the quality restaurant type as described in the ITE Trip Generation, while the remaining 23,400 SF are expected to be the high-turnover, sit-down restaurant type as described in the ITE Trip Generation manual. The travel demand assumptions will be updated to reflect the differing factors associated with these two distinct restaurant styles. As in Chelsea Market, counter-type food service will likely be provided by food retailers that will offer a combination of goods to take away in shopping bags as well as to be consumed on-the-spot. These establishments will be integrated into the retail portions of the site, and therefore were included in the retail land use category. 2. Comment: The temporal distribution for all peak hours appears high for the theatre and conversely low for the restaurant. Please have the consultant provide the backup materials for these uses. SSE has provided the backup material for the temporal distribution assumptions for the restaurant and theater land uses. The restaurant assumptions are from the ITE Trip Generation handbook for land use 931 (see attachment A). The theater assumptions are based on the Brooklyn Bridge FEIS for midday and PM peak hours and the Pier 54 Movie Event survey for the evening peak hours. See attachments B and C. 3. Comment: Please have the consultant reduce the linked trip credit to 20% for all proposed development components. Additionally, DOT recommends removal of the linked trip credit for the RooftoplExhibit (Museum) space since its hours of operation may be different than those of the overall site, unless the consultant can justify its application. Chicago Los Angeles Newark New York Philadelphia Tampa Washington D.C. Windsor-Detroit Seoul
79 Response to NYCDOT Comments on TDF Memorandum CEQR No.: 11HRP001M October 25, 2011 Page 2 2 SSE will reduce the linked trip credit from 25% to 20% for all land uses. The 20% linked trip credit will be applied to the Rooftop/Exhibit (Museum) space as the rooftop would have the same or similar operating hours as the rest of the pier. 4. Comment: Please provide the hours of operation for the proposed development components at Pier 57. In addition, please provide a description of the Rooftop Exhibit (Museum). General hours of operation for Pier 57 are anticipated to be 7:00 AM to 9:00 PM daily, similar to Chelsea Market, and these hours will be typical for the retail spaces as well as the Technical Arts School. The rooftop will be open whenever the rest of the pier is open, and would extend beyond 9:00 PM when there is a rooftop event. Restaurant hours will likely extend to around 10 or 11:00 PM and later on Fridays and Saturdays, which is consistent with restaurant operations in the surrounding area. The caisson-level exhibit space will likely have shorter hours more typical of these spaces, such as 10:30 AM to 5:30 PM, and will likely have extended evening hours when a rooftop event is occurring. The Marina is expected to be staffed during daylight and early evening hours. The Rooftop space is designed to be a flexible open space for seating, relaxation, and views of the river, functioning primarily as a public open space. Two main areas would be developed to allow the Tribeca Film Festival to periodically provide a variety of rooftop programming, ranging from film screenings to outdoor art installations to exhibitions linked to film subjects for example, a temporary skate park to coincide with a sports-related film series. Attendance for such events typically would not exceed 1,500 people, and the maximum event size would be 2,500. Events would be ticketed so that capacity could be controlled. 5. Comment: Please have the consultant provide the results of the survey conducted at Pier 54 for the art installation "Ashes and Snow" which was discussed at the July 22nd meeting. SSE has provided the Pier 54 Ashes and Snow (attachment D) and Movie Event survey results (attachment C). 6. Comment: Please have the consultant use the Marina trip generation rate from the Brooklyn Bridge Park FElS, which uses 6.23 person trips/slip. SSE will revise the weekday trip generation rate for the Marina land use as requested. 7. Comment: The Brooklyn trip assignment should be revised to include the Williamsburg, and Manhattan Bridges; also in Manhattan there are several routes to reach Route 9A, including Hudson Street from the Brooklyn Bridge, Canal Street from the Manhattan Bridge and East Houston/Delancey Street from the Williamsburg Bridge. SSE will revise the text in the TDF memo to explain that trips from Brooklyn will use the Brooklyn, Manhattan, and Williamsburg bridges, in addition to the Battery Tunnel. These Chicago Los Angeles Newark New York Philadelphia Tampa Washington D.C. Windsor-Detroit Seoul
80 Response to NYCDOT Comments on TDF Memorandum CEQR No.: 11HRP001M October 25, 2011 Page 3 3 trips will be routed through Manhattan to Route 9A via the most direct path. However, since these paths reach Route 9A south of West 14 th Street, there will be no change to the original vehicle trip assignment results. See attachment E. 8. Comment: Regarding the Technical Arts School, please have the consultant explain why there are no references for employees, and visitors. The trip generation estimates for the Technical Arts School were based on daily trip rates presented in the ITE Trip Generation, 8th Edition manual for the Junior/Community College (Land Use Code 540) land use. The ITE trip generation rates that were used were based on overall square-footage, and they are blended rates that account for all trips (students, employees, and visitors) to the site. This is appropriate because only the square footage of the school is known at this time. 9. Comment: Please have the consultant provide the 2000 US Census Journey to Work background material as referenced in Table 19 (Technical Arts School Use: Subway Trip Assignment references 2000 Census Journey to Work). SSE has provided the 2000 US Census Journey to Work background materials used to develop the Technical School subway trip assignment; see attachment F. 10. Comment: Please have the consultant include 9th Avenue/Hudson Street at West 14 Street in the study. SSE will include Hudson Street as part of the analysis of the 9 th Avenue/West 14 th Street intersection. 11. SSE contacted Marjorie Bryant of NYCDOT on October 17, 2011, to confirm that the comment memo included all NYCDOT comments to date. During that conversation, SSE proposed to make two additional changes to the TDF memo: a. The TDF assumptions will be revised to provide a single percentage for the bus trip assignment for Market/Retail/Restaurant land use. This change will be reflected in Table 4 of the revised TDF Memo. b. The trip generation rate for Rooftop Open Space/Park land uses will be based on the rates provided in the 2010 CEQR Manual as was considered for the TDF Memo. The hours of the open space/park at Pier 57 are consistent with the data used to develop the CEQR trip generation rates. If you agree with our responses, we will prepare a revised TDF Memo that incorporates the changes. The revised memo will include updates to the size of some land use categories based on site plan changes since the last submission. Please contact me at x119 if you have any questions. Chicago Los Angeles Newark New York Philadelphia Tampa Washington D.C. Windsor-Detroit Seoul
81
82 Pier 57 EIS Attachment A ITE Trip Generation Handbook Land Use 931
83
84
85
86
87
88
89
90 Pier 57 EIS Attachment B Brooklyn Bridge FEIS Theater Trip Generation
91
92
93
94 Pier 57 EIS Attachment C Pier 54 Movie Event Survey Results
95
96
97
98 Pier 57 EIS Attachment D Pier 54 Ashes and Snow Survey Results
99
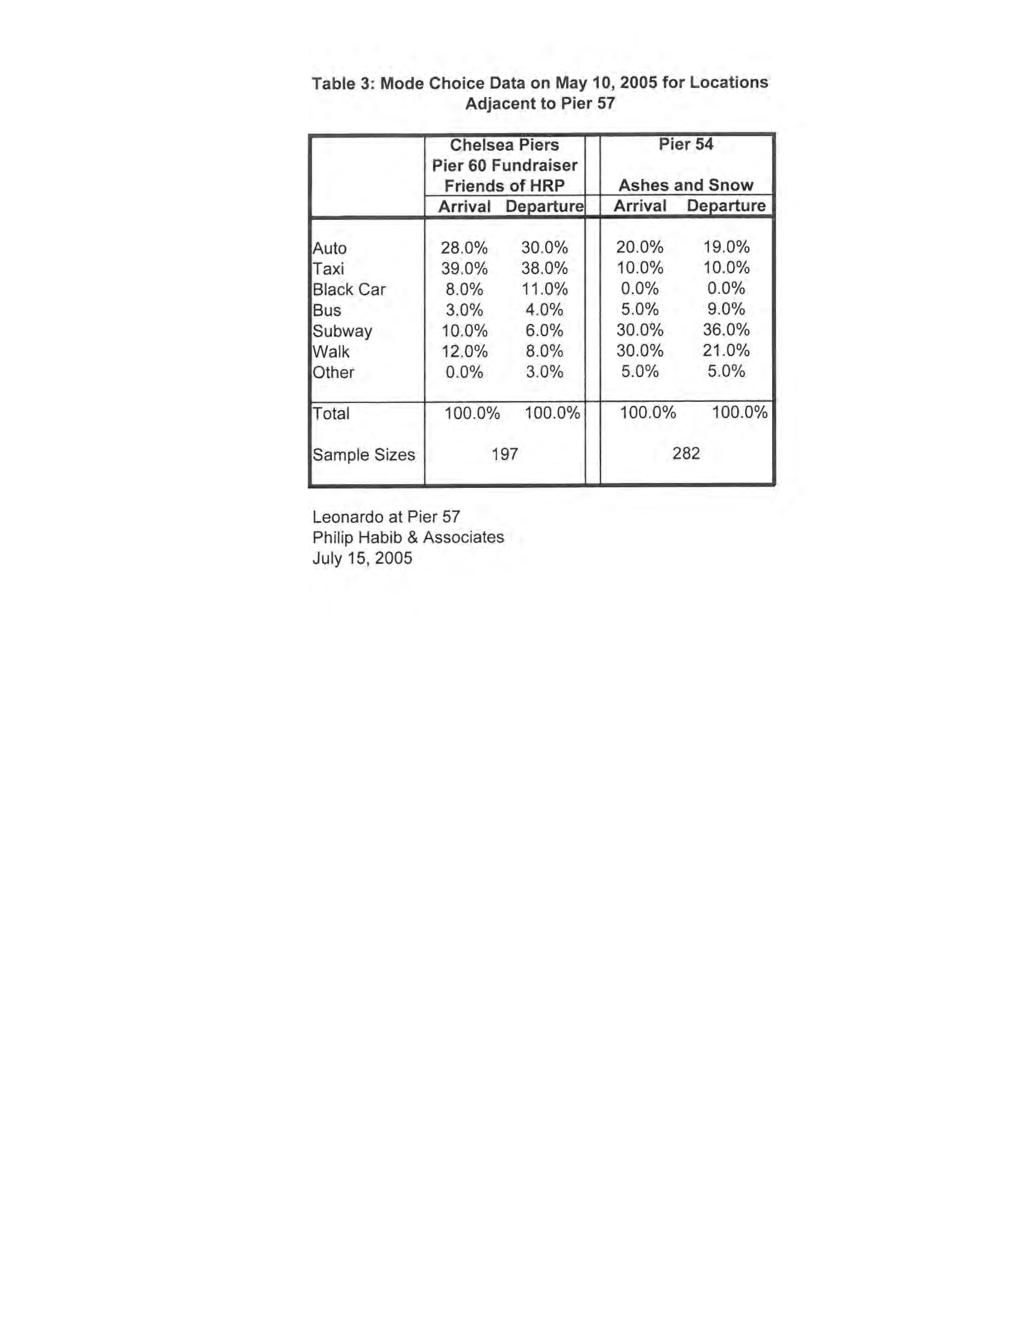
100
101
102 Pier 57 EIS Attachment E Regional Trip Assignment
103
104 New Jersey Bronx / Upstate / Harlem Queens Midtown / Upper West Side New Jersey Queens / Long Island / JFK Midtown / Upper East Side / Chelsea / East Village Study Area Battery Park / SoHo / West Village / Chinatown Brooklyn New Jersey / Staten Island Brooklyn Brooklyn FIGURE 1 Pier 57 EIS Trip Assignment Screenlines
105
106 Pier 57 EIS Attachment F 2000 Census Journey to Work Data
107
108 Technical School Trip Distribution Census Journey to Work Data 2000 Number % Total Workers at Work in NYC 3,755, By NYC 2,922, Bronx 365, Brooklyn 855, Manhattan 700, Queens 825, Staten Island 175, NY State 457, Dutchess Cty 5, Nassau Cty 197, Orange Cty 14, Putnam Cty 7, Rockland Cty 26, Suffolk Cty 80, Sullivan Cty 1,348 0 Ulster Cty 2, Westchester Cty 117, New Jersey 307, Bergen Cty 74,966 2 Essex Cty 32, Hudson Cty 66, Hunterdon Cty 1,494 0 Mercer Cty 6, Middlesex Cty 33, Monmouth Cty 30, Morris Cty 13, Ocean Cty 4, Passaic Cty 10, Somerset Cty 7, Sussex Cty 1, Union Cty 19, Warren Cty Connecticut 33, Fairfield Cty 28, Litchfield Cty 1,227 0 New Haven Cty 2, Other States 34, Subway Line Brooklyn General 7.6% L Brooklyn General 15.3% ACE Queens/Long Island 9.7% L Queens/Long Island 19.7% ACE Bronx/Upstate/Harlem 5.0% L Bronx/Upstate/Harlem 10.2% ACE New Jersey General 9.1% ACE Staten Island/Jersey Holland Tunnel 4.7% 123 Manhattan General 4.6% L Manhattan General 11.5% ACE Manhattan General 2.5% 123 TOTAL SUBWAY % L 26.9% ACE 65.9% 123 (14th) 6.2% 123 (18th) 1.1%
109
110 Appendix E Response to NYCDOT s Comments on Revised TDF Memo Submission
111

112 Memorandum To: Naim Rasheed, Director Traffic Planning, NYCDOT From: Jeff Smithline, PE, PTOE Date: May 1, 2012 Re: Response to Final NYCDOT Comments on TDF Memorandum Pier 57 Environmental Impact Statement CEQR No.: 11HRP001M Project No: AK NYCDOT provided final comments on the Travel Demand Factors for Pier 57 in a memorandum dated March 22, 2012, and sent to Noreen Doyle of the Hudson River Park Trust. Sam Schwartz Engineering (SSE) has reviewed and discussed these comments with Marjorie Bryant of NYCDOT and has prepared the following responses: Comments 1. Comment: The proposed bus mode share identified for both High-Turnover Restaurant and Quality Restaurant seem too high, particularly in relation to percentages used for Destination Retail and Theatre. We believe these land uses would be frequently visited by area workers and visitors to other development components. Therefore, NYCDOT recommends the consultant reexamine and revise both the modal split and temporal distribution based on Census data for office, Journey-To-Work and Reverse-Journey-To- Work. Please have the consultant provide the revised memorandum for NYCDOT review and approval. We agree that we should lower the bus mode share and also have a larger draw from the surrounding area. Based on our discussions with your office, we have modified the restaurant land use modal splits to be the following: Restaurant Proposed Proposed from Original Quality Food Mode TDF Memo Restaurant Counters Auto 25% 25% 25% Taxi 15% 20% 15% Subway 25% 30% 35% Bus 25% 5% 5% Walk/Other 10% 20% 20% As discussed with NYCDOT, SSE will also increase the Linked Trips for the Food Counters (formerly called High-Turnover Sit-Down Restaurant) from 20% to 25%. Chicago Los Angeles Newark New York Philadelphia Tampa Washington D.C. Windsor-Detroit Seoul
2.0 Development Driveways. Movin Out June 2017
 Movin Out June 2017 1.0 Introduction The proposed Movin Out development is a mixed use development in the northeast quadrant of the intersection of West Broadway and Fayette Avenue in the City of Madison.
Transportation Land Development Environmental S e r v i c e s
 Transportation Land Development Environmental S e r v i c e s Memorandum To: Ms. Kristin E. Kassner Planning Director Town Hall Annex 25 Center Street Burlington, MA 01803 Date: September 23, 2013 Project
New York Metropolitan Transportation Council. HUB Bound. Travel Data
 New York Metropolitan Transportation Council HUB Bound Travel Data December 2016 2015 ACKNOWLEDGEMENTS The New York Metropolitan Transportation Council (NYMTC) wishes to thank the following agencies for
HUB Bound. Travel Report. January
 HUB Bound Travel Report 2009 January 2011 www.nymtc.org ACKNOWLEDGEMENTS The New York Metropolitan Transportation Council (NYMTC) wishes to thank the following agencies for making this report possible:
Trip Generation Study: Provo Assisted Living Facility Land Use Code: 254
 Trip Generation Study: Provo Assisted Living Facility Land Use Code: 254 Introduction The Brigham Young University Institute of Transportation Engineers (BYU ITE) student chapter completed a trip generation
THE CORNERSTONE APARTMENTS TRAFFIC IMPACT STUDY R&M PROJECT NO
 THE CORNERSTONE APARTMENTS SITUATED AT N/E/C OF STAUDERMAN AVENUE AND FOREST AVENUE VILLAGE OF LYNBROOK NASSAU COUNTY, NEW YORK TRAFFIC IMPACT STUDY R&M PROJECT NO. 2018-089 September 2018 50 Elm Street,
Traffic Impact Study for Proposed Olive Boulevard Development
 Traffic Impact Study for Proposed 11330 Olive Boulevard Development Creve Coeur, Missouri July 7, 2017 Prepared For: 11330 Olive Boulevard Development 11330 Olive Boulevard Creve Coeur, Missouri 63141
King Soopers #116 Thornton, Colorado
 Traffic Impact Study King Soopers #116 Thornton, Colorado Prepared for: Galloway & Company, Inc. T R A F F I C I M P A C T S T U D Y King Soopers #116 Thornton, Colorado Prepared for Galloway & Company
NEW YORK METROPOLITAN TRANSPORTATION COUNCIL NEEE. D travel data
 NEW YORK METROPOLITAN TRANSPORTATION COUNCIL NEEE HUB O UN D travel data Acknowledgements The New York Metropolitan Transportation Council (NYMTC) wishes to thank the following agencies for making these
Traffic Impact Analysis West Street Garden Plots Improvements and DuPage River Park Garden Plots Development Naperville, Illinois
 Traffic Impact Analysis West Street Garden Plots Improvements and DuPage River Park Garden Plots Development Naperville, Illinois Submitted by April 9, 2009 Introduction Kenig, Lindgren, O Hara, Aboona,
appendix 4: Parking Management Study, Phase II
 appendix 4: Parking Management Study, Phase II A4-1 A4-2 Eastlake Parking Management Study Final Phase 2 Report Future Parking Demand & Supply January 6, 2017 Submitted by Denver Corp Center III 7900 E.
Heartland Town Square
 Attachment TRA- Assignment of Other Developments Hamlet of Brentwood Town of Islip Suffolk County, New York Prepared by: 0 Joshua s Path Suite 00 Hauppauge, New York.. May 0 Planned Development Project
DOMINICK S FINER FOODS Traffic Impact Analysis Sheridan Road and Foster Avenue (#2890) March 17, 2009
 March 17, 2009") DOMINICK S FINER FOODS Traffic Impact Analysis Sheridan Road and Foster Avenue (#2890) March 17, 2009 Prepared for: Manhard Consulting, Ltd. 900 Woodlands Parkway Vernon Hills, Illinois 60061 Prepared
DOMINICK S FINER FOODS Traffic Impact Analysis Sheridan Road and Foster Avenue (#2890) March 17, 2009 Prepared for: Manhard Consulting, Ltd. 900 Woodlands Parkway Vernon Hills, Illinois 60061 Prepared
TRAFFIC IMPACT STUDY FOR SONIC DRIVE-IN RESTAURANT. Vallejo, CA. Prepared For:
 TRAFFIC IMPACT STUDY FOR SONIC DRIVE-IN RESTAURANT Vallejo, CA Prepared For: ELITE DRIVE-INS, INC. 2190 Meridian Park Blvd, Suite G Concord, CA 94520 Prepared By: KD Anderson & Associates 3853 Taylor Road,
King County Metro. Columbia Street Transit Priority Improvements Alternative Analysis. Downtown Southend Transit Study. May 2014.
 King County Metro Columbia Street Transit Priority Improvements Alternative Analysis Downtown Southend Transit Study May 2014 Parametrix Table of Contents Introduction... 1 Methodology... 1 Study Area...
Project Purpose and Need B. IDENTIFICATION OF THE PROPOSED PROJECT
 Chapter 1: Project Purpose and Need A. INTRODUCTION The Federal Transit Administration (FTA) and the Metropolitan Transportation Authority (MTA), in cooperation with MTA New York City Transit (NYCT), propose
STH 60 Northern Reliever Route Feasibility Study Report
 #233087 v3 STH 60 Northern Reliever Route Feasibility Study Report Washington County Public Works Committee Meeting September 28, 2016 1 STH 60 Northern Reliever Route Feasibility Study Hartford Area Development
Escondido Marriott Hotel and Mixed-Use Condominium Project TRAFFIC IMPACT ANALYSIS REPORT
 Escondido Marriott Hotel and Mixed-Use Condominium Project TRAFFIC IMPACT ANALYSIS REPORT Prepared for Phelps Program Management 420 Sixth Avenue, Greeley, CO 80632 Prepared by 5050 Avenida Encinas, Suite
Proposed Inn at Bellefield Traffic Impact Assessment
 Proposed Inn at Bellefield Traffic Impact Assessment Town of Hyde Park Dutchess County, New York Prepared for: T-Rex Hyde Park Owner LLC 500 Mamroneck Avenue, Suite 300 Harrison, NY 10528 June 21, 2017
APPENDIX VMT Evaluation
 APPENDIX 2.7-2 VMT Evaluation MEMORANDUM To: From: Mr. Jonathan Frankel New Urban West, Incorporated Chris Mendiara LLG, Engineers Date: May 19, 2017 LLG Ref: 3-16-2614 Subject: Villages VMT Evaluation
MTA Capital and Planning Review
 MTA Capital and Planning Review The Bond Buyer's 5th Annual Metro Finance Conference November 15, 2007 Evolution of the Capital Plan 1 Plan Evolution First five-year plan approved in 1982 to rescue system
TRAFFIC IMPACT STUDY. USD #497 Warehouse and Bus Site
 TRAFFIC IMPACT STUDY for USD #497 Warehouse and Bus Site Prepared by: Jason Hoskinson, PE, PTOE BG Project No. 16-12L July 8, 216 145 Wakarusa Drive Lawrence, Kansas 6649 T: 785.749.4474 F: 785.749.734
vision42
 vision42 www.vision42.org vision42 auto-free light rail boulevard for 42nd Street Roxanne Warren, AIA, Chair George Haikalis, ASCE, Co-Chair Institute for Rational Urban Mobility,Inc. www.vision42.org
Table 1: Existing Trip Generation A.M. Peak Hour P.M. Peak Hour Land Use ITE Code Intensity Daily Total In Out Total In Out
 October 24, 218 Mr. Justin D. Bridges, AIA, LEED AP Davidson A+E 431 Indian Creek Parkway Overland Park, KS 6627 RE: Dear Mr. Bridges, Trip Generation Overland Park, Kansas As requested, Priority Engineers,
INDUSTRIAL DEVELOPMENT
 INDUSTRIAL DEVELOPMENT Traffic Impact Study Plainfield, Illinois August 2018 Prepared for: Seefried Industrial Properties, Inc. TABLE OF CONTENTS Executive Summary 2 Introduction 3 Existing Conditions
Parks and Transportation System Development Charge Methodology
 City of Sandy Parks and Transportation System Development Charge Methodology March, 2016 Background In order to implement a City Council goal the City of Sandy engaged FCS Group in January of 2015 to update
Letter EL652 City of Mercer Island. Page 1. No comments n/a
 Letter EL652 City of Mercer Island Page 1 No comments n/a Page 2 Response to comment EL652 1 Section 4.5.3 of the Final EIS presents the range of potential impacts of the project. This project also lists
Transportation & Traffic Engineering
 Transportation & Traffic Engineering 1) Project Description This report presents a summary of findings for a Traffic Impact Analysis (TIA) performed by A+ Engineering, Inc. for the Hill Country Family
IV. ENVIRONMENTAL IMPACT ANALYSIS L. TRANSPORTATION/TRAFFIC
 IV. ENVIRONMENTAL IMPACT ANALYSIS L. TRANSPORTATION/TRAFFIC INTRODUCTION The following section summarizes the information provided in the traffic report entitled Traffic Impact Analysis for a Proposed
Bi-County Transitway/ Bethesda Station Access Demand Analysis
 Bi-County Transitway/ Bethesda Station Access Demand Analysis Prepared for: Washington Metropolitan Area Transit Authority Office of Planning and Project Development May 2005 Prepared by: in conjunction
(+35,000 Recurring Local Jobs)
") (+35,000 Recurring Local Jobs) Insanity: doing the same thing over and over again and expecting different results. - Albert Einstein Samuel I. Schwartz, P.E. Sam Schwartz Engineering October, 2012 The
(+35,000 Recurring Local Jobs) Insanity: doing the same thing over and over again and expecting different results. - Albert Einstein Samuel I. Schwartz, P.E. Sam Schwartz Engineering October, 2012 The
MEMO VIA . Ms. Amy Roth DPS Director, City of Three Rivers. To:
 MEMO To: Ms. Amy Roth DPS Director, City of Three Rivers VIA EMAIL From: Michael J. Labadie, PE Julie M. Kroll, PE, PTOE Brandon Hayes, PE, P.Eng. Fleis & VandenBrink Date: January 5, 2017 Re: Proposed
TIMBERVINE TRANSPORTATION IMPACT STUDY FORT COLLINS, COLORADO JANUARY Prepared for:
 TIMBERVINE TRANSPORTATION IMPACT STUDY FORT COLLINS, COLORADO JANUARY 2014 Prepared for: Hartford Companies 1218 W. Ash Street Suite A Windsor, Co 80550 Prepared by: DELICH ASSOCIATES 2272 Glen Haven Drive
Sound Transit East Link: Bus/LRT System Integration Study
 Sound Transit East Link: Bus/LRT System Integration Study Prepared For: Sound Transit King County Metro Mercer Island WSDOT Prepared By: CH2M HILL July, 2014 1 SOUND TRANSIT EAST LINK: BUS/LRT SYSTEMES
TRANSPORTATION REVIEW
 TRANSPORTATION REVIEW - PROPOSED MIX OF LAND USES IS CONSISTENT WITH THE CITY S UNDER THE GRANVILLE BRIDGE POLICIES THAT AIM TO MEET NEIGHBOURING RESIDENTS SHOPPING NEEDS AND REDUCE RELIANCE ON AUTOMOBILE
EXECUTIVE SUMMARY. The following is an outline of the traffic analysis performed by Hales Engineering for the traffic conditions of this project.
 EXECUTIVE SUMMARY This study addresses the traffic impacts associated with the proposed Shopko redevelopment located in Sugarhouse, Utah. The Shopko redevelopment project is located between 1300 East and
Volume 1 Traffic Impact Analysis Turtle Creek Boulevard Dallas, Texas. Kimley-Horn and Associates, Inc. Dallas, Texas.
 Volume 1 Traffic Impact Analysis 2727 Dallas, Texas June 18, 2018 Kimley-Horn and Associates, Inc. Dallas, Texas Project #064523000 Registered Firm F-928 Traffic Impact Analysis 2727 Dallas, Texas Prepared
T-THIRD PHASE 3 CONCEPT STUDY C: DETAILED DESCRIPTIONS OF CONCEPT ALIGNMENTS D: CONSTRUCTABILITY ANALYSIS AND COST ESTIMATES (HNTB CONSULTANTS)
") A: 2014 SFMTA TRANSIT SERVICE INFORMATION B: SFMTA TRAFFIC COUNT DATA C: DETAILED DESCRIPTIONS OF CONCEPT ALIGNMENTS D: CONSTRUCTABILITY ANALYSIS AND COST ESTIMATES (HNTB CONSULTANTS) E: LAND USE AND VALUE
A: 2014 SFMTA TRANSIT SERVICE INFORMATION B: SFMTA TRAFFIC COUNT DATA C: DETAILED DESCRIPTIONS OF CONCEPT ALIGNMENTS D: CONSTRUCTABILITY ANALYSIS AND COST ESTIMATES (HNTB CONSULTANTS) E: LAND USE AND VALUE
Traffic Feasibility Study
 Traffic Feasibility Study Town Center South Robbinsville Township, Mercer County, New Jersey December 19, 2017 Prepared For Robbinsville Township Department of Community Development 2298 Route 33 Robbinsville,
IV. ENVIRONMENTAL IMPACT ANALYSIS K.2. PARKING
 IV. ENVIRONMENTAL IMPACT ANALYSIS K.2. PARKING ENVIRONMENTAL SETTING The following analysis summarizes the findings and conclusions of the Traffic Analysis (Traffic Study), prepared by The Mobility Group,
TECHNICAL MEMORANDUM. Part A: Introduction
 TECHNICAL MEMORANDUM To: David J. Decker Decker Properties, Inc. 5950 Seminole Centre Ct. Suite 200 Madison, Wisconsin 53711 608-663-1218 Fax: 608-663-1226 www.klengineering.com From: Mike Scarmon, P.E.,
Appendix C. Operating Assumptions (Service Plan) Tables and Figures. Travel time and Ridership Data - Tables
 Tables and Figures. Travel time and Ridership Data - Tables") Operating Assumptions ( Plan) Tables and Figures Travel time and Ridership Data - Tables C Plans One of the key measures utilized in level 2 screening under the transportation criteria was the travel
Operating Assumptions ( Plan) Tables and Figures Travel time and Ridership Data - Tables C Plans One of the key measures utilized in level 2 screening under the transportation criteria was the travel
9. Downtown Transit Plan
 CORRADINO 9. Downtown Transit Plan KAT Transit Development Plan As part of the planning process for the TDP, an examination of downtown transit operations was conducted. The Downtown Transit Plan 1 is
Craig Scheffler, P.E., PTOE HNTB North Carolina, P.C. HNTB Project File: Subject
 TECHNICAL MEMORANDUM To Kumar Neppalli Traffic Engineering Manager Town of Chapel Hill From Craig Scheffler, P.E., PTOE HNTB North Carolina, P.C. Cc HNTB Project File: 38435 Subject Obey Creek TIS 2022
East Stockton Boulevard (South Sacramento) Costco Gasoline Expansion Fuel Station Expansion Trip Generation Estimate
 Costco Gasoline Expansion Fuel Station Expansion Trip Generation Estimate") MEMORANDUM Date: February 7, 2013 Project #: 13270.0 To: From: Matt Cyr, Barghausen Consulting Engineers Sonia Hennum, PTOE & Alex Kiheri Project: Subject: cc: East Stockton Boulevard (South Sacramento)
MEMORANDUM Date: February 7, 2013 Project #: 13270.0 To: From: Matt Cyr, Barghausen Consulting Engineers Sonia Hennum, PTOE & Alex Kiheri Project: Subject: cc: East Stockton Boulevard (South Sacramento)
MINERVA PARK SITE TRAFFIC IMPACT STUDY M/I HOMES. September 2, 2015
 5500 New Albany Road Columbus, Ohio 43054 Phone: 614.775.4500 Fax: 614.775.4800 Toll Free: 1-888-775-EMHT emht.com 2015-1008 MINERVA PARK SITE TRAFFIC IMPACT STUDY M/I HOMES September 2, 2015 Engineers
Chicago Transit Authority Service Standards and Policies
 Chicago Transit Authority Service Standards and Policies Overview and Objectives The Chicago Transit Authority (CTA) has revised its Service Standards and Policies in accordance with Federal Transit Administration
Congestion Pricing for New York City
 Congestion Pricing for New York City Past (2007-08) Failure, Future (2014-15) Success? Presentation for International Forum on Economic Policies for Traffic Congestion and Tailpipe Emissions 12-13 December
West Hills Shopping Centre Lowe s Expansion Traffic Impact Study
 West Hills Shopping Centre Lowe s Expansion Traffic Impact Study Prepared for: Armel Corporation January 2015 Paradigm Transportation Solutions Ltd. 22 King Street South, Suite 300 Waterloo ON N2J 1N8
Whither the Dashing Commuter?
 Whither the Dashing Commuter? The MTA in a Changing Region William Wheeler Director of Special Project Development and Planning Travel in the New York Region has changed from the days of the 9 to 5 commute
Troost Corridor Transit Study
 Troost Corridor Transit Study May 23, 2007 Kansas City Area Transportation Authority Agenda Welcome Troost Corridor Planning Study Public participation What is MAX? Survey of Troost Riders Proposed Transit
Construction Realty Co.
 MEMORANDUM TO: FROM : Jeff Pickus Construction Realty Co. Luay R. Aboona, PE Principal 9575 West Higgins Road, Suite 400 Rosemont, Illinois 60018 p: 847-518-9990 f: 847-518-9987 DATE: May 22, 2014 SUBJECT:
TALMONT TOWNHOMES MADISON KENNETH SPA TRAFFIC IMPACT STUDY. Sacramento, CA. Prepared For: MBK Homes. Prepared By:
 TALMONT TOWNHOMES MADISON KENNETH SPA TRAFFIC IMPACT STUDY Sacramento, CA Prepared For: MBK Homes Prepared By: KD Anderson & Associates 3853 Taylor Road, Suite G Loomis, California 95650 (916) 660-1555
Traffic Impact Study. Eastern Springs. A Proposed Development in Manorville, NY. April Haas Group Inc Transportation Planners and Engineers
 Traffic Impact Study For Eastern Springs A Proposed Development in Manorville, NY April 2018 Haas Group Inc Transportation Planners and Engineers Table of Contents 1) Executive Summary... 2 2) Study Purpose...
RE: Taggart Retail Site Plan: Kanata West Proposal for Traffic Impact Study: Addendum #2
 1223 Michael Street, Suite 100, Ottawa, Ontario K1J 7T2 Tel: 613.738.4160 Fax: 613.739.7105 www.delcan.com July 9, 2014 OUR REF: TO3073TOK00 BY EMAIL: jparkes@taggart.ca/aturner@taggart.ca Taggart Commercial
MILLERSVILLE PARK TRAFFIC IMPACT ANALYSIS ANNE ARUNDEL COUNTY, MARYLAND
 MILLERSVILLE PARK TRAFFIC IMPACT ANALYSIS ANNE ARUNDEL COUNTY, MARYLAND Prepared for: Department of Public Works Anne Arundel County Prepared by: URS Corporation 4 North Park Drive, Suite 3 Hunt Valley,
Costco Gasoline Fuel Station Transportation Characteristics
 Exhibit A MEMORANDUM Date: May 23, 2013 Project #: I-10 To: Jennifer Murillo, Costco Wholesale Terry Odle, Mulvanny G2 Architecture From: Sonia Hennum, PTOE Project: Subject: Signal Hill Costco Gasoline
TRANSPORTATION STUDY FOR THE 8899 BEVERLY BOULEVARD PROJECT
 DRAFT TRANSPORTATION STUDY FOR THE 8899 BEVERLY BOULEVARD PROJECT WEST HOLLYWOOD, CALIFORNIA NOVEMBER 2013 PREPARED FOR BEVERLY BOULEVARD ASSOCIATION PREPARED BY DRAFT TRANSPORTATION STUDY FOR THE 8899
residents of data near walking. related to bicycling and Safety According available. available. 2.2 Land adopted by
 2. Assessment of Current Conditions and Needs In order to prepare a plan to reach the vision desired by the residents of Texarkana, it is first necessary to ascertain the current situation. Since there
Necessity or Choice?
 Necessity or Choice? Why People Drive in Manhattan Prepared for Transportation Alternatives February 2006 Schaller Consulting 94 Windsor Place, Brooklyn, NY (718) 768-3487 schaller@schallerconsult.com
Date: February 7, 2017 John Doyle, Z-Best Products Robert Del Rio. T.E. Z-Best Traffic Operations and Site Access Analysis
 Memorandum Date: February 7, 07 To: From: Subject: John Doyle, Z-Best Products Robert Del Rio. T.E. Z-Best Traffic Operations and Site Access Analysis Introduction Hexagon Transportation Consultants, Inc.
Address Land Use Approximate GSF
 M E M O R A N D U M To: Kara Brewton, From: Nelson\Nygaard Date: March 26, 2014 Subject: Brookline Place Shared Parking Analysis- Final Memo This memorandum presents a comparative analysis of expected
E-ZPass Vehicle Descriptions
 E-ZPass Vehicle Descriptions Class 1 vehicles - two axles, single rear wheels: E-ZPass off-peak toll shall be $7.50 effective September 18, 2011; $8.25 effective the first Sunday in December, 2012; $9.00
Chapter 9: Transportation (Rail Transit) D. RAIL TRANSIT
 D. RAIL TRANSIT") Chapter 9: Transportation (Rail Transit) D. RAIL TRANSIT EXISTING CONDITIONS The subway lines in the study area are shown in Figures 9D-1 through 9D-5. As shown, most of the lines either serve only portions
Chapter 9: Transportation (Rail Transit) D. RAIL TRANSIT EXISTING CONDITIONS The subway lines in the study area are shown in Figures 9D-1 through 9D-5. As shown, most of the lines either serve only portions
Why Regional Rail Should Be a Top Transportation Priority for New York City
 Why Regional Rail Should Be a Top Transportation Priority for New York City Prepared by: Institute for Rational Urban Mobility, Inc. George Haikalis, President www.irum.org Presentation for the Assn of
IRSCH REEN Hirsch/Green Transportation Consulting, Inc.
 IRSCH REEN Hirsch/Green Transportation Consulting, Inc. February 6, 2013 Mr. David Weil Director of Finance St. Matthew s Parish School 1031 Bienveneda Avenue Pacific Palisades, California 90272 RE: Trip
Appendix J Traffic Impact Study
 MRI May 2012 Appendix J Traffic Impact Study Level 2 Traffic Assessment Limited Impact Review Appendix J [This page was left blank intentionally.] www.sgm-inc.com Figure 1. Site Driveway and Trail Crossing
TRAFFIC IMPACT ANALYSIS FOR. McDONALD S RESTAURANT IN CARMICAEL Sacramento County, CA. Prepared For:
 TRAFFIC IMPACT ANALYSIS FOR McDONALD S RESTAURANT IN CARMICAEL Sacramento County, CA Prepared For: McDonald s USA, LLC Pacific Sierra Region 2999 Oak Road, Suite 900 Walnut Creek, CA 94597 Prepared By:
RE: A Traffic Impact Statement for a proposed development on Quinpool Road
 James J. Copeland, P.Eng. GRIFFIN transportation group inc. 30 Bonny View Drive Fall River, NS B2T 1R2 May 31, 2018 Ellen O Hara, P.Eng. Project Engineer DesignPoint Engineering & Surveying Ltd. 200 Waterfront
TRAFFIC SIGNAL DESIGN REPORT KING OF PRUSSIA ROAD & RAIDER ROAD RADNOR TOWNSHIP PENNSYLVANIA
 TRAFFIC SIGNAL DESIGN REPORT KING OF PRUSSIA ROAD & RAIDER ROAD RADNOR TOWNSHIP PENNSYLVANIA PREPARED FOR: UNIVERSITY OF PENNSYLVANIA HEALTH SYSTEM 34 CIVIC CENTER BOULEVARD PHILADELPHIA, PA 1987 (61)
COMPARATIVE SCREENING RESULTS REPORT
 Metro-North Penn Station Access Major Investment Study/Draft Environmental Impact Statement COMPARATIVE SCREENING RESULTS REPORT Prepared for Metro-North Railroad Prepared by Parsons Brinckerhoff Quade
2 EXISTING ROUTE STRUCTURE AND SERVICE LEVELS
 2 EXISTING ROUTE STRUCTURE AND SERVICE LEVELS In the Study Area, as in most of the Metro Transit network, there are two distinct route structures. The base service structure operates all day and the peak
Diablo Vista Pumping Plant Replacement
 Diablo Vista Pumping Plant Replacement Traffic Study PHA Transportation Consultants 12-05-359 October 2012 Diablo Vista Pumping Plant Replacement Traffic Study For EBMUD October 2012 PHA Transportation
Traffic Impact Analysis. Alliance Cole Avenue Residential Site Dallas, Texas. Kimley-Horn and Associates, Inc. Dallas, Texas.
 Traffic Impact Analysis Alliance Cole Avenue Residential Site Dallas, Texas February 15, 2018 Kimley-Horn and Associates, Inc. Dallas, Texas Project #064524900 Registered Firm F-928 Traffic Impact Analysis
Metra Milwaukee District West Line Transit-Friendly Development Plan
 Metra Milwaukee District West Line Transit-Friendly Development Plan Community Input Workshop April 6, 2011 Overview of Presentation Workshop Goals Study Context Existing Conditions Market Overview Employment
Trafalgar Road & Lower Base Line Transportation Study Ontario Inc.
 Trafalgar Road & Lower Base Line Transportation Study 1255723 Ontario Inc. Trafalgar Road & Lower Base Line Transportation Study 1255723 Ontario Inc. 1465 Pickering Parkway Suite 200 Pickering ON L1V 7G7
TRAFFIC PARKING ANALYSIS
 TRAFFIC PARKING ANALYSIS NAPA FLEA MARKET COUNTY OF NAPA Prepared for: Tom Harding Napa-Vallejo Flea Market 33 Kelly Road American Canyon, CA 9453 Prepared by: 166 Olympic Boulevard, Suite 21 Walnut Creek,
1. INTRODUCTION 2. PROJECT DESCRIPTION CUBES SELF-STORAGE MILL CREEK TRIP GENERATION COMPARISON
 CUBES SELF-STORAGE MILL CREEK TRIP GENERATION COMPARISON 1. INTRODUCTION This report summarizes traffic impacts of the proposed CUBES Self-Storage Mill Creek project in comparison to the traffic currently
5.9 TRANSPORTATION AND TRAFFIC
 5.9 TRANSPORTATION AND TRAFFIC This section evaluates transportation- and traffic-related impacts that have the potential to result from the construction and operation of the Project. Information and analysis
Mercer Island Center for the Arts Parking Management Plan
 Parking Stalls Mercer Island Center for the Arts Parking Management Plan June 15, 2016 This Parking Management Plan (P) covers all tenants at the Mercer Island Center for the Arts (MICA) campus, including
MTA Long Island Rail Road (LIRR) and MTA Metro-North Railroad (MNR) System-wide Service Standards
 and MTA Metro-North Railroad (MNR) System-wide Service Standards") MTA Long Island Rail Road (LIRR) and MTA (MNR) System-wide Service Standards The following system-wide service standards apply to LIRR and MNR operations. 1. Service Availability Service Availability is
MTA Long Island Rail Road (LIRR) and MTA (MNR) System-wide Service Standards The following system-wide service standards apply to LIRR and MNR operations. 1. Service Availability Service Availability is
Downtown Lee s Summit Parking Study
 Downtown Lee s Summit Parking Study As part of the Downtown Lee s Summit Master Plan, a downtown parking and traffic study was completed by TranSystems Corporation in November 2003. The parking analysis
ANDERSON PROPERTY SITE ANALYSIS
 ANDERSON PROPERTY SITE ANALYSIS Introduction The Montgomery County Department of Transportation (MCDOT) initiated a feasibility study in the fall of 2012 to evaluate the need for transit service expansion
TRANSPORTATION TECHNICAL REPORT
 TRANSPORTATION TECHNICAL REPORT for Sunrise Elementary School Replacement PREPARED FOR: Puyallup School District PREPARED BY: 6544 NE 61 st Street, Seattle, WA 98115 ph: (26) 523-3939 fx: (26) 523-4949
Fixing the Line s Canarsie Tunnel. Manhattan CB6 11/5/2018
 Fixing the Line s Canarsie Tunnel Manhattan CB6 11/5/2018 Interborough Bus Service 80+ buses in the peak hour in the peak direction over the Williamsburg Bridge Projected to carry 17% of riders 1 Bus Priority
Final. Traffic Impact Study For 1200 Ashby Avenue Mixed-Use Development. In City of Berkeley. November 26, TJKM Transportation Consultants
 TJKM Transportation Consultants Final Traffic Impact Study For 1200 Ashby Avenue Mixed-Use Development In City of Berkeley Pleasanton Fresno Sacramento Santa Rosa www.tjkm.com TJKM Transportation Consultants
Proposed location of Camp Parkway Commerce Center. Vicinity map of Camp Parkway Commerce Center Southampton County, VA
 Proposed location of Camp Parkway Commerce Center Vicinity map of Camp Parkway Commerce Center Southampton County, VA Camp Parkway Commerce Center is a proposed distribution and industrial center to be
Travel Time Savings Memorandum
 04-05-2018 TABLE OF CONTENTS 1 Background 3 Methodology 3 Inputs and Calculation 3 Assumptions 4 Light Rail Transit (LRT) Travel Times 5 Auto Travel Times 5 Bus Travel Times 6 Findings 7 Generalized Cost
TRAFFIC DATA. Existing Derousse Ave./River Rd. AM LOS Analysis Existing Derousse Ave./River Rd. PM LOS Analysis
 Appendix E NJ TRANSIT Pennsauken Junction Transit Center and Park & Ride RiverLINE and Atlantic City Line Pennsauken Township, Camden County, New Jersey TRAFFIC DATA Background Traffic Information for
APPENDIX B Traffic Analysis
 APPENDIX B Traffic Analysis Rim of the World Unified School District Reconfiguration Prepared for: Rim of the World School District 27315 North Bay Road, Blue Jay, CA 92317 Prepared by: 400 Oceangate,
NEWCASTLE MIDDLE SCHOOL Traffic Impact Analysis
 Gibson Traffic Consultants 2802 Wetmore Avenue Suite 220 Everett, WA 98201 425.339.8266 NEWCASTLE MIDDLE SCHOOL Traffic Impact Analysis Prepared for: Renton School District Jurisdiction: City of Newcastle
Appendix C. Traffic Study
 Appendix C Traffic Study TABLE OF CONTENTS SECTION Executive Summary PAGE 1.0 Introduction... 1 1.1 Scope of Work... 1 1.2 Study Area... 2 2.0 Project Description... 3 2.1 Site Access... 4 2.2 Pedestrian
Mineola Village Green
 Traffic Impact Analysis Report Mineola Village Green 199 2 nd Street Mineola, New York Prepared for Mineola Metro LLC c/o Lalezarian Properties 1999 Marcus Avenue, Suite 310 Lake Success, NY 11042 Prepared
EXECUTIVE SUMMARY. The valet operation, service area, and drop-off lanes provided will be adequate Page i
 EXECUTIVE SUMMARY MacKenzie Engineering and Planning, Inc. performed an analysis of the traffic impacts resulting from the proposed project site located at 25 SE 4th Avenue, Delray Beach, Florida (PCN
Planned Development Application 1450 Sherman Avenue Evanston, IL TRAFFIC CIRCULATION IMPACT STUDY
 Planned Development Application 1450 Sherman Avenue Evanston, IL 60201 14 TRAFFIC CIRCULATION IMPACT STUDY Traffic Impact Study 1454 Sherman Mixed-Use Development Evanston, Illinois Prepared for Prepared
1.0 INTRODUCTION Organization of this Report Study Area EXISTING CONDITIONS CTA Rail Forest Park Branch...
 Table of Contents 1.0 INTRODUCTION... 4 1.1 Organization of this Report... 4 1.2 Study Area... 4 2.0 EXISTING CONDITIONS... 5 2.1 CTA Rail Forest Park Branch... 5 3.0 SERVICE PATTERNS... 6 3.1 Car Requirements...
LAWRENCE TRANSIT CENTER LOCATION ANALYSIS 9 TH STREET & ROCKLEDGE ROAD / 21 ST STREET & IOWA STREET LAWRENCE, KANSAS
 LAWRENCE TRANSIT CENTER LOCATION ANALYSIS 9 TH STREET & ROCKLEDGE ROAD / 21 ST STREET & IOWA STREET LAWRENCE, KANSAS TRAFFIC IMPACT STUDY FEBRUARY 214 OA Project No. 213-542 TABLE OF CONTENTS 1. INTRODUCTION...
NICTI Alternatives Analysis
 EXECUTIVE SUMMARY Development of Detailed Alternatives Report Prepared for: Northern Illinois Commuter Transportation Initiative City of Rockford, Illinois Prepared by: 222 South Riverside Plaza, Suite
Draft Report: West Berkeley Bowl Project
 Draft Report: West Berkeley Bowl Project July 2004 Prepared for: The City of Berkeley 1031-1925 F EHR & PEERS TRANSPORTATION CONSULTANTS 3685 Mt. Diablo Blvd. #301 Lafayette, CA 94549 925-284-3200 Fax:
Working Paper ESTIMATION OF TIME AND OTHER BENEFITS FROM NINE PROPOSED TRANSIT CAPITAL PROJECTS IN NEW YORK CITY.
 Working Paper ESTIMATION OF TIME AND OTHER BENEFITS FROM NINE PROPOSED TRANSIT CAPITAL PROJECTS IN NEW YORK CITY DRAFT - June 2003 Prepared by Todd Goldman Project Team: Robert Paaswell Joseph Berechman