Overview of the Global Fuel Economy Initiative. Jane Akumu UN Environment
|
|
|
- Jason Stone
- 6 years ago
- Views:
Transcription


1 Overview of the Global Fuel Economy Initiative Jane Akumu UN Environment

")

 Electric")

")

2 UN Environment Transport Programmes Share the Road (StR) Global Fuel Economy Initiative (GFEI) Electric Mobility Partnership for Clean Fuels and Vehicles (PCFV) Climate and Clean Air Coalition (CCAC) Heavy Duty Diesel Initiative

3 Vehicle fleet to triple (from ~1 billion to ~3 billon 2050) 90%+ of growth in non- OECD countries Few non-oecd countries have FE policies Source: Mike Walsh

4 Passenger cars per 1000 persons 350 Motorization in Africa

5 Impact of Transport Air Quality & Health Largest source of air pollution in cities, exceeding WHO standards and costing more than 5% GDP Energy Security Consumes 25% of world energy, 90% are fossil fuels Climate Change Responsible for 23% global CO2 emissions & fastest growing sector in GHG emissions, 2.5% yearly until 2020


6 CO2 Emissions from Transport
 o Km per litre (Japan) o Miles per gallon (United States) Fuel economy, fuel consumption, fuel")
7 What is fuel economy? Fuel economy measures energy per unit of vehicle travel o Litres per 100km (Europe) o Km per litre (Japan) o Miles per gallon (United States) Fuel economy, fuel consumption, fuel efficiency, fuel intensity are all fairly interchangeable terms. Also measured in CO 2 emissions o CO2 g/km Look for the tested fuel economy number for the vehicle
8 Source: Stuart Rayner, NAAMSA

9 Partners: Donors:

10 GFEI Benefits Fuel savings: estimated at over USD 300 billion in 2025 and 600 billion in 2050 CO2 reduction: estimated at over 1 gigatonne a year by 2025 and over 2 gigatonnes by 2050 Partners: Reduced urban air pollution Donors:
 230 Government Automakers 8 Others 220 Fuel/Energy Suppliers Consumers 210 1990 91 92 93 94 95 96 97 98 99 2000 01 02 03 04 05 06 07 08 09 Year source :")
11 CO2 emissions (million tons) CO 2 Emission Reduction in Japanese Transportation Sector Fuel Economy 270 Traffic Flow Eco-Driving Alternative Fuels Integrated Approach 18 Travel Distance (modal shifts, etc) 230 Government Automakers 8 Others 220 Fuel/Energy Suppliers Consumers Year source : JAMA


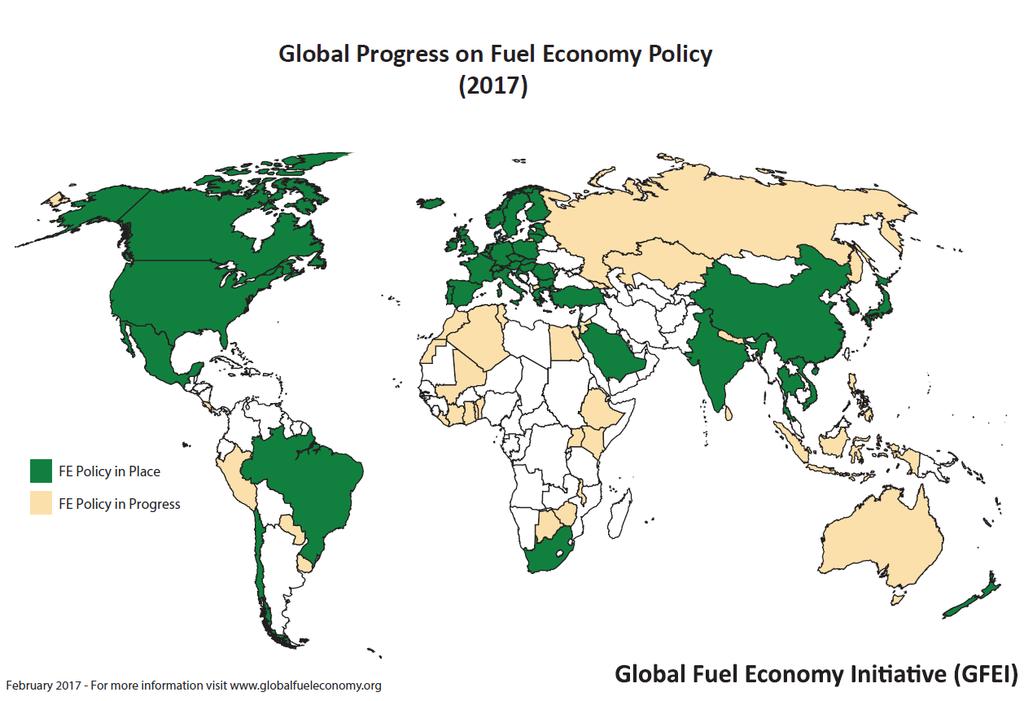
12 Regional fuel economy trends Countries with FE policies in place show encouraging improvement rates Size shift vs. technology evolution moderates non-oecd improvement Source: IEA 2014
13 GFEI Country Engagement countries with ongoing projects new countries 2016/2017 Countries expressed interest 1 Chile 28Malaysia 63Panama 2 Ethiopia 29Bangladesh 64Iran 3 Indonesia 30Kazakhstan 65Angola 4 Kenya 31Mali 66Bhutan 5 Georgia 32Nigeria 67Burkina Faso 6 Ivory Coast 33Togo 68Burundi 7 Mauritius 34Tanzania 69Cambodia 8 Jamaica 35Rwanda 70Cameroon 9 Montenegro 36Bolivia 71Cape Verde 10 Macedonia 37Argentina 72D.R. Congo 11 Costa Rica 38Ecuador 73Eritrea 12 Vietnam 39Ukraine 74Fiji 13 Morocco 40Jordan 75Guinea 14 Bahrain 41Colombia 76Iran 15 Tunisia 42Djibouti 77Kyrgyzstan 16 Thailand 43Dominican Republic 78Laos 17 Peru 44Guatemala 79Lesotho 18 Russia 45Moldova 80Marshall Islands 19 Benin 46Pakistan 81Mongolia 20 Algeria 47Barbados 82Namibia 21 Uruguay 50St. Lucia 83Niger 22 Nepal 51Lebanon 84Papua New Guinea 23 Paraguay 52Zambia 85Senegal 24 Sri Lanka 53Ghana 86Sierra Leone 25 Philippines 54Malawi 87Solomon Islands 26 Uganda 55Zimbabwe 88South Africa 27 Egypt 56Honduras 89Tajikistan 57Nicaragua 90Turkmenistan 58El Salvador 91Turkey 59Botswana 92Armenia 60Mozambique 93Azerbaijan 61Myanmar 62Liberia 94Serbia 95Samoa 96Gambia 97Uzbekistan 98Bosnia-Herzegovina 99Albania
14

15 Importance of GFEI for Africa Why GFEI is important to African countries The project provides a good understanding of vehicles imported into the country e.g. models, sizes, technologies This will allow policy makers to choose the right combination of policy instruments to meet o national emission targets o energy security, and o efficiency goals


16 Vehicle Type Model Manufacturer Body type Simplified Body Type Segment Axle configuration Driven wheels Engine cylinders Engine ccm CC Category Engine kw KW class Engine horse power Engine valves Fuel type Model year Number of gears Transmission type Turbo Gross vehicle weight Height Length Number of seats GFEI Activities Information Campaigns Data Collection & Analysis GFEI Outreach to Stakeholders Support Policy Making Efforts
 o Baseline Setting - 2005")

17 Fuel Economy Estimation Data collection of light duty vehicle fleet (new and used imported vehicles < 3,500kgs) o Baseline Setting o Analysis of Trend (2010, 2013, 2016) Review of o Vehicle regulations o Fiscal incentives o Fuel standards Policy Options National Consultations
18 Minimum vehicle information required Vehicle make and model Model production year Year of first registration Fuel type (petrol or diesel) Engine size Domestically produced or imported New or second hand import Rated Fuel Economy per model and test cycle basis Number of sales by model
19 Additional information Vehicle Information / Identification Number Injection system type Body type Transmission type and other vehicle configuration details, as available Vehicle foot print Vehicle curb weight Emissions certification level Use of vehicle (private, public, for hire, etc.)
20 Estimating average fuel economy Look for the tested fuel economy number for the vehicle If not available the fuel economy figures for a given make, model and year can usually be retrieved from the vehicle manufacturers GFEI partners are compiling a list of fuel economies into a common database for use by countries undertaking baseline-setting exercise For the sake of comparison, all drive cycle data obtained be converted to the NEDC cycle Conversion factors can be downloadable from ICCT website tor.xlsx
21 Final Data Make Model Condition Body Type Engine CC Fuel Type Model Year Registration Date L/100km CO2 BMW 316I Used S.WAGON 1596 Petrol CHEVROLET OPTRA Used SALOON 1799 Petrol CHEVROLET NULL Used S.WAGON 1799 Petrol NISSAN SUNNY Not Specified SALOON 1970 Diesel MITSUBISHI LANCER Used SALOON 1600 Diesel SKODA OCTAVIA Used SALOON 1800 Diesel SKODA OCTAVIA Used SALOON 1800 Diesel TOYOTA COROLLA New S.WAGON 1970 Diesel TOYOTA COROLLA New SALOON 2000 Diesel FORD RANGER New VAN 2500 Petrol HONDA CR-V NULL S.WAGON 1970 Petrol
22 Average fuel economy At the simplest level, taking a weighted average (by sales) of all new (including newly imported second hand) vehicles in the database will provide the average fuel economy of new vehicles sold in the country in the given year: In a similar way, average CO 2 intensity can be obtained through weighted average with the sales of each model:
23 Additional information Examples of useful Websites on fuel economy include: and A Test Cycle Conversion Tool: A global comparison of Vehicle Fuel Economy Standards: South African Comparative Passenger Car Fuel Economy AND CO2 Emissions Data: UNEP Vehicle Fuel Efficiency Baselines: Practicalities and Results - Global Fuel Economy Initiative in Africa, Working Session, November Summary and Country Case Study Presentations: U.S. Light-Duty Automotive Technology, Carbon Dioxide Emissions, and Fuel Economy Trends (1975 through 2010): U.S. Fuel Economy Policy: U.S. Fuel Economy Regulations: U.S. Auto Fuel Economy Database:
24 Example of final data: Kenya Fuel Economy Year Average fuel consumption metric combined (L/100km) Average CO 2 emission (g/km) Grand Average Year of vehicle registration Fuel Type Diesel Petrol Grand Average Grand Average Year of vehicle New Used Grand Average Registration Grand Total
25 Fuel Economy Levels Global Average (l/100km) OECD Average Non-OECD Average Uganda Average (l/100km) Kenya Mauritius Average (l/100km) Average (l/100km) Algeria Average (l/100km) Ethiopia Average (l/100km)

 10.94 11.")
26 Example of Uganda Uganda Average (l/100km)
27 Fuel economy policies & instruments Target group: Consumer Monetary Fiscal instruments FE Consumer information Labelling Regulatory Fuel economy or CO 2 emission standards Manufacturer

28 European Union 12% of total CO 2 emissions from transport average for all new cars is 130 grams of CO2 per kilometre (g/km) by 2015 and 95g/km by 2021 reductions of 18% and 40% compared to g/km 2015 fuel consumption target 5.6 l/100 km of petrol 4.9 l/100 km of diesel 2021 target 4.1 l/100 km of petrol 3.6 l/100 km of diesel

29 China s Example China introduced Fuel Economy Standards for LDV in September 2004: phase 1 from July 2005 and 2 phase from Jan 2008 Phase 1 increased the overall passenger vehicle fuel efficiency by 9%, and saved 575,000 tonnes of oil and 1.7 million tones of CO2 emissions between 2002 and 2006 Chinese FES is the 3rd most stringent in the world, behind the EU and Japan, reduction of average fuel consumption (litre/100km) of LDV by 11.5%

30 South Africa CO2 Taxation implemented March 2011 The rate of emissions tax on passenger vehicles is R100 per gram CO2 emissions in excess of 120 g/km based on test reports The rate of emissions tax on double cabs is R100 per gram CO2 emissions in excess of 175 g/km based on test reports Vehicle labeling mandatory
31 Mauritius Adopted a feebate scheme in 2011 at 158 CO2g/km 2013 amended to 150 CO2g/km Fuel economy improved from 7l/100km in 2005 to 5.8l/100km in % excise duty waived on electric and hybrid cars and registration fee 2009 to 2014, hybrid increased from 43 to 1824 and electric cars from 0 to replace by a taxation system with additional incentives to electric vehicles Type Current New Conventional Up to 550 cc 15% cc 55% 45% cc 55% 50% cc 75% No change Above 2,000 cc 100% No change Hybrid Up to 1600 cc 55% 25% cc 75% 45% Above 2000 cc 100% 70% Electric cars Up to 180 Kw 25% 0 Above 180 Kw 25% No change

32 Labeling and CO 2 -based Tax in Thailand Excise tax combines CO2 ratings/engine capacity/fuel type Mandatory eco-sticker Types of Vehicles Passenger vehicles cars and vans with less than 10 seats ~~~~~~ Electric vehicle/ fuel cell CO2/ engine capacity Fuel type / Tax rates E10/ E20 E85/ NGV 100 g/km g/km g/km >200 g/km >3,000 cc ,000 cc (180 Kw) > 3,000 cc (180 Kw) Hybrid Vehicl 32 e Source: Energy Policy and Planning Office and Department of Alternative Energy Development, 2015
33 Hybrid and Electric cars in Sri Lanka Hybrid and electric cars in 2014 was 56% of the total number of cars Hybrid-petrol, petrol and diesel vehicles attract 58%, 253% and 345%, respectively, in excise tax Fully electric vehicles are levied at 25%.

34
35
36 Summary High growth rate of passenger car sales (and other vehicles) with relatively high fuel economy will persist without fuel economy policies Implementing fuel economy policies can substantially reduce CO2 emissions supporting the Paris Agreement Also reduces fossil fuel consumption and national expenditures on fossil fuels Improves air quality through adoption of more advanced vehicles and technologies

37 Air Quality and Mobility Unit Economy Division United Nations Environment Nairobi, Kenya Jane.Akumu@unenvironment.org
Global Trends toward Cleaner Fuels and Fuel Efficient Vehicles
 Global Trends toward Cleaner Fuels and Fuel Efficient Vehicles Jane Akumu UN Environment Malawi, 11 December 2017 Impact of Transport Air Quality & Health Largest source of air pollution in cities, exceeding
The Global Fuel Economy Initiative. Jane Akumu UN Environment
 The Global Fuel Economy Initiative Jane Akumu UN Environment Historical High Growth Has Made Vehicles An Important Contributor To Local, Regional and Global Pollution Vehicle fleet to triple (from ~1 billion
An overview of International Policies on Vehicle Fuel Economy. Jane Akumu UN Environment
 An overview of International Policies on Vehicle Fuel Economy Jane Akumu UN Environment Fuel economy policies & instruments Target group: Consumer Monetary Fiscal instruments FE Consumer information Labelling
Energy for safe, affordable, accessible and sustainable transport systems for all
 Energy for safe, affordable, accessible and sustainable transport systems for all Sheila Watson Executive Secretary, Global Fuel Economy Initiative (GFEI) Trondheim, Oct 16 th 2017 CATALYTIC PARTNERSHIPS:
GLOBAL ECONOMIC PROSPECTS January Statistical Annex
 1 TABLE A.1 GDP Growth (Constant 2010 U.S. Dollars) Annual estimates and forecasts a Quarterly growth b 2013 2014 00-10 c 2011 2012 2013 2014e 2015f 2016f 2017f Q1 Q2 Q3 Q4 Q1 Q2 Q3 World 2.8 3.1 2.4 2.5
Auto Fuel Economy Policy: An Opportunity to Choose Clean Mobility
 Auto Fuel Economy Policy: An Opportunity to Choose Clean Mobility Air Quality & Mobility Unit March 2018 Technology Choosers vs. Technology Takers Global Fuel Economy Initiative Auto fuel economy: rate
Promoting Electric Mobility in Low and Middle Income Countries
 Promoting Electric Mobility in Low and Middle Income Countries David Rubia Programme Officer, Transport Unit, UN Environment 17 th IUAPPA World Clean Air Congress & 9th CAA Better Air Quality Conference
C H AP TE R 1 G LO BAL EC O NO MIC P ROS P EC TS J U NE 2017
 4 C H AP TE R 1 G LO BAL EC O NO MIC P ROS P EC TS J U NE 2017 TABLE 1.1 Real GDP 1 (percent change from previous year) 2014 2015 2016 2017 2018 2019 2016 2017 2018 2019 Percentage point differences Estimates
Improving Fuel Economy in Southeast Asia
 Improving Fuel Economy in Southeast Asia Bert Fabian, Programme Officer, Transport Unit, UN Environment 29 March 2017, Bangkok, Thailand UN Environment Promoting Sustainable Low Emissions Transport Avoid
Summary of Contributions to UN Peacekeeping by Country and Post.
 Summary of Contributions to UN Peacekeeping by Country and Post. Police,UN Military, s and Troops 31/07/2018 1 Country Name POST MALE FEMALE TOTAL Algeria 2 3 4 5 6 7 Argentina Armenia Australia Austria
LPI ranking and scores, 2014
 ing and scores, 2014 Germany 1 4.12 100.0 Netherlands 2 4.05 97.6 Belgium 3 4.04 97.5 United Kingdom 4 4.01 96.6 Singapore 5 4.00 96.2 Sweden 6 3.96 94.9 Norway 7 3.96 94.8 Luxembourg 8 3.95 94.4 United
Green: 348. Yellow/Orange: Yellow/Orange: Green: 348. Yellow/Orange: Green: 348. Yellow/Orange:137 Bronze: 145
 Afghanistan 348 Albania 186 Algeria 348 Andorra 286 348 137 Bronze: 145 Angola 137 Antigua and Barbuda 314 137 Argentina 279 137 Armenia 286 165 186 Australia 2768 Austria Azerbaijan Warm red 485 282 348
Global Competitiveness Index Rankings
 APPENDIX B Global Competitiveness Index 2017 2018 Rankings The following pages report the GCI 2017 2018 rankings for the three subindexes (Table 1) and their corresponding pillars (Tables 2 4). Detailed
Fiche 1 Quelques données de la Banque Mondiale
 Fiche 1 Quelques données de la Banque Mondiale 274 WORLD DEVELOPMENT REPORT 2000 2001 Table 1. Size of the economy Surface Population area density Gross national product (GNP) GNP per capita GNP measured
Country Risk Scores Table Results
 s Table - 2014 Results Afghanistan 73 73 53 71 70 49 48 50 59 54 63 75 54 89 4.7 Albania 60 67 59 73 50 32 39 26 35 47 32 43 46 32 8.8 Algeria 79 82 88 67 63 30 39 24 79 81 74 49 51 38 10.0 Andorra 47
Global and Regional Tables
 Global and Regional Tables Freedom of the Press 2006 1 Finland 9 F Iceland 9 F 3 Denmark 10 F Norway 10 F Sweden 10 F 6 Belgium 11 F Luxembourg 11 F Netherlands 11 F Switzerland 11 F 10 Liechtenstein 13
5.01 Secondary education enrollment rate
 5.01 Secondary education enrollment rate Gross secondary education enrollment rate 2011 or most recent year available RANK COUNTRY/ECONOMY Value 1 Australia 8...131.3 2 Spain...128.5 3 Seychelles...123.9
Summary of debt securities outstanding
 Summary of debt securities outstanding All countries........................ 22,695 15,852 6,665 3,427 1,762 Developed countries........................ 16,504 13,087 5,869 2,716 701 Austria 510 173 44
9.01 ICT use for business-to-business transactions
 9.01 ICT use for business-to-business transactions To what extent do businesses in your country use ICTs for communicating and carrying out transactions with other businesses? [1 = not at all; 7 = extensively]
Figure Geographic distribution Change in country participation in international nongovernmental organizations (NGOs): 1992 and 2002
: 1992 and 2002") Figure 2.2.3. Geographic distribution Change in country participation in international nongovernmental s (NGOs): 1992 and 2002 This table gives the and (international NGOs of types A to F) for a given
Figure 2.2.3. Geographic distribution Change in country participation in international nongovernmental s (NGOs): 1992 and 2002 This table gives the and (international NGOs of types A to F) for a given
International Sugar Organization WORLD SUGAR BALANCES 2002/ /16
 International Sugar Organization WORLD SUGAR BALANCES 2002/2003-2015/16 FEBRUARY 2016 WORLD SUGAR BALANCES (October/September) in thousand tonnes, tel quel Production 166,833 171,180 171,386 172,029 164,629
Section III Macroeconomic environment
 Data Tables Section III Macroeconomic environment 2.2: Data Tables Section III: Macroeconomic environment 422 3.01 Government budget balance General government budget balance as a percentage of GDP 2010
TABLE 1 WHO ASSESSED CONTRIBUTIONS: MEMBERS WITH NO CHANGE IN CONTRIBUTION
 :25/'+($/7+25*$1,=$7,21 (;(&87,9(%2$5' WK6HVVLRQ 3URYLVLRQDODJHQGDLWHP (%,1)'2& 'HFHPEUH $VVHVVPHQWVIRU 1. Document EB109/21 includes as an Annex a table indicating for each Member and Associate Member
Improving fuel economy and integrating electric vehicles
 Improving fuel economy and integrating electric vehicles Air Quality & Mobility Unit March 2018 Global Fuel Economy Initiative Doubling LDV Fuel Efficiency Worldwide by 2050 Slowing improvement in OECD
2.01 Availability of latest technologies
 2.01 Availability of latest technologies To what extent are the latest technologies available in your country? [1 = not available; 7 = widely available] 2010 2011 weighted average RANK COUNTRY/ECONOMY
STATES ELIGIBLE FOR ELECTION
 ANNEX STATES ELIGIBLE FOR ELECTION List No. 1 States Eligible for Election as Members of the Executive Committee of the Paris Union (that is, States members of the Assembly of the Paris Union) (175) 1
Table 19 Production, trade and supply of other kerosene Thousand metric tons and kilograms per capita
 Table Notes Production includes output from refineries and plants. For China, data include kerosene-type jet fuel. Please refer to the Definitions Section on pages ix to xv for the appropriate product
The Great Transition: Shifting from Fossil Fuels to Solar and Wind Energy Supporting Data - Hydropower
 The Great Transition: Shifting from Fossil Fuels to Solar and Wind Energy Supporting Data - Hydropower World Installed Hydroelectric Generating Capacity, 1980-2013 GRAPH: World Installed Hydroelectric
FCCC/SBI/2016/INF.15. United Nations. Revised indicative contributions for the biennium
 United Nations FCCC/SBI//INF.15 Distr.: General 20 September English only Subsidiary Body for Implementation Forty fifth session Marrakech, 7 14 November Item 17(a) of the provisional agenda Administrative,
Table 19 Production, trade and supply of other kerosene Thousand metric tons and kilograms per capita
 Table 19 Production, trade and supply of other kerosene Table Notes Production includes output from refineries and plants. For China, data up to 2013 include kerosenetype jet fuel. Please refer to the
2014/ /2015 Ghana / /2015 Syrian Arab Republic / /2015
 Exhibit C: international cotton trade data Source: International Cotton Advisory Committee, ICAC World Cotton Database, available at www.icac.org, last checked 1 April 2016. International Cotton Advisory
Global Fuel Economy Initiative Achievements and Impacts. Kamala Ernest Programme Officer United Nations Environment Programme
 Global Fuel Economy Initiative Achievements and Impacts Kamala Ernest Programme Officer United Nations Environment Programme Doubling the efficiency of the global fleet by 2050 2005 2008 2011 2013 2030
From Wikipedia, the free encyclopedia
 1 of 6 14/09/2011 22:38 From Wikipedia, the free encyclopedia This is a list of countries by natural gas exports mostly based on The World Factbook [1] (https://www.cia.gov/library/publications/the-world-factbook/rankorder/2183rank.html).
Part III STATISTICAL ANNEX
 Part III STATISTICAL ANNEX STATISTICAL ANNEX 125 TABLE A1 Production of livestock products, 1995 2007 Meat Milk Eggs (Thousand tonnes) (Annual % (Thousand tonnes) (Annual % (Thousand tonnes) (Annual %
UNITED NATIONS EDUCATIONAL, SCIENTIFIC AND CULTURAL ORGANIZATION EXECUTIVE BOARD. Hundred and sixty-fourth Session
 164 EX/INF.7 PARIS, 14 May 2002 English & French only UNITED NATIONS EDUCATIONAL, SCIENTIFIC AND CULTURAL ORGANIZATION EXECUTIVE BOARD Hundred and sixty-fourth Session Item 3.1.1 of the provisional agenda
Lower bound. Upper bound. Lower bound. Afghanistan
 EMBARGOED UNTIL 00:01 GMT 18 September 2018 Under-five () with 90 per cent uncertainty interval () (per cent) under-five with 90 per cent uncertainty interval Afghanistan 175 160 192 68 52 85 3.5 2.6 4.5
International Investment Position: World and Regional Tables
 BOPCOM/08/18 Twenty-First Meeting of the IMF Committee on Balance of Payments Statistics Washington, D.C., November 4 7, 2008 International Investment Position: World and Regional Tables Prepared by the
Table 6A: External positions of reporting banks vis-à-vis all sectors
 Table 6A: External positions of reporting banks vis-à-vis all sectors Vis-à-vis individual countries in millions of US dollars All countries 29,841,389 29,212,683 28,267,608 28,518,559 75,538 1,110,929
Table 6A: External positions of reporting banks vis-à-vis all sectors
 Table 6A: External positions of reporting banks vis-à-vis all sectors Vis-à-vis individual countries in millions of US dollars All countries 29,227,490 29,015,072 28,531,726 28,040,625 1,147,749 1,456,989
Table 5 Production, trade and supply of hard coal Thousand metric tons and kilograms per capita
 Table Notes Production includes production from other sources as defined in the previous table. Data for China include brown coal. Please refer to the Definitions Section on pages ix to xv for the appropriate
Table 7B: External loans and deposits of reporting banks vis-à-vis the non-bank sector
 Table 7B: External loans and deposits of reporting banks vis-à-vis the non-bank sector Vis-à-vis individual countries in millions of US dollars All countries 6,618,147 6,859,916 6,854,545 6,829,602 92,045
Table 7B: External loans and deposits of reporting banks vis-à-vis the non-bank sector
 Table 7B: External loans and deposits of reporting banks vis-à-vis the non-bank sector Vis-à-vis individual countries in millions of US dollars All countries 6,871,257 7,040,175 6,972,597 6,946,298 71,425
REGIOGRAPH SOFTWARE AVAILABLE VERSIONS UPDATE AND UPGRADE PRICE ONGOING SAVINGS OF 50%! PRICE LIST
 PRICE LIST REGIOGRAPH SOFTWARE RegioGraph allows you to visualize and evaluate your company data directly on digital maps. This provides insight into data trends and relationships and lends objectivity
SOFTWARE REGIOGRAPH ANALYSIS PLANNING STRATEGY
 SOFTWARE REGIOGRAPH RegioGraph allows you to quickly and easily display your company data on digital maps. In combination with purchasing power data, this reveals trends and relationships that would not
SOFTWARE REGIOGRAPH ANALYSIS PLANNING STRATEGY
 SOFTWARE REGIOGRAPH RegioGraph allows you to quickly and easily display your company data on digital maps. In combination with purchasing power data, this reveals trends and relationships that would not
Table 5 Production, trade and supply of hard coal Thousand metric tons and kilograms per capita
 Table Notes Production includes production from other sources as defined in the previous table. Data for China include brown coal. Please refer to the Definitions Section on pages ix to xv for the appropriate
Technical Cooperation Report for 2016
 Technical Cooperation Report for 2016 Report by the Director General Supplement International Atomic Energy Agency Vienna International Centre, PO Box 100 1400 Vienna, Austria Tel.: (+43-1) 2600-0 Fax:
Table 20 Production, trade and supply of jet fuels Thousand metric tons and kilograms per capita
 Table 20 Production, trade and supply of jet fuels Table Notes Data refer to aviation gasoline, gasoline-type jet fuel and kerosene-type jet fuel. Production includes output from refineries and plants.
Governance Indicators World Map: Voice & Accountability
 Governance Indicators: Voice & Accountability (VA), Political Stability (PS), Government Effectiveness (GE), Regulatory Quality (RQ), Rule of Law (RL), Control of Corruption (CC) Percentile Ranks, 2004
A. Assessment of Member States under General Assembly resolution 71/268
 United Nations Secretariat Distr.: General 9 January 2017 Original: English Assessment of Member States contributions for the financing of the International Tribunal for the Prosecution of Persons Responsible
Table 9A: Consolidated claims of reporting banks - immediate borrower basis
 Table 9A: Consolidated claims of reporting banks - immediate borrower basis On individual countries by maturity and sector / Amounts outstanding In millions of US dollars Total Consolidated cross-border
Table A1. Summary of World Output1
 Output: Summary Table A1. Summary of World Output 1 (Annual percent change) 1991 2000 2001 2002 2003 2004 2005 2006 2007 2008 2009 2010 2014 World 3.1 2.2 2.8 3.6 4.9 4.5 5.1 5.2 3.2 1.3 1.9 4.8 Advanced
Hotel Price Indicatice max. as from 22 Nov International per diem TOWNS/ DESTINATION COUNTRY
 Appendix 1: VLIR-UOS hotel allowances and international amounts valid from 22 Nov, 2017, onwards COUNTRY Afghanistan all destinations 180 72 Albania all destinations 175 96 Algeria all destinations 219
Country Rate Country Rate Country Rate
 Afghanistan $1.080 Alaska $0.099 Albania $0.259 Algeria $0.269 American Samoa $0.139 American Samoa (Mobile) $0.209 Andorra $0.089 Andorra (Mobile) $0.319 Angola $0.349 Angola (Mobile) $0.569 Anguilla
List of Tables. Output. Infl ation. Financial Policies. Foreign Trade. Current Account Transactions. Balance of Payments and External Financing
 STATISTICAL APPENDIX List of Tables Output A1. Summary of World Output 241 A2. Advanced Economies: Real GDP and Total Domestic Demand 242 A3. Advanced Economies: Components of Real GDP 243 A4. Emerging
Technical Cooperation Report for 2012
 Technical Cooperation Report for 2012 Report by the Director General Supplement @ GC(57)/INF/4/SUPPLEMENT TECHNICAL COOPERATION REPORT FOR 2012 REPORT BY THE DIRECTOR GENERAL Printed by the International
Demographic and Socioeconomic Statistics
 Demographic and Socioeconomic Statistics Country WHO region number Population a annual growth rate in urban areas Total fertility rate a Adolescent fertility proportion b (000) 1995 (per woman) Year 1
Percentage and total number of foreign national prisoners worldwide
 Percentage and total number of foreign national prisoners worldwide Source: World Prison Brief (International Centre for Prison Studies www.prisonstudies.org) 1 Country % Total 2003 FNP 2003 % Total 2005
Foreign Country per diem and accommodation costs (valid as of January 1, 2016)
") Foreign Country per diem and accommodation costs (valid as of January 1, 2016) Country Town per diem in Accommodation costs up to... with proof*) Afghanistan 25 95 Albania 24 90 Algeria 32 190 Andorra
Foreign Country per diem and accommodation costs (valid as of January 1, 2016) Country Town per diem in Accommodation costs up to... with proof*) Afghanistan 25 95 Albania 24 90 Algeria 32 190 Andorra
Microsoft Social Engagement Translation Guide Last Updated: October 2017
 Microsoft Social Engagement Translation Guide Last Updated: October 2017 Microsoft Social Engagement is translated and supported by Microsoft and made generally available in the countries/regions and languages
Technical Cooperation Report for 2015
 Technical Cooperation Report for 2015 Report by the Director General Supplement GC(60)/INF/4/SUPPLEMENT TECHNICAL COOPERATION REPORT FOR 2015 REPORT BY THE DIRECTOR GENERAL Printed by the International
SAVER PLAN Standard Rate Table Service Description Rate AUD$ (per minute) Flagfall Other Charges
 Flagfall Other Charges") SAVER PLAN Standard Rate Table Service Description Voicemail Retrieval (121, 1211, 1212, 1213, 1218, 1219) Call Forward Hello Mobile Customer Care via 126 999 Hello Mobile Customer Care via 1300 126 999
SAVER PLAN Standard Rate Table Service Description Voicemail Retrieval (121, 1211, 1212, 1213, 1218, 1219) Call Forward Hello Mobile Customer Care via 126 999 Hello Mobile Customer Care via 1300 126 999
Table 2. Freshwater Withdrawal by Country and Sector. Description
 Table 2. Freshwater Withdrawal by Country and Sector Description The use of water varies greatly from country to country and from region to region. Data on water use by regions and by different economic
A5. Summary of Inflation 197 A6. Advanced Economies: Consumer Prices 198 A7. Emerging Market and Developing Economies: Consumer Prices 199
 Statistical Appendix List of Tables Output A1. Summary of World Output 190 A2. Advanced Economies: Real GDP and Total Domestic Demand 191 A3. Advanced Economies: Components of Real GDP 192 A4. Emerging
Total fleet. Oil tankers
 184 as at 1 January 2011 (in thousands of dwt) DEVELOPING ECONOMIES OF AFRICA Algeria 809 30 204 66 0 509 Angola 58 10 0 14 0 34 Benin 0 0 0 0 0 0 Cameroon 10 0 0 4 0 6 Cape Verde 22 5 0 12 0 6 Comoros
Net Migration Rate per 1,000 Population. Rate of Natural Increase (%)
") mid-2009 Births per POPULATION, HEALTH, AND ENVIRONMENT DATA AND ESTIMATES Deaths per Rate of Natural Increase Net Migration Rate per 2025 2050 Change 2009 2050 Infant Mortality Rate a Percent of Total
mid-2009 Births per POPULATION, HEALTH, AND ENVIRONMENT DATA AND ESTIMATES Deaths per Rate of Natural Increase Net Migration Rate per 2025 2050 Change 2009 2050 Infant Mortality Rate a Percent of Total
The African Medical Market Fact Book 2012
 The African Medical Market Fact Book 2012 World Leaders in Health Industry Analysis February 2012 blank text ISBN: 972 1 85822 439 8 Copyright 2012 Espicom Business Intelligence Publications Limited All
Table 13 Production, trade and supply of conventional crude oil Thousand metric tons; kilograms per capita; reserves production ratio (R/P) in years
 in years") Million metric tons Million metric tons Table 13, trade and supply of conventional crude oil Thousand metric tons; kilograms per capita; reserves production ratio (R/P) in years Table Notes The Reserves
Million metric tons Million metric tons Table 13, trade and supply of conventional crude oil Thousand metric tons; kilograms per capita; reserves production ratio (R/P) in years Table Notes The Reserves
Table 13 Production, trade and supply of conventional crude oil Thousand metric tons; kilograms per capita; reserves production ratio (R/P) in years
 in years") , trade and supply of conventional crude oil Thousand metric tons; kilograms per capita; reserves production ratio (R/P) in years Table Notes The Reserves / ratio refers to crude oil and natural gas liquids.
, trade and supply of conventional crude oil Thousand metric tons; kilograms per capita; reserves production ratio (R/P) in years Table Notes The Reserves / ratio refers to crude oil and natural gas liquids.
Effective October 1, 2006, Sprint Global Savings will no longer be available to new customers.
 Sprint Global Savings International Calling Plan Dial-1 ute International for Calls Made from 1 Effective October 1, 2006, Sprint Global Savings will no longer be available to new customers. Some calls
PwC Belgium Daily lump-sum allowances list for traveling abroad please visit for more information
 allowances list for traveling abroad Allowances given by an employer to his employee to cover foreign business travel expenses are costs proper to the employer. These allowances are tax exempt for the
APPENDIX B KEY ASPECTS OF LONG-TERM FINANCE
 GLOBAL FINANCIAL DEVELOPMENT REPORT 2015/2016 APPENDIX B 165 APPENDIX B KEY ASPECTS OF LONG-TERM FINANCE Economies and Their Maturity Structure of Finance, 2013 GDP at Afghanistan 8.9 8.2 0.7 0.00 Albania
Doing business in a more transparent world
 2012 Doing business in a more transparent world COMPARING REGULATION FOR DOMESTIC FIRMS IN 183 ECONOMIES ii DOING BUSINESS 2012 THE DOING BUSINESS WEBSITE Current features News on the Doing Business project
Calls made to a mobile phone may be charged a per minute International Mobile Termination Surcharge, see Sprint Wireline Fees and Surcharges Matrix.
 A discounted rate will apply to the country a customer calls the most (based on total dollars). If the customer has equal Dial-1 voice usage to two or more countries, the tie breakers will be the number
Table 13 Production, trade and supply of conventional crude oil Thousand metric tons; kilograms per capita; reserves production ratio (R/P) in years
 in years") Table 13, trade and supply of conventional crude oil Thousand metric tons; kilograms per capita; reserves production ratio (R/P) in years Table Notes The Reserves / ratio refers to crude oil and natural
Table 13, trade and supply of conventional crude oil Thousand metric tons; kilograms per capita; reserves production ratio (R/P) in years Table Notes The Reserves / ratio refers to crude oil and natural
Table 16 Refinery distillation capacity, throughput and output Thousand metric tons
 Million metric tons Table 16 Refinery distillation capacity, throughput and output Table Notes Output is equal to the sum of production from refineries for aviation gasoline, bitumen, gas/diesel oil, ethane,
3rd Meter Gauge Group CEO s Conference. Brisbane. 10 May, rd Meter Gauge CEO's Conference in Brisbane - 10th May,
 3rd Meter Gauge Group CEO s Conference Brisbane 10 May, 2004 1 UIC Members UIC Member 163Members 2 UIC Meter Gauge Group UIC Meter Gauge Group was established as a special group for meter gauge railways
up to and including 31 December 2002
 The ISO Survey of ISO 9000 and ISO 14001 Certificates Twelfth cycle : up to and including 31 December T a b l e o f c o n t e n t s The ISO Survey : twelfth cycle () highlights......................................................................
Delinquent Payments Voluntary Assessed Contributions to the Framework Convention on Tobacco Control
 Delinquent Payments Voluntary Assessed Contributions to the Framework Convention on Tobacco Control The operations of the Framework Convention on Tobacco Control (FCTC) are principally financed through
International Passenger Traffic to and from Reporting Airports (in Thousands) by Country Table 11
 by Country Table 11") International Passenger Traffic to and from Reporting Airports (in Thousands) by Country 2005-2015 Table 11 2005 2006 2007 2008 2009 2010 2011 2012 2013 2014 2015 AUSTRIA 1 796 1 788 1 877 1 826 1 746
International Passenger Traffic to and from Reporting Airports (in Thousands) by Country 2005-2015 Table 11 2005 2006 2007 2008 2009 2010 2011 2012 2013 2014 2015 AUSTRIA 1 796 1 788 1 877 1 826 1 746
 WORLD TARIFF PROFILES 2017 Applied MFN tariffs 0
 REGIOGRAPH SOFTWARE AVAILABLE VERSIONS UPDATE AND UPGRADE PRICE ONGOING SAVINGS OF 50%! PRICE LIST
 PRICE LIST REGIOGRAPH SOFTWARE RegioGraph allows you to visualize and evaluate your company data directly on digital maps. This provides insight into data trends and relationships and lends objectivity
Table III Immigrant Visas Issued (by Foreign State of Chargeability or Place of Birth) Fiscal Year 2018
 Fiscal Year 2018") Africa Algeria 437 2 198 18 1,343 1,998 Angola 26 0 14 1 17 58 Benin 138 0 60 1 237 436 Botswana 10 0 4 0 0 14 Burkina Faso 121 2 35 3 107 268 Burundi 74 0 13 0 97 184 Cabo Verde 395 1 980 6 1 1,383 Cameroon
Africa Algeria 437 2 198 18 1,343 1,998 Angola 26 0 14 1 17 58 Benin 138 0 60 1 237 436 Botswana 10 0 4 0 0 14 Burkina Faso 121 2 35 3 107 268 Burundi 74 0 13 0 97 184 Cabo Verde 395 1 980 6 1 1,383 Cameroon
Enterprise Voice Trunking: Domestic, International and inbound Toll Free Rates
 Overage Domestic Long Distance toll $0.03 On net* Inbound Toll Free $0.029 International Long Distance toll See table below Customers subscribing to MOU packages of 100,000 minutes and larger will receive
Cotton This Month. Major Changes in Supply and Demand Estimates and Projections
 1629 K Street NW, Suite 702 Washington, DC 20006, USA Cotton This Month February 1, 2018 Major Changes in Supply and Demand Estimates and Projections India Mexico Pakistan United States 2017/18 production
Promoting Electric Mobility in Developing Countries
 Promoting Electric Mobility in Developing Countries Kamala Ernest, Programme Officer Transport Unit, UN Environment Sustainable Transport in Egypt: Progress, Prospects and Partnerships December 14th, 2016
Table 33 Electricity supply and consumption Gigawatt-hours and kilowatt-hours per capita
 Table 33 Electricity supply and consumption Table Notes is calculated as production plus imports minus exports. EIOU and losses refers to energy industries own use of electricity, including for pumped
Cotton This Month. Major Changes in Supply and Demand Estimates and Projections
 1629 K Street NW, Suite 702 Washington, DC 20006, USA Cotton This Month March 1, 2018 Major Changes in Supply and Demand Estimates and Projections Brazil China Turkey United States 2017/18: production
Price (CZK) with V.A.T.
 with V.A.T.") Price category 100 100 101* 101* 102 102 103 103 Weight (kg) Price (CZK) 0,5 kg 229,74 278,00 229,74 278,00 599,97 726,00 699,96 847,00 1 kg 260,32 315,00 319,82 387,00 649,55 786,00 749,54 907,00 2 kg
Price category 100 100 101* 101* 102 102 103 103 Weight (kg) Price (CZK) 0,5 kg 229,74 278,00 229,74 278,00 599,97 726,00 699,96 847,00 1 kg 260,32 315,00 319,82 387,00 649,55 786,00 749,54 907,00 2 kg
Imports of seed for sowing by country Calendar year 2011 Source: ISF compilation based on official statistics and international seed trade reports
 USA 157,432 15,562 464 173,458 523 318 67 908 Germany 195,159 5,913 520 201,592 595 97 22 714 France 125,701 4,389 277 130,367 522 150 11 683 Netherlands 140,899 12,253 796 153,948 250 330 48 628 Italy
Table 16 Refinery distillation capacity, throughput and output Thousand metric tons
 Table 16 Refinery distillation capacity, throughput and output Table Notes Output is equal to the sum of production from refineries for aviation gasoline, bitumen, gas/diesel oil, ethane, feedstocks, gasoline-type
Selected Energy Indicators for 2004
 E E G Y D C A T O S Selected Energy ndicators for 2004 egion/ Popu- GDP GDP Energy et TPES Elec. CO 2 Country lation (PPP) Prod. mports Cons. (a) Emissions (b) (million) (billion (billion (Mtoe) (Mtoe)
Table 21 Production, trade and supply of gas oil/diesel oil Thousand metric tons and kilograms per capita
 Table Notes Production includes output from refineries and plants, together with quantities from other sources which include any blended biodiesel. Please refer to the Definitions Section on pages ix to
Table 2 Components of total energy supply Petajoules and Gigajoules per capita
 Table 2 Components of total energy supply Table Notes Production Included in the production of primary energy for Solids are hard coal, lignite, peat, oil shale, primary solid biofuels and wastes; Liquids
Table 1. Demographics and Standards of Living Across Countries Total Population Annual Annual # Under 5 GNP % under 5 s Net primary Total Maternal
 Table 1. Demographics and Standards of Living Across Countries Total Population Annual Annual # Under 5 GNP % under 5 s Net primary Total Maternal Population under 18 # of births < age 5 deaths mortality
World Tariff Profiles 0<1 2<3 3<4 4<6 6<8 8<10 10<15 15<20 20<
 World Tariff Profiles Applied MFN tariffs 0
Table 3A Early childhood care and education (ECCE): care
: care") 7 238 / ANNEX 2 Early childhood care and education (ECCE): care Education for All Global Monitoring Report Arab States Algeria Bahrain Djibouti Egypt Iraq Jordan Kuwait Lebanon Libyan Arab Jamahiriya Mauritania
7 238 / ANNEX 2 Early childhood care and education (ECCE): care Education for All Global Monitoring Report Arab States Algeria Bahrain Djibouti Egypt Iraq Jordan Kuwait Lebanon Libyan Arab Jamahiriya Mauritania
Major Changes in Supply and Demand Estimates and Projections
 INTERNATIONAL COTTON ADVISORY COMMITTEE 1629 K Street NW, Suite 702, Washington, DC 20006 USA Telephone (202) 463-6660 Fax (202) 463-6950 email secretariat@icac.org COTTON THIS MONTH February 1, 2016 Major
Table 23 Production of minor oil products from refineries - by type Thousand metric tons
 Table 23 Production of minor oil from refineries - by type Table Notes Data refer to production from refineries of refinery, ethane, naphtha, lubricants, bitumen, paraffin, petroleum, white spirit, and
Table A1. Summary of World Output 1 (Annual percent change)
") WORLD ECONOMIC OUTLOOK: LEGACIES, CLOUDS, UNCERTAINTIES Table A1. Summary of World Output 1 (Annual percent change) Average 1996 2005 2006 2007 2008 2009 2010 2011 2012 2013 2014 2015 2019 World 3.9 5.6
WORLD ECONOMIC OUTLOOK: LEGACIES, CLOUDS, UNCERTAINTIES Table A1. Summary of World Output 1 (Annual percent change) Average 1996 2005 2006 2007 2008 2009 2010 2011 2012 2013 2014 2015 2019 World 3.9 5.6