Honda Corporate Update 2014 Autumn ACURA TLX (US)
|
|
|
- Joel Ellis
- 6 years ago
- Views:
Transcription


1 Honda Corporate Update 214 Autumn ACURA TLX (US) 1
2 Honda Corporate Update Honda FY211 Rating Review Honda Business Status Business Strategy Automobile Operations Motorcycle Operations Financial Highlights 2
3 Profit Structure Profile over Past Decade and Profit structure and Strong Recovery in FY13 USD/JPY 1,2 (Billion) 12% O/P margin 1, % 7.7% 7.9% Automobile Lehman Shock 4.2% 6.5% Japan Earthquake Thai Flood 5.5% 6.3% 6.% 1% 8% 6% 4 1.9% 2.9% 4% 2-2 Motorcycle Finance FY6 FY7 FY8 FY9 FY1 FY11 FY12 FY13 FY14 (P) FY12 2% % -2% 3
 Top-line growth")


 (as of Oct.")
4 Current Fiscal Year Projection Sales growth and cost reduction will contribute to a rise in operating income Yen (billions) Top-line growth and cost reduction Rev/Mix C/R +43. SG&A Expenses R&D Expenses FOREX Effects -1. Operating income 75.2 Consolidated Unit Sales Growth Auto mil (+5.6%) M/C mil (+4.9%) Operating income, excluding forex effects Operating income 77. FY3/14 FY3/15(P) (as of Oct. 28) FY14 (P) Change Capital Expenditures Depreciation and Amortization R&D expenses
5 Current Fiscal Year Projection (Jul-29 vs. Oct-28) Honda Group Unit Sales Unit (thousands) (Motorcycles) (Automobiles) 18,8 17,95 4,83 4,62 Operating Income ± Yen (billions) - 13 ( -.7 %) - 21 ( %) ROS 6.% FOREX Vol/Mix CD SGA ROS 6.% Previous (Jul-29) Revised (Oct-28) Difference Previous (Jul-29) Revised (Oct-28) Difference Japan North America ,81 1,81 Europe Asia 15,68 15,64-4 1,59 1,49-1 Other Region 1,685 1, Total 18,8 17, ,83 4,62-21 Motorcycle : Reductions in Other Region (mainly Brazil), and Asia. Automobile : Reductions in Japan and China. Previous (Jul-29) Main Reasons for revision of forecast FOREX +56. Vol/Mix -52. Revised (Oct-28) 4W : On the operating income line, a delay in New/FMC model introductions, the impact of a higher consumption tax and increased competition in the mini vehicle segment led to a decrease of 1, units in Japan 2W : Prolonged distressed financial environment in Brazil as well as changes in other countries,led to a decrease in the sales plan in Other Region by 75, units. 5
6 Current Fiscal Year Projection (Apr-25 vs. Oct-28) Honda Group Unit Sales Unit (thousands) (Motorcycles) (Automobiles) 18,24 17,95 4,83 4,62 Operating Income Yen (billions) - 29 ( %) - 21 ( %) 76. ROS 6.% FOREX Vol/Mix CD SGA 77. ROS 6.% Original (Apr-25) Revised (Oct-28) Difference Original (Apr-25) Revised (Oct-28) Difference Japan North America 3 3 1,81 1,81 Europe Asia 15,765 15, ,59 1,49-1 Other Region 1,77 1, Total 18,24 17, ,83 4,62-21 Motorcycle : Reductions in Other Region (mainly Brazil), and Asia. Automobile : Reductions in Japan and China. Original (Apr-25) Main Reasons for revision of forecast FOREX +66. Vol/Mix -52. Revised (Oct-28) 4W : On the operating income line, a delay in New/FMC model introductions, the impact of a higher consumption tax and increased competition in the mini vehicle segment led to a decrease of 1, units in Japan 2W : Prolonged distressed financial environment in Brazil as well as changes in other countries,led to a decrease in the sales plan in Other Region by 16, units. 6
7 Honda Corporate Update Honda FY211 Rating Review Honda Business Status Business Strategy Automobile Operations Motorcycle Operations Financial Highlights 7
8 Core Strategies Honda for FY211 Growth Rating Automobile Review Operations (Highly efficient and fun to drive powertrain technologies) Global Operation Reform Regional Concurrent Development Locally Optimized Design/ Increase in Local Procurement Higher Production Efficiency Global Core Models & New Models for Uncultivated Markets Sustainable & Profitable Growth 8


 New")


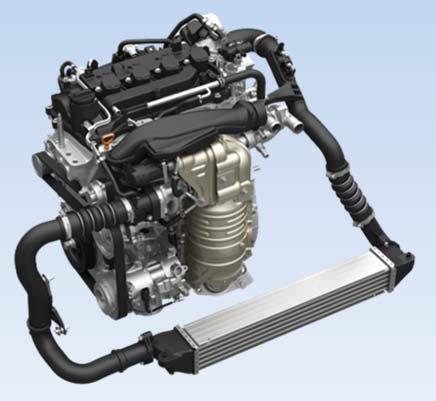
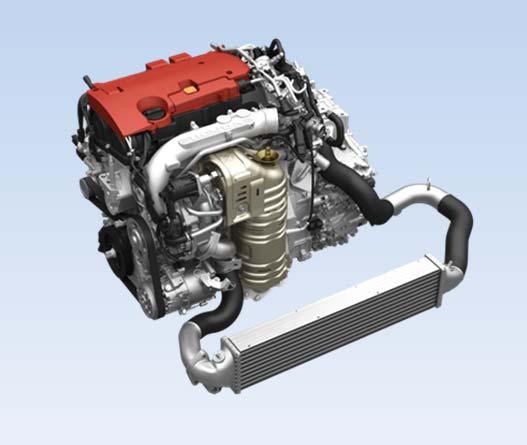
9 Honda introducing full line-up of new engines and transmissions Full range of new gasoline engines Earth Dreams Technology New diesel engines New CVT transmissions 1.5L class engine 1.8L class engine 2.4L class engine 3.5L class V6 engine 1.5/1.6L class engines Minivehicle Minivehicle Compact vehicle Mid-sized vehicle New 66cc New 2.4L Direct Injection i-vtec+ CVT New 3.5L Direct Injection i-vtec Engine RLX MDX New 2.4L / 3.5L Direct Injection i-vtec Engine TLX Accord N Box 2.4L 27 mpg (city) 3.5L 21 mpg (city) New 1.6L Diesel Engine (Civic and CR-V, Europe) New 1.5L Diesel Engine (Amaze, India) New 1.5L Direct Injection Engine + CVT (Fit and Vezel, Japan) New 1.5L Diesel Engine (City and Honda MOBILIO, India) CY

")


 Two-Motor hybrid system")

 Three-Motor Sports")
10 Earth Dreams Technology INTEGRATED MOTOR ASSIST Enhance Hybrid Line-up Intelligent Dual-Clutch Drive (i-dcd) Global Compact series One-Motor Hybrid system Fit Hybrid Vezel Hybrid CR-Z Fit/Jazz Hybrid Freed / Spike Hybrid Fit Shuttle Hybrid Civic Hybrid Acura ILX Hybrid Sports Hybrid Intelligent Multi-Mode Drive (i-mmd) Two-Motor hybrid system mid-to-large sized vehicles Plug-in Hybrid Jan 213 Accord Hybrid Jul 213 (Japan) Three-Motor Sports Hybrid SH-AWD system for Acura models RLX NSX 1


11 Earth Dreams Technology Balances outstanding environmental performance with FUN Realizes outstanding dynamic performance for motorsports enthusiasts 11


12 Safety Leadership (U.S.) 1 Honda or Acura vehicles have earned either Top Safety Pick or Top Safety Pick + ratings. Honda leads the industry with seven TOP SAFETY PICK+ vehicles American Japanese Japanese Japanese Japanese American European American European Korean Japanese American European European Next Generation ACE Body Structure Cabin strength increased through the use of hot stamp material and high tensile steel Accord Coupe Acura MDX The 215 CR-V is also expected to achieve TOP SAFETY PICK+ Civic Accord Sedan Acura RLX Note: as of Nov. 214 Side frame, upper frame and bulkhead efficiently absorb crash energy Odyssey Acura TLX 12

 Introduction of such technologies will be expanded to other models in the near future.")
 Lead")

13 Honda SENSING AcuraWatch Safety Leadership Honda is also at the forefront of the development of active safety or accident prevention technologies which benefit all road users - automobiles, motorcycles and pedestrians. A Suite of Safety and Driver Assistive Technologies Collision Avoidance Acura TLX (US, Aug 214) CR-V (US, Oct 214) Legend (JPN, Jan 215) Introduction of such technologies will be expanded to other models in the near future. Forward Collision Mitigation Brake System (CMBS) False Start Prevention Function Road Departure Mitigation (RDM) system Pedestrian Collision Mitigation Steering System Preventive Adaptive Cruise Control with Low Speed Follow Lane Keep Assist System (LKAS) Lead Car Departure Notification System Traffic Sign Recognition Side Blind Spot Intrusion Warning Lane Watch Rear Multi-Angle Rearview Camera with View Mode Selection Parking Support Sensor System Backing out of Parking Space Support Collision Mitigation Brake System (CMBS) Adaptive Cruise Control with Low Speed Follow Lane Keep Assist System (LKAS) 13
14 Global Automobile Production Capacity CY213 CY214 Current plan from 215 onward Other China Asia Europe North America 4, k Dongfeng, China (Within 213) +5k Malaysia (Oct 213) +9k 4, ,63 1,72 Alabama +4 Indiana +5 (Jan 213) k India (Feb 214) +13k Indonesia (Jan 214) 25k 15k UK Reduced to single line (October 214) +2k 5, ,92 Brazil (Unit : 1,) Single production shift (+6k/year) to start in 215 China +24k Guangqi +12k Dongfeng +12k to begin production in 215 Thailand +12k CKD production to start in October, 215 CBU production to start in March, 216 Japan End of Yorii Plant New plant in Mexico 1, 2k 1, (Feb 214) 1, (July 213) +α +α +α Capacity increase to 5.7 mil Global capacity increased to 5.1 million units in CY214 14
 Europe 2,")
 1 mil +α <Export>")


 Establish stable")
15 Utilization Image Global Automobile Production Japan (Units) Europe 2, Dedicating to produce Civic and CR-V Accord & L/T models Jazz (Plan) 1 mil +α <Export> Compact & Hybrid models 1-2% for Other regions Hybrid models Acura & L/T models North America 1.92 mil <Export> Acura & L/T models Middle East and Africa Accord 8-9% for Local markets CR-V Asia Acura South America 945, China 15, <Export> Strengthen mutual parts/production sharing among Asia Exporting to Africa 89, <Export> Utilizing the cost benefit for the next market (Africa) Total Capacity 5.1 mil units (end of CY214) Establish stable production structure Capacity leveraging increase regional to capacity 5.7 mil + mutual parts/product sharing 15


16 Global Compact Series Roll Out of Honda s Global Compact Series with best-in class Fun to Drive, Fuel Economy, Packaging and Safety (Fit / Jazz) (City / Grace) Highest Volume in Core Model Line-up Fit / City accounted for about 18% of Honda global unit sales in 213 ( units) Fit / City 4.27 mil CY213 Accord Civic CR-V (HR-V / Vezel) Global Launch Schedule City City Vezel FY14 FY Jun Sep 14 May 14 Oct / Nov 14 May May 14 Jan 14 Dec14 Dec13 Sep 13 16
 Unit (thousands) Passenger Cars 2, 1, Light Trucks Industry Demand Unit")


 Acura TLX (Aug 214) Acura RLX Sport Hybrid (Sep 214)")
17 North America North America Automobile Operations (U.S.) Unit (thousands) Passenger Cars 2, 1, Light Trucks Industry Demand Unit (thousands) 2, Honda Unit Sales Acura Honda Passenger Cars Honda Light Trucks 1,59 1, ,5 1,428 14,491 1,23 12,778 1,15 1,147 11,588 1,429 1, 1,422 1,525 1,55~ 5 CY E CY P Source: Honda For Further Growth New Model/FMC Launches New model launches with brand-new powertrains - Fully remodeled Fit launched in June All new Acura TLX launched in August Minor model change of CR-V debut in Oct All new stylish CUV, HR-V to be debut in winter/spring Fit (June 214) Acura TLX (Aug 214) Acura RLX Sport Hybrid (Sep 214) Continue to invest to N.A auto manufacturing and R&D operations to enhance the model competitiveness CR-V MMC (Oct 214) HR-V (FY215) 17


 St")
 Civic More than")

")

18 New models to be launched with new technologies and competitive cost structure Strategies for improving model cost structure Significant cost reduction for next-generation core models by maximizing parts-commonality Expand sourcing of parts from Mexico Optimize model allocation to improve cost effectiveness Enhance rolling cost reduction efforts from launch Fit (Jun 214) Strategies for U.S. Market HR-V (FY215) Civic More than 1 mil unit sales from 3 models X CR-V Accord 21X Source more parts from Mexico Strengthen SUV line-up 215 CR-V (Oct 214) Strengthening model the model competitiveness New models with Earth Dreams Technology for each segment Variety of SUV models to be launched in growing segments 18


19 Acura Strategy Acura Strategy New Models with Advanced Technologies All-new Direct injected engines All-new 8DCT and 9AT transmissions Three-Motor Sports Hybrid SH-AWD ( ) Unit Sales in the U.S TSX Revitalize sedan line-up TL 5 MDX RDX CY Independent Organizational Structure Specific to Acura Business Operations Established 19
 N-One (Nov 212) N-WGN (Nov")


 Grace (Dec 214) N-WGN (Nov 213) S66 (215) Vezel (Dec 213) Three more models to be announced launches")
20 Japan Automobile Operations Industry Demand Honda Unit Sales 6, Mini vehicle Registered vehicle 1, Registered vehicle Mini vehicle 75 4, 5 2, 25 FY8 FY9 FY1 FY11 FY12 FY13 FY14 N BOX (Dec 211) N-One (Nov 212) N-WGN (Nov 214) FY8 FY9 FY1 FY11 FY12 FY13 FY14 Source: JAMA Source: Honda Strategy for Japan Market New Model Announced Launches/ FMC Efficient enhancement of product line-up - Launch of 3 rd generation Fit and all-new SUV Vezel in Launch of Grace, sedan derivative of Global Compact series, in Dec Launch of new mini vehicles, S66 and 5th model of the N series - Strengthen minivan line-up by introducing new value minivan and fully remodeled StepWGN - Strengthen sedan line-up: fully remodeled Legend (+ Grace) Fit (Sep 213) Legend (Jan 215) Odyssey (Oct 213) Grace (Dec 214) N-WGN (Nov 213) S66 (215) Vezel (Dec 213) Three more models to be announced launches in 2


 Reduction of the amount of")

21 Japan Automobile Production Innovation Yorii Plant Started production in July 213 Dedicated to the production of small-sized vehicles Capacity : 25k units / year Yorii Plant employs a number of innovative technologies and is a world-leading energysaving plant. Example of Innovative Technologies Honda Smart Ecological Paint A highly-functional painting technology that eliminates a middle coating process from a commonly used 4-coat/3-bake auto body painting process to realize a 3-coat/2-bake water-based painting process. Yorii is the first plant to use this technology and it has also been introduced in the new Mexican plant. Thailand, Brazil and China plants will be next. 4-coat/3-bake (Conventional painting process) Reduction of the amount of paint materials 4% reduction in the number of processes 4% reduction of the amount of CO2 emitted during painting process 3-coat/2-bake (Honda Smart Ecological Paint) Image of test painting This new technology enables Honda to reduce the cost of paint materials, process layouts and equipment 21


 Source: Honda New Model")
 Brio Satya, Indonesia (Nov 213) Jazz,")
22 Asia Automobile Operations (ASEAN) Industry Demand Honda Unit Sales Retail Sales 3,5 4 3, 2,5 Malaysia Indonesia Thailand Philippines 35 3 Malaysia Indonesia Thailand Philippines 25 2, 2 1,5 15 1, CY Source: Honda Strategy for ASEAN Market <Indonesia> Honda MOBILIO launched in the low-price MPV segment - the largest volume segment in Indonesia which was previously uncultivated by Honda Fully remodeled City and Jazz launched HR-V is scheduled to be launched in 215 <Thailand> Fully remodeled City and Jazz and all- new Honda MOBILIO launched in 214 CY Brio Amaze, Thailand (Nov 212) Honda MOBILIO, Indonesia, Thailand (Jan 214~) Source: Honda New Model Launches/ FMC Accord, Thailand (Mar 213) City, Thailand, Malaysia, Indonesia, Philippines (Jan 214~) Brio Satya, Indonesia (Nov 213) Jazz, Thailand, Indonesia (May 214~) 22


23 Asia Automobile Operations (India) India Industry Demand (excluding commercial vehicles) Honda Unit Sales in India 3, Diesel Gasoline 12 Retail Sales 2,5 1 2, 8 1,5 6 1, FY9 FY1 FY11 FY12 FY13 FY14 Source: SIAM, Honda Strategy for India Market Profitability of automobile operations in Indian market has improved due to introduction of FMC models New models equipped with diesel engines launched - Amaze debut with new 1.5L diesel engine - City and Honda MOBILIO launched Expansion of dealer network Expansion of automobile production capacity - 2nd automobile factory started production in February 214 CY8 CY9 CY1 CY11 CY12 CY13 Amaze (Apr 213) New Model / FMC Launches Source: Honda Earth Dreams Technology 1.5L i-dtec Diesel Engine City (Jan 214) Honda MOBILIO (July 214) 23
 Industry Demand Honda Unit")
 Accord Odyssey City Fit CR-V")


 Accord (Sep 213) Fit (May 214) Odyssey (Aug 214)")
24 2, 18, 16, 14, 12, 1, 8, 6, 4, Minivan SUV MPV Sedan Asia Automobile Operations (China) Industry Demand Honda Unit Sales (excluding commercial vehicles) 1, (Guangqi + Dongfeng + Acura) Accord Odyssey City Fit CR-V Civic CRIDER Jade Others 2, 1 CY Source: J.P. Morgan CY Source: Honda Strategy for China Market New Model Launches/ FMC Introduce all-new Vezel and XR-V models into rapidly growing SUV segment (15% increase from CY12->13) Strengthen local development function to incorporate local customer needs/tastes into models for Chinese market Increase local procurement to achieve further cost reduction Expand dealership network to inland regions where economic growth is anticipated CRIDER (Jun 213) Jade (Sep 213) Accord (Sep 213) Fit (May 214) Odyssey (Aug 214) Vezel (Oct 214) XR-V (214) Spirior (214) 24


")
")
 **")
 B")

 Accord")


25 New Model Strategy in China Segment SDN(4D/5D) SUV MUV D Guangqi Dongfeng Accord (213 FMC) Spirior (FMC in 214) Crosstour Elysion (current model) Odyssey (Aug 214 FMC) Concept M (in 215) ** C Guangqi Dongfeng Crider (213) Civic CR-V Jade (213) B Guangqi Dongfeng Fit (May 214 FMC) City Concept B (in 216)* Vezel (Oct 214) XR-V (in 214) Accord etc. Fit City etc. Civic CR-V Jade etc. * the joint venture partner for concept B has not been announced yet **two different models based on Concept M will be introduced one by each JV partner CY213 China Unit Sales by Platform By utilizing common platforms and strengthening local procurement as well as local R&D functions, a number of cost competitive models will be launched 25
26 Honda Corporate Update Honda FY211 Rating Review Honda Business Status Business Strategy Automobile Operations Motorcycle Operations Financial Highlights 26
27 Motorcycle Market Size and Honda Share (CY213) Thailand 1.9 million Vietnam 2.7 million 81% (CY212: 76%) 68% (CY212: 62%) Indonesia India 24% 7.7 million 61% Brazil 1.5 million 14.8 million (CY212: 58%) 81% (CY212: 8%) (CY212: 18%) 27
 Expansion Plan Annual Capacity : 4. mil 5.8 mil 5.8mil 4.")
 215(P) 216(P) Product Line-up")

 Dream Neo (Apr 213) CD 11 Dream (Jul")
28 2 nd plant 4 th plant 1 st plant Manesar Rajasthan Gujarat Asia Motorcycle Operations (India) Expansion Plan Annual Capacity : 4. mil 5.8 mil 5.8mil 4.6mil 4.6mil mil 3 rd rd plant Bangalore 2 nd 1 st Future Honda Growth CY (P) 215(P) 216(P) Product Line-up Expand capacity to meet growing demand Strengthen 11cc model line-ups Improve fuel economy of scooter models Prepare for exports to Next Markets (Africa, etc.) Honda introduced new 11cc Scooters and Motorcycles into Indian Market 11cc AT-Scooter Activa Dream Yuga (Apr 212) Dream Neo (Apr 213) CD 11 Dream (Jul 214) 28


29 Asia Motorcycle Operations (Indonesia) Sales Results and Respective Fuel Injection (FI) ratios FY214 Total 27 1% Total 49 29% Total 476 1% Capacity Expansion Applied FI to all models by end of FY 214 BeAT-Fi 5.3mil 4 th plant started operations in 214 with an annual production capacity of 1.1 million units 4.4mil 1.1 4th 3rd Scoopy FI 2nd 1st (P) 29
30 Honda Corporate Update Honda FY211 Rating Review Honda Business Status Business Strategy Automobile Operations Motorcycle Operations Financial Highlights 3
31 Outline of 2nd Quarter Results Summary (Consolidated) Results Summary Operating income for the second quarter was billion yen due mainly to - Increased competitiveness in the North American and Japanese automobile markets - Positive impact of new automobile model introductions in Asia - Continuous cost reduction efforts 2nd Quarter Results FY14 and FY14 2,8 2,5 Consolidated Unit Sales 2,585 2, , ,295 1,286 Unit (thousand) 3, Net Sales / Operating Income 2 2,89.2 3, Yen (billion) ,2 7 1,2 2, ,9 6 1, 1, Motorcycles Automobiles Power Products Net Sales Operating Income Net Income *1 For *1, please refer to footnotes on page 49 31
32 2nd Quarter Unit Sales Honda Group Unit Sales (thousand) 2Q Results (3 Months) FY14 Change Motorcycles 4,216 4, % Automobiles 1,47 1, % 5, 4,5 4, 3,5 Honda Group Unit Sales 4,216 4,581 1,1 1, 9 1,2 1,1 FY14 Unit (thousand) 1,47 1,71 1,295 1,286 1,3 F Power Products 1,295 1, % Consolidated Unit Sales (thousand) 2Q Results (3 Months) FY14 Change Motorcycles 2,585 2, % Automobiles % Power Products 1,295 1, % 3, 2,8 2,6 2,4 2,2 2, 2, , , Motorcycles Automobiles Power Products Consolidated Unit Sales 1,3 1,2 1,1 1, Unit (thousand) 1,295 1,286 Motorcycles Automobiles Power Products Honda Group Unit Sales - Increase in motorcycle unit sales mainly in India and Indonesia - Increase in automobile unit sales due to the positive impact of new model introductions as well as the launch of fully remodeled vehicles in Asia as well as other markets 32
33 2nd Quarter Financial Results (Consolidated) Financial Results Yen (billion) 2Q Results (3 Months) FY14 Change Net Sales 2,89.2 3, % Operating Income % Operating Margin 5.9% 5.5% -.4pt Income before income taxes % Equity in income of affiliates % Net Income * % EPS (Yen) * Average Rates (Yen) US Dollar Euro Yen down by 5 yen Yen down by 7 yen Financial Summary - Net sales and other operating revenue increased by 4.3% mainly due to a rise in motorcycle and automobile unit sales as well as the positive impact of foreign exchange effects - Operating income decreased by 4.1% mostly due to a decrease in income associated with changes in sales volume and model mix and increased R&D expenses, despite cost reduction efforts and positive FOREX effects - Net income increased by 17.9% For *1 and *2, please refer to footnotes on page Operating Income Yen (billion) FY % 6% Operating Margin 6.6% 6.5% 5.9% 5.5% 7.6% FY14 5.3% 2Q 3Q 4Q 4% 2Q 3Q 4Q 33
34 Change in Income before Income Taxes < 2nd Qtr> Income before Income Taxes ( % ) Yen (billion) Operating Income - 7.( % ) Other Income & Expenses Revenue, model mix, etc Cost Reduction, etc Decrease in SG&A Increase in R&D Currency Other Effects Unrealized gains and losses related to derivative instruments <Decrease Factors> - Decrease in sales volume and model mix, - Increased sales Incentives etc. Operating Income Currency effects due to difference between average sales rates and transaction rates Other Operating Income FY14 2Q 2Q 34
35 (Attachment 3) - Cash Flows of Non-financial Services Businesses - FY14 Six Months Free cash flow Net change Yen (billion) 1,18. Net Cash Cash & Cash equivalents at beginning of the FY14 Six Months Net change , ,82.1 Net Cash Cash & Cash equivalents at beginning of the Cash flows from operating activities Net income Equity in income of affiliates Depreciation Other Cash flows from operating activities Free cash flow Net income Equity in income of affiliates Depreciation Other Cash flows from investing activities Capital expenditures * Other Cash flows from financing activities *1 This includes Purchases of intangible assets Cash flows from investing activities Capital expenditures * Other Effect of exchange rate changes on cash and cash equivalents Dividends paid Others Cash flows from financing activities *1 This includes Purchases of intangible assets Effect of exchange rate changes on cash and cash equivalents Dividends paid Others ,17. Net Cash Cash & cash equivalents at end of the period Net Cash Cash & cash equivalents at end of the period 35
36 Operations by Business Segment 7 Yen (billions) Motorcycle Business =Operating Income =Operating Margin 22% 13.6% 17% % 3 5.8% 8.4% 9.6% 9.8% 9.6% % 9.2% 1.6% 8.2% 7.4% 6.7% 1.9% 1.7% 9.6% 8.6% 1.8% 8.7% 12% 7% 1 3.4% 2.2% % % -1 FY1 2Q 3Q 4Q FY11 2Q 3Q 4Q FY12 2Q 3Q 4Q FY13 2Q 3Q 4Q FY14 2Q 3Q 4Q 2Q -3% Yen (billions) Automobile Business =Operating Income 2 =Operating Margin 2% % 6.3% 1.4% 5.% 4.2% 5.3% 2.1% 3.6% 4.4% 3.7% 6.5% 4.3% 3.1% 3.4% %.9% -1.4% -2.4% -1.2% % % % % % % -1 FY1 2Q 3Q 4Q FY11 2Q 3Q 4Q FY12 2Q 3Q 4Q FY13 2Q 3Q 4Q FY14 2Q 3Q 4Q 2Q -2% 36
37 Operations by Business Segment 2 Yen (billions) Power Product & Other Businesses =Operating Income =Operating Margin 1% 3.1% 5%.7%.4% -.5% 1.7%-1.1% -4.%-3.7% -.4% -.2%.1% % % % % -6.4% % -2.7% -3.3% -8.1% % % % -1% -8.9% -2 FY1 2Q 3Q 4Q FY11 2Q 3Q 4Q FY12 2Q 3Q 4Q FY13 2Q 3Q 4Q FY14 2Q 3Q 4Q 2Q -15% *Honda Trading related out-of-period adjustment is not included 8 Yen (billions) Financial Services Business 38.7% 4% 35.8% 33.2% % 29.8% 34.8% 32.% 32.9% 32.% 28.8% 3.5% 29.5% 28.7% 27.6% 26.6% 26.4% 27.4% 27.% 27.4% 24.% 25.6% 24.7% 3% 4 2% 2 1% FY1 2Q 3Q 4Q FY11 2Q 3Q 4Q FY12 2Q 3Q 4Q FY Q 3Q 4Q FY14 2Q 3Q 4Q 2Q % 37
38 Operations by Region 15 Yen (billions) 1.8% North America 9.7% =Operating Income =Operating Margin 14% 1 5.7% 5.3% 7.% 7.4% 8.9% 2.5% 2.5% 7.6% 6.% 6.8% 6.8% 2.5% 5.7% 4.8% 3.1% 2.2% 8.2% 3.% 4.4% 2.5% 1% 6% 2% % -5-6% -1% -1-14% -15 FY1 2Q 3Q 4Q FY11 2Q 3Q 4Q FY12 2Q 3Q 4Q FY13 2Q 3Q 4Q FY14 2Q 3Q 4Q 2Q -18% Yen (billions) Japan =Operating Income =Operating Margin 6.4% 6.1% 6.3% 6.1% 5.8% 4.5% 4.4% 4.9% 5.4% 3.9% % 1.2% 2.2%1.7% 1.2% % % % -1.% % -4.8% % 12% 6% % -6% -1-12% % -2 FY1 2Q 3Q 4Q FY11 2Q 3Q 4Q FY12 2Q 3Q 4Q FY13 2Q 3Q 4Q FY14 2Q 3Q 4Q 2Q -24% 38
39 Operations by Region 25 Yen (billions) Europe 9.9% =Operating Income 1% =Operating Margin 6.1% 15 5% 5-5.8%.9% % -3.7% 2.1% -1.9% % -.9% % -3.2% % % -6.% % % -7.7% % -4.8% % % -5% -6.3% -15 FY1 2Q 3Q 4Q FY11 2Q 3Q 4Q FY12 2Q 3Q 4Q FY13 2Q 3Q 4Q FY14 2Q 3Q 4Q 2Q -1% 7 Yen (billions) 8.8% Asia excluding Japan 9.4% 8.6% =Operating Income =Operating Margin 8.9% 8.7% 1% 6 7.4% 8.% 8.5% 7.6% 7.4% 7.2% 8% 5 6.3% 7.% 6.8% 6.7% 5.4% 6.2% 6.7% 6.9% 6% 4 5.7% 4.2% 4.2% 3 4% 2 2% FY1 2Q 3Q 4Q FY11 2Q 3Q 4Q FY Q 3Q 4Q FY Q 3Q 4Q FY14 2Q 3Q 4Q 2Q % 39
40 Operations by Region Yen (billions) Other Regions =Operating Income =Operating Margin % 8.6% 8.4% 6.8% 7.2% 7.5% 6.6% 6.6% 6.1% 5.6% 5.% 4.6% 4.6% 5.% 4.4% 3.6% 3.2% 2.6% 2.2% 2.2% 1.2% -.3% % 12% 9% 6% 3% % -1 FY1 2Q 3Q 4Q FY11 2Q 3Q 4Q FY12 2Q 3Q 4Q FY13 2Q 3Q 4Q FY14 2Q 3Q 4Q 2Q -3% 4
41 Financial (Consolidated) Yen (billion) FY14 Results Change amount % Change from previous forecast Net Sales 11, , % - 5. Operating Income %. Operating Margin 6.3% 6.% -.3pt - Income before Income taxes % + 1. Equity in income of affiliates % *1 Net Income % -35. *2 EPS (Yen) For *1 and *2, please refer to footnotes on page 49 Average Rates (Yen) US Dollar 1 14 ( 1H 13 / 2H 15 ) Euro ( 1H 139 / 2H 135 ) Yen down by 4 yen Yen down by 1 yen Yen down by 3 yen Yen down by 1 yen 41
42 : Honda Group Unit Sales Motorcycles 17,21 18,8 17,95 4,323 Automobiles 4,83 4,62 6,36 Power Products Unit (Thousand) 6,335 6, ( -.7 %) - 21 ( %) - 15 ( %) Previous Revised Change Previous Previous Revised Change Previous Previous Revised Change Japan ,81 1,81 2,85 2, Europe ,7 1, Asia 15,68 15,64-4 1,59 1,49-1 1,595 1, ,685 1, Total 18,8 17, ,83 4, ,335 6, North America Other Region FY14 Previous Revised FY14 Revised FY14 Revised 42
43 : Consolidated Unit Sales Motorcycles Automobiles 1,343 1,915 3,87 1,85 3,76 3,56 Unit (Thousand) Power Products 6,36 6,335 6, ( -.6 %) -11 ( %) - 15 ( %) Previous Revised Change Previous Revised Change Previous Revised Change Japan ,81 1,81 2,85 2, North America Europe ,7 1, Asia 8,515 8, ,595 1, Other Region FY14 Previous Revised FY14 Previous Revised 1,685 1, Total 1,915 1, ,87 3, ,335 6, FY14 Previous Revised 43
44 Guidance: Units Sales by Business Segment Motorcycles Automobiles Power Products : Honda Group Unit Sales FY14 Results s Change FY14 Results s Change FY14 Results s Change Japan North America ,757 1, ,718 2, Europe ,32 1, Asia 14,536 15,64 + 1,14 1,286 1, ,5 1,48-2 Other Region 1,817 1, Total 17,21 17, ,323 4, ,36 6, : Consolidated Unit Sales FY14 Results s Change FY14 Results s Change FY14 Results s Unit (Thousand) Change Japan North America ,757 1, ,718 2, Europe ,32 1, Asia 7,858 8, ,5 1,48-2 Other Region 1,817 1, Total 1,343 1, ,56 3, ,36 6,
45 : Change in Income before Income Taxes Income before Income taxes (+ 4.9% ) Yen (billion) Operating Income ( % ) Other Income & Expenses Revenue, model mix, etc Cost Reduction, etc. Increase in SG&A Increase in R&D Currency Effects Unrealized gains and losses related to derivative instruments Other 765. Operating Income 75.2 Operating Income 77. FY14 Revised 45
46 : Change in Income before Income Taxes Income before Income taxes + 1. ( % ) Yen (billion) Operating Income ± ( ± % ) Other Income & Expenses ± Revenue, model mix, etc. -7. Cost Reduction, etc ± Decrease in SG&A R&D Expenses Currency Effects Unrealized gains and losses related to derivative instruments Other Operating Income 77. Operating Income 77. Previous Revised 46
 % against Net Sales 47")
47 : Capital Expenditures, Depreciation, R&D Expenses 8 Capital Expenditures Depreciation / Amortization R&D 8% 8 8% 8 8% 6 6% 6 6% 6 6% 4 4% 4 4% 4 4% 2 2% 2 2% 2 2% % % % Actual Amounts (billion Yen) % against Net Sales 47
48 Dividend (Yen) Dividend per Share FY14 (Expectation) Increase / Decrease from FY14 1 st Quarter End nd Quarter End rd Quarter End 2 ( 22 ) ( + 2 ) 4 th Quarter End 22 ( 22 ) ( ± ) Fiscal Year 82 ( 88 ) ( + 6 ) 48
49 Caution with Respect to Forward-Looking Statements: This slide contains forward-looking statements about the performance of Honda, which are based on management s assumptions and beliefs taking into account information currently available to it. Therefore, please be advised that Honda s actual results could differ materially from those described in these forward-looking statements as a result of numerous factors, including general economic conditions in Honda s principal markets and foreign exchange rates between the Japanese yen and the U.S. dollar, the Euro and other major currencies, as well as other factors detailed from time to time. Accounting standards: Our consolidated financial standards are prepared in conformity with U.S. generally accepted accounting principles. Notice on the Factors for Increases and Decreases in Income: With respect to the discussion above of the change in operating income, management has identified the factors set forth below and used what it believes to be a reasonable method to analyze the respective changes in such factors. Each of these factors is explained below. Management has analyzed changes in these factors at the levels of the Company and its material consolidated subsidiaries. (1) Foreign currency effects consist of translation adjustments, which come from the translation of the currency of foreign subsidiaries financial statements into Japanese Yen, and foreign currency adjustments, which result from foreign-currency-denominated sales, which, at the levels of the Company and those consolidated subsidiaries which have been analyzed, primarily relate to the following currencies: U.S. dollar, Canada dollar, Euro, GBP, BRL and Japanese Yen. (2) With respect to cost reduction and effects of raw material cost fluctuations, management has analyzed cost reduction and effects of raw material cost fluctuations at the levels of the Company and its material foreign manufacturing subsidiaries in North America, Europe and other regions. (3) With respect to changes in net sales and model mix, management has analyzed changes in sales volume and in the mix of product models sold in major markets which have resulted in increases/decreases in profit, as well as certain other reasons for increases/decreases in net sales and cost of sales. (4) With respect to selling, general and administrative expenses, management has analyzed reasons for an increase/decrease in selling, general and administrative expenses from the previous fiscal year net of currency translation effects. (5) With respect to research and development expenses, management has analyzed reasons for an increase/decrease in research and development expenses from the previous fiscal year net of currency translation effects. *1 Net income attributable to Honda Motor Co., Ltd. *2 Basic net income attributable to Honda Motor Co., Ltd. per share Basic net income attributable to Honda Motor Co., Ltd., per share is calculated based on weighted average number of shares outstanding as shown below: - 2nd Quarter FY14: 1,82,295, (approx), : 1,82,289, (approx) (page 33) - Fiscal Year FY14: 1,82,294, (approx), : 1,82,289, (approx) (page 41) 49
50 5
Honda FY2011 Rating Review
 Honda Information Meeting 213 Spring Honda FY211 Rating Review 214 Acura MDX 1 1 Honda Information Meeting Honda FY211 Rating Review Current Honda Business Business Strategy Automobile Business Motorcycle
FY2015 First Quarter Financial Results. SUZUKI MOTOR CORPORATION 3 August 2015
 First Quarter Financial Results SUZUKI MOTOR CORPORATION 3 August 2015 Consolidated: Financial Summary Page2 Increased net sales and operating income/ordinary income Decreased net income attributable to
Honda Corporate Update Spring. CR-V (US Model)
") Honda Corporate Update - 217 Spring CR-V (US Model) Honda Corporate Update Honda Business Status 23 Vision Business Strategy Automobile Business Operations Motorcycle Business Operations Financial Highlights
Honda Corporate Update - 217 Spring CR-V (US Model) Honda Corporate Update Honda Business Status 23 Vision Business Strategy Automobile Business Operations Motorcycle Business Operations Financial Highlights
FISCAL YEAR END MARCH 2013 FIRST HALF FINANCIAL RESULTS. New Mazda6 (Atenza)
") FISCAL YEAR END MARCH 2013 FIRST HALF FINANCIAL RESULTS New Mazda6 (Atenza) Mazda Motor Corporation October 31, 2012 1 PRESENTATION OUTLINE Highlights Fiscal Year March 2013 First Half Results Fiscal Year
FISCAL YEAR END MARCH 2013 FIRST HALF FINANCIAL RESULTS New Mazda6 (Atenza) Mazda Motor Corporation October 31, 2012 1 PRESENTATION OUTLINE Highlights Fiscal Year March 2013 First Half Results Fiscal Year
FISCAL YEAR MARCH 2015 FIRST HALF FINANCIAL RESULTS. New Mazda Demio
 FISCAL YEAR MARCH 2015 FIRST HALF FINANCIAL RESULTS New Mazda Demio Mazda Motor Corporation October 31, 2014 1 PRESENTATION OUTLINE Highlights Fiscal Year March 2015 First Half Results Fiscal Year March
FISCAL YEAR MARCH 2015 FIRST QUARTER FINANCIAL RESULTS. Mazda Roadster 25 th Anniversary Model
 FISCAL YEAR MARCH 2015 FIRST QUARTER FINANCIAL RESULTS Mazda Roadster 25 th Anniversary Model Mazda Motor Corporation July 31, 2014 1 PRESENTATION OUTLINE Highlights Fiscal Year March 2015 First Quarter
FISCAL YEAR MARCH 2015 THIRD QUARTER FINANCIAL RESULTS. Updated Mazda CX-5 (Japanese specification model)
") FISCAL YEAR MARCH 2015 THIRD QUARTER FINANCIAL RESULTS Updated Mazda CX-5 (Japanese specification model) Mazda Motor Corporation February 4, 2015 1 PRESENTATION OUTLINE Highlights Fiscal Year March 2015
FISCAL YEAR MARCH 2015 THIRD QUARTER FINANCIAL RESULTS Updated Mazda CX-5 (Japanese specification model) Mazda Motor Corporation February 4, 2015 1 PRESENTATION OUTLINE Highlights Fiscal Year March 2015
FISCAL YEAR MARCH 2018 FIRST HALF FINANCIAL RESULTS
 FISCAL YEAR MARCH 2018 FIRST HALF FINANCIAL RESULTS PRESENTATION OUTLINE Highlights Fiscal Year March 2018 First Half Results Fiscal Year March 2018 Full Year Forecast Progress of Key Initiatives/ Business
FISCAL YEAR ENDING MARCH 2012 FIRST HALF FINANCIAL RESULTS
 FISCAL YEAR ENDING MARCH 2012 FIRST HALF FINANCIAL RESULTS Mazda Motor Corporation November 2, 2011 New Mazda CX-5 (European specifications) 1 PRESENTATION OUTLINE Highlights Fiscal Year Ending March 2012
FY2016 First Quarter Financial Results. SUZUKI MOTOR CORPORATION 3 August 2016
 First Quarter Financial Results SUZUKI MOTOR CORPORATION 3 August 2016 Improper Activities with Regards to Gas Emission and Fuel Consumption Testing Page2 The Company wishes to express its profound apologies
FISCAL YEAR MARCH 2014 FIRST HALF FINANCIAL RESULTS. New Mazda Axela (Overseas name: New Mazda3)
") FISCAL YEAR MARCH 2014 FIRST HALF FINANCIAL RESULTS New Mazda Axela (Overseas name: New Mazda3) Mazda Motor Corporation October 31, 2013 1 PRESENTATION OUTLINE Highlights Fiscal Year March 2014 First Half
FISCAL YEAR MARCH 2014 FIRST HALF FINANCIAL RESULTS New Mazda Axela (Overseas name: New Mazda3) Mazda Motor Corporation October 31, 2013 1 PRESENTATION OUTLINE Highlights Fiscal Year March 2014 First Half
FISCAL YEAR MARCH 2014 FINANCIAL RESULTS
 FISCAL YEAR MARCH 214 FINANCIAL RESULTS Mazda CX-5 Mazda Atenza Mazda Motor Corporation April 25, 214 New Mazda Axela 1 PRESENTATION OUTLINE Highlights Fiscal Year March 214 Results Fiscal Year March 215
FISCAL YEAR MARCH 2018 FIRST QUARTER FINANCIAL RESULTS
 FISCAL YEAR MARCH 2018 FIRST QUARTER FINANCIAL RESULTS PRESENTATION OUTLINE Highlights Fiscal Year March 2018 First Quarter Results Fiscal Year March 2018 Full Year Forecast Structural Reform Stage 2 Progress
FISCAL YEAR MARCH 2018 THIRD QUARTER FINANCIAL RESULTS
 FISCAL YEAR MARCH 2018 THIRD QUARTER FINANCIAL RESULTS PRESENTATION OUTLINE Highlights Fiscal Year March 2018 Nine Month Results Fiscal Year March 2018 Full Year Forecast Progress of Key Initiatives 1
FY2014 2nd Quarter Business Results. Yamaha Motor Co., Ltd. August 5, 2014
 FY 2nd Quarter Business Results Yamaha Motor Co., Ltd. August 5, Forecast Consolidated Results Agenda FY 2nd Quarter Business Results Outline: Hiroyuki Yanagi President, CEO and Representative Director
FY2013. Third Quarter Financial Results
 Third Quarter Financial Results SUZUKI MOTOR CORPORATION 6 February 2014 Consolidated: Financial Summary Page2 Increased sales and income for two consecutive periods Highest ever income amount and income
FY2012 third-quarter financial results
 FY2012 third-quarter financial results Nissan Motor Co., LTD. February 8, 2013 Key performance indicators: financial results (billion yen) Net revenue 6,698.4 6,755.2 Operating profit 427.8 Net income
FY2015 Third Quarter Financial Results
 FY2015 Third Quarter Financial Results Mitsubishi Motors Corporation February 3, 2016 FY2015 Third Quarter Financial Results All-new Pajero Sport 1 FY2015 1-3Q Results Summary (vs. FY2014 1-3Q) Increase
Review of Operations 6.1% 12.3% 13.4% 72.0% 2.3% page 13. page 19. page 16. page 21. Power Product and Other Businesses. Automobile Business
 2 Review of Operations Motorcycle Business page 3 Automobile Business page 6 Power Product and Other Businesses page 9 Financial Services Business page 2 Sales Revenue (millions) External customers,76,65
FISCAL YEAR END MARCH 2013 FIRST QUARTER FINANCIAL RESULTS
 FISCAL YEAR END MARCH 213 FIRST QUARTER FINANCIAL RESULTS New MAZDA CX-5 Mazda Motor Corporation July 31, 212 1 PRESENTATION OUTLINE Highlights Fiscal Year End March 213 Results Update of Structural Reform
Mazda Motor Corporation June 17, 2011
 FY ENDING MARCH 2012 FINANCIAL FORECAST New MAZDA Demio 13-SKYACTIV Mazda Motor Corporation June 17, 2011 1 PRESENTATION OUTLINE FY ending March 2012 Forecast Updates of Framework for Medium- and Long-term
FY2013 First Quarter Financial Results
 First Quarter Financial Results A new variant has been added to the Swift, which combines the fun of driving and fuel efficiency at high level. Equipped with a newly-developed Dual Jet Engine, which combines
FISCAL YEAR ENDED MARCH 2011 FINANCIAL RESULTS
 FISCAL YEAR ENDED MARCH 211 FINANCIAL RESULTS Mazda Motor Corporation April 28, 211 Mazda MINAGI 1 PRESENTATION OUTLINE Highlights Fiscal Year Ended March 211 Results In Summary Question & Answer Session
SUZUKI MOTOR CORPORATION 3 August 2011
 First Quarter Financial Results Suzuki achieves two million total accumulated automobile production volume in Magyar Suzuki in Hungary SUZUKI MOTOR CORPORATION 3 August 2011 Consolidated: Financial Summary
FY 2006 Third Quarter Review
 FY 26 Third Quarter Review February 2, 27 Nissan Motor Co., Ltd 1 Agenda Third quarter news update Sales performance Financial results FY6 Outlook Sustainable growth 2 Third quarter news update Oct 1)
FISCAL YEAR MARCH 2015 FINANCIAL RESULTS. New Mazda CX-3 (Japanese specification model)
") FISCAL YEAR MARCH 2015 FINANCIAL RESULTS New Mazda CX-3 (Japanese specification model) Mazda Motor Corporation April 24, 2015 1 PRESENTATION OUTLINE Highlights Fiscal Year March 2015 Results Fiscal Year
FISCAL YEAR MARCH 2015 FINANCIAL RESULTS New Mazda CX-3 (Japanese specification model) Mazda Motor Corporation April 24, 2015 1 PRESENTATION OUTLINE Highlights Fiscal Year March 2015 Results Fiscal Year
Nissan Motor Co., Ltd. February 12 th, 2019
 Nissan Motor Co., Ltd. February 12 th, 2019 NET REVENUE 2,875.5 3,045.7 OPERATING PROFIT *1 NET INCOME 301.6 FREE CASH FLOW (AUTO) NET CASH (AUTO) 1,311.4 1,334.4 US TAX REFORM 207.7 82.4 103.3 93.9 *2
FY2017 Third Quarter Financial Results. SUZUKI MOTOR CORPORATION 5 February 2018
 Third Quarter Financial Results SUZUKI MOTOR CORPORATION 5 February 2018 Third Quarter Highlights Page2 Third Quarter Results Consolidated Financial Results Higher earnings and sales, record-high sales
Mazda Motor Corporation FISCAL YEAR MARCH 2016 FIRST HALF FINANCIAL RESULTS (Speech Outline)
") (For your information) November 5, 2015 Mazda Motor Corporation FISCAL YEAR MARCH 2016 FIRST HALF FINANCIAL RESULTS (Speech Outline) Representative Director Executive Vice President Akira Marumoto 1. HIGHLIGHTS
(For your information) November 5, 2015 Mazda Motor Corporation FISCAL YEAR MARCH 2016 FIRST HALF FINANCIAL RESULTS (Speech Outline) Representative Director Executive Vice President Akira Marumoto 1. HIGHLIGHTS
FY16 results. Business updates. FY17 outlook. Nissan Motor Co., Ltd. May 11 th, 2017
 Nissan Motor Co., Ltd. May 11 th, 2017 results Business updates FY17 outlook www.nissan-global.com Copyright NISSAN MOTOR CO., LTD. All rights reserved. 2 (TSE REPORT BASIS CHINA JV EQUITY BASIS) NET REVENUE
FY17 RESULTS BUSINESS UPDATES FY18 OUTLOOK. Nissan Motor Co., Ltd. May 14 th, 2018
 Nissan Motor Co., Ltd. May 14 th, 2018 RESULTS BUSINESS UPDATES FY18 OUTLOOK www.nissan-global.com Copyright NISSAN MOTOR CO., LTD. All rights reserved. 2 GLOBAL 91.81 5.08 TIV * 1 vs. 93.52 GLOBAL +1.9%
FISCAL YEAR END MARCH 2012 FINANCIAL RESULTS. Mazda TAKERI
 FISCAL YEAR END MARCH 212 FINANCIAL RESULTS Mazda TAKERI Mazda Motor Corporation April 27, 212 1 PRESENTATION OUTLINE Highlights FY End March 212 Results FY End March 213 Forecast Summary Progress Toward
April 27, 2012 (For your information) Mazda Motor Corporation FISCAL YEAR ENDING MARCH 2012 FINANCIAL RESULTS (Speech Outline)
 Mazda Motor Corporation FISCAL YEAR ENDING MARCH 2012 FINANCIAL RESULTS (Speech Outline)") April 27, 2012 (For your information) Mazda Motor Corporation FISCAL YEAR ENDING MARCH 2012 FINANCIAL RESULTS (Speech Outline) Representative Director, Chairman of the Board, President and CEO Takashi
April 27, 2012 (For your information) Mazda Motor Corporation FISCAL YEAR ENDING MARCH 2012 FINANCIAL RESULTS (Speech Outline) Representative Director, Chairman of the Board, President and CEO Takashi
1 Copyright(C) 2012 Isuzu Motors Limited All rights reserved
 2012 Isuzu Motors Limited All rights reserved") FY2013 H1 Financial Results November 7, 2012 1 Copyright(C) 2012 Isuzu Motors Limited All rights reserved Contents Ⅰ. President and Representative Director : Susumu Hosoi :FY2013 H1 Financial Summary Outline
FY2013 H1 Financial Results November 7, 2012 1 Copyright(C) 2012 Isuzu Motors Limited All rights reserved Contents Ⅰ. President and Representative Director : Susumu Hosoi :FY2013 H1 Financial Summary Outline
FY2017 Second Quarter Financial Results. SUZUKI MOTOR CORPORATION 2 November 2017
 Second Quarter Financial Results SUZUKI MOTOR CORPORATION 2 November 2017 Second Quarter Highlights Page2 Second Quarter Results Consolidated Financial Results Higher earnings and sales, record-high sales
1 Copyright(C) 2012 Isuzu Motors Limited All rights reserved
 2012 Isuzu Motors Limited All rights reserved") FY2012 Financial Results May 10, 2012 1 Copyright(C) 2012 Isuzu Motors Limited All rights reserved Contents Ⅰ. President and Representative Director : Susumu Hosoi FY2012 Overview Ⅱ. Director Director
FY2012 Financial Results May 10, 2012 1 Copyright(C) 2012 Isuzu Motors Limited All rights reserved Contents Ⅰ. President and Representative Director : Susumu Hosoi FY2012 Overview Ⅱ. Director Director
FY 2010 first-half financial results
 FY 2010 first-half financial results November 4, 2010 Nissan Motor Co., Ltd. first-half financial results Key performance indicators: Financial results (billion yen) Net revenue Operating profit Net income
Third Quarter Results (ended December 31, 2014)
") Fiscal Year 214 (ending March 31, 215) Third Quarter Results (ended December 31, 214) Brother Industries, Ltd. February 4, 215 Information on this report, other than historical facts, refers to future
Fiscal Year 214 (ending March 31, 215) Third Quarter Results (ended December 31, 214) Brother Industries, Ltd. February 4, 215 Information on this report, other than historical facts, refers to future
Results for the Three Months ended June 30, 2018
 Reference Translation Results for the Three Months ended June 30, 2018 July 31, 2018 AUTOBACS SEVEN CO., LTD. FY March 2019 Consolidated P/L Profit Loss/Gain: Net sales and gross profit decreased, and
Third Quarter Results (ended December 31, 2013)
") Fiscal Year 213 (ending March 31, 214) Third Quarter Results (ended December 31, 213) Brother Industries, Ltd. February 4, 214 Information on this report, other than historical facts, refers to future
Fiscal Year 213 (ending March 31, 214) Third Quarter Results (ended December 31, 213) Brother Industries, Ltd. February 4, 214 Information on this report, other than historical facts, refers to future
Meeting Materials for FY2011
 Meeting Materials for FY2011 (Year ended March 31, 2012) May 17, 2012 Masao Usui Representative Director, President Executive Officer KYB Corporation Meeting Materials for FY2011 May 17, 2012, KYB Corporation
Mazda Motor Corporation FISCAL YEAR MARCH 2019 SECOND QUARTER FINANCIAL RESULTS (Speech Outline)
") (For your information) October 31, 2018 Mazda Motor Corporation FISCAL YEAR MARCH 2019 SECOND QUARTER FINANCIAL RESULTS (Speech Outline) Tetsuya Fujimoto Managing Executive Officer in charge of Finance
(For your information) October 31, 2018 Mazda Motor Corporation FISCAL YEAR MARCH 2019 SECOND QUARTER FINANCIAL RESULTS (Speech Outline) Tetsuya Fujimoto Managing Executive Officer in charge of Finance
Masao Usui, Meeting Materials for First-half of FY2011 and Business Outlook November 15, 2011 KYB Corporation
 Meeting Materials for First-half of and Business Outlook November 15, 2011 KYB Corporation Masao Usui, Representative Director, President Executive Officer Meeting Materials for First-half of and Business
HONDA CANADA FINANCE INC. AUTO FINANCE FORUM February 15, ACCORD
 HONDA CANADA FINANCE INC. AUTO FINANCE FORUM February 15, 2018 2018 ACCORD 1 Caution with Respect to Forward-Looking Statements: These slides contain forward-looking statements within the meaning of the
Business Results for the Fiscal Year ended December 2012
 Business Results for the Fiscal Year ended December 2012 Jorge Lorenzo, 2012 MotoGP Champion Yamaha Motor Co., Ltd. 14 February 2013 Agenda Consolidated Business Results for the Fiscal Year ended December
FY16 results. Business updates. FY17 outlook. Nissan Motor Co., Ltd. May 11 th, 2017
 Nissan Motor Co., Ltd. May 11 th, 2017 results Business updates FY17 outlook www.nissan-global.com Copyright NISSAN MOTOR CO., LTD. All rights reserved. 2 (TSE REPORT BASIS CHINA JV EQUITY BASIS) 12,189.5
FY2012 First Half Results
 0 FY2012 First Half Results new Outlander Mitsubishi Motors Corporation October 30, 2012 1 Summary of FY2012 First Half Results and FY2012 Shuichi Aoto Managing Director Head Officer of the Headquarters
ANALYST BRIEFING FOR THE FOURTH QUARTER ENDED FEBRUARY 2017
 ANALYST BRIEFING FOR THE FOURTH QUARTER ENDED 2016 22 FEBRUARY 2017 MSM Malaysia Holdings Berhad Analyst Briefing Q4 2016 22/2/2017 1 CONTENTS 01 02 03 04 05 Group Financial Highlights Performance Review
FY17 RESULTS BUSINESS UPDATES FY18 OUTLOOK. Nissan Motor Co., Ltd. May 14 th, 2018
 Nissan Motor Co., Ltd. May 14 th, 2018 RESULTS BUSINESS UPDATES FY18 OUTLOOK www.nissan-global.com Copyright NISSAN MOTOR CO., LTD. All rights reserved. 2 GLOBAL 91.81 5.08 TIV * 1 vs. 93.52 GLOBAL +1.9%
FY st Quarter Business Results. The Yamaha booth at the Japan International Boat Show 2013
 FY2013 1 st Quarter Business Results The Yamaha booth at the Japan International Boat Show 2013 Yamaha Motor Co., Ltd. 14 May, 2013 Agenda FY2013 1 st Quarter Business Results Outline Ryoichi Sumioka Senior
282m 75% +575m. Net sales Operating income before non-recurring items. Operating margin before non-recurring items. Net Loss.
 First-Half 2009 Financial Highlights Net sales Operating income before non-recurring items Operating margin before non-recurring items Net Loss Net debt-to-equity ratio Free cash flow** 7,134m 282m 4.0%
February Annual Results February 13, 2008
 February 2008 1 Annual Results February 13, 2008 AGENDA AGENDA 2007 Highlights 2007 Financial Results x Competitiveness Sales and products dynamic International 2008 Outlook February 2008 2 2007: performance
Interim results June 30, 2003
 1 Interim results June 30, 2003 2 In units W orldwide sales at June 30 (cars and light commercial vehicles) > Worldwide sales at June 30, 2003: 1,689,200 cars and light commercial vehicles, versus 1,656,900
Fiscal Year 2015 Financial Results
 Fiscal Year 2015 Financial Results Nissan Motor Co., Ltd May 12, 2016 results FY16 outlook 2 Key performance indicators: financial results (TSE report basis - China JV Equity basis) Net revenue Operating
FY2012. H1 Financial Results. November 8, Copyright(C) 2011 Isuzu Motors Limited All rights reserved
 2011 Isuzu Motors Limited All rights reserved") FY2012 H1 Financial Results November 8, 2011 1 Copyright(C) 2011 Isuzu Motors Limited All rights reserved Ⅰ. President and Representative Director : Susumu Hosoi :FY2012 H1 Financial Summary Outline Ⅱ.
FY2012 H1 Financial Results November 8, 2011 1 Copyright(C) 2011 Isuzu Motors Limited All rights reserved Ⅰ. President and Representative Director : Susumu Hosoi :FY2012 H1 Financial Summary Outline Ⅱ.
Earnings conference call Q4 & FY 2016
 Earnings conference call Q4 & FY 2016 Bo Annvik, CEO / Åke Bengtsson, CFO February 10, 2016 1 Agenda Business Highlights Market Update Sales Financials Way forward 2 Business Summary FY 2016 A year with
EXANE BNP PARIBAS 13th European Seminar June 8, 2011
 EXANE BNP PARIBAS 13th European Seminar June 8, 2011 This presentation may contain forward-looking statements. Such forward-looking statements do not constitute forecasts regarding the Company s results
Record CY 2016 EPS-diluted-adjusted of $6.12, an increase of $1.10 Y-O-Y. Q EPS-diluted-adjusted of $1.28, a decrease of $0.11 Y-O-Y.
 1 2 3 Q4 2016 global deliveries up 0.1 million units year-over-year (Y-O-Y), a 3.3% increase. Volume gains primarily in North America and China, offset by reductions in International Operations (excluding
FY H1 Financial Results
 FY2011 1 H1 Financial Results November 8, 2010 1 Copyright(C) 2010 Isuzu Motors Limited All rights reserved Contents Ⅰ. President and Representative Director : Susumu Hosoi :FY2011 H1 Financial Summary
Volvo Group THIRD QUARTER 2015 JAN GURANDER. Volvo Group Headquarters Third quarter
 Volvo Group THIRD QUARTER 2015 JAN GURANDER 1 VOLVO GROUP Third quarter highlights NET SALES SEK bn 12 months 310 bn IMPROVED PROFITABILITY ON FLAT VOLUMES UNDERLYING OPERATING MARGIN 6.9% 67 73 OPERATING
FY2008 3Q Financial Results Apr. Dec. 07 / Oct. Dec. 07. FY2008 3Q Financial Results
 FY2008 3Q Financial Results FY2008 3Q Financial Results Apr. Dec. 07 / Oct. Dec. 07 February 7, 2008 1 Copyright(C) 2008 Isuzu Motors Limited All rights reserved 1. FY2008 3Q Highlight Director: MASANORI
FY2016 Third Quarter consolidated financial highlights
 FY2016 Third Quarter consolidated financial highlights pages Ⅰ. Overview of Consolidated Results Ⅱ. Q3 and YTD FY2016 Consolidated Financial Results Summary Ⅲ. and Net by Product / Sanwa Shutter 1 2 4
Consolidated Financial Results for 1Q FY2016 July 29, 2016 Fuji Electric Co., Ltd.
 Consolidated Financial Results for 1Q FY2016 July 29, 2016 Fuji Electric Co., Ltd. 2016Fuji Electric Co., Ltd. All rights reserved. 1 Summary of Consolidated Financial Results for 1Q FY2016 (YoY Comparison)
Earnings conference call Q3 2016
 Earnings conference call Q3 2016 Bo Annvik, CEO / Åke Bengtsson, CFO October 25, 2016 1 Agenda Business Highlights Market Update Sales Financials Outlook Public offer 2 Business Highlights Q3 2016 Solid
Financial Results for First Quarter of FY2015
 Financial Results for First Quarter of FY2015 (From April 1, 2014 to June 30, 2014) July 29, 2014 Hino Motors, Ltd. 1. Sales Turnover 2/15 Global Unit Sales (Retail Sales) 3/15 Sales Sales decreased decreased
TOFAŞ Q ANALYST PRESENTATION
 TOFAŞ Q1 2016 ANALYST PRESENTATION 03.05.2016 1 2016 Q1 AGENDA Highlights Turkish Automotive Industry Production & Capacity Utilization Domestic Market Developments Tofaş Domestic Market Performance Export
Conférence d Automne - Cheuvreux. Paris, September 26 th, 2011
 Conférence d Automne - Cheuvreux Paris, September 26 th, 2011 This presentation may contain forward-looking statements. Such forward-looking statements do not constitute forecasts regarding the Company
New Medium-term Management Plan: Key Business Strategies
 Special Report 1 New Medium-term Management Plan: Key Business Strategies Motorcycle Business in Developed Nations (Japan, North America and Europe) Reforming the Structure to Enable Profitability and
Q3 report Joakim Olsson CEO and President October 24, Innovative Vehicle Technology
 Q3 report 2008 Joakim Olsson CEO and President October 24, 2008 Innovative Vehicle Technology 2008-10-24 Summary YTD 2008 Orders Received of 6 401 MSEK (6 077) Currency adjusted orders increased with 9
HONDA CANADA FINANCE INC. AUTO FINANCE FORUM February 13, 2014 First Canadian Place, 68 th Floor, York Room Honda Fit
 HONDA CANADA FINANCE INC. AUTO FINANCE FORUM February 13, 2014 First Canadian Place, 68 th Floor, York Room 2015 Honda Fit 1 Caution with Respect to Forward-Looking Statements: These slides contain forward-looking
July 27, Copyright(C) 2006 Isuzu Motors Ltd. All rights reserved. FORWARD-New Long Term Emission version. ELF-CNG version
 2006 Isuzu Motors Ltd. All rights reserved. FORWARD-New Long Term Emission version. ELF-CNG version") ELF-CNG version FORWARD-New Long Term Emission version 2.5L/3.0L Super Clean & Economy Diesel Isuzu D-MAX GIGA-New Long Term Emission version July 27, 2006 1 Copyright(C) 2006 Isuzu Motors Ltd. All rights
ELF-CNG version FORWARD-New Long Term Emission version 2.5L/3.0L Super Clean & Economy Diesel Isuzu D-MAX GIGA-New Long Term Emission version July 27, 2006 1 Copyright(C) 2006 Isuzu Motors Ltd. All rights
ANALYST BRIEFING FOR THE THIRD QUARTER ENDED NOV 2016
 ANALYST BRIEFING FOR THE THIRD QUARTER ENDED 2016 21 NOV 2016 MSM Malaysia Holdings Berhad Analyst Briefing Q3 2016 21/11/2016 1 CONTENTS 01 02 03 04 05 Group Financial Highlights Performance Review Sugar
Kongsberg Automotive ASA. Fourth quarter February 28, 2019
 Kongsberg Automotive ASA Fourth quarter - February 28, 2019 Highlights Q4 Sales Revenues grew by 21 (7.3%) YoY to 288 including negative FX effects of 1. We booked new business with 77 in expected annual
Q Analyst Teleconference. 9 August 2018
 9 August 218 Disclaimer This presentation contains forward-looking statements that reflect the Company management s current views with respect to certain future events. Although it is believed that the
Accounting Overview for 2 nd Quarter of FY2014
 1/15 Accounting Overview for 2 nd Quarter of FY2014 October 29, 2013 Yasuhiko Ichihashi President, Member of Board Hino Motors, Ltd. Photos: Vehicles scheduled to be on display at 43rd Tokyo Motor Show
I m Tetsuji Yamanishi, Corporate Officer at TDK. Thank you for taking the time to attend TDK s performance briefing for the fiscal year ended March
 I m Tetsuji Yamanishi, Corporate Officer at TDK. Thank you for taking the time to attend TDK s performance briefing for the fiscal year ended March 2016. I will be presenting an overview of our consolidated
FY2017 Third Quarter consolidated financial result highlights
 FY2017 Third Quarter consolidated financial result highlights pages Ⅰ. Ⅱ. Ⅲ. Overview of Consolidated Financial Results Summary of Consolidated Q3 FY2017 Financial Results Forecast of FY2017 Consolidated
1959 March Production commences at Yulon Motor Co., Ltd. in Taiwan, the Company s first overseas KD factory.
 Corporate History 1980 July Nissan Motor Manufacturing Corporation U.S.A. is established. 1933 1940 1935 April The first car manufactured by a fully integrated assembly system rolls off the line at the
2014FY 2 nd QTR. Nov. 5 th, Managing Director, Administration Seishi Kai
 204FY 2 nd QTR Financial i Result Overview Nov. 5 th, 204 Managing Director, Administration Seishi Kai -- New Vehicle Sales in Main Market 2 Alpine Topics 3 Financial Result Overview New Vehicle Sales
Financial Summary for 2Q-FY2017 And Projections for FY2017
 Financial Summary for 2Q-FY2017 And Projections for FY2017 1 INDEX 01 Financial Summary for 2Q-FY2017 02 Performance Forecast for FY2017 03 Topics 2 01 Financial Summary for 2Q-FY2017 3 01 Financial Summary
Cosmo Oil Co., Ltd. Presentation on Results for First Quarter of Fiscal 2012 August 2, 2012 Director: Satoshi Miyamoto
 Cosmo Oil Co., Ltd. Presentation on Results for First Quarter of Fiscal 2012 August 2, 2012 Director: Satoshi Miyamoto Copyright 2012 COSMO OIL CO.,LTD. All Rights Reserved. Key Points of Financial Results
BlueScope Steel Limited Consolidated Financial Headlines
 BlueScope Steel Limited Consolidated Financial Headlines 2003 2004 2005 2006 2007 2008 2009 2010 2011 2012 2013 2013 2013 2014 2014 2014 2015 2015 2015 2016 2016 2016 2017 2017 2017 2018 2018 2018 Total
Bernstein Strategic Decisions Conference 2018
 Bernstein Strategic Decisions Conference 2018 Forward-Looking Statements Certain statements in this presentation, other than statements of historical fact, including estimates, projections, statements
Financial Results for the 3rd Quarter Ended Dec. 31, 2005 < U.S. GAAP-based >
 Financial Results for the 3rd Quarter Ended Dec. 31, 25 < U.S. GAAP-based > February 1, 26 NIDEC CORPORATION www.nidec.co.jp/english/index.html Financial Results for the 3 rd Quarter Ended Dec. 31, 25
Strong performance by the Bolloré Group s operating activities in 2018 Mr Cyrille Bolloré unanimously appointed Chairman and Chief Executive Officer
 PRESS RELEASE 2018 results (1) March 14, 2019 Strong performance by the Bolloré Group s operating activities in 2018 Mr Cyrille Bolloré unanimously appointed Chairman and Chief Executive Officer Revenue:
Motorcycles. Overview of Operations
 Overview of Operations Operating Performance Motorcycles Motorcycle sales rose 88.9 billion in 2010, or 10.9, from 2009 to 906.0 billion, and accounted for 70.0 of net sales. Operating income grew 46.9
1 st Half Joakim Olsson CEO and President July 17, Innovative Vehicle Technology
 1 st Half 2009 Joakim Olsson CEO and President July 17, 2009 Innovative Vehicle Technology 2009-07-17 Summary 1st half 2009 Sales of SEK 2,971m (4,473) Adjusted for currency exchange rates, sales declined
RESILIENCE MBM RESOURCES BERHAD ( V) Analyst Briefing 24 August 2017
 Analyst Briefing 24 August 2017") RESILIENCE MBM RESOURCES BERHAD (284496-V) Analyst Briefing 24 August 217 1 1 DISCLAIMER The information and opinions contained in this presentation are provided as at the date of the document. Certain
RESILIENCE MBM RESOURCES BERHAD (284496-V) Analyst Briefing 24 August 217 1 1 DISCLAIMER The information and opinions contained in this presentation are provided as at the date of the document. Certain
BMW GROUP QUARTERLY REPORT. TO 30 SEPTEMBER 2014
 . BMW GROUP QUARTERLY REPORT. TO 30 SEPTEMBER 2014 THE BMW GROUP IS WELL ON TRACK AND PERFORMS IN LINE WITH THE GUIDANCE. The BMW Group is well on track to reach its targets for 2014. Full year guidance
Q3 & 9M 2018 Results Presentation. October 24 th, 2018
 Q3 & 9M 2018 Results Presentation October 24 th, 2018 Q3 & 9M HIGHLIGHTS & CATEGORY SPOTLIGHTS Gonzalve BICH 3Q and 9M 2018 Results Presentation 2 9 Months 2018 Key Messages Continued challenging trading
Meeting Materials for First-Half of FY2017 Summary, Business Outlook and Financial Information
 Meeting Materials for First-Half of FY2017 Summary, Business Outlook and Financial Information November 10, 2017 KYB Corporation (Stock Code: 7242; First Section of Tokyo Stock Exchange) 1 Contents Summary
1 st Half 2018 Results. August 1 st, 2018
 1 st Half 2018 Results August 1 st, 2018 H1 HIGHLIGHTS & CATEGORY SPOTLIGHTS Gonzalve BICH 2 First Half 2018 Key Messages Challenging market and business environment Continued investment in targeted Brand
Automotive Market: Where Do We Go From Here?
 Automotive Market: Where Do We Go From Here? June, 3 rd 211 Federal Reserve Bank of Chicago Eighteenth Annual Automotive Outlook Symposium Jeff Schuster Executive Director, Forecasting and Analysis jeff.schuster@jdpa.com
JAGUAR LAND ROVER RESULTS FOR THE THREE MONTHS ENDED 31 DECEMBER th FEBRUARY 2017
 JAGUAR LAND ROVER RESULTS FOR THE THREE MONTHS ENDED 31 DECEMBER 2016 14 th FEBRUARY 2017 DISCLAIMER Statements in this presentation describing the objectives, projections, estimates and expectations of
Third quarter AB Volvo
 Third quarter 2013 Third quarter 2013 TRUCKS EUROPE Excellent reception of the new products decision to optimize manufacturing Highlights in Commercial launch of the new product ranges Strong order situation
Earnings conference call. Q4 and Full year 2015
 Earnings conference call Q4 and Full year 2015 Bo Annvik, CEO / Åke Bengtsson, CFO 11 February 2016 1 Agenda Business Highlights Market Update Sales Financials Outlook 2 2015 in numbers Operating margin
I remind you that our presentation is available on our website. We can start from the first 2 slides that show Piaggio Group First
 CONFERENCE CALL 2009 1 st HALF RESULTS Good afternoon and welcome to everybody. I remind you that our presentation is available on our website. We can start from the first 2 slides that show Piaggio Group
Q3 Results November 16, 2006 Analyst Presentation
 Q3 Results 2006 November 16, 2006 Analyst Presentation Group Sales (in million Euro) Total Sales 2,395 +3.3% (+2.4%)* 2,474 Split per Business Group (YTD) Specialty Products 7% Q3 797 +1.0% (+2.5%)* 805
Financial Information Details
 FY2012, Year Ended March 31, 2013 Financial Information Details Financial Results (Consolidated) 1 Cash-Flows (Consolidated) 2 Subsidiaries 3 Financial Results of Major Subsidiaries,Other Financial Data
FY2018 Financial Results Digest
 This material includes the comments and the reference data based on FY2018 Financial Results. FY2018 Financial Results Digest February 2019 Financial Results Highlight for 2018 Alcohol Beverages Business