Capacity Analysis of the Union Station Rail Corridor using Integrated Rail and Pedestrian Simulation
|
|
|
- Valerie Dennis
- 6 years ago
- Views:
Transcription
1 Capacity Analysis of the Union Station Rail Corridor using Integrated Rail and Pedestrian Simulation Yishu Pu MASc Student Department of Civil Engineering University of Toronto
2 Presentation Outline Introduction Railway Capacity Approaches Toronto Union Station Rail Corridor Data Analytical Capacity Methods Railway Simulation Integrated Rail and Pedestrian Simulation Nexus Scenario Tests and Results Conclusion 2
3 Introduction 3


4 Motivation Growing train traffic at existing railway network Platform crowding and limited platform space Increased train arrivals could affect platform density while extended dwell time could delay train departures Whether the infrastructure could support the anticipated service expansion (i.e. RER) Comprehensive capacity analysis of a complex station area is necessary to identify the bottleneck 4
5 Railway Capacity Approaches 5
6 Railway System Capacity Railway Passenger Maximum number of trains for a specified time period over a defined section/area under certain service quality Maximum number of passengers for a specified time period over a defined section/area under certain service quality 6
7 Railway Capacity Article Name Author Year Type An analytical approach for the analysis of railway nodes extending the Schwanhäußer s method to railway stations and De Kort et al junctions UIC Code 406 1st edition International Union of Railways 2004 Techniques for absolute capacity determination in railways Burdett and Kozan 2006 Analytical Development of Base Train Equivalents to Standardize Trains Lai et al for Capacity Analysis Transit Capacity and Quality of Service Manual Kittelson & Associates, Inc. et al A synthetic approach to the evaluation of the carrying capacity of complex railway node Malavasi et al A Model, Algorithms and Strategy for Train Pathing Carey & Lockwood 1995 Optimal scheduling of trains on a single line track Higgins et al A Job-Shop Scheduling Model for the Single-Track Railway Optimization Oliveira and Smith 2000 Scheduling Problem UIC Code 406 2nd edition International Union of Railways 2013 An assessment of railway capacity Abril et al US & USRC Track Capacity Study AECOM 2011 Evaluation of ETCS on railway capacity in congested area : a case study within the network of Stockholm: A case study within Nelladal et al the network of Stockholm Simulation Simulation Study Based on OpenTrack on Carrying Capacity in District of Beijing-Shanghai High-Speed Railway Chen and Han 2014 Railway capacity analysis: methods for simulation and evaluation Lindfeldt of timetables, delays and infrastructure 2015 Problem: Results could vary largely due to different assumptions Few studies compared methods in different categories Virtually all dwell time is fixed (TCQSM, 2013) 7
8 Pedestrian Movements Traditional dwell time modeling Boarding/Alighting/Through passengers, Regression models (San & Masirin, 2016) Pedestrian Modelling Analytical modelling Simulation Problem Article Name Author Year Simulation Pedestrian planning and design Fruin 1971 Social force model for pedestrian dynamics Helbing & Molnár 1995 The Flow of Human Crowds Hughes 2003 Autonomous Pedestrians Shao and Terzopoulos 2007 Pedestrian Simulation Research of Subway Station in Special Events Zhao et al Legion Using Simulation to Analyze Crowd Congestion and Mitigation at Canadian Subway King et al MassMotion Interchanges Use of Agent-Based Crowd Simulation to Investigate the Performance of Large-Scale Intermodal Facilities Hoy et al MassMotion Traditional dwell time models can not show the platform density, or reflect the flow complication due to infrastructure layout Transit vehicle arrival/departure time is fixed Platform Train Car 8
9 Integrated Simulation Key assumptions for individual simulators: Fixed dwell time Fixed train arrival/departure time Current models: Rail simulation with mathematical dwell time model (Jiang et al., 2015) (D Acierno et al., 2017) Rail simulation with pedestrian simulation model (Srikukenthiran & Shalaby, 2017) 9
10 Problem Statement Few studies compared methods in different categories Interactive effects of pedestrian and train movements are not well captured by individual simulator? Train Movements Passenger Movements 10
11 Study approach Analytical Capacity Analysis (TCQSM, Potthoff method, DB method, Compression method) Railway Simulation OpenTrack Railway and Pedestrian Simulation Nexus Platform OpenTrack and MassMotion 11
12 Case Study - Toronto Union Station Rail Corridor (USRC) 12

13 Union Station Rail Corridor (USRC) Built and opened in ,000 square feet of total floor space 14 track depots, 23 platforms, 350m long and 5m wide on average Toronto s transportation hub for GO Transit, VIA Rail and UP Express; as well as TTC Canada s busiest transportation facility: 200,000 passengers pass through Union Station on most business day 155,000 GO Train passengers and 10,000 bus passengers on a typical business day 208 daily GO Train trips 43 million annual passengers for GO train and bus 20 million annual passengers for TTC 2.4 million annual passengers for VIA 13
14 Scope Study time period: 8am to 9am One station away on any rail service Assume unlimited capacity at yards and through movements at the station Focus on maximum number of GO train trips during peak hour 14
15 Data 15

16 Required Data Infrastructure data Track layout Signal location Station layout Operational data Speed limit Train profile and configuration Schedule Delay data Ridership Passenger flow 16
")


17 Manual Data Collection Train Speed (GPS) Commonly-used Train Path Identification (Video Recording) Entry Delay at prior stations and Arrival Delay at Union Station (gotracker.ca) 17


18 Manual Data Collection Platform Staircase Passenger Volume Count Passenger Flow Count at Train Door Dwell Time 18
19 Analytical Capacity Methods 19
20 Analytical Methods Transit Capacity and Quality of Service Manual (TCQSM) Potthoff method Deutsche Bahn (DB) method UIC Compression Method 20
21 TCQSM Min. headway at Mainline minimum train separation + operating margin t cs = 2(L t + d eb ) a + a g G 0 + L t v a + 1 f br + b v a 2 2 t os + a + a gg 0 l v 1 v a 2 d + a g G i 2v a v max + t os + t jl + t br h ni = t cs + t om Min. headway at Station Area minimum train separation + critical station dwell time + operating margin h ni = t cs + t d,crit + t om Min. headway at Mainline with switches if a train is encountered with a switch blocking when traveling at main line h j = t cs + 2(L t + n f sa d ts ) a + v max a + d + t sw + t om 21

22 TCQSM W. M. Line West Ladders/Interlocking Station Area East Ladders/Interlocking E. M. Line TCQSM Detailed calculation for line capacity, simple junction capacity calculation Need for methods calculating node capacity 22
23 Potthoff method and Deutsche Bahn (DB) method Assume trains could arrive at any instant of an assigned time period with the same probability Timetable not required Input: Identify all possible train paths in a system Summarize number of movements concerning each path (n i ) Path 1-I 1-II 1-IV 4-III 4-IV III-2 IV-2 I-3 II-3 IV-3 # of movements Matrix of occupancy time for conflicting movements (t ij ) Path 1-I 1-II 1-IV 4-III 4-IV III-2 IV-2 I-3 II-3 IV-3 1-I II IV III IV III IV I II IV Priority Matrix (DB method, Optional)
24 Capacity indicator Potthoff method B+R B: Total time of occupation R: Average delay T: Study period T 1 (over capacity if bigger than 1) Deutsche Bahn (DB) method L z = k P b x 2 usually = 0.6 ; T x B x 1 (over capacity if smaller than 1) L z : average number of trains in the waiting queue (to evaluate operation quality) k: Probability with which the movements relating to the complex node are mutually exclusive P b : Occupancy time considering priority x: Scale factor
25 Union Station Case Two complex interlocking areas located at west and east of the station Possible combination of routes could add up to and 24 identified commonly used train paths for west interlocking and east interlocking areas respectively Train paths shared by GO trains, VIA rail trains, and UP Express trains Some paths might be affected by the station dwell time
26 Matrices of occupancy time for conflicting movements West Interlocking (30 x 30) Path # - Excluded Path # - Actual (min) D2-SL2-UD14 D2-SL2-UD13 D1-SL2-UD13 D1-SL2-UD14 C2-NL2-UD12 C2-NL2-UD7 A1-NL2-UD7 C1-NL2-UD12 C1-NL2-UD7 C1-SL2-UD12 C2-SL2-UD12 C1-SL1-UD4 C1-NL2-UD6 A1-NL1-UPXS C2-NL1-UPXS UPXS-NL1-B D1-NL2-UD11 D1-NL2-UD10 UD11-NL2-A3 UD10-NL2-A3 UD2-SL1-NL1-B UD2-SL1-A2 UD1-NL1-A2 UD1-NL1-B UD3-SL1-A2 UD3-SL1-A2-NL2-B UD4-SL1-NL1-A2 UD4-A2-NL2-B UD5-A3-NL2-B UD5-A3-NL2-A2 1 D2-SL2-UD D2-SL2-UD D1-SL2-UD D1-SL2-UD C2-NL2-UD C2-NL2-UD A1-NL2-UD C1-NL2-UD C1-NL2-UD C1-SL2-UD C2-SL2-UD C1-SL1-UD C1-NL2-UD A1-NL1-UPXS C2-NL1-UPXS UPXS-NL1-B D1-NL2-UD D1-NL2-UD UD11-NL2-A UD10-NL2-A UD2-SL1-NL1-B UD2-SL1-A UD1-NL1-A UD1-NL1-B UD3-SL1-A UD3-SL1-A2-NL2-B UD4-SL1-NL1-A UD4-A2-NL2-B UD5-A3-NL2-B UD5-A3-NL2-A East Interlocking (24 x 24) Path # - Excluded Path # - Actual (min) E1-NL1-UD3 E1-NL1-UD4 E1-NL1-UD2 E1-NL1-UD1 E2-NL1-UD3 E4-NL1-UD3 E3-NL1-UD3 E3-NL1-UD5 E3-NL1-UD2 E3-NL1-UD4 E4-NL1-UD2 UD13-JL-E5 UD14-JL-E5 UD12-JL-E5 UD12-JL-E6 UD7-SL1-E5 UD7-SL1-E6 UD6-SL1-E5 UD6-SL1-E6 UD13-JL-E6 UD14-JL-E6 E4-SL2-UD11 UD11-SL2-E5 E4-NL1-UD4 1 E1-NL1-UD E1-NL1-UD E1-NL1-UD E1-NL1-UD E2-NL1-UD E4-NL1-UD E3-NL1-UD E3-NL1-UD E3-NL1-UD E3-NL1-UD E4-NL1-UD UD13-JL-E UD14-JL-E UD12-JL-E UD12-JL-E UD7-SL1-E UD7-SL1-E UD6-SL1-E UD6-SL1-E UD13-JL-E UD14-JL-E E4-SL2-UD UD11-SL2-E E4-NL1-UD
27 Potthoff method and Deutsche Bahn method Result for at capacity: Capacity parameters: Potthoff Method: Potthoff n_med T t_med B(min) U20h Sum of Rij R (Sum of Rij/n_med) (B+R)/T W.I E.I Deutsche Bahn Method: DB K E(t) B h Er Lz T Pb x W.I E.I # of GO trains: Method Total LSW LSW_E LSE LSE_E MI KI RH BA ST Potthoff DB


28 Compression Method Introduction Blocking Time Model Compression Method on a uni-directional track section before and after compression
29 Procedure Identify all possible train paths in an interlocking area A full n n matrix is set up by listing the actual path against all excluded paths. The value in the specific cell means how long the train that is taking the excluded train path has to wait when the actual train path is being taken (Matrix of occupation time for conflicting paths) Actual Trip i (min) pa pb ap af fb fa bf bp pa pb ap af fb fa bf bp Provide a sequence of paths as in the timetable min Route pb pa fb Order Calculate the occupancy time based on the path sequence and exclusion matrix Begin of Order Trip pa pb ap af fb fa bf bp occupation 1 pb = = = pa 1.4 */1.4 */1.4 */1.4 */0 */0 =3.1 =2.8 =3.1 = =1.7+2 = = = fb 1.7 */3.1 */1.4 */0 =4.1 =3.7 =4.1 =3.7 =3.7
30 Rules Each route-occupation starts, considering the sequence of trains, as soon as possible after the preceding route regarding the referring exclusion time The total of all occupation times results as the sum of the excluding times of concatenated routes Possible simultaneous train movements on parallel routes are considered Insert the first trip at the bottom of the calculation table again (last trip). Hence there is no open end Occupancy Time Rate (OTR) calculation: Additional Time Rate (ATR): Capacity Consumption (CC) value: Occupancy Time Rate % = Ocupancy Time Defined Time Period 100% 100 Additional Time Rate % = [ 1] 100 Occupancy Time Rate Capacity Consumption % = Occupancy Time (1 + Additional Time Rate) 100 Defined Time Period Concatenation rate: φ: φ Concatenation Rate = K Z 100%

31 Procedure to insert trains Main assumptions: All trains have through movements Uniform headway at every depot
32 Results for capacity analysis Capacity Indicators Critical Indicator Max. Train Volume Evaluating Capacity based on CC Evaluating Capacity based on OTR Indicator West Interlocking East Interlocking West Interlocking East Interlocking Occupancy Time Rate (OTR) 73% 85% 85% 99% Concatenation Rate 17% 47% 29% 42% Additional Time Rate 215% 87% 215% 87% Capacity Consumption (CC) 34% 98% 39% 113% # of Trains compared against other methods
; x <=1 (DB) Method Capacity West East Indicator Interlocking")

33 Effect of adding 1 trip *Threshold for exceeding capacity: (B+R)/T>=1 (Potthoff); x <=1 (DB) Method Capacity West East Indicator Interlocking Interlocking Potthoff (B+R)/T DB x Compression OTR 73% 85% CC 34% 98% Add 1 VIA trip West Interlocking East Interlocking % 85% 34% 98%
34 Discussion Potthoff and DB: timetable not required; highly averaged results Compression Method: timetable required; determined by the maximum occupancy of all train paths within the same section; possible to maximize the capacity with careful scheduling on a timetable Both require a matrix of occupancy time for conflicting paths: only a pair of paths needs to be evaluated for conflicts size of the matrix grows exponentially with the increase of possible train paths System stochasticity not considered
35 Railway Simulation 35
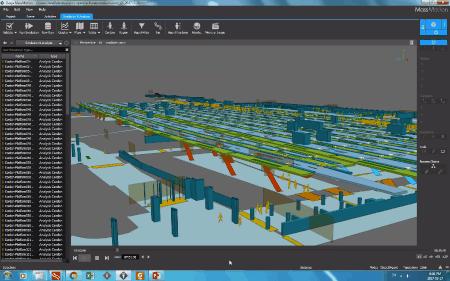
36 Railway Simulation Simulation tools are recommended to analyze complex railway infrastructure General procedure for simulation: Data collection Model construction Model calibration Model validation OpenTrack was selected as the railway simulator 36
 Expansion network including express stations 37")
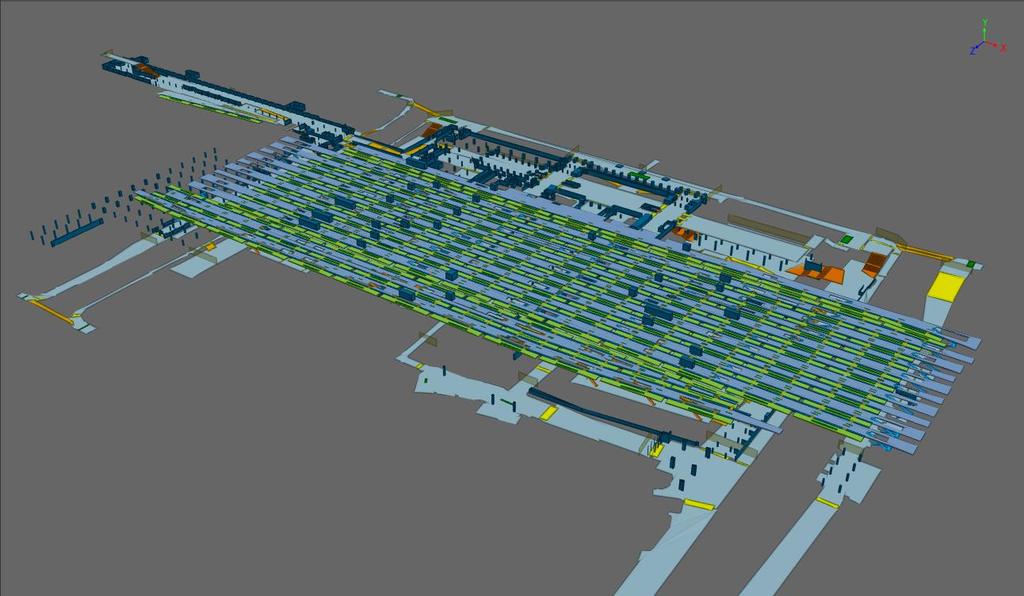
37 Model Construction Main network (including maintenance yards) Expansion network including express stations 37
38 Model Input Infrastructure layout Speed limits Train configurations (locomotive, rolling stock) Schedules Entry delay distributions 38

39 Entry Delay Distribution Gotracker.ca Weibull Lognormal Exponential Normal Lognormal Exponential Lognormal Lognormal

40 Simulation Flow Chart
41 Performance Evaluation Result evaluation: Simulated On-time Performance (SOTP) SOTP = Simulated Average Delay # of trips arrive within a specified range of schedule time total # of trips scheduled 100% GO Transit s target On-time performance (OTP): 95% OTP from data collection: 96.4%

42 Base model calibration and validation
43 SOTP Averaged Arrival Delay at Union (min) Sensitivity Result 100% 90% % 70% 60% 50% 40% 30% % Total Train Volume Method Total # of Trains LSW LSW_E LSE LSE_E KI MI BA RH ST OpenTrack LSW: Lakeshore West Line LSW_E: Lakeshore West Express LSE: Lakeshore East Line LSE_E: Lakeshore East Express KI: Kitchener Line MI: Milton Line BA: Barrie Line RH: Richmond Hill Line ST: Stouffville Line SOTP 95% Threshold Simulated Average Arrival Delay
44 Discussion LSW LSW_E LSE LSE_E MI KI RH BA ST Method Total Lakeshore West Lakeshore East Lakeshore West Lakeshore East Milton Kitchener Richmond Barrie Stouffville (Express) (Express) Hill Current Schedule Potthoff DB Compression (OTR) Compression (CC) OpenTrack OpenTrack offers a more realistic result by taking the stochasticity into consideration as it attempts to simulate the real-world operation The result of between OpenTrack and Compression Method with OTR confirms that practical capacity is around 60% to 75% of the theoretical capacity from the previous research (Kraft, 1982) Method Total Trains LSW LSW_E LSE LSE_E KI MI BA RH ST Compression (OTR) OpenTrack Ratio (%) 71% 67% 71% 67% 67% 80% 83% 67% 57% 83%
45 Problems Dwell time was fixed at 5 minutes Only focus on train movements on the railway Pedestrian flow on the platform level could be complicated due to the platform layout and barriers The interactive effect between train and pedestrian movements was not captured 45
46 Integrated Rail and Pedestrian Simulation - Nexus 46
47 Nexus 47

48 Dwell Time Components Dwell Time Segment 1 Segment 2 Segment 3 Segment 4 Arrival Time Doors Open Last Passenger Exits Doors Close Departure Time Lost Time Passenger Flow Time MassMotion Lost Time Statistical Analysis Internal Departure Schedule Assume a fixed value of 2 minutes 48
49 Alighting Behavior Observation at Union 49
50 Problem Statement The unique behavior would influence the density and crowding on the platform differently The time that last passenger exit the train would affect the departure time of the train, especially for trains that become out of service after they arrive at Union, as trains cannot leave if passengers are still on board Traditional Passenger flow time modeling cannot represent both effects properly (Total passenger flow time and density) 50
51 Method Main Idea: represent the observed alighting curve with two linear lines with different flow rates Each record of train door passenger count is studied, break point is selected based on visual inspection; linear regression is performed on the resulting segment a and segment b respectively; R 2 values for the slopes of both lines are examined ρ f a f b Variables Extracted: Total passengers: TP Turning point (%): ρ Passengers in segment a: TP a Flow rate in segment a: f a Passengers in segment b: TP b Flow rate in segment b: f b
52 Data Analysis Statistical analysis for ρ, f a, f b Correlation analysis Total_Psg Total_Psg_seg_a Turning_Point Seg_a_Flow_Rate Psg_seg_b Seg_b_Flow_Rate Total_Psg 1 Total_Psg_seg_a Turning_Point Seg_a_Flow_Rate Psg_seg_b Seg_b_Flow_Rate
53 Model Proposed Cumulative passenger volume TP (Input) ρ (Distribution) f b (Linear relationship) f b = TP b = TP (1 ρ) f a (Distribution) T Time Alternative Observed Model Avg. total time (sec) Max. Total time (sec)
54 Pedestrian Simulation MassMotion 54
55 Model Calibration Calibration: adjust queue cost at certain areas adjust wait cost alter agent characteristics (i.e. body radius and direction bias) GEH statistical method compare observed and simulated traffic/pedestrian volumes at links (staircases) Visual inspection G H = 2(m c)2 m + c 55

56 Model Calibration and Validation Validation 56


57 Nexus 57
58 Model Input Individual simulation models (MassMotion, OpenTrack) General Transit Feed Specification dataset (GTFS) Complete list of agents with OD itinerary 58

59 Simulation Flow Chart 59

60 Model calibration and validation 60
61 Evaluating System Performance Simulated On-time Performance (SOTP, %) Simulate average arrival delay at Union (min) Average dwell time (min) Hourly inbound and outbound passenger volume (Person) Average percentage of inbound and outbound passengers per second at LOS F (%) Average duration at LOS F for each inbound and outbound passenger (Sec) LOS Platforms (queueing) Stairways Density (person/m 2 ) Space (m 2 /person) Density (person/m 2 ) Space (m 2 /person) A x<=0.826 x>1.21 x<=0.541 x>=1.85 B 0.826<x<= >x>= <x<= >x>=1.39 C 1.075<x<= >x>= <x<= >x>=0.93 D 1.538<x<= >x>= <x<= >x>=0.65 E 3.571<x<= >x>= <x<= >x>=0.37 F 5.263<x 0.19>x 2.702<x 0.37>x 61
62 Scenario Tests 62
63 Scenario Tests OpenTrack Sensitivity Test: 39 trains, 5 min dwell time OpenTrack Model Train Schedule NEXUS MassMotion Model Population File P = T N c P c (PHF) Person Capacity: Peak Hour Factor (PHF) 39 trains/h 12 Cars/Train 162 seats standees/car 63

64 Scenario Tests Current schedule and passenger volume Base Model OpenTrack Sensitivity Test final schedule and current level of train load Scenario 1 Train load increased by adjusting the PHF to 0.49 PHF increased by 0.1 or 0.05 stepwise Scenario 2-5 Assume a fixed value of 2 minutes Remove 2-minute buffer time (segment 3 and 4) Scenario 5A Remove terminal passenger alighting behavior Scenario 5B 64
65 Scenario Tests Results 65
66 Scenario Tests Results 9% 2 min 66
67 Scenario Tests Results 67
68 Scenario Tests Results *total delay time (number of passengers delay) 68
69 Scenario Tests Results 60 sec 30% 69

70 Scenario Tests Results Inbound Outbound 70


71 Scenario Tests Results Base Model Scenario 5 71

72 Further Scenarios 72
73 Conclusion 73
74 Conclusions Analytical methods are not sufficient to capture the stochasticity of a complex area Railway simulation fails to account for the impact of pedestrian movements Both pedestrian movements and train movements have interactive effect on the total capacity of a complex station area 74
75 Contribution Performed a comprehensive comparative analysis among various analytical and simulation methods on the capacity of a node area Affirmed that practical capacity is around 60% to 75% of the theoretical capacity Observed unique terminal passenger alighting behavior, proposed a simple initial model Identified the benefit of using integrated simulation model 75
76 Future Work Apply Nexus for new service concepts like RER Study optimization methods Consider the capacity of maintenance yards, turn-back movements at the Union Station Further develop the alighting behavior model for the terminal station by considering other factors Apply Nexus in other complex transit systems which are sensitive to delays 76


77 Acknowledgements 77
78 Thank you
TORONTO TRANSIT COMMISSION REPORT NO.
 Form Revised: February 2005 TORONTO TRANSIT COMMISSION REPORT NO. MEETING DATE: October 24, 2012 SUBJECT: DOWNTOWN RAPID TRANSIT EXPANSION STUDY (DRTES) PHASE 1 STRATEGIC PLAN ACTION ITEM RECOMMENDATIONS
Transit City Etobicoke - Finch West LRT
 Delcan Corporation Transit City Etobicoke - Finch West LRT APPENDIX D Microsimulation Traffic Modeling Report March 2010 March 2010 Appendix D CONTENTS 1.0 STUDY CONTEXT... 2 Figure 1 Study Limits... 2
Presentation Overview. Stop, Station, and Terminal Capacity
 Stop, Station, and Terminal Capacity Mark Walker Parsons Brinckerhoff Presentation Overview Brief introduction to the project Station types & configurations Passenger circulation and level of service Station
King County Metro. Columbia Street Transit Priority Improvements Alternative Analysis. Downtown Southend Transit Study. May 2014.
 King County Metro Columbia Street Transit Priority Improvements Alternative Analysis Downtown Southend Transit Study May 2014 Parametrix Table of Contents Introduction... 1 Methodology... 1 Study Area...
Pembina Emerson Border Crossing Interim Measures Microsimulation
 Pembina Emerson Border Crossing Interim Measures Microsimulation Final Report December 2013 Prepared for: North Dakota Department of Transportation Prepared by: Advanced Traffic Analysis Center Upper Great
TRAVEL DEMAND FORECASTS
 Jiangxi Ji an Sustainable Urban Transport Project (RRP PRC 45022) TRAVEL DEMAND FORECASTS A. Introduction 1. The purpose of the travel demand forecasts is to assess the impact of the project components
Estimating Maximum Failure Rate For A Bus Rapid Transit Station
 INDIAN INSTITUTE OF TECHNOLOGY ROORKEE Estimating Maximum Failure Rate For A Bus Rapid Transit Station Dr. Ankit Kathuria Department of Civil Engg. IIT Roorkee Prof. M. Parida Professor Department of Civil
Appendix B CTA Transit Data Supporting Documentation
 RED ED-PURPLE BYPASS PROJECT ENVIRONMENTAL ASSESSMENT AND SECTION 4(F) EVALUATION Appendix B CTA Transit Data Supporting Documentation 4( Memorandum Date: May 14, 2015 Subject: Chicago Transit Authority
GO Transit s deliverable: the 2020 Service Plan
 GO Transit s deliverable: the 2020 Service Plan GO Transit s 2020 Service Plan describes GO s commitment to customers, existing and new, to provide a dramatically expanded interregional transit option
CONNECTING THE REGION
 CONNECTING THE REGION GERRY CHAPUT VICE PRESIDENT, RAPID TRANSIT, METROLINX VALUE ANALYSIS CANADA SUMMIT KEYNOTE OCTOBER 16, 2017 Metrolinx was created in 2006 by the Province of Ontario to improve the
Fleet Penetration of Automated Vehicles: A Microsimulation Analysis
 Fleet Penetration of Automated Vehicles: A Microsimulation Analysis Corresponding Author: Elliot Huang, P.E. Co-Authors: David Stanek, P.E. Allen Wang 2017 ITE Western District Annual Meeting San Diego,
UCLA Lake Arrowhead Conference. October 18, 2010
 BART Click to Capacity edit Master Overview title style for UCLA Lake Arrowhead Conference October 18, 2010 0 BART Basics 360,000 daily riders 104 miles 43 stations 1.3 billion annual passenger miles 1
UCLA Lake Arrowhead Conference. October 18, 2010
 BART Click to Capacity edit Master Overview title style for UCLA Lake Arrowhead Conference October 18, 2010 0 BART Basics 360,000 daily riders 104 miles 43 stations 1.3 billion annual passenger miles 1
Traffic Data Services: reporting and data analytics using cellular data
 Make traffic and population movement analysis smart, fast, pervasive and cost-effective. Data sheet Traffic Data Services: reporting and data analytics using cellular data Accurate data collection and
Presentation A Blue Slides 1-5.
 Presentation A Blue Slides 1-5. 1 Presentation A Blue Slides 1-5. 2 Presentation A Blue Slides 1-5. 3 Presentation A Blue Slides 1-5. 4 Presentation A Blue Slides 1-5. 5 Transit Service right. service
Mississauga Bus Rapid Transit Preliminary Design Project
 Mississauga Bus Rapid Transit Preliminary Design Project PUBLIC INFORMATION CENTRE OCTOBER 2008 WELCOME The Mississauga Bus Rapid Transit (BRT) Project Thank you for attending this Public Information Centre.
TURUN RAITIOTIEN YS:N TARKISTUS OPENTRACK-SIMULOINNIT
 TURUN RAITIOTIEN YS:N TARKISTUS OPENTRACK-SIMULOINNIT CONTENTS Traffic concept and line alternatives Assumptions for the OpenTrack model and the rolling stock Detailed simulation results Conclusions TRAFFIC
Efficiency of Semi-Autonomous Platooning Vehicles in High-Capacity Bus Services
 Efficiency of Semi-Autonomous Platooning Vehicles in High-Capacity Bus Services Wei Zhang, Erik Jenelius, and Hugo Badia Department of Civil and Architectural Engineering, KTH Royal Institute of Technology,
I-20 EAST TRANSIT INITIATIVE Tier 1 and Tier 2 Alternatives Screening Report EXECUTIVE SUMMARY
 EXECUTIVE SUMMARY The purpose of this report is to document the results of the Tier 1 and Tier 2 Screening of alternatives for the I-20 East Transit Initiative. The two-tier screening process presented
Interstate Operations Study: Fargo-Moorhead Metropolitan Area Simulation Output
 NDSU Dept #2880 PO Box 6050 Fargo, ND 58108-6050 Tel 701-231-8058 Fax 701-231-6265 www.ugpti.org www.atacenter.org Interstate Operations Study: Fargo-Moorhead Metropolitan Area 2015 Simulation Output Technical
What do autonomous vehicles mean to traffic congestion and crash? Network traffic flow modeling and simulation for autonomous vehicles
 What do autonomous vehicles mean to traffic congestion and crash? Network traffic flow modeling and simulation for autonomous vehicles FINAL RESEARCH REPORT Sean Qian (PI), Shuguan Yang (RA) Contract No.
Train turn restrictions and line plan performance
 Downloaded from orbit.dtu.dk on: Jan 05, 2019 Train turn restrictions and line plan performance Burggraeve, Sofie ; Bull, Simon Henry; Lusby, Richard Martin ; Vansteenwegen, Pieter Publication date: 2016
Interstate Operations Study: Fargo-Moorhead Metropolitan Area Simulation Results
 NDSU Dept #2880 PO Box 6050 Fargo, ND 58108-6050 Tel 701-231-8058 Fax 701-231-6265 www.ugpti.org www.atacenter.org Interstate Operations Study: Fargo-Moorhead Metropolitan Area 2025 Simulation Results
Chapter 4. HS2 Route Capacity and Reliability. Prepared by Christopher Stokes
 Chapter 4 HS2 Route Capacity and Reliability Prepared by Christopher Stokes 4 HS2 ROUTE CAPACITY AND RELIABILITY Prepared by Christopher Stokes 4.1 This chapter relates to the following questions listed
Use of Passenger Count Data to provide Cost-Benefit Analysis of Fixed-Route Cluster Operations Helping Agencies Do More with Less
 Use of Passenger Count Data to provide Cost-Benefit Analysis of Fixed-Route Cluster Operations Helping Agencies Do More with Less Dennis Fletcher M.E.S., director, transit solutions Gera Taubkin, M.S.,senior
Craig Scheffler, P.E., PTOE HNTB North Carolina, P.C. HNTB Project File: Subject
 TECHNICAL MEMORANDUM To Kumar Neppalli Traffic Engineering Manager Town of Chapel Hill From Craig Scheffler, P.E., PTOE HNTB North Carolina, P.C. Cc HNTB Project File: 38435 Subject Obey Creek TIS 2022
The purpose of this lab is to explore the timing and termination of a phase for the cross street approach of an isolated intersection.
 1 The purpose of this lab is to explore the timing and termination of a phase for the cross street approach of an isolated intersection. Two learning objectives for this lab. We will proceed over the remainder
UCLA Lake Arrowhead Conference. October 18, 2010
 BART Click to Capacity edit Master Overview title style for UCLA Lake Arrowhead Conference October 18, 2010 0 BART Basics 360,000 daily riders 104 miles 43 stations 1.3 billion annual passenger miles 1
Traffic Micro-Simulation Assisted Tunnel Ventilation System Design
 Traffic Micro-Simulation Assisted Tunnel Ventilation System Design Blake Xu 1 1 Parsons Brinckerhoff Australia, Sydney 1 Introduction Road tunnels have recently been built in Sydney. One of key issues
Transportation & Traffic Engineering
 Transportation & Traffic Engineering 1) Project Description This report presents a summary of findings for a Traffic Impact Analysis (TIA) performed by A+ Engineering, Inc. for the Hill Country Family
The major roadways in the study area are State Route 166 and State Route 33, which are shown on Figure 1-1 and described below:
 3.5 TRAFFIC AND CIRCULATION 3.5.1 Existing Conditions 3.5.1.1 Street Network DRAFT ENVIRONMENTAL IMPACT REPORT The major roadways in the study area are State Route 166 and State Route 33, which are shown
APPENDIX C ROADWAY BEFORE-AND-AFTER STUDY
 APPENDIX C ROADWAY BEFORE-AND-AFTER STUDY The benefits to pedestrians and bus patrons are numerous when a bus bay is replaced with a bus bulb. Buses should operate more efficiently at the stop when not
1 On Time Performance
 MEMORANDUM: US 29 Travel Time & OTP To: From: Joana Conklin, Montgomery County DOT James A. Bunch, SWAI Subject: US 29 Travel Time and On Time Performance Analysis Date: This memorandum documents the US
Responsive Bus Bridging Service Planning Under Urban Rail Transit Line Emergency
 2016 3 rd International Conference on Vehicle, Mechanical and Electrical Engineering (ICVMEE 2016) ISBN: 978-1-60595-370-0 Responsive Bus Bridging Service Planning Under Urban Rail Transit Line Emergency
BROWARD BOULEVARD CORRIDOR TRANSIT STUDY
 BROWARD BOULEVARD CORRIDOR TRANSIT STUDY FM # 42802411201 EXECUTIVE SUMMARY July 2012 GOBROWARD Broward Boulevard Corridor Transit Study FM # 42802411201 Executive Summary Prepared For: Ms. Khalilah Ffrench,
REDUCING THE OCCURRENCES AND IMPACT OF FREIGHT TRAIN DERAILMENTS
 REDUCING THE OCCURRENCES AND IMPACT OF FREIGHT TRAIN DERAILMENTS D-Rail Final Workshop 12 th November - Stockholm Monitoring and supervision concepts and techniques for derailments investigation Antonella
EXTENDING PRT CAPABILITIES
 EXTENDING PRT CAPABILITIES Prof. Ingmar J. Andreasson* * Director, KTH Centre for Traffic Research and LogistikCentrum AB. Teknikringen 72, SE-100 44 Stockholm Sweden, Ph +46 705 877724; ingmar@logistikcentrum.se
Comprehensive Regional Goods Movement Plan and Implementation Strategy Goods Movement in the 2012 RTP/SCS
 Comprehensive Regional Goods Movement Plan and Implementation Strategy Goods Movement in the 2012 RTP/SCS Annie Nam Southern California Association of Governments September 24, 2012 The Goods Movement
Effect of Police Control on U-turn Saturation Flow at Different Median Widths
 Effect of Police Control on U-turn Saturation Flow at Different Widths Thakonlaphat JENJIWATTANAKUL 1 and Kazushi SANO 2 1 Graduate Student, Dept. of Civil and Environmental Eng., Nagaoka University of
Civil Engineering and Environmental, Gadjah Mada University TRIP ASSIGNMENT. Introduction to Transportation Planning
 Civil Engineering and Environmental, Gadjah Mada University TRIP ASSIGNMENT Introduction to Transportation Planning Dr.Eng. Muhammad Zudhy Irawan, S.T., M.T. INTRODUCTION Travelers try to find the best
Travel Time Savings Memorandum
 04-05-2018 TABLE OF CONTENTS 1 Background 3 Methodology 3 Inputs and Calculation 3 Assumptions 4 Light Rail Transit (LRT) Travel Times 5 Auto Travel Times 5 Bus Travel Times 6 Findings 7 Generalized Cost
Engineering Dept. Highways & Transportation Engineering
 The University College of Applied Sciences UCAS Engineering Dept. Highways & Transportation Engineering (BENG 4326) Instructors: Dr. Y. R. Sarraj Chapter 4 Traffic Engineering Studies Reference: Traffic
GTA A.M. PEAK MODEL. Documentation & Users' Guide. Version 4.0. Prepared by. Peter Dalton
 GTA A.M. PEAK MODEL Version 4.0 Documentation & Users' Guide Prepared by Peter Dalton August 19, 2003 Contents 1.0 Introduction... 1 1.1 Summary Description... 2 Figure 1 - Flow Diagram... 2 Table 1 -
Written Exam Public Transport + Answers
 Faculty of Engineering Technology Written Exam Public Transport + Written Exam Public Transport (195421200-1A) Teacher van Zuilekom Course code 195421200 Date and time 7-11-2011, 8:45-12:15 Location OH116
The City of Toronto s Transportation Strategy July 2007
 The City of Toronto s Transportation Strategy July 2007 Presentation Outline Transportation Statistics Transportation Building Blocks Toronto s Official Plan Transportation and City Building Vision Projects
DEVELOPMENT OF RIDERSHIP FORECASTS FOR THE SAN BERNARDINO INFRASTRUCTURE IMPROVEMENT STUDY
 APPENDIX 1 DEVELOPMENT OF RIDERSHIP FORECASTS FOR THE SAN BERNARDINO INFRASTRUCTURE IMPROVEMENT STUDY INTRODUCTION: This Appendix presents a general description of the analysis method used in forecasting
METRO Orange Line BRT American Boulevard Station Options
 METRO Orange Line BRT American Boulevard Station Options Bloomington City Council Work Session November 18, 2013 Christina Morrison BRT/Small Starts Project Office Coordinating Planning and Design AMERICAN
Appendix C-5: Proposed Refinements Rail Operations and Maintenance Facility (ROMF) Traffic Impact Analysis. Durham-Orange Light Rail Transit Project
 Traffic Impact Analysis. Durham-Orange Light Rail Transit Project") Appendix C-5: Proposed Refinements Rail Operations and Maintenance Facility (ROMF) Traffic Impact Analysis Durham-Orange Light Rail Transit Project July 25, 218 ROMF Transportation Impact Analysis Version
Appendix C-5: Proposed Refinements Rail Operations and Maintenance Facility (ROMF) Traffic Impact Analysis Durham-Orange Light Rail Transit Project July 25, 218 ROMF Transportation Impact Analysis Version
FINAL. Sound Transit Long-Range Plan Update. Issue Paper S.1: Tacoma Link Integration with Central Link. Prepared for: Sound Transit
 Sound Transit Long-Range Plan Update Issue Paper S.1: Tacoma Link Integration with Central Link Prepared for: Sound Transit Prepared by: Quade & Douglas, Inc. FINAL March 2005 Foreword This issue paper
R.M.N.T. Sirisoma a Doug Morgan b S.C. Wirasinghe a
 R.M.N.T. Sirisoma a Doug Morgan b S.C. Wirasinghe a a Dept. of Civil Engineering, Schulich School of Engineering, University of Calgary b Calgary Transit, Calgary, Canada Introduction Study Area Availability
Bi-County Transitway/ Bethesda Station Access Demand Analysis
 Bi-County Transitway/ Bethesda Station Access Demand Analysis Prepared for: Washington Metropolitan Area Transit Authority Office of Planning and Project Development May 2005 Prepared by: in conjunction
UTA Transportation Equity Study and Staff Analysis. Board Workshop January 6, 2018
 UTA Transportation Equity Study and Staff Analysis Board Workshop January 6, 2018 1 Executive Summary UTA ranks DART 6 th out of top 20 Transit Agencies in the country for ridership. UTA Study confirms
EXECUTIVE SUMMARY. The following is an outline of the traffic analysis performed by Hales Engineering for the traffic conditions of this project.
 EXECUTIVE SUMMARY This study addresses the traffic impacts associated with the proposed Shopko redevelopment located in Sugarhouse, Utah. The Shopko redevelopment project is located between 1300 East and
Pedestrians, Cars, Buses and Trains? Considerations for Rapid Transit Service at Western University
 Pedestrians, Cars, Buses and Trains? Considerations for Rapid Transit Service at Western University Shift: The City of London s Rapid Transit Proposal Shift: The City of London s Rapid Transit Proposal
CA PACITY TRA MWAY. November CODATU XVII High capacity tramway November
 CODA TU XVII HIGH CA PACITY TRA MWAY November 2017 CODATU XVII High capacity tramway November 2017 1 EGIS, A GLOBAL OFFER CODATU XVII High capacity tramway November 2017 2 EGIS & LIGHT RAIL TRANSIT European
CAPTURING THE SENSITIVITY OF TRANSIT BUS EMISSIONS TO CONGESTION, GRADE, PASSENGER LOADING, AND FUELS
 CAPTURING THE SENSITIVITY OF TRANSIT BUS EMISSIONS TO CONGESTION, GRADE, PASSENGER LOADING, AND FUELS Ahsan Alam and Marianne Hatzopoulou, McGill University, Canada Introduction Transit is considered as
Yonge-Eglinton. Mobility Hub Profile. September 19, 2012 YONGE- EGLINTON
 September 19, 2012 PEEL YORK HALTON DURHAM HAMILTON TORONTO YONGE- EGLINTON MOBILITY HUBS: places of connectivity between regional and rapid transit services, where different modes of transportation come
What is ELToD and Why Use it? Toll Choice Key Concepts. ELToD Applications. SW 10 th Street. ELToD Future Enhancements
 June 16, 2017 What is ELToD and Why Use it? Toll Choice Key Concepts ELToD Applications SW 10 th Street ELToD Future Enhancements 2 ELToD (Express Lanes Time of Day) Model is a traffic assignment model
Level of Service Classification for Urban Heterogeneous Traffic: A Case Study of Kanapur Metropolis
 Level of Service Classification for Urban Heterogeneous Traffic: A Case Study of Kanapur Metropolis B.R. MARWAH Professor, Department of Civil Engineering, I.I.T. Kanpur BHUVANESH SINGH Professional Research
DRAFT TRANSPORTATION IMPACT STUDY CASTILIAN REDEVELOPMENT PROJECT
 DRAFT TRANSPORTATION IMPACT STUDY CASTILIAN REDEVELOPMENT PROJECT Prepared for: Submitted by: 299 Lava Ridge Ct. Suite 2 Roseville, CA. 95661 June 212 TABLE OF CONTENTS 1. Introduction... 1 Project Location
P07033 US 50 EB Weaving Analysis between El Dorado Hills and Silva Valley Ramp Metering Analysis for US 50 EB On-Ramp at Latrobe Road
 180 Grand Avenue, Suite 250 428 J Street, Suite 500 Oakland, CA 94612 Sacramento, CA 95814 510.839.1742 916.266.2190 510.839.0871 fax 916.266.2195 Dowling Associates, Inc. www.dowlinginc.com traffic@dowlinginc.com
Developing Toronto s Transit Network Plan to Public Information Meeting June 21, 2016
 Developing Toronto s Transit Network Plan to 2031 Public Information Meeting June 21, 2016 March 2016 City Council Direction SmartTrack: Approved SmartTrack/GO Regional Express Rail (RER) Integration options
RE: A Traffic Impact Statement for a proposed development on Quinpool Road
 James J. Copeland, P.Eng. GRIFFIN transportation group inc. 30 Bonny View Drive Fall River, NS B2T 1R2 May 31, 2018 Ellen O Hara, P.Eng. Project Engineer DesignPoint Engineering & Surveying Ltd. 200 Waterfront
APPENDIX C1 TRAFFIC ANALYSIS DESIGN YEAR TRAFFIC ANALYSIS
 APPENDIX C1 TRAFFIC ANALYSIS DESIGN YEAR TRAFFIC ANALYSIS DESIGN YEAR TRAFFIC ANALYSIS February 2018 Highway & Bridge Project PIN 6754.12 Route 13 Connector Road Chemung County February 2018 Appendix
FIELD APPLICATIONS OF CORSIM: I-40 FREEWAY DESIGN EVALUATION, OKLAHOMA CITY, OK. Michelle Thomas
 Proceedings of the 1998 Winter Simulation Conference D.J. Medeiros, E.F. Watson, J.S. Carson and M.S. Manivannan, eds. FIELD APPLICATIONS OF CORSIM: I-40 FREEWAY DESIGN EVALUATION, OKLAHOMA CITY, OK Gene
Travel Demand Modeling at NCTCOG
 Travel Demand Modeling at NCTCOG Arash Mirzaei North Central Texas Council Of Governments for Southern Methodist University The ASCE Student Chapter October 24, 2005 Contents NCTCOG DFW Regional Model
Traffic and Toll Revenue Estimates
 The results of WSA s assessment of traffic and toll revenue characteristics of the proposed LBJ (MLs) are presented in this chapter. As discussed in Chapter 1, Alternatives 2 and 6 were selected as the
Appendix B: Traffic Reports
 Appendix B: Traffic Reports 407 TRANSITWAY - KENNEDY ROAD TO BROCK ROAD MINISTRY OF TRANSPORTATION - CENTRAL REGION Report Markham Road Station Traffic Study Prepared for Ministry of Transportation, Ontario
REALIZING THE AIR QUALITY BENEFITS OF PORT INFRASTRUCTURE PROJECTS. A Case Study of the Alameda Corridor
 REALIZING THE AIR QUALITY BENEFITS OF PORT INFRASTRUCTURE PROJECTS A Case Study of the Alameda Corridor April 29, 25 Dr. Margaret Lobnitz, Weston Solutions, Inc. 1 BACKGROUND In mid-198 s, growing concern
IRSCH REEN Hirsch/Green Transportation Consulting, Inc.
 IRSCH REEN Hirsch/Green Transportation Consulting, Inc. February 6, 2013 Mr. David Weil Director of Finance St. Matthew s Parish School 1031 Bienveneda Avenue Pacific Palisades, California 90272 RE: Trip
3.1 Introduction Transportation Elements and Study Area Meeting the Need for the Project
 Chapter 3 Transportation Environment and Consequences 3. Introduction This chapter summarizes the characteristics of the transportation system in the East Link Project vicinity and discusses potential
Halifax Commuter Rail Feasibility Study
 Halifax Commuter Rail Feasibility Study Open House Halifax Regional Municipality February 26, 2015 Study Team The team is led by CPCS: A global management consulting firm (formerly the consulting arm of
ESTIMATING CAPACITY OF HIGH VOLUME BUS RAPID TRANSIT STATIONS
 ESTIMATING CAPACITY OF HIGH VOLUME BUS RAPID TRANSIT STATIONS Jack M. Reilly, Ph.D. Professor of Practice, Department of Civil and Environmental Engineering, Rensselaer Polytechnic Institute 110 8th Street,
Viriato/OpenTrack Conference 2005 Zürich, Switzerland. ir. Jeroen Michels the Netherlands
 Viriato/OpenTrack Conference 2005 Zürich, Switzerland ir. Jeroen Michels the Netherlands Presentation contents Introduction of Holland Railconsult Use of OpenTrack in projects by Holland Railconsult Successful
Using OpenTrack to determine the electrical load on the network
 The OpenTrack rail network simulation software is used by railways, the railway supply industry, consultancies and universities to model rail infrastructure, rolling stock and timetabling. OpenTrack can
Examining the load peaks in high-speed railway transport
 Examining the load peaks in high-speed railway transport Yigit Fidansoy, M.Sc. Technische Universität Darmstadt, Germany fidansoy@verkehr.tu-darmstadt.de Paper prepared for DEMAND Centre Conference, Lancaster,
Traffic Impact Analysis. Alliance Cole Avenue Residential Site Dallas, Texas. Kimley-Horn and Associates, Inc. Dallas, Texas.
 Traffic Impact Analysis Alliance Cole Avenue Residential Site Dallas, Texas February 15, 2018 Kimley-Horn and Associates, Inc. Dallas, Texas Project #064524900 Registered Firm F-928 Traffic Impact Analysis
Featured Articles Utilization of AI in the Railway Sector Case Study of Energy Efficiency in Railway Operations
 128 Hitachi Review Vol. 65 (2016), No. 6 Featured Articles Utilization of AI in the Railway Sector Case Study of Energy Efficiency in Railway Operations Ryo Furutani Fumiya Kudo Norihiko Moriwaki, Ph.D.
HALTON REGION SUB-MODEL
 WORKING DRAFT GTA P.M. PEAK MODEL Version 2.0 And HALTON REGION SUB-MODEL Documentation & Users' Guide Prepared by Peter Dalton July 2001 Contents 1.0 P.M. Peak Period Model for the GTA... 4 Table 1 -
Suazo, Dragicevic and Muñoz 1 HOLDING BOARDING PASSENGERS TO IMPROVE TRAIN OPERATION BASED ON AN ECONOMETRIC DWELL TIME MODEL.
 Suazo, Dragicevic and Muñoz 0 0 HOLDING BOARDING PASSENGERS TO IMPROVE TRAIN OPERATION BASED ON AN ECONOMETRIC DWELL TIME MODEL. Gonzalo Suazo-Vecino (*) Department of Transport Engineering and Logistics,
An Innovative Approach
 Traffic Flow Theory and its Applications in Urban Environments An Innovative Approach Presented by Dr. Jin Cao 30.01.18 1 Traffic issues in urban environments Pedestrian 30.01.18 Safety Environment 2 Traffic
Innovative Airside Simulation using PTV Vissim
 PTV VISSIM User Group Meeting India 27 5 November 27 HICC, Hitech City, Hyderabad Innovative Airside Simulation using PTV Vissim Srinivas Bandaru Presentation Structure Study Background Project Scope Study
Appendix 4. HS2 Route Capacity and Reliability. Prepared by Christopher Stokes
 Appendix 4 HS2 Route Capacity and Reliability Prepared by Christopher Stokes 4 HS2 ROUTE CAPACITY AND RELIABILITY Prepared by Christopher Stokes Introduction 4.1 This appendix considers the planned utilisation
Appendix B: Travel Demand Forecasts July 2017
 Appendix B: Travel Demand Forecasts July 2017 Table of Contents 1 Introduction... 2 2 Model Review and Updates... 2 2.1 Overview of Smart Moves Model ( City of London Model )... 2 2.1.1 Network and Zone
TABLE OF CONTENTS. Table of contents. Page ABSTRACT ACKNOWLEDGEMENTS TABLE OF TABLES TABLE OF FIGURES
 Table of contents TABLE OF CONTENTS Page ABSTRACT ACKNOWLEDGEMENTS TABLE OF CONTENTS TABLE OF TABLES TABLE OF FIGURES INTRODUCTION I.1. Motivations I.2. Objectives I.3. Contents and structure I.4. Contributions
Recommended Vision for the Downtown Rapid Transit Network
 Recommended Vision for the Downtown Rapid Transit Network April 2008 Presentation Overview Context Transit options Assessment of options Recommended network Building the network 2 1 Rapid Our Vision Reliable
Technical Memorandum Analysis Procedures and Mobility Performance Measures 100 Most Congested Texas Road Sections What s New for 2015
 Technical Memorandum Analysis Procedures and Mobility Performance Measures 100 Most Congested Texas Road Sections Prepared by Texas A&M Transportation Institute August 2015 This memo documents the analysis
Travel Forecasting Methodology
 Travel Forecasting Methodology Introduction This technical memorandum documents the travel demand forecasting methodology used for the SH7 BRT Study. This memorandum includes discussion of the following:
TRAFFIC PARKING ANALYSIS
 TRAFFIC PARKING ANALYSIS NAPA FLEA MARKET COUNTY OF NAPA Prepared for: Tom Harding Napa-Vallejo Flea Market 33 Kelly Road American Canyon, CA 9453 Prepared by: 166 Olympic Boulevard, Suite 21 Walnut Creek,
FE Review-Transportation-II. D e p a r t m e n t o f C i v i l E n g i n e e r i n g U n i v e r s i t y O f M e m p h i s
 FE Review-Transportation-II D e p a r t m e n t o f C i v i l E n g i n e e r i n g U n i v e r s i t y O f M e m p h i s Learning Objectives Design, compute, and solve FE problems on Freeway level of
Analysis of Radial and Trunk Feeder Transit System Configurations in Downtown Charlottesville
 Analysis of Radial and Trunk Feeder Transit System Configurations in Downtown Charlottesville 1. Introduction During the stakeholder input sessions of Charlottesville Area Transit s (CAT) Transit Development
THE WILSHIRE CORRIDOR: RAIL AND ITS ALTERNATIVES. Prepared By: Jacki Murdock Transportation and Environmental Planner
 THE WILSHIRE CORRIDOR: RAIL AND ITS ALTERNATIVES Prepared By: Jacki Murdock Transportation and Environmental Planner December 13 th, 2012 Overview Characteristics of Wilshire Boulevard Overview of the
Needs and Community Characteristics
 Needs and Community Characteristics Anticipate Population and Job Growth in the City Strongest density of population and jobs in Ann Arbor are within the Study Area Population expected to grow 8.4% by
Millgrove Evacuation Study
 IBM Research Technical Report: Millgrove Evacuation Study May 4, 3 Anton Beloglazov, Juerg von Kaenel, Jan Richter, Kent Steer and Ziyuan Wang In alphabetical order. Australia Limited 3 ABN 79 4 733 Copyright
MTA Long Island Rail Road (LIRR) and MTA Metro-North Railroad (MNR) System-wide Service Standards
 and MTA Metro-North Railroad (MNR) System-wide Service Standards") MTA Long Island Rail Road (LIRR) and MTA (MNR) System-wide Service Standards The following system-wide service standards apply to LIRR and MNR operations. 1. Service Availability Service Availability is
MTA Long Island Rail Road (LIRR) and MTA (MNR) System-wide Service Standards The following system-wide service standards apply to LIRR and MNR operations. 1. Service Availability Service Availability is
Mutual trading strategy between customers and power generations based on load consuming patterns. Junyong Liu, Youbo Liu Sichuan University
 Mutual trading strategy between customers and power generations based on load consuming patterns Junyong Liu, Youbo Liu Sichuan University 2 Outline Ⅰ Ⅱ Research Background Reviews on the development of
CREATING CONNECTIONS IN RICHMOND HILL
 CREATING CONNECTIONS IN RICHMOND HILL Mohamed Alkoka, Director, Corridor Infrastructure Metrolinx Anthony Irving, Manager, Community Relations Metrolinx May 15, 2017 1 GRIDLOCK COSTS OUR ECONONY Residents
CITY OF ANN ARBOR, MICHIGAN 301 E. Huron St., P.O. Box 8647 Ann Arbor, Michigan
 Date: Wednesday, June 18, 2014 Location: Ann Arbor District Library Attendees: 14 citizen attendees Ann Arbor Station Environmental Review Citizen Working Group Meeting Notes Meeting #3 The third meeting
Online Appendix for Subways, Strikes, and Slowdowns: The Impacts of Public Transit on Traffic Congestion
 Online Appendix for Subways, Strikes, and Slowdowns: The Impacts of Public Transit on Traffic Congestion ByMICHAELL.ANDERSON AI. Mathematical Appendix Distance to nearest bus line: Suppose that bus lines
TRAFFIC SIMULATION IN REGIONAL MODELING: APPLICATION TO THE INTERSTATEE INFRASTRUCTURE NEAR THE TOLEDO SEA PORT
 MICHIGAN OHIO UNIVERSITY TRANSPORTATION CENTER Alternate energy and system mobility to stimulate economic development. Report No: MIOH UTC TS41p1-2 2012-Final TRAFFIC SIMULATION IN REGIONAL MODELING: APPLICATION