Investor Presentation August 2016
|
|
|
- Myrtle Perry
- 5 years ago
- Views:
Transcription

1 Investor Presentation August 2016
2 Contents About Ford Otosan 3 Plants and Facilities 9 Products 16 Investment Case 24 Operating and Financial Performance 43 Guidance 60 Contacts 61 Page 2
3 About Ford Otosan Page 3


4 Company Profile Key Performance Indicators, 2015 Revenues Export Revenues EBITDA Profit Before Tax Net Profit $6.2 billion $3.9 billion $530 million $318 million $310 million Ford Motor Co. Ford Otosan 41% 41% Koç Group ROE 27.5% EBITDA margin 8.6% Annual Production Capacity 415,000 Free Float 18% Gölcük 290,000 Yeniköy 110,000 İnönü 15,000 Total Employees 10,676 Blue Collar 7,944 Paid-in Capital: TL 350,910,000 Traded on Borsa Istanbul since 13 January 1986 Ticker: FROTO.IS White Collar 2,732 Page 4
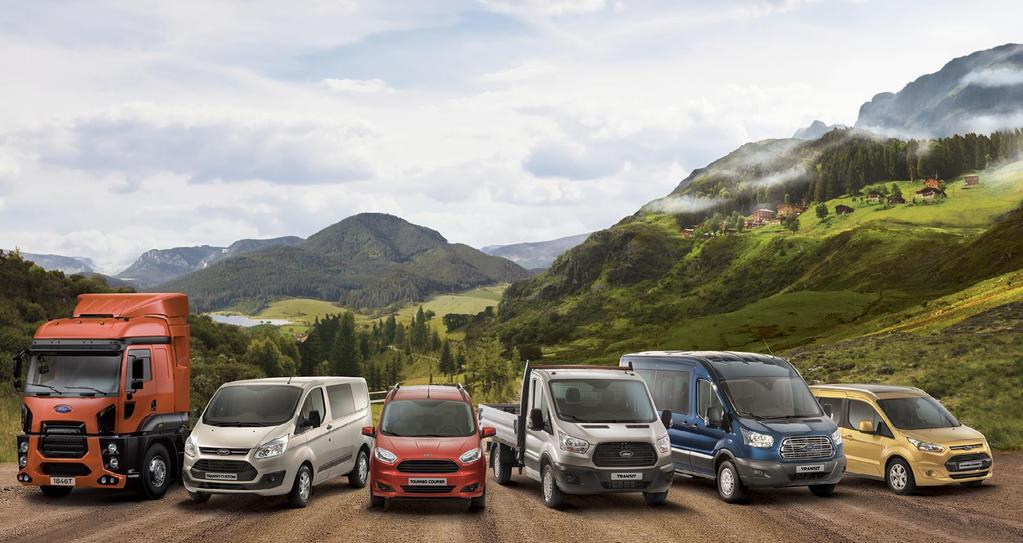
5 Ford Otosan at a Glance Pioneer of Turkish automotive First Turkish passenger car Anadol (1966) Turkey s first domestic diesel engine Erk (1986) Turkey s first private R&D center in automotive (1961) First export of Turkish automotive to the US (2009) Strong value contribution Turkey s export leader Turkey s 2 nd largest industrial enterprise Highest employment in Turkish automotive Leadership and scale Market leader in Turkish commercial vehicle industry Widest product range in Turkish automotive Highest installed production capacity in Turkish automotive 25% of Turkey s total automotive production 59% of Turkey s total commercial vehicle production 65% of Turkey s total commercial vehicle exports Page 5
6 Key Player in Ford Motor Company Universe Robust sales performance Highest commercial vehicle market share of Ford in Europe Ford s 3 rd biggest market in Europe (UK, Germany, Turkey, Italy, France) Leading manufacturing hub Lead manufacturing plant of Ford Transit globally Single source of Ford Transit Custom & Tourneo Custom Single source of Ford Transit Courier & Tourneo Courier One of the two production centers globally for Ford Cargo heavy trucks Engineering and R&D power Global hub for Cargo heavy trucks and related powertrains Global support for Light Commercial Vehicle Development Global support for Diesel Powertrain Engineering Page 6


7 Vision, Mission and Strategy Vision Being Turkey s most valuable and most preferred industrial company. Mission Providing innovative automotive products and services beneficial to the community. Strategy Growth: Organic and inorganic growth in new markets and existing business areas by developing new products. Innovation: Providing innovative products and services in all business processes by keeping creativity at the top. Brand: Being the most preferred brand in all segments by meeting customer needs and expectations. Employees: Being the most preferred workplace by aiming excellence in human resources processes and increasing benefits provided for employees. Customers: Being the leader automotive brand with regards to customer satisfaction in sales and after sales products and services. Page 7
8 Brief History First automotive production starts in Turkey under license agreements in a heavily protected domestic economy. Turkey takes first steps to liberalize its economy and integrate with the rest of the world. Customs Union is signed with the EU in Exports start to increase. Incentives are introduced for production in Turkey. Turkey becomes a major hub in automotive production and moves up the value chain, from an assembly center to full product development and manufacturing with focus on R&D. Turkey is the 17 th largest auto manufacturing hub in the world and 6 th largest among European countries. First Years 1980s 1990s Vehbi Koç is assigned as Ankara Ford dealer 1959 Otosan is founded as Ford assembler in Turkey 1960 Otosan s first production: Ford Consul 1966 Otosan produces the first Turkish car Anadol 1967 Otosan produces its first Transit 1982 İnönü Plant opens 1983 Cargo production starts Ford Motor Co. increases its share in Otosan to 30% 1985 Production of Ford Taunus 1986 Otosan produces Turkey s first diesel engine ERK 1992 Production of the new generation Transit Production of Ford Escort 1997 Ford assumes 41% equity in Ford Otosan 1998 Ford Otosan spare parts distribution center opens 2001 Gölcük Plant opens 2002 Transit Connect launches 2003 New Cargo launches 2003 Transit Connect International Van of the Year 2007 Gebze Engineering Center opens 2007 Transit International Van of the Year 2009 First vehicle export to North America 2010 Ford Otosan s 50 th Anniversary 2010 Transit Connect N.A. Truck of the Year 2011 Transit Connect NYC Taxi launches Launch of Ford Custom 2013 Ford Otosan s 12 th year of market leadership 2013/2014- JMC engine & truck technology licensing agreements 2014 Yeniköy Plant opens 2014 Launch of new Ford Transit and Ford Courier 2015 Sancaktepe Engineering Center opens Page 8
9 Plants and Facilities Page 9

")


, Custom")
10 Locations Sancaktepe Parts Distribution Center (1998) Sancaktepe Engineering Center (2015) İnönü Plant (1982) Kocaeli Plants: Gölcük Plant: Transit (2001), Custom (2012) Yeniköy Plant: Courier (2014) Page 10


11 Gölcük Plant - Lead manufacturing plant of Ford Transit Port Yeniköy Plant Assembly Shop Paint Shop Body Shop Tool & Die Press Shop Transit 140k-160k Custom 130k-150k 290,000 units manufacturing capacity 1,600,000 m 2 total area; 340,000 m 2 covered area Opened in 2001 Page 11

12 Yeniköy Plant - The single production center of Ford Courier in the world New production facility at Gölcük plant site opened on 22 May ,000 m 2 covered area Environment and disabled-friendly plant Courier 110k Page 12


13 İnönü Plant - One of the two global production centers for Ford Cargo Opened in 1982 Cargo 15k 88,000 m 2 covered area 80k units engine, 140k units powertrain production capacity L / 9.0L E6 Diesel engines for Cargo heavy truck - 2.2L 4-cyl. Duratorq TDCI engines for Transit Page 13

14 Sancaktepe Parts Distribution Center - 96% Fill rate Opened in ,000 m 2 warehouse: Largest of its kind in Turkey 4 th largest warehouse capacity among Ford s parts distribution centers in Europe Page 14


15 Sancaktepe Engineering Center Turkey s largest R&D Center Center of Excellence for heavy trucks and heavy duty diesel powertrain for large trucks Global engineering lead for Ford Cargo heavy trucks and related powertrains Global support for diesel powertrain engineering Global support for light commercial vehicle development (B- & C-car derived Integrated Style Vans) Page 15
16 Products Page 16


17 Ford Transit Longest-running model in Ford of Europe s product range ~ 8 million units produced globally since its launch in 1965 Manufactured by Ford Otosan since 1967 Ford Otosan is the lead manufacturing plant of Transit globally All-New Transit launched from March 2014 to October 2014 in 3 phases Chassis Cab Van Minibus Loading Capacity: 3.3 tons 4.7 tons Loading Capacity: Seating Capacity: 9.5m m / 17+1 Market share details available on page 46 Page 17


 Loading")

18 Ford Custom Ford Otosan is the single global source of Ford Custom Launched in October 2012 First vehicle in its segment to achieve a maximum five-star Euro NCAP rating Tourneo Custom (People Mover) Long and Short Chassis 8+1 Seating Capacity 4.97m 5.34 m Transit Custom (Commercial) Loading Capacity: 5.9 m m 3 Loading Capacity: 6.8 m m 3 Market share details available on page 46 Page 18

 Transit Courier")
 Market share details available on")
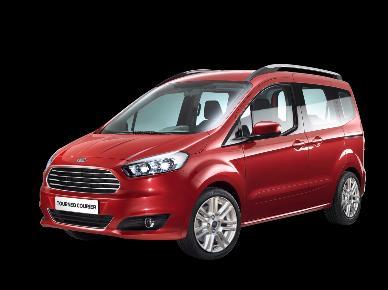
19 Ford Courier Ford s first vehicle in the compact van segment Ford Otosan is the single global source of Ford Courier Launched in May 2014 Tourneo Courier (People mover) Transit Courier Combi Van (Commercial) Transit Courier Van (Commercial) Market share details available on page 46 Page 19


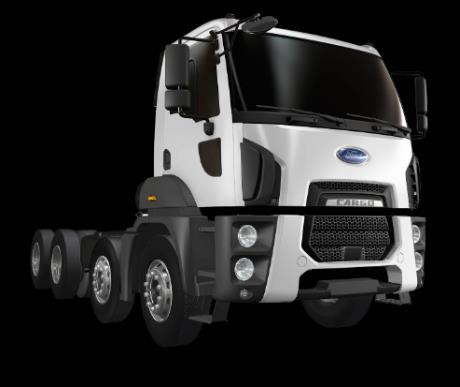
20 Ford Trucks Manufactured at Ford Otosan s İnönü Plant since 1983 Road truck, construction and tractor series available Cargo 1846T 2013 International Truck of the Year 3 rd place TRACTOR ROAD TRUCK CONSTRUCTION 4x2 Tractor and 6x2 Full Trailer are the main applications. Available in E3&E5 and E6 emission levels with 13L Ecotorq engine generating power 420 and 480 PS Long Haulage Mainly used for local distribution and municipality (special purpose vehicles) 4x2, 6x2, 8x2 applications. Available in E3&E5 and E6 emission levels with 9L and 13L Ecotorq engine generating power 330 and 420 PS Distribution Trucks Tippers, Transmixers, Cement Pumps. 6x4, 8x4, 4x2, 6x2 and 8x2 applications. Available in E3&E5 and E6 emission levels with 9L and 13L Ecotorq engine generating power 330 and 420 PS Construction Trucks Market share details available on page 46 Page 20
21 Ecotorq Engine Family Available in 9L 330PS and 13 L 420 to 480PS Euro 3, Euro 5 and Environmentally Friendly Euro 6 Emission Levels Turbocharger with Variable-Geometry 2500 bar Common-Rail Fuel Injection System Specially Coated Pistons Smart Charging Alternator Page 21


22 The Newest Portfolio in the Industry 1.2 years Average product age Page 22


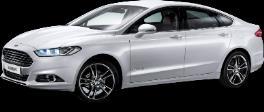


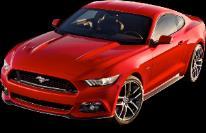
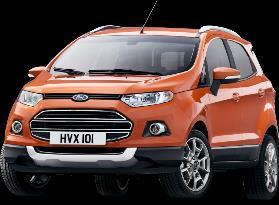

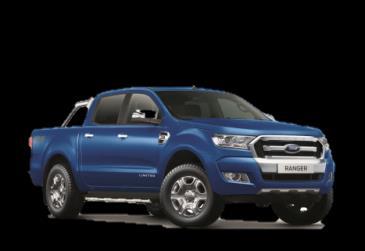

23 Major Product Acceleration 2014 Focus Courier Connect Transit 2015 Mondeo Galaxy C-Max Mustang 2016 Ranger EcoSport Edge Page 23
24 Investment Case Page 24
25 Ford Otosan s Value Proposition Scale & growth Domestic industry leader in commercial vehicles Largest manufacturer and exporter of commercial vehicles in Turkey Increased capacity and fully revamped products to grow volumes and profitability Technology licensing agreements delivering royalty fees with strong growth potential Resilience & efficiency Large-scale export program; Lead beneficiary of the growth in European van segment High capacity utilization: Above European and Turkish industry average Efficient, flexible and low-cost manufacturing and engineering competency Strong balance sheet & prudent risk management Strong cash generation capacity Solid financial performance Natural hedge of fx-payables due to fx-denominated export revenues Shareholder value creation Sustainable dividend policy Strong relative share performance Commitment to good corporate governance Page 25
26 Relatively Favorable Taxes on Commercial Vehicles Engine Size <1600 cc Courier (PC) Fiesta B-Max Focus C-Max Kuga (1.6) Mondeo (1.6) S-Max (1.6) Passenger Cars Model VAT SCT Total Engine Size Mondeo (2.0) S-Max (2.0) Kuga (2.0) Galaxy 18% 45%* 71% 18% 90%** 124% <3000cc Commercial Vehicles Model VAT SCT Total Transit Van Transit Minibus (16+1) (17+1) Transit Chassis Cab Transit Custom Van Transit Courier Van Connect Van Ranger 18% 4% 23% Transit Minibus (11+1) (14+1) 18% 9% 29% >2000 Mustang 18% 145%*** 189% Transit Combi Transit Custom Combi Transit Custom Combi Van Tourneo Custom Transit Courier Combi Van Tourneo Courier Connect Combi 18% 15%**** 36% Cargo 18% 4% 23% Tax rate increases: * 37% to 40% (Sept 22, 2012), 40% to 45% (Jan 1, 2014) ** 60% to 80% (Oct 12, 2011), 80% to 90% (Jan 1, 2014) *** 84% to 130% (Oct 12, 2011), 130% to 145% (Jan 1, 2014) **** 10% to 15% (Oct 12, 2011) VAT: Value added tax SCT: Special consumption tax Page 26
27 Scalable Export Business Exports (000 units) US$ 3.9 billion export revenues in Turkey s export leader in automotive for 5 consecutive years US$ 3.0 billion net exporter in the last five years ( ) Vehicles and spare parts exported to 82 countries in 5 continents Export Revenue (US$ bn) 65% of Turkey s total commercial vehicle exports is done by Ford Otosan Export receivables are easy to manage as Ford of Europe is the single counterparty Export receivables from Ford Motor Company and its subsidiaries are collected within average 14 days Page 27
28 Turkey s Largest Exporter Export breakdown (units) Turkey s CV exports UK 36% W. Europe 13% Ford Otosan 63% Germany 16% 1H16 E. Europe 9% 1H16 Belgium 3% Other 4% Italy 6% France 7% Spain 6% Page 28
29 Lead Beneficiary of the Growth in European Van Segment European commercial vehicle market (Up to 3.5 tons) % Jan 16 Feb 16 Mar 16 1Q 2016 Apr 16 May 16 Jun 16 YTD UK ,7 3,0 Germany ,9 10,9 Italy ,6 31,3 Spain ,3 13,8 France ,3 12,4 Total ,2 13,2 In June, the European market grew for the 34 th consecutive months. Van segment grew by 14.2% (187,158 units) YoY and 13.2% YTD to 968,791 units. ( Ford s commercial vehicle sales in Europe Ford was Europe s No.1 commercial vehicle brand in the first half of the year, reporting best commercial vehicle sales since Ford s CVs sales rose 18.0% YoY in June. Market share was 13% in 1H16 on increased demand for the expanded Transit range and the Ranger pickup. Page 29
30 Ford Ranks No. 1 in European Commercial Vehicles Ford s CV Ranking in Europe #7 8.6% #7 8.5% #6 10.0% #3 #1 11.5% 12.6% #1 13.0% #1 20% 13.0% Ford is Europe s No. 1 commercial vehicle brand in 2016 Yearly sales increase in Transit Family Ford s 2016 commercial vehicle market share 80% Ford Otosan s share in Ford of Europe s 2016 Transit sales 71% Ford Otosan s share in Ford of Europe s 2016 CV sales Page 30


31 Large Scale Investment Program >US$1 Billion ( ) Transit Courier US$ 75 million + Ford Trucks Custom 370 million Yeniköy US$ 850 million Page 31
32 Favorable Financing Terms 150 million loan agreement signed with EBRD in 2010 (Paid and closed as of December 2015) 5-year loan with 2-years grace period Euribor % 190 million loan agreement signed with EIB in year loan with 2-years grace period 100 million in Q3 at 2.06% 90 million in Q4 at 1.47% 100 million loan agreement signed with a consortium of foreign banks in July 2014 (HSBC, Societe Generale and The Bank of Tokyo-Mitsubishi UFJ, Ltd.) 4-year loan with 2-years grace period Euribor % 140 million loan agreement signed with EBRD and a consortium of foreign banks in July million loan funded by EBRD, 70 million funded as syndicated loan (HSBC, Societe Generale, The Bank of Tokyo-Mitsubishi UFJ, Ltd. and Credit Agricole) 5-year loan with 2-years grace period Euribor % 100 million loan agreement signed with EIB in December 2015 The loan was utilized in the first quarter of year loan at 0.87% Page 32


 Gölcük Plant")

33 Highest Production Capacity in Turkish Automotive Old: 330,000 (pre-investments) Kocaeli Plant İnönü Plant New: 415,000 (2014) Gölcük Plant Yeniköy Plant 290, ,000 İnönü Plant Kocaeli Plants 400,000 Page 33


34 Technology Licensing & Engineering Agreements The agreements with JMC have a 12-year term, starting with 2016 model year, to be extended every 3-years. Ford Otosan will be generating royalty fees with strong long-term growth potential. Ecotorq engines Signed on April 24 th, JMC branded vehicles manufactured in China using these engines and the licensed products will be sold in China and the export markets as agreed by the parties. A license fee of will be charged per product. 1 million license fee was collected as advance payment in Chassis, cab and components of Ford heavy trucks Signed on July 25 th, The products and JMC branded vehicles containing these products will be sold in China. Ford Otosan received an advance license fee of 8 million. An average license fee of 390 per Chassis and 39 per cab will be charged. Page 34
35 Focus on Shareholder Value Strong relative share performance Commitment to corporate governance FROTO Separate CEO and Chairman roles Independent BoD members Audit Committee 800 Corporate Governance Committee BIST Early Determination and Management of Risk Committee Remuneration Committee Froto BIST-100 Foreign ownership in free float (2016) Earnings per share (for Kr 1 nominal value) 70% 72% 73% 74% 72% 70% Jan Feb Mar Apr May June Page 35
36 Dividend History and Policy TL 4.97 billion (US$3.1 billion) dividend was distributed by Ford Otosan between Heavy capex period Dividend (TL mn, gross) Dividend (US$ mn, gross) In principle, subject to be covered by the resources existing in legal records, and subject to the decision of the Ordinary or Extraordinary General Assembly Meeting, excluding periods of large investment or severe economic downturn, by taking into consideration other legislation, financial and market conditions, long-term strategy, investment and financing policies, profitability and cash position, minimum 50% of the distributable profit for the period calculated within the framework of the Capital Markets Legislation is distributed in the form of cash or stock. Page 36
37 Strong & Committed JV Partner Support Turkey s largest industrial and services group in terms of revenues, exports, employees and market capitalization on the Borsa İstanbul. Following an average annual growth rate of 18% in consolidated profit in US$ terms between , Koç Holding ranks among the world s top 350 companies in Fortune 500 (2014 report). Has leading positions with strong competitive advantages in various sectors, such as energy, automotive, consumer durables and finance, which offer strong long-term growth potential. Global automotive industry leader based in Dearborn, Michigan, that manufactures and distributes automobiles across six continents. Automotive brands include Ford and Lincoln. 199,000 employees and 67 plants worldwide. Provides financial services through Ford Motor Credit Company. Page 37

38 Large Distribution Network (LCV/MCV/Passenger) Ford Otosan provides maintenance, servicing and repairs through its customer-focused and innovative sales and aftersales network that spans the whole country. Sales: 114 After-Sales: 125 Total 159 Page 38

39 Large Distribution Network (Ford Trucks) Ford Otosan provides maintenance, servicing and repairs through its customer-focused and innovative sales and aftersales network that spans the whole country. Sales: 27 After-Sales: 29 Total 30 Page 39
40 Efficient Production Hub Ford Otosan Kocaeli Plants (Gölcük & Yeniköy) Year-end Capacity ('000 units) Kocaeli Plants (Gölcük&Yeniköy) CUR 45% 34% 80% 100% 117% 100% 93% 82% 54% 74% 90% 83% 86% 59% 81% Turkey Industry CUR* 29% 35% 52% 73% 76% 81% 86% 77% 57% 72% 76% 68% 73% 70% 80% *Source: Automotive Manufacturers Association ( ) Page 40


, vehicle and engine HIL labs")

41 R&D Focused on Excellence Ford Otosan has the largest R&D center in Turkey with over 1,350 R&D engineers. Capability and infrastructure to design, develop and test a complete vehicle end-to-end, including its engine and engine systems. Sancaktepe R&D Center Center of Excellence for heavy trucks and related heavy duty diesel powertrains Design studio, CAVE lab (1 st in Turkey), vehicle and engine HIL labs İnönü Product Development Prototype engine manufacturing and testing The only facility to test extra heavy engines over 13L in Turkey Gölcük R&D Center Engine testing, vehicle testing and development workshops Patent Applications Page 41
42 Experienced and Skilled Workforce High School 17% Technical High School M. Sc. 22% B.Sc. B.A. 71% Primary & Secondary School 10% 54% University 2% Blue Collar PhD 1% Others 6% White Collar Vocational College 17% Page 42
43 Operating & Financial Performance Page 43
 SCT incentives (+) 792 SCT increase (-) 907 SCT increase (-) 812 885")


44 Turkish Automotive Industry (000 units) Global financial crisis (-) SCT incentives (+) 792 SCT increase (-) 907 SCT increase (-) , Turkish financial crisis (-) HCV MCV LCV PC Total Page 44
45 Turkish Market Shares (2015) Total Industry +0.9 ppt YoY Passenger Cars +0.2 ppt YoY 13.8% 12.6% 11.7% 10.9% 14.8% 14.0% 5.8% 6.9% 6.6% 6.5% 6.5% VW Ford Renault Fiat Mercedes VW Renault Hyundai Toyota Fiat Ford Light Commercial Vehicles Medium Commercial Vehicles Heavy Trucks +2.2 pps YoY +2.0 pps YoY +1.5 pps YoY 40.0% 33.7% 50.6% 25.9% 7.8% 7.6% 7.5% Fiat Ford* Citroen Peugeot VW 19.5% 8.9% 7.6% 7.5% Ford** VW Fiat Renault Mercedes 23.3% 9.8% 7.0% 3.6% Mercedes Ford Scania MAN Iveco * Courier and Connect ** Transit and Custom Page 45 Source: ODD and TAID
46 Turkish Market Shares (June YTD 2016) Total Industry Passenger Cars 15.5% 13.2% 13.1% 11.9% 10.3% 12.9% 5.4% 7.1% 6.8% 6.7% 6.3% VW Renault Ford Fiat Opel Renault VW Opel Fiat Hyundai Ford Light Commercial Vehicles Medium Commercial Vehicles Heavy Trucks 39.2% 33.1% 41.8% 26.7% 21.4% 25.8% 10.2% 7.4% 6.5% Fiat Ford* VW Peugeot Renault 8.3% 6.0% 5.7% Ford** VW Mercedes Renault Fiat 12.7% 7.7% 4.1% Mercedes Ford Scania MAN Renault * Courier and Connect ** Transit and Custom Page 46 Source: ODD and TAID
47 Turkish Market & Ford Otosan Retail Sales June'16 June'16 YTD June'15 YTD 2015 PC Units % Share Units % Share Units % Share Units % Share Ford Otosan 4, , , , Industry 71, , , ,596 LCV Ford Otosan 3, , , , Industry 11,497 52,690 57, ,286 MCV Ford Otosan 3, , , , Industry 8,932 47,645 47, ,135 Truck Ford Otosan , , , Industry 2,222 9,618 17,835 33,656 Total Ford Otosan 11, , , Industry 93, , ,588 1,005,850 Page 47
48 Production Volume by Segment (000 units) H15 1H16 Heavy Truck Light Commercial Vehicle Medium Commercial Vehicle Page 48
49 Wholesale Volume Domestic & Export (000 units) H15 1H16 Domestic Export Share of Exports 55% 56% 62% 68% 74% 60% 58% 60% 65% 67% 68% 67% 66% 71% Page 49
50 Sales Volume by Model 1H16 1H15 YoY % 2Q16 2Q15 YoY % Domestic 55,002 60,374-9% 32, % PC 18,263 22,957-20% 11,004 14,151-22% Transit Courier 16,453 16,140 2% 9,680 8,879 9% Transit Connect 1,470 1,359 8% % Total LCV 17,923 17,499 2% 10, % Transit 12,345 12,532-1% 7,032 6,169 14% Transit Custom 3,186 2,820 13% 1,909 1,536 24% Ranger % % Total MCV 16,264 15,458 5% 9,648 7,809 24% Cargo 2,552 4,460-43% 1,636 2,329-30% Export 135, ,827 17% 64,036 56,192 14% Transit Custom 65,607 54,794 20% 31,302 25,886 21% Transit 51,792 47,352 9% 23,904 23,570 1% Transit Courier 17,661 13,230 33% 8,578 6,512 32% Cargo % % Other % % Total 190, ,201 8% 96,942 90,330 7% Page 50
51 Volume Analysis (1H16) Total Sales Domestic Sales Domestic 29% Imports 37% Exports 71% From Production 63% Total Sales Exports by Model Imports 11% From Production 89% Custom 50% Transit 37% Courier 13% Page 51
52 Main Financial Indicators Million TL 1H16 1H15 YoY % 2Q16 2Q15 YoY% Total Revenues 8,800 7,526 17% 4,614 3,962 16% Export 6,057 4,703 29% 2,963 2,379 25% Domestic 2,743 2,822-3% 1,651 1,583 4% Gross Profit % % Operating Profit % % EBITDA % % Profit Before Tax % % Net Income % % Other Financial Data Depreciation & Amortization % % Financial Income / (Expense) % % Capex % % Page 52
53 Revenues - Domestic & Export 6,208 6,254 5,992 6,160 5,450 5,454 4,142 4,516 4,640 4,844 4,948 3,702 2,939 3,016 2, H15 1H16 Export (US$ bn) Domestic (US$ bn) Total (US$ bn) Total (TL bn) Share of Exports 46% 47% 47% 55% 62% 71% 57% 54% 56% 61% 64% 64% 64% 62% 69% Page 53
54 Operating Profit and Margin Operating Profit, US$ mn Operating Profit, TL mn Operating Margin (%) 8,8% 8,9% 8,7% 9,5% 8,7% 7,0% 8,0% 7,0% 6,5% 5,9% 4,5% 6,2% Page 54
55 EBITDA and EBITDA Margin Profitability rose in 2015 due to: New products Higher volumes in both domestic and export markets Favorable sales mix Focus on pricing against the backdrop of high currency volatility margin decline is due to: Changing business mix and highly competitive pricing landscape Industry shift towards PC leading to a less favorable sales mix Aged product portfolio Rising import costs and financial expenses due to TL volatility Higher capacity utilization Cost reduction actions EBITDA, US$ mn EBITDA, TL mn EBITDA Margin (%) 13,5% 13,2% 11,5% 11,7% 11,1% 10,1% 10,3% 8,4% 7,9% 7,5% 7,1% 8,6% Page 55
56 2Q and 1H Margins Operating Margin EBITDA Margin 6.3% 6.2% 6.2% 8.3% 8.8% 8.6% 8.7% 8.5% 5.7% 5.9% 1Q16 2Q15 2Q16 1H15 1H16 1Q16 2Q15 2Q16 1H15 1H16 Operating Margin (excl. Other items) EBITDA Margin (excl. Other items) 8.7% 8.2% 8.5% 8.4% 8.6% 6.0% 5.7% 6.0% 5.8% 6.0% 1Q16 2Q15 2Q16 1H15 1H16 1Q16 2Q15 2Q16 1H15 1H16 Page 56
57 PBT & Net Income Deferred Tax Asset * Net Income (Million $) Net Income (Million TL) Net Income Margin (%) 7,8% 6,6% 7,7% 6,7% 6,2% 6,0% 6,6% 6,3% 7,0% 5,6% 5,0% 5,0% Earnings Per Share (TL) 1,24 1,14 1,43 1,38 1,24 0,95 1,44 1,89 1,95 1,83 1,70 2,40 Profit Before Tax (Million TL) Profit Before Tax (Million $) * Net profit is higher than profit before tax due to deferred tax asset established in line with the investment incentives granted by the government. Page 57
58 Financial Risk Management Credit Risk Receivables from domestic vehicle sales to dealers are collected using a Direct Debit System Domestic spare part sales are guaranteed with collateral from dealers (bank guarantee letters) Receivables from Ford Motor Company and its subsidiaries are collected within 14 days Other exports are guaranteed using L/C, letter of guarantee or cash collection Liquidity Risk Cash, credit commitment and factoring capacity is maintained to meet 21 days cash outflow 80 million credit commitment & 70 million factoring agreements for potential needs. Net debt as of 1H16 is TL2.1 billion. FX Risk Excess cash is invested in hard currencies to minimize fx exposure Natural hedge against volatility due to fx-denominated export revenues: 64% of revenues Ford Otosan is a net exporter: US$ 3.0 billion in the last 5 years ( ) Capital Risk Net financial debt / tangible equity is monitored as a management criteria; capped at 1.25 Page 58
59 Debt Profile & Financial Ratios Cash Position (TL mn) Cash & Cash Equivalents Total Financial Debt (2,874) (2,561) Net Financial Debt (2,081) (1,580) Financial Ratios Current ratio Liquidity ratio Net Financial Debt / Tangible Net Worth Current Assets / Total Assets Current Liabilities / Total Liabilities Total Liabilities / Total Liabilities and Equity Return on Equity 29.1% 27.5% Margins Gross Margin 11.3% 11.1% EBITDA Margin 8.5% 8.7% EBITDA Margin (excl.other items) 8.6% 8.4% Operating Margin 5.9% 6.2% Net Income Margin 5.3% 5.4% Page 59
60 2016 Guidance Turkish Industry Volume 2015 Actuals 1,006 Tı K K 1 million Ford Otosan Retail Sales Volume 126 K K Exports 254 K K Wholesale Volume 381 K K Production Volume 335 K K Capex (fixed assets) 126 mn mn Guidance updated in August According to the Capital Markets Board, companies are allowed to provide guidance 4 times a year. Our next update will be announced as part of 9M16 financial results. Page 60

61 Contacts Aslı Selçuk Investor Relations Manager Alçin Hakca Investor Relations Officer Burak Çekmece Treasury & Risk Manager (Capital Markets Law Compliance) Disclaimer: This presentation contains forward-looking statements that reflect the Company management s current views with respect to certain future events. Although it is believed that the expectations reflected in these statements are reasonable, they may be affected by a variety of variables and changes in underlying assumptions that could cause actual results to differ materially.. Neither Ford Otosan nor any of its directors, managers or employees nor any other person shall have any liability whatsoever for any loss arising from use of this presentation. Page 61
Investor Presentation October 2015
 Investor Presentation October 2015 Contents About Ford Otosan 3 Plants and Facilities 9 Products 16 Investment Case 23 Operating and Financial Performance 40 2015 Guidance 56 Contacts 57 Page 2 About Ford
Investor Presentation
 Investor Presentation April 2017 Contents 2 About Ford Otosan 3 Plants and Facilities 10 Products 17 Investment Case 24 Operating and Financial Performance 42 Guidance 60 Contacts 61 About Ford Otosan
Investor Presentation
 Investor Presentation August 2017 Contents 2 About Ford Otosan 3 Plants and Facilities 10 Products 17 Investment Case 24 Operating and Financial Performance 42 Guidance 61 Contacts 62 About Ford Otosan
Investor Presentation
 Investor Presentation January 2018 Contents 2 About Ford Otosan 3 Plants and Facilities 11 Products 18 Investment Case 25 Operating and Financial Performance 45 Guidance 65 Contacts 66 3 About Ford Otosan
Investor Presentation May Herkese Açık Public
 Investor Presentation May 2018 Contents 2 About Ford Otosan 3 Plants and Facilities 11 Products 18 Investment Case 24 Operating and Financial Performance 44 Guidance 64 Contacts 65 3 About Ford Otosan
Investor Presentation September Herkese Açık Public
 Investor Presentation September 2018 Contents 2 About Ford Otosan 3 Plants and Facilities 11 Products 18 Investment Case 24 Operating and Financial Performance 44 Guidance 64 Contacts 65 3 About Ford Otosan
Investor Presentation
 Investor Presentation February 2018 Contents 2 About Ford Otosan 3 Plants and Facilities 11 Products 18 Investment Case 25 Operating and Financial Performance 45 Guidance 65 Contacts 66 3 About Ford Otosan
Investor Presentation
 Investor Presentation October 2013 Company Profile Key Performance Indicators, 2012 Net Sales $ 5.5 billion Export Revenues $ 3.2 billion EBITDA $ 444 million Profit Before Tax Net Profit $ 358 million
INVESTOR PRESENTATION. February 2011
 INVESTOR PRESENTATION February 2011 Agenda Ford Otosan Overview Turkish Automotive Industry Overview Competitive Advantages Key Operating Data ISE Performance 2 Investor Presentation February 2011 FORD
Investor Presentation. January 2013
 Investor Presentation January 2013 Company Profile Key Performance Indicators, 2011 Net Sales Export Revenues EBITDA Profit Before Tax $ 6.3 billion $ 3.5 billion $ 524 million $ 479 million Net Profit
TOFAŞ Q ANALYST PRESENTATION
 TOFAŞ Q1 2016 ANALYST PRESENTATION 03.05.2016 1 2016 Q1 AGENDA Highlights Turkish Automotive Industry Production & Capacity Utilization Domestic Market Developments Tofaş Domestic Market Performance Export
TOFAŞ RESULTS WEBCAST PRESENTATION
 TOFAŞ 31.12.2017 RESULTS WEBCAST PRESENTATION 02.02.2018 AGENDA Highlights Turkish Automotive Industry Production Domestic Market Developments Tofaş Domestic Market Performance Export Markets & Tofaş Performance
TOFAŞ RESULTS WEBCAST PRESENTATION
 TOFAŞ 31.12.2016 RESULTS WEBCAST PRESENTATION 02.02.2017 1 WEBCAST AGENDA Highlights Turkish Automotive Industry Production Domestic Market Developments Tofaş Domestic Market Performance Export Markets
Q Analyst Teleconference. 9 August 2018
 9 August 218 Disclaimer This presentation contains forward-looking statements that reflect the Company management s current views with respect to certain future events. Although it is believed that the
FISCAL YEAR MARCH 2018 FIRST HALF FINANCIAL RESULTS
 FISCAL YEAR MARCH 2018 FIRST HALF FINANCIAL RESULTS PRESENTATION OUTLINE Highlights Fiscal Year March 2018 First Half Results Fiscal Year March 2018 Full Year Forecast Progress of Key Initiatives/ Business
CASTING WEIGHT REDUCTION BY DIE DESIGN TOPOLOGY OPTIMISATION M.Sc.Aircraft & Mechanical Engineer Kadir Akcan
 CASTING WEIGHT REDUCTION BY DIE DESIGN TOPOLOGY OPTIMISATION M.Sc.Aircraft & Mechanical Engineer Kadir Akcan CONTENTS Company Profile of Ford Otosan A.Ş Project Aim Manufacturing of Sheet Metal Parts and
FISCAL YEAR MARCH 2014 FINANCIAL RESULTS
 FISCAL YEAR MARCH 214 FINANCIAL RESULTS Mazda CX-5 Mazda Atenza Mazda Motor Corporation April 25, 214 New Mazda Axela 1 PRESENTATION OUTLINE Highlights Fiscal Year March 214 Results Fiscal Year March 215
FISCAL YEAR MARCH 2018 FIRST QUARTER FINANCIAL RESULTS
 FISCAL YEAR MARCH 2018 FIRST QUARTER FINANCIAL RESULTS PRESENTATION OUTLINE Highlights Fiscal Year March 2018 First Quarter Results Fiscal Year March 2018 Full Year Forecast Structural Reform Stage 2 Progress
FISCAL YEAR MARCH 2015 FIRST HALF FINANCIAL RESULTS. New Mazda Demio
 FISCAL YEAR MARCH 2015 FIRST HALF FINANCIAL RESULTS New Mazda Demio Mazda Motor Corporation October 31, 2014 1 PRESENTATION OUTLINE Highlights Fiscal Year March 2015 First Half Results Fiscal Year March
SOLLERS IFRS RESULTS 1H2017
 SOLLERS IFRS RESULTS 1H2017 28.08.2017 2 1. 1H2017 SOLLERS STRATEGIC DEVELOPMENTS 2. RUSSIAN AUTOMOTIVE MARKET OVERVIEW 3. SOLLERS OPERATING AND FINANCIAL PERFORMANCE IN 1H2017 4. SOLLERS JOINT VENTURES
FISCAL YEAR MARCH 2015 FIRST QUARTER FINANCIAL RESULTS. Mazda Roadster 25 th Anniversary Model
 FISCAL YEAR MARCH 2015 FIRST QUARTER FINANCIAL RESULTS Mazda Roadster 25 th Anniversary Model Mazda Motor Corporation July 31, 2014 1 PRESENTATION OUTLINE Highlights Fiscal Year March 2015 First Quarter
Jaguar Land Rover Results For the quarter ended 30 June August 2015
 Jaguar Land Rover Results For the quarter ended 30 June 2015 7 August 2015 1 Disclaimer Statements in this presentation describing the objectives, projections, estimates and expectations of Jaguar Land
FISCAL YEAR MARCH 2015 THIRD QUARTER FINANCIAL RESULTS. Updated Mazda CX-5 (Japanese specification model)
") FISCAL YEAR MARCH 2015 THIRD QUARTER FINANCIAL RESULTS Updated Mazda CX-5 (Japanese specification model) Mazda Motor Corporation February 4, 2015 1 PRESENTATION OUTLINE Highlights Fiscal Year March 2015
FISCAL YEAR MARCH 2015 THIRD QUARTER FINANCIAL RESULTS Updated Mazda CX-5 (Japanese specification model) Mazda Motor Corporation February 4, 2015 1 PRESENTATION OUTLINE Highlights Fiscal Year March 2015
3 rd Quarter 2017 Results
 Inside your life! 3 rd Quarter 2017 Results October 25, 2017 Mobile Automotive Display Semiconductor IoT LED Contents Ⅰ. Q3 2017 Earnings Summary Ⅱ. Earnings Highlight & Outlook Ⅲ. Results & Outlook by
FISCAL YEAR MARCH 2018 THIRD QUARTER FINANCIAL RESULTS
 FISCAL YEAR MARCH 2018 THIRD QUARTER FINANCIAL RESULTS PRESENTATION OUTLINE Highlights Fiscal Year March 2018 Nine Month Results Fiscal Year March 2018 Full Year Forecast Progress of Key Initiatives 1
INVESTOR PRESENTATION 2016
 INVESTOR PRESENTATION 2016 WHY BRISA IS A GREAT COMPANY TO INVEST 1. Fast growing market: o Increasing capacity and new investments of automotive manufacturers o Continued growth potential in the domestic
February Annual Results February 13, 2008
 February 2008 1 Annual Results February 13, 2008 AGENDA AGENDA 2007 Highlights 2007 Financial Results x Competitiveness Sales and products dynamic International 2008 Outlook February 2008 2 2007: performance
SOLLERS IFRS RESULTS
 SOLLERS IFRS RESULTS 2017 03.05.2018 2 1. 2017 SOLLERS STRATEGIC DEVELOPMENTS 2. RUSSIAN AUTOMOTIVE MARKET OVERVIEW 3. SOLLERS OPERATING AND FINANCIAL PERFORMANCE IN 2017 4. SOLLERS JOINT VENTURES RESULTS
Months Investor Presentation
 2018 9 Months Investor Presentation 25.10.2018 Disclaimer Ereğli Demir Çelik Fabrikaları T.A.Ş. (Erdemir) may, when necessary, make written or verbal announcements about forward-looking information, expectations,
FISCAL YEAR END MARCH 2013 FIRST HALF FINANCIAL RESULTS. New Mazda6 (Atenza)
") FISCAL YEAR END MARCH 2013 FIRST HALF FINANCIAL RESULTS New Mazda6 (Atenza) Mazda Motor Corporation October 31, 2012 1 PRESENTATION OUTLINE Highlights Fiscal Year March 2013 First Half Results Fiscal Year
FISCAL YEAR END MARCH 2013 FIRST HALF FINANCIAL RESULTS New Mazda6 (Atenza) Mazda Motor Corporation October 31, 2012 1 PRESENTATION OUTLINE Highlights Fiscal Year March 2013 First Half Results Fiscal Year
I remind you that our presentation is available on our website. We can start from the first 2 slides that show Piaggio Group First
 CONFERENCE CALL 2009 1 st HALF RESULTS Good afternoon and welcome to everybody. I remind you that our presentation is available on our website. We can start from the first 2 slides that show Piaggio Group
Strong performance by the Bolloré Group s operating activities in 2018 Mr Cyrille Bolloré unanimously appointed Chairman and Chief Executive Officer
 PRESS RELEASE 2018 results (1) March 14, 2019 Strong performance by the Bolloré Group s operating activities in 2018 Mr Cyrille Bolloré unanimously appointed Chairman and Chief Executive Officer Revenue:
FISCAL YEAR END MARCH 2013 FIRST QUARTER FINANCIAL RESULTS
 FISCAL YEAR END MARCH 213 FIRST QUARTER FINANCIAL RESULTS New MAZDA CX-5 Mazda Motor Corporation July 31, 212 1 PRESENTATION OUTLINE Highlights Fiscal Year End March 213 Results Update of Structural Reform
RENAULT GROUP SOCIETE GENERALE CONFERENCE
 RENAULT GROUP SOCIETE GENERALE CONFERENCE DOMINIQUE THORMANN, EVP, CFO & RCI Banque CEO NOVEMBER 30th, 2011 DISCLAIMER Information contained within this document may contain forward looking statements.
FISCAL YEAR ENDED MARCH 2011 FINANCIAL RESULTS
 FISCAL YEAR ENDED MARCH 211 FINANCIAL RESULTS Mazda Motor Corporation April 28, 211 Mazda MINAGI 1 PRESENTATION OUTLINE Highlights Fiscal Year Ended March 211 Results In Summary Question & Answer Session
JAGUAR LAND ROVER RESULTS FOR THE THREE MONTHS ENDED 31 DECEMBER th FEBRUARY 2017
 JAGUAR LAND ROVER RESULTS FOR THE THREE MONTHS ENDED 31 DECEMBER 2016 14 th FEBRUARY 2017 DISCLAIMER Statements in this presentation describing the objectives, projections, estimates and expectations of
Disclaimer: Jardine Cycle & Carriage accepts no liability whatsoever with respect to the use of this document or its contents.
 Disclaimer: Jardine Cycle & Carriage accepts no liability whatsoever with respect to the use of this document or its contents. Highlights Underlying earnings per share 22% down Astra profit lower and contribution
JAGUAR LAND ROVER INVESTOR CALL
 JAGUAR LAND ROVER INVESTOR CALL RESULTS FOR THE THREE AND SIX MONTHS ENDED 30 SEPTEMBER 2017 Kenneth Gregor, CFO 9 th NOVEMBER 2017 DISCLAIMER Statements in this presentation describing the objectives,
STAR CONFERENCE PRESENTATION
 STAR CONFERENCE PRESENTATION 1 London October 9 th, 2008 A worldwide technological and market leader on vehicles two key system components SUSPENSION FLEXIBLE COMPONENTS ENGINE AND CABIN FILTRATION coil
RESULTS FOR Q ANALYST TELECONFERENCE
 RESULTS FOR Q4 216 ANALYST TELECONFERENCE Market 1 2 Operation Financials 3 Market 1 216 Fourth Quarter Market Conditions Product Market Crude Oil Postponed Maintenances Started to take place High Agricultural
FISCAL YEAR ENDING MARCH 2012 FIRST HALF FINANCIAL RESULTS
 FISCAL YEAR ENDING MARCH 2012 FIRST HALF FINANCIAL RESULTS Mazda Motor Corporation November 2, 2011 New Mazda CX-5 (European specifications) 1 PRESENTATION OUTLINE Highlights Fiscal Year Ending March 2012
On track. Investor and Analyst Presentation On the Occasion of the Release of the Preliminary Figures for FY 2011 Hanover, 19 January 2012
 On track. Investor and Analyst Presentation On the Occasion of the Release of the Preliminary Figures for FY 2011 Agenda Delticom at a Glance Business Model Profit & Loss Balance Sheet Outlook 2 Agenda
SOLLERS COMPANY OVERVIEW
 SOLLERS COMPANY OVERVIEW 1. CORPORATE STRUCTURE GROUP PRODUCTION FACILITIES 2. FY2015 MARKET OVERVIEW FY2015 OPERATING RESULTS 3. 2M2016 OPERATING RESULTS SHAREHOLDER EQUITY AND STOCK INFORMATION 2 CORPORATE
FISCAL YEAR MARCH 2014 FIRST HALF FINANCIAL RESULTS. New Mazda Axela (Overseas name: New Mazda3)
") FISCAL YEAR MARCH 2014 FIRST HALF FINANCIAL RESULTS New Mazda Axela (Overseas name: New Mazda3) Mazda Motor Corporation October 31, 2013 1 PRESENTATION OUTLINE Highlights Fiscal Year March 2014 First Half
FISCAL YEAR MARCH 2014 FIRST HALF FINANCIAL RESULTS New Mazda Axela (Overseas name: New Mazda3) Mazda Motor Corporation October 31, 2013 1 PRESENTATION OUTLINE Highlights Fiscal Year March 2014 First Half
Consolidated Financial Results for 1Q FY2016 July 29, 2016 Fuji Electric Co., Ltd.
 Consolidated Financial Results for 1Q FY2016 July 29, 2016 Fuji Electric Co., Ltd. 2016Fuji Electric Co., Ltd. All rights reserved. 1 Summary of Consolidated Financial Results for 1Q FY2016 (YoY Comparison)
Interim results June 30, 2003
 1 Interim results June 30, 2003 2 In units W orldwide sales at June 30 (cars and light commercial vehicles) > Worldwide sales at June 30, 2003: 1,689,200 cars and light commercial vehicles, versus 1,656,900
Full-year Report 2009
 Full-year Report 2009 Joakim Olsson CEO and President February 12, 2009 Innovative Vehicle Technology 2010-02-12 Summary 2009 Sales of SEK 5,622m (8,403) Adjusted for currency effects sales decreased by
Respect for customers, partners and staff. Service: another name for the respect that a company owes its customers, partners and staff.
 Respect for customers, partners and staff Service: another name for the respect that a company owes its customers, partners and staff. Vehicle glass KEY FIGURES (in EUR million) 2004 2003 % change Total
Q3 & 9M 2018 Results Presentation. October 24 th, 2018
 Q3 & 9M 2018 Results Presentation October 24 th, 2018 Q3 & 9M HIGHLIGHTS & CATEGORY SPOTLIGHTS Gonzalve BICH 3Q and 9M 2018 Results Presentation 2 9 Months 2018 Key Messages Continued challenging trading
On track. Investor and Analyst Presentation On the Occasion of the Release of the Preliminary Figures for 9M 2011 Hanover, 18 October 2011
 On track. Investor and Analyst Presentation On the Occasion of the Release of the Preliminary Figures for 9M 2011 Agenda Delticom at a Glance Business Model Profit & Loss Balance Sheet Outlook 2 Agenda
Half Year Results. "Technical perfection, automotive passion" 23 July 2002
 Half Year Results "Technical perfection, automotive passion" 23 July 2002 Presentation outline Faurecia in brief 1 st half year: major events 1 st half year: results 2 nd half year: perspectives 2 Presentation
Healthier Net Profit under Stronger IDR
 Investor Bulletin, First Half 2002 Healthier Net Profit under Stronger IDR As of June 2002, the consolidated revenue in USD increased by 32% y.o.y. Due to IDR strengthening against USD, in IDR revenue
BMW Group posts record earnings for 2010
 10.03.2011 BMW Group posts record earnings for 2010 Profit before tax rises to euro 4,836 million Profit before financial result climbs to euro 5,094 million Automobiles segment reports EBIT of euro 4,355
1 st Half 2018 Results. August 1 st, 2018
 1 st Half 2018 Results August 1 st, 2018 H1 HIGHLIGHTS & CATEGORY SPOTLIGHTS Gonzalve BICH 2 First Half 2018 Key Messages Challenging market and business environment Continued investment in targeted Brand
Corporate Communications. Media Information 15 March 2011
 15 March 2011 BMW Group aims to further increase earnings in 2011 EBIT margin of over 8% expected in Automobiles segment Sales volume of well in excess of 1.5 million vehicles targeted Margin of 8% to
Kongsberg Automotive ASA. Fourth quarter February 28, 2019
 Kongsberg Automotive ASA Fourth quarter - February 28, 2019 Highlights Q4 Sales Revenues grew by 21 (7.3%) YoY to 288 including negative FX effects of 1. We booked new business with 77 in expected annual
COMPANY PRESENTATION 1H 2007 TEAM WORKING GLOBAL THINKING
 COMPANY PRESENTATION 1H 2007 TEAM WORKING GLOBAL THINKING London, October 3rd & 4th, 2007 WORLD S LEADERSHIP ON TWO KEY VEHICLES TECHNOLOGIES ENGINE FILTRATION SYSTEMS FLEXIBLE COMPONENTS FOR SUSPENSION
Fact Sheet for Q April 22, 2016
 Fact Sheet for Q1 2016 April 22, 2016 Contents Daimler Group Stock Market Information 3 Earnings and Financial Situation 4-13 Information for Divisions Mercedes-Benz Cars 14-17 Daimler Trucks 18-22 Mercedes-Benz
INCREASING SALES FOR MINING RELATED BUSINESS
 Investor Relations of PT UNITED TRACTORS Tbk INCREASING SALES FOR MINING RELATED BUSINESS In the first half 2001, the Company managed to record increase in net revenue from IDR 2.32 trillion to IDR 3.54
Annual Press Conference 2011 Results
 Annual Press Conference 2011 Results Dr. Dieter Zetsche Chairman of the Board of Management Head of Mercedes-Benz Cars February 09, 2012 2 Last year s outlook Daimler results in 2011 Set all-time sales
FISCAL YEAR MARCH 2015 FINANCIAL RESULTS. New Mazda CX-3 (Japanese specification model)
") FISCAL YEAR MARCH 2015 FINANCIAL RESULTS New Mazda CX-3 (Japanese specification model) Mazda Motor Corporation April 24, 2015 1 PRESENTATION OUTLINE Highlights Fiscal Year March 2015 Results Fiscal Year
FISCAL YEAR MARCH 2015 FINANCIAL RESULTS New Mazda CX-3 (Japanese specification model) Mazda Motor Corporation April 24, 2015 1 PRESENTATION OUTLINE Highlights Fiscal Year March 2015 Results Fiscal Year
Q Financial Results
 Q3 2018 Financial Results 1 Forward-looking statement The statements on the future in this presentation, including expected sales and earnings, are associated with risks and uncertainties and may be affected
Conférence d Automne - Cheuvreux. Paris, September 26 th, 2011
 Conférence d Automne - Cheuvreux Paris, September 26 th, 2011 This presentation may contain forward-looking statements. Such forward-looking statements do not constitute forecasts regarding the Company
Investor presentation May The Origin of HighTech.
 Investor presentation May 2014 The Origin of HighTech. Agenda DEUTZ strategy & positioning Financials Outlook 2 DEUTZ at a glance 150 years DEUTZ a tradition of achievement Independent manufacturer of
VI SMALL CAPS CONFERENCE
 VI SMALL CAPS CONFERENCE 1 Milano November 27 th, 2008 A worldwide technological and market leader on two key vehicles components SUSPENSION FLEXIBLE COMPONENTS ENGINE AND CABIN FILTRATION SYSTEMS coil
ZF posts record sales in 2017; announces increased research and development activities
 Page 1/5, March 22, 2018 ZF posts record sales in 2017; announces increased research and development activities ZF chief executive officer announces further expansion of research and development activities
Conference Call H Düsseldorf August 4, 2016
 R H E I N M E TA L L A G T H E T EC H N O LO GY G RO U P FO R S EC U R I T Y A N D M O B I L I T Y Conference Call Düsseldorf August 4, 2016 RHEINMETALL AG 2016 Rheinmetall Group Highlights Increased sales,
Q Sales and Revenues. April 22, 2009
 1 Q1 2009 Sales and Revenues 1 April 22, 2009 KEY HIGHLIGHTS Q1 revenues drop 24.9% in line with markets and inventory reduction policy Substantial decrease in inventories (-21.4% vs Q1-08 ) Market share
Q3 and January-September 2014 Results
 Q3 and January-September 2014 Results Bodo Uebber Member of the Board of Management Finance & Controlling and Daimler Financial Services October 23, 2014 1 2 Contents Results for Q3 2014 Outlook for 2014
FY 2017 Results. Disclaimer: Jardine Cycle & Carriage accepts no liability whatsoever with respect to the use of this document or its contents.
 FY 2017 Results Disclaimer: Jardine Cycle & Carriage accepts no liability whatsoever with respect to the use of this document or its contents. FINANCIAL HIGHLIGHTS Financial Highlights Underlying earnings
Mazda Motor Corporation FISCAL YEAR MARCH 2016 FIRST HALF FINANCIAL RESULTS (Speech Outline)
") (For your information) November 5, 2015 Mazda Motor Corporation FISCAL YEAR MARCH 2016 FIRST HALF FINANCIAL RESULTS (Speech Outline) Representative Director Executive Vice President Akira Marumoto 1. HIGHLIGHTS
(For your information) November 5, 2015 Mazda Motor Corporation FISCAL YEAR MARCH 2016 FIRST HALF FINANCIAL RESULTS (Speech Outline) Representative Director Executive Vice President Akira Marumoto 1. HIGHLIGHTS
European Bank for Reconstruction and Development
 European Bank for Reconstruction and Development EBRD Strategy in Automotive Sector Russia Alexei Sheloukhin Principal Banker, Corporate Sector, Russia Head of Automotive 13 April 2011 Kaluga Automotive
1959 March Production commences at Yulon Motor Co., Ltd. in Taiwan, the Company s first overseas KD factory.
 Corporate History 1980 July Nissan Motor Manufacturing Corporation U.S.A. is established. 1933 1940 1935 April The first car manufactured by a fully integrated assembly system rolls off the line at the
Third quarter AB Volvo
 Third quarter 2013 Third quarter 2013 TRUCKS EUROPE Excellent reception of the new products decision to optimize manufacturing Highlights in Commercial launch of the new product ranges Strong order situation
1 st Half Joakim Olsson CEO and President July 17, Innovative Vehicle Technology
 1 st Half 2009 Joakim Olsson CEO and President July 17, 2009 Innovative Vehicle Technology 2009-07-17 Summary 1st half 2009 Sales of SEK 2,971m (4,473) Adjusted for currency exchange rates, sales declined
DEUTZ Investor Presentation August 2016
 DEUTZ Investor Presentation August 2016 Agenda DEUTZ strategy & positioning Financials Outlook 2 DEUTZ at a glance World s first engine factory founded in 1864 by N.A. Otto, the developer of the four the
Mazda Motor Corporation June 17, 2011
 FY ENDING MARCH 2012 FINANCIAL FORECAST New MAZDA Demio 13-SKYACTIV Mazda Motor Corporation June 17, 2011 1 PRESENTATION OUTLINE FY ending March 2012 Forecast Updates of Framework for Medium- and Long-term
Lazydays Holdings, Inc. Reports Second Quarter 2018 Financial Results
 News Contact: +1 (813) 204-4099 investors@lazydays.com Lazydays Holdings, Inc. Reports Second Quarter 2018 Financial Results Tampa, FL (August 9, 2018) Lazydays Holdings, Inc. ( Lazydays )(NasdaqCM: LAZY)
BMW GROUP QUARTERLY REPORT. TO 30 SEPTEMBER 2014
 . BMW GROUP QUARTERLY REPORT. TO 30 SEPTEMBER 2014 THE BMW GROUP IS WELL ON TRACK AND PERFORMS IN LINE WITH THE GUIDANCE. The BMW Group is well on track to reach its targets for 2014. Full year guidance
THREE MONTHS REPORT, JAN MARCH 2016
 THREE MONTHS REPORT, JAN MARCH 2016 TELEPHONE CONFERENCE 26 APRIL, 2016, AT 14:30 CET TOMMY ANDERSSON, PRESIDENT AND CEO HELENA WENNERSTRÖM, EVP AND CFO TO PARTICIPATE, PLEASE CALL 5 MINUTES BEFORE THE
BorjaEsteban AN INTEGRATED INDUSTRIAL POLICY FOR THE GLOBALISATION ERA. Madrid, 21 October Institutional Relations Spain
 European Economic and Social Committee Consultative Commission on Industrial Change (CCMI) BorjaEsteban Institutional Relations Spain AN INTEGRATED INDUSTRIAL POLICY FOR THE GLOBALISATION ERA Madrid, 21
Record CY 2016 EPS-diluted-adjusted of $6.12, an increase of $1.10 Y-O-Y. Q EPS-diluted-adjusted of $1.28, a decrease of $0.11 Y-O-Y.
 1 2 3 Q4 2016 global deliveries up 0.1 million units year-over-year (Y-O-Y), a 3.3% increase. Volume gains primarily in North America and China, offset by reductions in International Operations (excluding
Ford of Europe Fact Sheet April 2016
 Ford of Europe Communications & Public Affairs Fact Sheet April 2016, page 1/6 Ford of Europe Fact Sheet April 2016 Ford Motor Company is a global automotive and mobility company based in Dearborn, Michigan.
Table 1 ANTIGUA AND BARBUDA: MAIN ECONOMIC INDICATORS
 Antigua Tables 2006 1 Main Indicators 03/11/2006 08:05 AM Table 1 ANTIGUA AND BARBUDA: MAIN ECONOMIC INDICATORS 1996 1997 1998 1999 2000 2001 2002 2003 2004 2005 a/ Annual growth rates b/ Gross domestic
RESILIENCE MBM RESOURCES BERHAD ( V) Analyst Briefing 24 August 2017
 Analyst Briefing 24 August 2017") RESILIENCE MBM RESOURCES BERHAD (284496-V) Analyst Briefing 24 August 217 1 1 DISCLAIMER The information and opinions contained in this presentation are provided as at the date of the document. Certain
RESILIENCE MBM RESOURCES BERHAD (284496-V) Analyst Briefing 24 August 217 1 1 DISCLAIMER The information and opinions contained in this presentation are provided as at the date of the document. Certain
Q Results. Bodo Uebber. Member of the Board of Management Finance & Controlling and Daimler Financial Services
 Q1 2014 Results Bodo Uebber Member of the Board of Management Finance & Controlling and Daimler Financial Services April 30, 2014 1 Contents Results for Q1 2014 Outlook for 2014 Information on the Divisions
ECONOMIC BULLETIN - No. 42, MARCH Statistical tables
 ECONOMIC BULLETIN - No. 42, MARCH 2006 APPENDIX Appendix Statistical tables The world economy Table a1 Gross domestic product a2 Industrial production a3 Consumer prices a4 External current account a5
Q1 Report Joakim Olsson CEO and President April 23, Innovative Vehicle Technology
 Q1 Report 2010 Joakim Olsson CEO and President April 23, 2010 Innovative Vehicle Technology 2010-04-23 Summary 1st quarter 2010 Sales of SEK 1,600m (1,562) Adjusted for currency-exchange fluctuations and
ANALYST BRIEFING FOR THE THIRD QUARTER ENDED NOV 2016
 ANALYST BRIEFING FOR THE THIRD QUARTER ENDED 2016 21 NOV 2016 MSM Malaysia Holdings Berhad Analyst Briefing Q3 2016 21/11/2016 1 CONTENTS 01 02 03 04 05 Group Financial Highlights Performance Review Sugar
282m 75% +575m. Net sales Operating income before non-recurring items. Operating margin before non-recurring items. Net Loss.
 First-Half 2009 Financial Highlights Net sales Operating income before non-recurring items Operating margin before non-recurring items Net Loss Net debt-to-equity ratio Free cash flow** 7,134m 282m 4.0%
Driving Value in an Inflated Market. June 24, 2015
 Driving Value in an Inflated Market June 24, 2015 Group 1 Automotive Ticker: GPI Stock Price: $82.53 * Group 1 owns and operates auto dealerships Third largest dealership group in the U.S. retailing 275,000
PT Astra International Tbk 2011 Full Year Financial Statements
 To: Business Editor For immediate release PT Astra International Tbk 2011 Full Year Financial Statements The following announcement was issued today by the Company s 71%-owned subsidiary, Jardine Cycle
Financial Summary for 2Q-FY2017 And Projections for FY2017
 Financial Summary for 2Q-FY2017 And Projections for FY2017 1 INDEX 01 Financial Summary for 2Q-FY2017 02 Performance Forecast for FY2017 03 Topics 2 01 Financial Summary for 2Q-FY2017 3 01 Financial Summary
Q3 report Joakim Olsson CEO and President October 24, Innovative Vehicle Technology
 Q3 report 2008 Joakim Olsson CEO and President October 24, 2008 Innovative Vehicle Technology 2008-10-24 Summary YTD 2008 Orders Received of 6 401 MSEK (6 077) Currency adjusted orders increased with 9
Valvoline Fourth-Quarter Fiscal 2016 Earnings Conference Call. November 9, 2016
 Valvoline Fourth-Quarter Fiscal 2016 Earnings Conference Call November 9, 2016 Forward-Looking Statements This presentation contains forward-looking statements within the meaning of Section 27A of the
Earnings Presentation
 Earnings Presentation www.savola.com DISCLAIMER This presentation contains forward-looking statements which may be identified by the use of words like plans, expects, will, anticipates, believes, intends,
Tofaş Türk Otomobil Fabrikası A.Ş.
 Tofaş Türk Otomobil Fabrikası A.Ş. REPORT ON ASSOCIATED PARTY TRANSACTIONS WHICH WERE PERFORMED IN 2014 AND WILL BE REPEATED IN 2015 UNDER THE SAME CONDITIONS General Information This report is created
#Q3_2018. Orange financial results. Ramon Fernandez Deputy CEO, Finance, Performance and Europe. 25 October 2018
 #Q3_20 Orange financial results Ramon Fernandez Deputy CEO, Finance, Performance and Europe 25 October 20 Disclaimer This presentation may contain forward-looking statements about Orange, particularly
Preliminary Results 12 May 2009
 Preliminary Results 12 May 2009 Working together for Greener logistics solutions For period ended 28 February 2009 www.stobartgroup.com Highlights Year of growth, laying foundations for the multimodal
third QUARTER 2012 October 26, 2012
 third QUARTER 212 October 26, 212 Helena norrman Senior Vice President Communications third QUARTER 212 October 26, 212 This presentation contains forward-looking statements. Such statements are based