LET S ARGUE: STUDENT WORK PAMELA RAWSON. Baxter Academy for Technology & Science Portland, rawsonmath.
|
|
|
- Sherman Harvey
- 5 years ago
- Views:
Transcription
1 LET S ARGUE: STUDENT WORK PAMELA RAWSON Baxter Academy for Technology & Science Portland, Maine rawsonmath.com
2 Contents Student Movie Data Claims (Cycle 1)... 2 Student Predictions About Car Data (Cycle 2)... 3 Student claim statements about car data (Cycle 2)... 6 Sample student essay about car data (Cycle 2)... 9 Sample tudent analysis of movie data (Cycle 3) Sample student class data analysis (Cycle 4)
3 Student Movie Data Claims (Cycle 1) Claim Evidence Reasoning The average critic rating for original movies is typically higher than the average critic rating for sequels. Given that the average critic rating for a original film is 8.25, compared to a average sequel rating of 6.45 there is a 1.8 difference found in the average ratings. This supports the claim by showing that original films receive a higher critic rating whereas sequels, remakes, etc. receive a lower rating. The average critic rating for original movies is typically higher than the average critic rating for sequels. The median rating for original films is 8.25 while the median for sequels is This proves that the average critic rating for original movies is higher because the sequel data is very spread out while the original data is consistently higher on the plot The average critic rating for original movies is typically higher than the average critic rating for sequels. This supports the claim because the average scores being higher for originals than sequels is basically saying strait up that the originals were rated better and its 8.25 to 6.45 so that's a massive difference on a 10 point scale. This part needs to be explained more and should come before the reasoning statement(s). The average critic rating for original movies is typically higher than the average critic rating for sequels. The evidence is that the median of the originals is 8.25/10 and the sequels average rating is This means that the sub-claim that the average rating for originals is higher than sequels is true based on our data used. The average critic rating for original movies is typically higher than the average critic rating for sequels. The median of original movie ratings is 8.25 and the median for sequel movie ratings is That alone is not enough to prove that original movies are higher rated than sequels but the Q1 of original movies is also more than the Q3 of sequels. That shows that original movies are typically higher rated than the sequels because more than 75% of original movies are rated higher than 75% of sequels. This last part is nice, but it does not provide evidence for comparing the medians Original movies are typically better than sequels, the average critic rating for original movies is typically higher than the average rating for sequels. This is evidenced by the fact that the median critic score for original movies was 8.25, compared to a median of 6.45 for sequels. This is a good beginning, but needs some reasoning (so, what?) to wrap up the paragraph. 2
4 Student Predictions About Car Data (Cycle 2) Students were presented with the following information and asked to make predictions. Their responses are included below. I have some data about cars, including highway mpg (quantitative), curb weight (quantitative), and fuel type (categorical: gas, hybrid, electric) Think about how these variables might be related and make some predictions. 1. How might the highway mpg and curb weight be related? The weight of the car the smaller the Mpg The mpg will decrease with the curb weight curb weight up mpg down they could be related because of aerodynamics and how inertia would be taking the car higher weight = less mpg; lower weight = more mpg The higher the curb weight the lower the mpg more weight may cause less mpg more gas to make a heavier car go 2. How might curb weight and fuel type be related? Electricity weights less than gas Heavier cars might use gas and lighter cars might use electricity or be hybrids the curb weight would be lower if electric and hevier [sic] if hybrid batteries weigh more than hollow gas tanks gas/hybrid cars might be heavier on account of the engine different fuel types have limited curb weight weight might be lower for electric higher curb weight will need more efficient fuel to go a long distance 3. How might highway mpg and fuel type be related? Some fuel lasts longer than others Cars that can use electricity might have higher mpg more efficient feul [sic] better mpg electric might be more efficient than gas/hybrid different fuel types have better mpg MPG may be higher for gas cars Some fuel will mean more highway mpg than others 4. Do you think there might be outliers or influential points? If so, what might they be? Yes different models of cars will put outliers for the categories It is likely. There might be a car that is heavy but has a high mpg, or a light car that has a low mpg. most likely no because most manufactuers [sic] would try to be similar and efficient yes there would be at least one outlier: a hummer 3

5 some outliers might be much less/more efficient probably not maybe hummer or something that consumes a ton of fuel yes because of different cars, antiques are going to take more gas than new cars After students wrote their predictions, we discussed each question as a class. The picture below summarizes the discussion. The scatter plots show different configurations that students expected to see once they had the data to plot. Here is one plot from the Google spreadsheet: 4
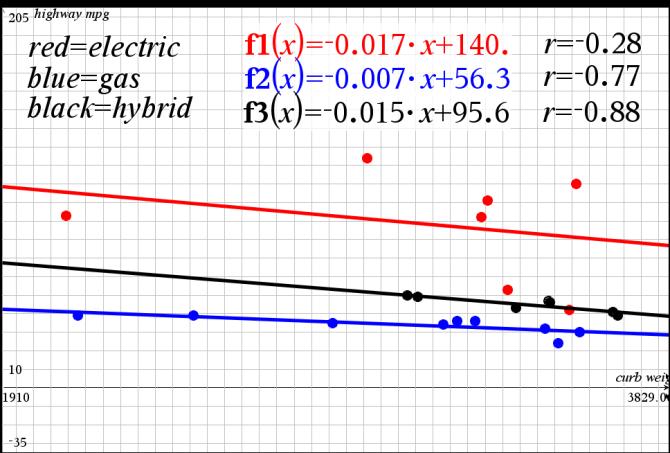
6 Students analyzed the data using TI-Nspire - it s more powerful and allows for deeper analysis. They all were able to produce this scatter plot and they were amazed at how weak the correlation is (approximately -0.16) and that the slope of the regression line is approximately -0.01, which makes the line basically flat. The equation for the regression line is:. 5
7 Student claim statements about car data (Cycle 2) Car Data - Claim 1 The heavier the car, the lower the mpg. #1 The fact that hybrid cars have the best correlation supports the claim that heavier cars have a lower highway mpg because the correlation is a measurement of how connected one variable is to the other. With the hybrid having a 0.88 correlation which is very strong this supports the claim true. so what? So this evidence proves that hybrid cars prove the claim that heavier cars have a lower highway mpg. #2 the fact that some electric cars are the same weight as gas cars but have much better highway mpg refutes the claim that heavier cars will have lower highway mpg because if electric cars that are the same weight as gas cars but have much better mpg that would mean that weight has little to no impact on mpg. #3 The fact that all of the mpg's are almost the same regardless of the weight refutes the claim that heavier cars will have a lower highway mpg because if that was the case, the slope of the line would have a steep negative trend. Instead the slope of the line is -0.01, meaning it is nearly horizontal. The correlation coefficient also refutes this claim because r= , showing that there is almost no correlation (in which case r would equal 0). #4 The fact that gas powered cars have a high curb weight but, a low highway mpg supports the claim that heavier cars will have a lower highway mpg because if you look at the data electric cars have a large range of mpg numbers, but almost all of them have similar curb weights compared to hybrids and gas powered cars. This shows that they all require the same amount of fuel in order to go the same distance. #5 The fact that the data shows a very low correlation refutes the claim that heavier cars will have lower highway mpg because there are a lot of outliers that make the data very inconsistent, and thus invalidates the claim. #6 The fact that a lot of heavy cars have a high mpg and some lighter cars have a very low mpg refutes the claim that heavier cars will have lower mpg because the slope is so small that without extreme weight differences the decrease in mpg basically doesn't exist. the slope is so small that for every 100 pounds you add to a gas powered car you will only lose about 1.7 mpg and hybrid and electric are even lower. 6
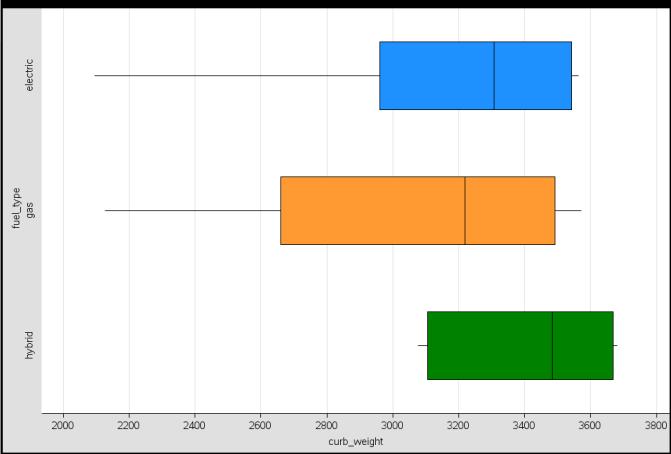
8 #7 The fact the correlation coefficient of the graph is -0.1 refutes that claim that the heavier cars will have lower highway mpg because a correlation coefficient of -0.1 is a correlation that indicates any relationship could be entirely coincidental, even a random data set could have a stronger correlation. If you actually look at the graph, you will see that according to the 2017 model cars, this claim is absolutely false. #8 The linear relationship of the slope and correlation coefficient refutes the claim that heavier cars will have lower highway mpg. If the heavier the car the lower the mpg, then the graph should have a linear set of data. What we find tho is there being many outliers making the slope a very small number of Which would only work if the difference in mpg to weight were very close but the smallest ratio for one car is 23.6 pounds for every mpg. We see the same thing when looking at the correlation of the data. When all fuel types are grouped together the data has a very poor correlation of When fuel types are grouped separately we find each fuel type having a lot stronger correlation closer to 1. Gas has a correlation grouped by itself of -.77 and hybrid has a correlation of -.88 by itself. Electric cars tho still have a bad correlation of The fuel types being grouped separate help refute the claim because it shows there's no true dictating relationship between highway mpg and curb weight. If there was the correlation shouldn't change that much when the data is grouped in different ways which also proves there to be a lot of outlier having a factor, also refuting the claim that the heavier the car, the less Mpg. #9 When every fuel type is put into one category to compare curb weight and highway MPG, the correlation is close to zero. This refutes the claim that heavier cars will have lower highway mpg. However, when the fuel types are separated into different categories, the correlation coefficients of each group are farther from zero than the coefficient of the scatter plot that is not separated. This means that the weight and mpg are related. Car Data - Claim 2 Electric cars will have a lower curb weight (than other cars). #1 The IQR of electric vehicle curb weight compared to gas refutes the claim that Electric cars will have a lower curb weight. The box plot shows that 25% of the smaller curb weight data of electric cars is greater than 25% of the smaller curb weight data of gas cars. We find the same thing when looking at 50% and 75% of the smaller curb weight data for electric vs gas. This shows that through 75% of the overall data the IQR is higher, meaning that electric cars have an overall greater curb weight compared to gas. #2 The fact that all of the electric cars but one have weights above 2900 lbs refutes the claim that electric cars will have a lower curb weight because that shows that the gas cars have over three cars that weigh lower than electric cars. Also the median weight of electric cars is 3307 as where the median of the gas cars is 3219 almost a solid 100 lbs lighter than a electric car. All of this data refutes the claim that electric cars will have a lower curb weight because of all the electric cars only one is lighter than gas cars and the gas cars have 3 lighter cars then 7
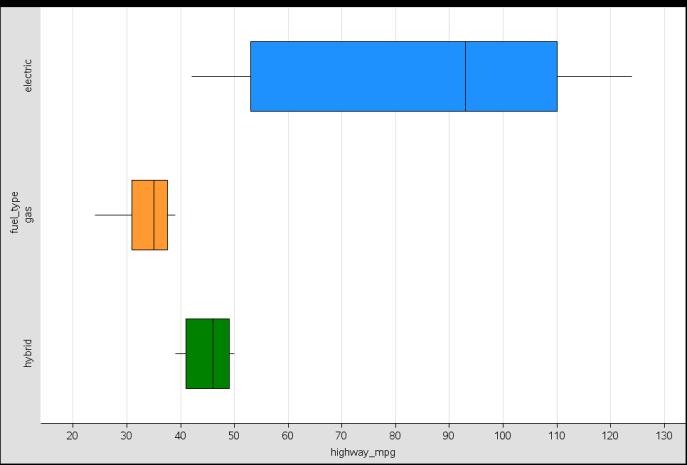
9 the majority of the electric cars, the median weight of the gas cars is almost 100 lbs lighter then the electric cars median. #3 The fact that the IQR of electric cars (582) is less than the IQR of gas-fueled cars (831) refutes the claim that electric cars will have a lower curb weight because this means that 50% of the electric data is consistently grouped at a higher curb weight than gas-fueled. Furthermore, the highest value in Q3 for electric cars is 3453 and for gas-fueled it is This automatically disproves the claim because it states that electric cars will have a lower curb weight, meaning that as long as one data point is greater than any of the data for hybrids or gasfueled cars, than the claim is false. Another point to take this a step further, both Q1 and the median of electric cars have a greater value than that of gas-fueled cars. Along with the provided evidence, many more points can be made that would refute the claim stated above. Car Data - Claim 3 Gas powered vehicles will have higher highway mpg than electric or hybrid vehicles. #1 The IQR of electric vehicles refutes the claim that gas powered vehicles have a higher highway mpg than electric or hybrid. The box plot shows that 100% of the IQR of electric vehicles highway mpg is higher than 100% of the highway mpg of gas powered vehicles. This shows that all electric vehicles have a higher mpg than all of the gas powered vehicles. Refuting the claim that gas powered has higher highway mpg than electric or hybrid. #2 The fact that the minimum of both hybrids (39) and electric cars (42) are greater than or equal to the maximum mpg of gas-fueled cars (39) refutes the claim that gas-fueled cars have a greater highway mpg than hybrids and electric cars because this shows that every data point for the other two categories are greater than every data point for gas-fueled cars. As a matter of fact, a true claim would be the opposite of the one provided. Gas-fueled cars have a lower mpg than hybrids and electric cars. Literally 100% of the data for hybrids and 100% of the data for electric is greater than 100% of the data for gas-fueled cars. To tie this argument off, the average for each category is 34 mpg for gas, 45 mpg for hybrids, and 88 mpg for electric cars. It is no surprise that both averages for the other categories are substantially greater than the average for gas-fueled cars. 8
10 Sample student essay about car data (Cycle 2) Write a five paragraph essay addressing the claims: 1. The heavier the car, the lower the mpg. 2. Electric cars will have a lower curb weight (than non-electric cars). 3. Gas powered vehicles will have higher highway mpg than electric or hybrid vehicles. Use the work that you ve already done, or modify what you ve already written, based on the feedback from the class discussion. Be sure to pay attention to the rubric. Science and Math Practices (Target: Graduation Benchmark) Below Target On Target Above Target Analyzes the quality, relevance, and limitations of data, but is unable to build an argument OR argument is flawed Contextual references to specific statistics are flawed or missing Includes no representation of the data Builds an argument based in evidence with clear reference to the data Contextual references to specific statistics are correct Includes at least one representation of the data to illustrate a point Makes inferences that move beyond the initial idea Contextual references to specific statistics are correct, clear, and explicit Includes at least one representation of the data to illustrate a point Statistics & Probability (Target: Progressing) Below Target On Target Above Target Represents data with appropriate plots (for both single variables and paired data) Uses statistics appropriate to the shape of the data to compare center and spread of two or more different data sets Interprets linear models (including slope, intercept, and correlation coefficient) Fits an appropriate model to data that represents two quantitative variables Conveys a depth of understanding of basic statistical measures as demonstrated through arguments, claims, and interpretations 9
11 The evidence helps refute the claim that Fuel type has a stronger relationship with highway mpg than curb weight. The subclaims, the heavier the car, the lower the mpg, Electric cars will have a lower curb weight (than non-electric cars) and Gas powered vehicles will have higher highway mpg than electric or hybrid vehicles help reinforce the evidence to refute the overall claim. The reasoning analysis compares measures of range, interquartile range, slope and correlation coefficient of all the 2017 gas, electric and hybrid vehicles. The reasoning behind the analysis will support that the claims are false. The linear relationship of the slope and correlation coefficient refutes the claim that heavier cars will have lower highway mpg. If the heavier the car the lower the mpg, then the graph should have a linear set of data. What we find tho is there being many outliers making the slope a very small number of Which would only work if the difference in mpg to weight were very close but the smallest ratio for one car is 23.6 pounds for every mpg. We see the same thing when looking at the correlation of the data. When all fuel types are grouped together the data has a very poor correlation of When fuel types are grouped separately we find each fuel type having a lot stronger correlation closer to 1. Gas has a correlation grouped by itself of -.77 and hybrid has a correlation of -.88 by itself. Electric cars tho still have a bad correlation of The fuel types being grouped separate help refute the claim because it shows there's no true dictating relationship between highway mpg and curb weight. If there was the correlation shouldn't change that much when the data is grouped in different ways which also proves there to be a lot of outliers having a factor, also refuting the claim that the heavier the car, the less Mpg. The IQR of electric vehicle curb weight compared to gas refutes the claim that Electric cars will have a lower curb weight. The box plot shows that 25% of the smaller curb weight data of electric cars is greater than 25% of the smaller curb weight data of gas cars. We find the same thing when looking at 50% and 75% of the smaller curb weight data for electric vs gas. This shows that through 75% of the overall data the IQR is higher, meaning that electric cars have an overall greater curb weight compared to gas. The IQR of electric vehicles refutes the claim that gas powered vehicles have a higher highway mpg than electric or hybrid. The box plot shows that 100% of the IQR of electric vehicles highway mpg is higher than 100% of the highway mpg of gas powered vehicles. This shows that all electric vehicles have a higher mpg than all of the gas powered vehicles. Refuting the claim that gas powered has higher highway mpg than electric or hybrid. The subclaims, the heavier the car, the lower the mpg, Electric cars will have a lower curb weight (than non-electric cars) and Gas powered vehicles will have higher highway mpg than electric or hybrid vehicles. help the evidence and reasoning refute the overall claim that Fuel type has a stronger relationship with highway mpg than curb weight. 10
12 11

13 Sample tudent analysis of movie data (Cycle 3) Analyzing Movie Data April 2017 Pick your claim (and delete the other one). Original movies are better than sequels. Upon first look at the data, would you say that your claim is supported or not? If you are comparing original movies to sequels, which variables make sense to use? Pick a variable and insert an appropriate graph below. Explain what the graph is illustrating about your claim here. Be sure to cite specific statistics and provide reasoning. This Graph shows that the critics prefers the original movies over sequels. Just comparing the medians proves this. The sequels median is 6.45 out of 10, but the originals median is There is a 1.8 difference between the two. Even the originals first quartile is at 7.65 and the sequels last quartile is at 6.95, that s a 0.7 difference. 12


14 Pick another variable and insert an appropriate graph below. Explain what the graph is illustrating about your claim here. Be sure to cite specific statistics and provide reasoning. A majority of the audience agrees that the original movies are better than the sequels. The original s median is at 3.6, while the sequel s is at 3.5. In fact the originals lowest quartile is the same as the sequels median. Pick another variable and insert an appropriate graph below. Explain what the graph is illustrating about your claim here. Be sure to cite specific statistics and provide reasoning. The box plot on Domestic score shows that originals were preferred over sequels. Actually, the originals median score of 4.01, is just under the sequels highest quartile, The sequels median is at 1.97, that s 3.04 lower than the originals. Pick another variable and insert an appropriate graph below. Explain what the graph is illustrating about your claim here. Be sure to cite specific statistics and provide reasoning. 13
 Class Data Analysis Review Here are the rubrics.")
15 Even Worldwide originals are prefered. The original median is 4.01 and the sequels have 1.97, a whole 2.04 difference. The first quartile of the originals is 2.65 and the sequel is at 1.25, 0.55 lower. The last quartile for the original is 5.26 but for the sequels it s Sample student class data analysis (Cycle 4) Class Data Analysis Review Here are the rubrics. Review the statements on the following pages to determine if they are on target. Science and Math Practices (Target: Graduation Benchmark) Above Target On Target Below Target Makes inferences that move beyond the initial idea Contextual references to specific statistics are correct, clear, and explicit Includes at least one representation of the data to illustrate a point Builds an argument based in evidence with clear reference to the data Contextual references to specific statistics are correct Includes at least one representation of the data to illustrate a point Analyzes the quality, relevance, and limitations of data, but is unable to build an argument or argument is flawed Contextual references to specific statistics are flawed or missing Includes no representation of the data or representation is not appropriate for the data Statistics & Probability (Target: Progressing) Above Target On Target Below Target Conveys a depth of understanding of basic statistical measures as demonstrated through arguments, claims, and interpretations Interprets linear models (including slope, intercept, and correlation coefficient) Fits an appropriate model to data that represents two quantitative variables Represents data with appropriate plots (for both single variables and paired data) Uses statistics appropriate to the shape of the data to compare center and spread of two or more different data sets 14
16 15


17 #1 Height vs armspan Insert an appropriate graph to illustrate the subclaim: The students heights will be similar to their arm spans. Explain how the graph supports (or refutes) the subclaim. This graph is modeling the height vs. the arm span of the students. The claim the height of the students would be similar to the students arm span is supported by this graph. This is because the bold line is the y=x line. This line is if every student s arm span was exactly equal to the student s height. The line of best fit has a little less slope than the line y=x. This means that there is a similar correlation between the two lines. #2 Insert an appropriate graph to illustrate the subclaim: The students heights will be similar to their arm spans. Explain how the graph supports (or refutes) the subclaim. This scatterplot supports the subclaim because it shows that all the data (excluding the outliers) is grouped up between two points (157 and 185) the data could be even closer together if there were less people with drastically different heights. Some specific points to focus on would be the lowest height that isn t an outlier, at 157. On both scatterplots for height and armspan they both have their lowest relevant point between 156 and 157 and the same goes for the maximum relevant length between 184 and 185 which shows how close the arm span can resemble one s height. 16


18 #3 Insert an appropriate graph to illustrate the subclaim: The students heights will be similar to their arm spans. Explain how the graph supports (or refutes) the subclaim. The subclaim supports the claim because the mean of the high s is and the mean of armspan is proving that the difference between height and armspan is 10 cm. #4 Insert an appropriate graph to illustrate the subclaim: The students heights will be similar to their arm spans. Explain how the graph supports (or refutes) the subclaim. This graph supports the claim that the heights of the students will be similar to their arm spans because the box graphs are way to similar in quartile range and in maximum and fall in the same set of numbers therefore supports of overall claim that human bodies are proportionally sized in a predictable way. 17
 and the median for students arm spans is (171.95 cm.")


19 #5 Insert an appropriate graph to illustrate the subclaim: The students heights will be similar to their arm spans. Explain how the graph supports (or refutes) the subclaim. The box plot supports the subclaim that students heights will be similar to their arm spans. As the median for students heights is ( cm) and the median for students arm spans is ( cm.) This is showing that on average, the difference between students heights and arm spans is 3.70 cm, which shows that the height and arm spans on average are very similar to each other. This second graph is also supporting the subclaim that students heights will be similar to their arm spans. Since most of the points are fairly close to the line. The furthest away point has a height of (140.4 cm) while their arm span is (165 cm.) This is only about 25 cm difference. For the point to only have a 25 cm difference and also be the biggest difference between height and arm span supports my claim. #6 Insert an appropriate graph to illustrate the subclaim: The students heights will be similar to their arm spans. Explain how the graph supports (or refutes) the subclaim. This graph supports the claim because the graph has the strongest correlation. The scatterplot creates a linear almost perfectly, proving that everyone's kneeling height makes up about the same percent of their height. 18
20 19
Statistics and Quantitative Analysis U4320. Segment 8 Prof. Sharyn O Halloran
 Statistics and Quantitative Analysis U4320 Segment 8 Prof. Sharyn O Halloran I. Introduction A. Overview 1. Ways to describe, summarize and display data. 2.Summary statements: Mean Standard deviation Variance
Problem Set 3 - Solutions
 Ecn 102 - Analysis of Economic Data University of California - Davis January 22, 2011 John Parman Problem Set 3 - Solutions This problem set will be due by 5pm on Monday, February 7th. It may be turned
Everything Leading Up to Nuclear Cars. next 150 years is to have a car that runs on the splitting of atoms. This will be a clean and
 Ethan Brunet-Bailey Everything Leading Up to Nuclear Cars Engineering is why we have cars, electronics, and everything around us. The car that we have in 2016-2017 runs off of fossil fuels and some are
Fourth Grade. Multiplication Review. Slide 1 / 146 Slide 2 / 146. Slide 3 / 146. Slide 4 / 146. Slide 5 / 146. Slide 6 / 146
 Slide 1 / 146 Slide 2 / 146 Fourth Grade Multiplication and Division Relationship 2015-11-23 www.njctl.org Multiplication Review Slide 3 / 146 Table of Contents Properties of Multiplication Factors Prime
Fourth Grade. Slide 1 / 146. Slide 2 / 146. Slide 3 / 146. Multiplication and Division Relationship. Table of Contents. Multiplication Review
 Slide 1 / 146 Slide 2 / 146 Fourth Grade Multiplication and Division Relationship 2015-11-23 www.njctl.org Table of Contents Slide 3 / 146 Click on a topic to go to that section. Multiplication Review
Technical Papers supporting SAP 2009
 Technical Papers supporting SAP 29 A meta-analysis of boiler test efficiencies to compare independent and manufacturers results Reference no. STP9/B5 Date last amended 25 March 29 Date originated 6 October
Math 135 S18 Exam 1 Review. The Environmental Protection Agency records data on the fuel economy of many different makes of cars.
 Math 135 S18 Exam 1 Review Name *note: In addition to this Review, study the material from Take Home Assignments, Classwork sheets and class notes. ALL are represented in the exam. The Environmental Protection
Fuel Strategy (Exponential Decay)
") By Ten80 Education Fuel Strategy (Exponential Decay) STEM Lesson for TI-Nspire Technology Objective: Collect data and analyze the data using graphs and regressions to understand conservation of energy
By Ten80 Education Fuel Strategy (Exponential Decay) STEM Lesson for TI-Nspire Technology Objective: Collect data and analyze the data using graphs and regressions to understand conservation of energy
In order to discuss powerplants in any depth, it is essential to understand the concepts of POWER and TORQUE.
 -Power and Torque - ESSENTIAL CONCEPTS: Torque is measured; Power is calculated In order to discuss powerplants in any depth, it is essential to understand the concepts of POWER and TORQUE. HOWEVER, in
Linking the Virginia SOL Assessments to NWEA MAP Growth Tests *
 Linking the Virginia SOL Assessments to NWEA MAP Growth Tests * *As of June 2017 Measures of Academic Progress (MAP ) is known as MAP Growth. March 2016 Introduction Northwest Evaluation Association (NWEA
Using Statistics To Make Inferences 6. Wilcoxon Matched Pairs Signed Ranks Test. Wilcoxon Rank Sum Test/ Mann-Whitney Test
 Using Statistics To Make Inferences 6 Summary Non-parametric tests Wilcoxon Signed Ranks Test Wilcoxon Matched Pairs Signed Ranks Test Wilcoxon Rank Sum Test/ Mann-Whitney Test Goals Perform and interpret
Linking the North Carolina EOG Assessments to NWEA MAP Growth Tests *
 Linking the North Carolina EOG Assessments to NWEA MAP Growth Tests * *As of June 2017 Measures of Academic Progress (MAP ) is known as MAP Growth. March 2016 Introduction Northwest Evaluation Association
Linking the Kansas KAP Assessments to NWEA MAP Growth Tests *
 Linking the Kansas KAP Assessments to NWEA MAP Growth Tests * *As of June 2017 Measures of Academic Progress (MAP ) is known as MAP Growth. February 2016 Introduction Northwest Evaluation Association (NWEA
Investigation of Relationship between Fuel Economy and Owner Satisfaction
 Investigation of Relationship between Fuel Economy and Owner Satisfaction June 2016 Malcolm Hazel, Consultant Michael S. Saccucci, Keith Newsom-Stewart, Martin Romm, Consumer Reports Introduction This
NEW CAR TIPS. Teaching Guidelines
 NEW CAR TIPS Teaching Guidelines Subject: Algebra Topics: Patterns and Functions Grades: 7-12 Concepts: Independent and dependent variables Slope Direct variation (optional) Knowledge and Skills: Can relate
Teacher s Guide: Safest Generation Ad Activity
 Teacher s Guide: Safest Generation Ad Activity Introduction Today s 11- and 12-year-old preteens are very smart about vehicle safety. They have grown up using car seats and booster seats more consistently
Linking the New York State NYSTP Assessments to NWEA MAP Growth Tests *
 Linking the New York State NYSTP Assessments to NWEA MAP Growth Tests * *As of June 2017 Measures of Academic Progress (MAP ) is known as MAP Growth. March 2016 Introduction Northwest Evaluation Association
Roehrig Engineering, Inc.
 Roehrig Engineering, Inc. Home Contact Us Roehrig News New Products Products Software Downloads Technical Info Forums What Is a Shock Dynamometer? by Paul Haney, Sept. 9, 2004 Racers are beginning to realize
Objectives. Materials TI-73 CBL 2
 . Objectives To understand the relationship between dry cell size and voltage Activity 4 Materials TI-73 Unit-to-unit cable Voltage from Dry Cells CBL 2 Voltage sensor New AAA, AA, C, and D dry cells Battery
Linking the Georgia Milestones Assessments to NWEA MAP Growth Tests *
 Linking the Georgia Milestones Assessments to NWEA MAP Growth Tests * *As of June 2017 Measures of Academic Progress (MAP ) is known as MAP Growth. February 2016 Introduction Northwest Evaluation Association
Chapter 5 ESTIMATION OF MAINTENANCE COST PER HOUR USING AGE REPLACEMENT COST MODEL
 Chapter 5 ESTIMATION OF MAINTENANCE COST PER HOUR USING AGE REPLACEMENT COST MODEL 87 ESTIMATION OF MAINTENANCE COST PER HOUR USING AGE REPLACEMENT COST MODEL 5.1 INTRODUCTION Maintenance is usually carried
Improving CERs building
 Improving CERs building Getting Rid of the R² tyranny Pierre Foussier pmf@3f fr.com ISPA. San Diego. June 2010 1 Why abandon the OLS? The ordinary least squares (OLS) aims to build a CER by minimizing
GRADE 7 TEKS ALIGNMENT CHART
 GRADE 7 TEKS ALIGNMENT CHART TEKS 7.2 extend previous knowledge of sets and subsets using a visual representation to describe relationships between sets of rational numbers. 7.3.A add, subtract, multiply,
Linking the Alaska AMP Assessments to NWEA MAP Tests
 Linking the Alaska AMP Assessments to NWEA MAP Tests February 2016 Introduction Northwest Evaluation Association (NWEA ) is committed to providing partners with useful tools to help make inferences from
Fall Hint: criterion? d) Based measure of spread? Solution. Page 1
 Based measure of spread? Solution. Page 1") Question #1 (12 Marks) The following are the golf scores of 12 members of a women s golf team in tournament play: 89 90 87 95 86 81 102 105 83 88 91 79 Hint: n 1 x 2 i x 67 74.3979 a) Present the distribution
Question #1 (12 Marks) The following are the golf scores of 12 members of a women s golf team in tournament play: 89 90 87 95 86 81 102 105 83 88 91 79 Hint: n 1 x 2 i x 67 74.3979 a) Present the distribution
Car Comparison Project
 NAME Car Comparison Project Introduction Systems of linear equations are a useful way to solve common problems in different areas of life. One of the most powerful ways to use them is in a comparison model
Busy Ant Maths and the Scottish Curriculum for Excellence Foundation Level - Primary 1
 Busy Ant Maths and the Scottish Curriculum for Excellence Foundation Level - Primary 1 Number, money and measure Estimation and rounding Number and number processes Fractions, decimal fractions and percentages
ELECTRIC CURRENT. Name(s)
") Name(s) ELECTRIC CURRT The primary purpose of this activity is to decide upon a model for electric current. As is the case for all scientific models, your electricity model should be able to explain observed
Name(s) ELECTRIC CURRT The primary purpose of this activity is to decide upon a model for electric current. As is the case for all scientific models, your electricity model should be able to explain observed
Linking the Indiana ISTEP+ Assessments to the NWEA MAP Growth Tests. February 2017 Updated November 2017
 Linking the Indiana ISTEP+ Assessments to the NWEA MAP Growth Tests February 2017 Updated November 2017 2017 NWEA. All rights reserved. No part of this document may be modified or further distributed without
When the points on the graph of a relation lie along a straight line, the relation is linear
 KEY CONCEPTS When the points on the graph of a relation lie along a straight line, the relation is linear A linear relationship implies equal changes over equal intervals any linear model can be represented
July 13, Reforming the Automobile Fuel Economy Standards Program Docket No. NHTSA , Notice 1
 The Honorable Jeffrey W. Runge, M.D. Administrator National Highway Traffic Safety Administration 400 Seventh Street, S.W. Washington, D.C. 20590 Dear Dr. Runge: Reforming the Automobile Fuel Economy Standards
Module: Mathematical Reasoning
 Module: Mathematical Reasoning Lesson Title: Speeding Along Objectives and Standards Students will: Determine whether a relationship is a function Calculate the value of a function through a real-world
The Mark Ortiz Automotive
 August 2004 WELCOME Mark Ortiz Automotive is a chassis consulting service primarily serving oval track and road racers. This newsletter is a free service intended to benefit racers and enthusiasts by offering
Mandatory Experiment: Electric conduction
 Name: Class: Mandatory Experiment: Electric conduction In this experiment, you will investigate how different materials affect the brightness of a bulb in a simple electric circuit. 1. Take a battery holder,
Contact: New Technology for the Concrete Jungle
 SRBSYSTEMS New Technology for the Concrete Jungle SRB Titan Precast Magnet Clamps The new SRB Titan precast magnet clamp will be the world s strongest precast magnet for its size. The SRB Titan is substantially
Home > Car Research > Tips & Advice > Safest Vehicles for Downsizing
 Home > Car Research > Tips & Advice > Safest Vehicles for Downsizing Safest Vehicles for Downsizing - by BENGT HALVORSON, ForbesAutos.com Amy Fife, a single mother of two, wants to sell her mid-sized sport
ON-ROAD FUEL ECONOMY OF VEHICLES
 SWT-2017-5 MARCH 2017 ON-ROAD FUEL ECONOMY OF VEHICLES IN THE UNITED STATES: 1923-2015 MICHAEL SIVAK BRANDON SCHOETTLE SUSTAINABLE WORLDWIDE TRANSPORTATION ON-ROAD FUEL ECONOMY OF VEHICLES IN THE UNITED
Why do the dots go where they do?
 Reprinted from Real Answers Why do the dots go where they do? Volume 13, Issue 1 trucktires.com 1-800-543-7522 ask the DOCTOR Bridgestone tires have either a red or yellow dot, which can be used to mount
Lab 2 Electrical Measurements and Ohm s Law
 Lab 2 Electrical Measurements and Ohm s Law Safety and Equipment No special safety precautions are necessary for this lab. Computer with PASCO Capstone, PASCO 850 Universal Interface Double banana/alligator
Stat 301 Lecture 30. Model Selection. Explanatory Variables. A Good Model. Response: Highway MPG Explanatory: 13 explanatory variables
 Model Selection Response: Highway MPG Explanatory: 13 explanatory variables Indicator variables for types of car Sports Car, SUV, Wagon, Minivan 1 Explanatory Variables Engine size (liters) Cylinders (number)
Some Experimental Designs Using Helicopters, Designed by You. Next Friday, 7 April, you will conduct two of your four experiments.
 Some Experimental Designs Using Helicopters, Designed by You The following experimental designs were submitted by students in this class. I have selectively chosen designs not because they were good or
An Improved Regenerative Braking System
 An Improved Regenerative Braking System EDGSN 100 Penn State December 16, 2014 Nick Dermo Burook Affa Will Maloney Naman Kabra Executive Summary In the Delphi design project, MAD-K Inc. worked to come
ACTIVITY 1: Electric Circuit Interactions
 CYCLE 5 Developing Ideas ACTIVITY 1: Electric Circuit Interactions Purpose Many practical devices work because of electricity. In this first activity of the Cycle you will first focus your attention on
correlated to the Virginia Standards of Learning, Grade 6
 correlated to the Virginia Standards of Learning, Grade 6 Standards to Content Report McDougal Littell Math, Course 1 2007 correlated to the Virginia Standards of Standards: Virginia Standards of Number
Linking the Mississippi Assessment Program to NWEA MAP Tests
 Linking the Mississippi Assessment Program to NWEA MAP Tests February 2017 Introduction Northwest Evaluation Association (NWEA ) is committed to providing partners with useful tools to help make inferences
Vehicle Scrappage and Gasoline Policy. Online Appendix. Alternative First Stage and Reduced Form Specifications
 Vehicle Scrappage and Gasoline Policy By Mark R. Jacobsen and Arthur A. van Benthem Online Appendix Appendix A Alternative First Stage and Reduced Form Specifications Reduced Form Using MPG Quartiles The
Mathematics 43601H. Cumulative Frequency. In the style of General Certificate of Secondary Education Higher Tier. Past Paper Questions by Topic TOTAL
 Centre Number Surname Candidate Number For Examiner s Use Other Names Candidate Signature Examiner s Initials In the style of General Certificate of Secondary Education Higher Tier Pages 2 3 4 5 Mark Mathematics
Wide Band EFIE Installation Instructions. Locate the wide band oxygen sensor current wire
 Wide Band EFIE Installation Instructions Install your fuel efficiency device The EFIE is not intended to be a fuel saver by itself. You should install a device that is designed to get more energy out of
NO. D - Language YES. E - Literature Total 6 28
 Table. Categorical Concurrence Between Standards and Assessment as Rated by Six Reviewers Florida Grade Language Arts Number of Assessment Items - 45 Standards Level by Objective Hits Cat. Goals Objs #
The Session.. Rosaria Silipo Phil Winters KNIME KNIME.com AG. All Right Reserved.
 The Session.. Rosaria Silipo Phil Winters KNIME 2016 KNIME.com AG. All Right Reserved. Past KNIME Summits: Merging Techniques, Data and MUSIC! 2016 KNIME.com AG. All Rights Reserved. 2 Analytics, Machine
SHOCK DYNAMOMETER: WHERE THE GRAPHS COME FROM
 SHOCK DYNAMOMETER: WHERE THE GRAPHS COME FROM Dampers are the hot race car component of the 90s. The two racing topics that were hot in the 80s, suspension geometry and data acquisition, have been absorbed
20th. SOLUTIONS for FLUID MOVEMENT, MEASUREMENT & CONTAINMENT. Do You Need a Booster Pump? Is Repeatability or Accuracy More Important?
 Do You Need a Booster Pump? Secrets to Flowmeter Selection Success Is Repeatability or Accuracy More Important? 20th 1995-2015 SOLUTIONS for FLUID MOVEMENT, MEASUREMENT & CONTAINMENT Special Section Inside!
PHY222 Lab 4 Ohm s Law and Electric Circuits Ohm s Law; Series Resistors; Circuits Inside Three- and Four-Terminal Black Boxes
 PHY222 Lab 4 Ohm s Law and Electric Circuits Ohm s Law; Series Resistors; Circuits Inside Three- and Four-Terminal Black Boxes Print Your Name Print Your Partners' Names Instructions February 8, 2017 Before
Turbocharger Compressor Calculations
 Turbocharger Compressor Calculations Introduction The purpose of this little paper is to show the reader how to calculate the volume and mass of air moving through his engine, and how to size a turbochargers'
C67_2_27_Investigation 5. February 27, Rewrite in slope intercept form. Homework: Page 78, 2 Page 80, 13 & 14
 Find ten possible car miles, SUV miles pairs that give a total of no more than 1,000 miles. One month the family drove the car 500 miles and the SUV 500 miles. Was the total for this month no more than
Newton s First Law. Evaluation copy. Vernier data-collection interface
 Newton s First Law Experiment 3 INTRODUCTION Everyone knows that force and motion are related. A stationary object will not begin to move unless some agent applies a force to it. But just how does the
LETTER TO PARENTS SCIENCE NEWS. Dear Parents,
 LETTER TO PARENTS Cut here and paste onto school letterhead before making copies. Dear Parents, SCIENCE NEWS Our class is beginning a new science unit using the FOSS Magnetism and Electricity Module. We
Objective: Students will investigate rate of change (slope) using spring data from RC cars.
 using spring data from RC cars.") Objective: Students will investigate rate of change (slope) using spring data from RC cars. About the Lesson: In NASCAR, the selection of springs (and spring rate) determines the ride height of the car.
Objective: Students will investigate rate of change (slope) using spring data from RC cars. About the Lesson: In NASCAR, the selection of springs (and spring rate) determines the ride height of the car.
A REPORT ON THE STATISTICAL CHARACTERISTICS of the Highlands Ability Battery CD
 A REPORT ON THE STATISTICAL CHARACTERISTICS of the Highlands Ability Battery CD Prepared by F. Jay Breyer Jonathan Katz Michael Duran November 21, 2002 TABLE OF CONTENTS Introduction... 1 Data Determination
CHASSIS DYNAMICS TABLE OF CONTENTS A. DRIVER / CREW CHIEF COMMUNICATION I. CREW CHIEF COMMUNICATION RESPONSIBILITIES
 CHASSIS DYNAMICS TABLE OF CONTENTS A. Driver / Crew Chief Communication... 1 B. Breaking Down the Corner... 3 C. Making the Most of the Corner Breakdown Feedback... 4 D. Common Feedback Traps... 4 E. Adjustment
ALIGNING A 2007 CADILLAC CTS-V
 ALIGNING A 2007 CADILLAC CTS-V I ll describe a four-wheel alignment of a 2007 Cadillac CTS-V in this document using homemade alignment tools. I described the tools in a previous document. The alignment
How to Build with the Mindstorm Kit
 How to Build with the Mindstorm Kit There are many resources available Constructopedias Example Robots YouTube Etc. The best way to learn, is to do Remember rule #1: don't be afraid to fail New Rule: don't
Extracting Tire Model Parameters From Test Data
 WP# 2001-4 Extracting Tire Model Parameters From Test Data Wesley D. Grimes, P.E. Eric Hunter Collision Engineering Associates, Inc ABSTRACT Computer models used to study crashes require data describing
Car Comparison Project
 NAME Car Comparison Project Introduction Systems of linear equations are a useful way to solve common problems in different areas of life. One of the most powerful ways to use them is in a comparison model
Linking the Florida Standards Assessments (FSA) to NWEA MAP
 to NWEA MAP") Linking the Florida Standards Assessments (FSA) to NWEA MAP October 2016 Introduction Northwest Evaluation Association (NWEA ) is committed to providing partners with useful tools to help make inferences
Linking the Florida Standards Assessments (FSA) to NWEA MAP October 2016 Introduction Northwest Evaluation Association (NWEA ) is committed to providing partners with useful tools to help make inferences
Cumulative Frequency Diagrams Question Paper 1
 Frequency Diagrams Question Paper 1 Level Subject Exam Board IGCSE Maths Edexcel Topic Handling Data Statistics Sub Topic Frequency Diagrams(Graphical representation of data) Booklet Question Paper 1 Time
Linking the Indiana ISTEP+ Assessments to NWEA MAP Tests
 Linking the Indiana ISTEP+ Assessments to NWEA MAP Tests February 2017 Introduction Northwest Evaluation Association (NWEA ) is committed to providing partners with useful tools to help make inferences
Linking the PARCC Assessments to NWEA MAP Growth Tests
 Linking the PARCC Assessments to NWEA MAP Growth Tests November 2016 Introduction Northwest Evaluation Association (NWEA ) is committed to providing partners with useful tools to help make inferences from
Renewable Energy Endurance Marathon
 Next Generation Science Standards NGSS Science and Engineering Practices: Asking questions and defining problems Developing and using models Planning and carrying out investigations Analyzing and interpreting
Motor Trend MPG Analysis
 Motor Trend MPG Analysis SJ May 15, 2016 Executive Summary For this project, we were asked to look at a data set of a collection of cars in the automobile industry. We are going to explore the relationship
Close Read. Number of Drivers. Unit 1: Argumentative Essay 23
 Graph Driver Fatalities and Drivers Involved in Fatal Crashes Among 15- to 20- Year Old Drivers, 1998 2008 Number of Drivers Driver Fatalities Drivers Involved 10000 8000 6000 4000 2000 0 1998 1999 2000
EFFECT OF TRUCK PAYLOAD WEIGHT ON PRODUCTION
 EFFECT OF TRUCK PAYLOAD WEIGHT ON PRODUCTION BY : Cliff Schexnayder Sandra L. Weber Brentwood T. Brook Source : Journal of Construction Engineering & Management / January/February 1999 Introduction : IDEAS
The Magnetic Field. Magnetic fields generated by current-carrying wires
 OBJECTIVES The Magnetic Field Use a Magnetic Field Sensor to measure the field of a long current carrying wire and at the center of a coil. Determine the relationship between magnetic field and the number
NOW INTEGRATED WITH MLM DESIGNED FOR VAV DIFFUSER SYSTEMS LINEAR CHARACTERISTICS NO REGULAR MAINTENANCE REQUIRED PRESSURE SENSOR AND CONTROLLERS
 PRESSURE CONTROL DAMPER 20 PCD NOW INTEGRATED WITH MLM DESIGNED FOR VAV DIFFUSER SYSTEMS LINEAR CHARACTERISTICS LOW NOISE ELECTRIC ACTUATION NO REGULAR MAINTENANCE REQUIRED PRESSURE SENSOR AND CONTROLLERS
Electric Circuits. Lab. FCJJ 16 - Solar Hydrogen Science Kit. Next Generation Science Standards. Initial Prep Time. Lesson Time. Assembly Requirements
 Next Generation Science Standards NGSS Science and Engineering Practices: Asking questions and defining problems Developing and using models Planning and carrying out investigations Analyzing and interpreting
A PRACTICAL GUIDE TO RACE CAR DATA ANALYSIS BY BOB KNOX DOWNLOAD EBOOK : A PRACTICAL GUIDE TO RACE CAR DATA ANALYSIS BY BOB KNOX PDF
 Read Online and Download Ebook A PRACTICAL GUIDE TO RACE CAR DATA ANALYSIS BY BOB KNOX DOWNLOAD EBOOK : A PRACTICAL GUIDE TO RACE CAR DATA ANALYSIS BY BOB KNOX PDF Click link bellow and free register to
Busy Ant Maths and the Scottish Curriculum for Excellence Year 6: Primary 7
 Busy Ant Maths and the Scottish Curriculum for Excellence Year 6: Primary 7 Number, money and measure Estimation and rounding Number and number processes Including addition, subtraction, multiplication
Two Cell Battery. 6. Masking tape 7. Wire cutters 8. Vinegar 9. Salt 10. Lemon Juice DC ammeter
 Your Activity Build a two-cell Wet battery Materials 1. 2 150 ml beakers 2. 2 pieces aluminum foil (8 X 12 inch) 3. 2 small paper cups, cut ¾ from bottom 4. 3 31.5 inch of non-insulated copper wire gauge
Orientation and Conferencing Plan Stage 1
 Orientation and Conferencing Plan Stage 1 Orientation Ensure that you have read about using the plan in the Program Guide. Book summary Read the following summary to the student. Everyone plays with the
Linear Modeling Exercises. In case you d like to see why the best fit line is also called a least squares regression line here ya go!
 Linear Modeling Exercises Pages 308 311 Problems 1 4, 5-9 (you might want to do the E exercises next), 20 In case you d like to see why the best fit line is also called a least squares regression line
Chapter 2 & 3: Interdependence and the Gains from Trade
 Econ 123 Principles of Economics: Micro Chapter 2 & 3: Interdependence and the Gains from rade Instructor: Hiroki Watanabe Fall 212 Watanabe Econ 123 2 & 3: Gains from rade 1 / 119 1 Introduction 2 Productivity
Magnetism and Electricity
 Magnetism and Electricity Way back in the first lesson of this magnetism block, we talked about the fact that magnetic fields are caused by electrons moving in the same direction. Up to this point, we
Utility Trailer 5 x 8 Building Notes
 Utility Trailer 5 x 8 Building Notes This is a standard utility trailer model that is currently on the market (at least in Minnesota). The price tag seems to average around $900 - $1100. There is no doubt
What Is Analysis? Rebecca Jarvis, Ph.D., and Ginger, Ca.T., Eastern Arizona College
 What Is Analysis? Rebecca Jarvis, Ph.D., and Ginger, Ca.T., Eastern Arizona College My desk at home What s on the table Let s list everything that is on the table: two laptops, one opened and one closed;
Traffic Safety Facts
 Part 1: Read Sources Source 1: Informational Article 2008 Data Traffic Safety Facts As you read Analyze the data presented in the articles. Look for evidence that supports your position on the dangers
reflect energy: the ability to do work
 reflect Have you ever thought about how much we depend on electricity? Electricity is a form of energy that runs computers, appliances, and radios. Electricity lights our homes, schools, and office buildings.
Renewable Energy Sprint
 Next Generation Science Standards NGSS Science and Engineering Practices: Asking questions and defining problems Developing and using models Planning and carrying out investigations Analyzing and interpreting
Manual Where Do I Get Cars Save Gas Mileage Than Automatics
 Manual Where Do I Get Cars Save Gas Mileage Than Automatics Where do automatic cars fare now in the big fuel consumption debate: automatic significant moves made to improve the technology in automatic
Engaging Inquiry-Based Activities Grades 3-6
 ELECTRICITY AND CIRCUITS Engaging Inquiry-Based Activities Grades 3-6 Janette Smith 2016 Janette Smith 2016 1 What s Inside Activity 1: Light it Up!: Students investigate different ways to light a light
Gear Ratios and Speed Background Material
 VEX Robotics Lab 3 How Do Gear Ratios Affect and Torque? Introduction In this investigation, students will learn the relationships between gear ratio, axle speed, and torque. Students will use the Vex
Atmospheric Chemistry and Physics. Interactive Comment. K. Kourtidis et al.
 Atmos. Chem. Phys. Discuss., www.atmos-chem-phys-discuss.net/15/c4860/2015/ Author(s) 2015. This work is distributed under the Creative Commons Attribute 3.0 License. Atmospheric Chemistry and Physics
School Transportation Assessment
 Grade: K-12 Version 1 April 2015 School Transportation Assessment SCHOOL BUS Evaluate the carbon emissions from daily transportation related to your school and identify strategies for more sustainable
2018 Linking Study: Predicting Performance on the NSCAS Summative ELA and Mathematics Assessments based on MAP Growth Scores
 2018 Linking Study: Predicting Performance on the NSCAS Summative ELA and Mathematics Assessments based on MAP Growth Scores November 2018 Revised December 19, 2018 NWEA Psychometric Solutions 2018 NWEA.
Descriptive Statistics Practice Problems (99-04)
") Descriptive Statistics Practice Problems (99-04) 1. One thousand candidates sit an examination. The distribution of marks is shown in the following grouped frequency table. Marks 1 10 11 20 21 30 31 40
Descriptive Statistics Practice Problems (99-04) 1. One thousand candidates sit an examination. The distribution of marks is shown in the following grouped frequency table. Marks 1 10 11 20 21 30 31 40
Miscellaneous Measuring Devices
 Instrumentation 7 C H A P T E R Miscellaneous Measuring Devices Objectives After completing this chapter, you will be able to: Define terms associated with miscellaneous measuring devices: vibration rotational
Gains in Written Communication Among Learning Habits Students: A Report on an Initial Assessment Exercise
 Gains in Written Communication Among Learning Habits Students: A Report on an Initial Assessment Exercise The following pages provide a brief overview of an assessment exercise focusing on a small set
Customer Survey. Motives and Acceptance of Biodiesel among German Consumers
 Customer Survey Motives and Acceptance of Biodiesel among German Consumers A Survey in the Framework of Carbon Labelling Project EIE/06/015/SI2.442654 by Q1 Tankstellenvertrieb GmbH & Co. KG Rheinstrasse
Trip Wire. Category: Physics: Electricity & Magnetism. Type: Make & Take Rough Parts List:
 Trip Wire Category: Physics: Electricity & Magnetism Type: Make & Take Rough Parts List: 1 Clothespin 1 Buzzer 1 Battery 1 Small piece of foil 6 Electrical wire 18+ Fishing line 1 Popsicle stick 2 Dowels
Rubber Band Car. Tommy Stewart Corey Marineau John Martinez
 Tommy Stewart Corey Marineau John Martinez Rubber Band Car PURPOSE: Create a rubber band propelled car that will travel three meters. Then create a regression line using the data that represents how the
Solar Kit Lesson #13 Solarize a Toy
 UCSD TIES adapted from NYSERDA Energy Smart www.schoolpowernaturally.org Solar Kit Lesson #13 Solarize a Toy TEACHER INFORMATION LEARNING OUTCOME After designing and constructing solar electric power sources