1. Introduction The Agency Service Characteristics Facilities Fleet Technology...
|
|
|
- Ann Campbell
- 5 years ago
- Views:
Transcription
1 DRAFT
2
3 Table of Contents 1. Introduction The Agency Service Characteristics Facilities Fleet Technology Transportation Demand Management/Transportation System Management System Performance & Market Service Plan Capital Plan Financial Plan The Route Ahead Appendix A: Environmental Determination of Non-Significance Appendix B: Public Comments
4
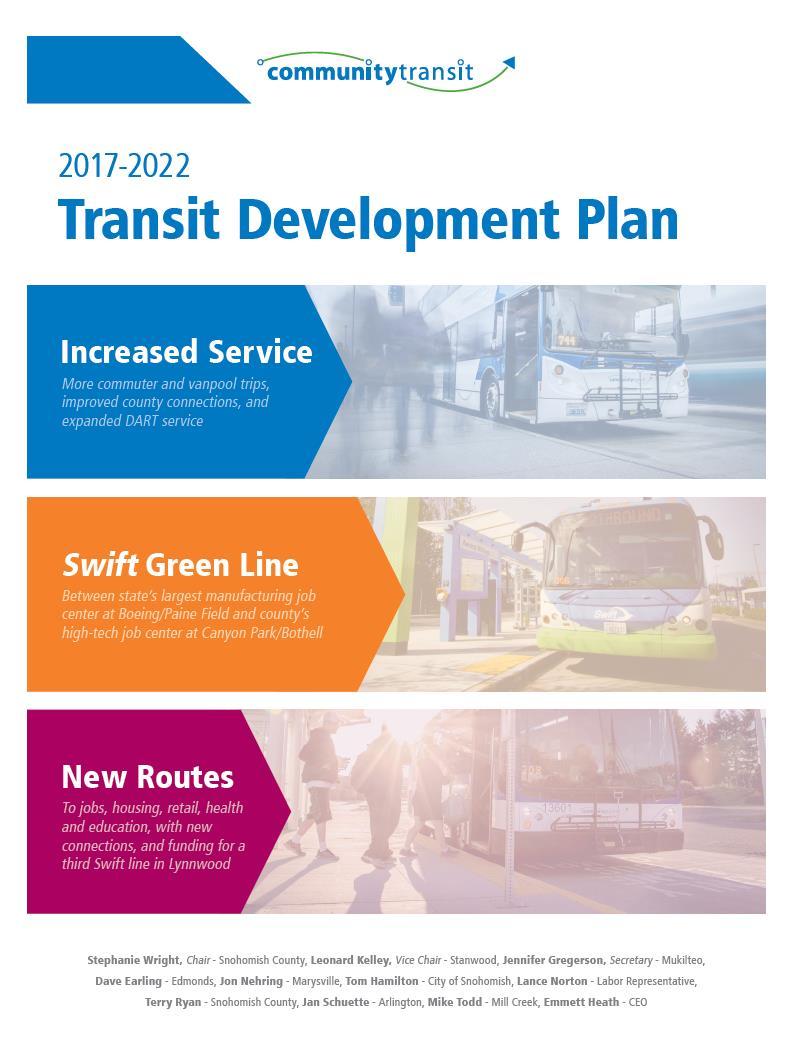
5 INTRODUCTION 1. Introduction For more than 40 years, Community Transit has provided public transit services to communities throughout Snohomish County. Over these four decades, our region has prospered and grown in ways that were difficult to imagine in Population and job growth have been dramatic, urbanization is widespread and traffic congestion is a daily fact of life. Community Transit has also grown and our services are more important than ever to the communities we serve. Each weekday we carry about 36,000 passengers on our bus, vanpool and DART services. That s roughly the population of Lynnwood. Twenty thousand of these customers are traveling to or from jobs in Snohomish or King Counties. Six thousand customers are traveling to or from universities, colleges, primary and secondary schools each day. During mid-day hours people take our buses to shopping and appointments. In the evening, our service provides a ride home from entertainment and late jobs. In addition to the economic and mobility benefit of all these trips, Community Transit s services help to relieve pressure on our congested highways and support healthier communities. On I-5 between Everett and Seattle, buses carry 25 percent of commuters but represent less than 1 percent of vehicle traffic. If we didn t have this service, I-5 would need at least one more lane in each direction. With more than half of our service running on state highways, the efficiency of transit saves taxpayers millions of dollars each year in unnecessary road expansion costs. Finally, Community Transit services are an economic engine in Snohomish County. With the access to jobs, schools, commercial activity and the incentive we provide for more dense development, we are a vital amenity in the community. Studies demonstrate that every dollar invested in public transit provides at least $3.50 in economic return due to this positive multiplier effect (American Public Transit Association, 2009). Our Vision Our future plans envision a community where public transportation helps the economy grow, protects our quality of life and offers appealing choices for travel to your destination every day, with a network of Swift bus rapid transit lines with a bus coming every 10 minutes on the county s major east-west and north-south corridors. The goal is providing quick and safe trips from neighborhoods to jobs, schools and errands. There will be seamless integration with Sound Transit light rail stations in Mountlake Terrace, Lynnwood and Everett. 1 TRANSIT DEVELOPMENT PLAN
6 INTRODUCTION Community Transit already has the basic network in place and is moving forward with three themes. 1. Making what we have better... We are increasing the number of trips throughout the system, so schedules become less important and connections more convenient. This includes more buses in the mid-day, more trips on the weekend and more service to Seattle and the University District. We plan to expand our daily hours of service so people can catch a bus earlier in the morning and later at night. We want to take you to work and get you home. 2. More Swift lines... Major metropolitan areas often have trains that get you everywhere at any time. In Snohomish County, we have Swift: bus rapid transit that acts like a train for fast, frequent transit service. Swift serves fewer stops than regular buses and runs more frequently to create more predictability and faster service. Our first Swift, the Swift Blue Line, has become the agency's highest ridership route and has ushered new economic development along Highway 99 from Everett to Edmonds. We help create jobs, and we take people to those jobs! Planning is well underway for a second Swift, the Swift Green Line, which will connect Paine Field/Boeing with Canyon Park/Bothell. In addition to serving nearly 100,000 jobs at those two endpoints, the Swift Green Line will cross paths with the Swift Blue Line at Highway 99, creating fast and easy connections between both corridors. The best part: The Swift Green Line will be up and running in early 2019! Early planning is also underway for a third line, the Swift Orange Line, to connect with Sound Transit s Link Light Rail when it gets to Lynnwood in Going more places more often... In addition to making our current system better and adding more Swift lines, we will expand our overall service. This involves creating new routes in areas we haven t previously served, and connecting communities we already serve in new ways. A significant step was introduction of the new Routes 109 and 209 on Highway 9 in TRANSIT DEVELOPMENT PLAN
 describes how Community Transit is implementing this vision. We are moving forward quickly with service expansion due to the passage of Proposition 1 in November 2015.")
7 INTRODUCTION With more local bus connections and our network of future Swift lines, there will be more reason to leave your car at home The Transit Development Plan The Transit Development Plan (TDP) describes how Community Transit is implementing this vision. We are moving forward quickly with service expansion due to the passage of Proposition 1 in November The successful ballot measure added 3/10 th (3 cents on a $10 purchase) to the retail sales tax Community Transit collects within the Public Transportation Benefit Area (PTBA map on page 5). Proposition 1 is forecast to provide more than $30 million in additional annual sales tax revenue for new services, vehicles, facilities, technology and programs. The TDP provides a framework describing annual growth in hours of transit service as well as the vehicles, personnel and facilities required to support this growth. The plan also gives an overview of new service priorities. These priorities clarify where new routes are planned, where extra bus trips will be added and new facilities to be constructed. The TDP is part of a planning cycle that includes Community Transit s Long Range Transit Plan (our vision for the future), business planning and the annual budget. Figure 1-1 describes how these processes work together for the development and implementation of services. FIGURE 1-1 PLANNING CYCLE 3 TRANSIT DEVELOPMENT PLAN
8 INTRODUCTION Highlights from the Transit Development Plan include: Capacity for more than 136,000 hours of new bus service (a 36 percent increase over 2016 levels) by Construction and implementation of the Swift Green Line between Boeing/Paine Field and Canyon Park. New routes providing connections between destinations like Quil Ceda Village, Arlington, Lynnwood, Boeing, Edmonds and Ash Way Park & Ride. Improved east-west connections on major arterial roadways. More trips on local and commuter routes to increase capacity and provide better connections. More trips in mid-day and evening hours so taking the bus an option more hours of the day. Additional service on weekends. Purchase of 127 new buses, expanding the current fleet by 26. Purchase of 334 new Vanpools, expanding the current fleet by 30. Construction of Seaway Transit Center. Expanded operating base capacity. Implementation of new technologies to improve customer information, operations and efficiency of service. Building a Transit Legacy The growth enabled by Proposition 1 is allowing Community Transit to deliver much of the vision described in our Long Range Transit Plan. By the end of this six year period, we will deliver a robust, efficient transit network supported by new technologies, enhanced facilities and an expanded vehicle fleet. Our services are connecting new destinations, operating more frequently, and for more hours of the day. We are working to improve reliability of schedules and provide better access for customers. By the end of this plan, two Swift lines will be providing fast, convenient connections for thousands of daily riders and a third line will be in development. This network of Swift lines will provide the high capacity transit network needed for integration with Sound Transit s Link light rail when it opens in Lynnwood and Mountlake Terrace in Public transportation is vital to our region s future. While growth and prosperity bring more people and traffic to our roads, we are working to provide transit services that integrate with our partners and provide options to keep everyone moving. Together we are building a world-class transit system that will enable continued economic growth and high quality of life in all our communities. 4 TRANSIT DEVELOPMENT PLAN
9 THE AGENCY 2. The Agency Community Transit is a special-purpose, municipal corporation providing public transportation services. Snohomish County voters created Community Transit in 1976 when they approved a sales tax to support a public transportation benefit area authority (PTBA), which now encompasses most of urbanized Snohomish County excluding the City of Everett. Community Transit began operations on October 4, Community Transit s original service area consisted of the communities of Edmonds, Lynnwood, Marysville, Mountlake Terrace, Brier, Snohomish, and Woodway. Subsequent annexations added Lake Stevens, Monroe, Granite Falls, Mukilteo, Stanwood, Sultan, Arlington, Gold Bar, Index, Darrington, Mill Creek, the Snohomish County portion of Bothell, Silver Firs and the Tulalip Indian Reservation to the service area. Community Transit now serves 565,244 residents, about 73 percent of Snohomish County s population. The remainder of the county s population resides in Everett (108,300) and in less populated areas of north and east Snohomish County. FIGURE 2-1 SNOHOMISH COUNTY PUBLIC TRANSPORTATION BENEFIT AREA 5 TRANSIT DEVELOPMENT PLAN

10 THE AGENCY Community Transit s Governing Body Community Transit s governing body is a Board of Directors consisting of nine voting members and one non-voting member as follows: Two members of the Snohomish County Council Two elected officials from cities Community Transit serves with populations of 35,000 or more Three elected officials from cities Community Transit serves with populations between 15,000 and 35,000 Two elected officials from cities Community Transit serves with populations of less than 15,000 One non-voting labor representative selected by the unions who represent some Community Transit employees. Community Transit s 2017 budget provides for 696 full time equivalent employees (FTE) in eight departments. The agency s Corporate Organizational Chart is provided below. FIGURE CORPORATE ORGANIZATIONAL CHART 6 TRANSIT DEVELOPMENT PLAN
11 SERVICE CHARACTERISTICS 3. Service Characteristics Fixed-Route Community Transit operates regular fixed-route bus services which connect most communities in Snohomish County as well as peak period commuter services to major destinations like Everett Boeing, the University District and downtown Seattle. Community Transit s local bus routes operate 365 days a year. Commuter services operate during peak commute hours on weekdays. Community Transit bus services integrate with the services provided by King County Metro, City of Seattle, Sound Transit, Everett Transit, Island Transit, Skagit Transit, Amtrak, and the Washington State Ferry System. Community Transit is also Sound Transit s contractor for operation of a portion of Sound Transit Regional Express Bus Service. Most Community Transit bus service is directly operated by Community Transit employees out of the Merrill Creek Operating Base in southwest Everett. A portion of Community Transit s commuter routes to downtown Seattle and all Community Transitcontracted Sound Transit Regional Express Bus Services are operated under contract with First Transit, Inc. out of the Kasch Park Operating Base in southwest Everett. In 2011, Community Transit adopted a Long Range Transit Plan (LRTP) to guide our long term vision and future service goals for the next 20 plus years. The LRTP further describes the fixed-route network as consisting of Core, Community-Based and Commuter services. Maps showing the geographic extent of these service types and descriptions of key characteristics are provided below. CORE SERVICE Community Transit provides frequent service on Transit Emphasis Corridors, including Swift Bus Rapid Transit (BRT) and other routes with frequent service. These core routes are in high-demand transit markets, and provide straight, direct connections between centers in the urbanized areas of Snohomish County. About 44 percent of all Community Transit passenger boardings are on core service routes. 7 TRANSIT DEVELOPMENT PLAN

12 SERVICE CHARACTERISTICS Swift Bus Rapid Transit Swift Bus Rapid Transit (BRT) is Community Transit s High Capacity Transit (HCT) service. Swift incorporates key elements of bus rapid transit design such as landmark stations, uniquely branded vehicles, offboard fare collection, real-time customer information, priority bus lanes and fast, frequent and reliable service. Long range plans call for a network of Swift lines connecting destinations in urban areas throughout the County. The Swift Blue Line on Highway 99 between Everett and Shoreline was Washington State s first BRT line, starting service in November It has quickly become a cornerstone of our service with one in six Community Transit boardings on the Swift Blue Line. The Swift Blue Line is partially financed through a partnership agreement with the City of Everett whereby a fraction of the City s transit sales tax revenue is allocated to Community Transit. The City of Everett also financed construction of Swift Blue Line stations within the City and the north terminal at Everett Station. Local jurisdictions have embraced the Swift Blue Line, recognizing its potential to reshape their communities. Lynnwood, Everett, Mukilteo and Snohomish County have either adopted or are considering land use changes incentivizing transit-oriented development (TOD) around Swift Blue Line stations. As described in this Transit Development Plan, Community Transit is constructing the second Swift line, known as the Swift Green Line, between the Boeing/Paine Field manufacturing center and the Canyon Park high-tech center. Service on the new line is expected to start in BRT design characteristics that make Swift our most popular service include: No need for a schedule - Swift operates every 12 minutes (to be reduced to 10 minutes in 2018) weekdays from 6 a.m. to 7 p.m., and every 20 minutes early mornings, nights, Saturdays, Sundays and holidays. 8 TRANSIT DEVELOPMENT PLAN
13 SERVICE CHARACTERISTICS Fast boarding Swift buses have three doors and people can enter at any one. Bicycles can be rolled onto bike racks located inside by the back door. Pay fares first Customers pay their fares at the station while waiting for the bus, then board at any door when the bus arrives. Accessibility Station platforms are just a few inches shorter than the floor of the bus, making it easy to step aboard. People who use wheelchairs enter at the front door and have an option to use seating equipped with a passive restraint system that doesn t require coach operator assistance. Priority infrastructure Business Access and Transit (BAT) lanes provide a dedicated path for the Swift Blue Line on sections of Highway 99 and the new route for the Swift Green Line. A queue-jump (a dedicated bus-only traffic signal) in the northbound direction at 148th Street on Highway 99 gives Swift Blue Line buses a six-second jump on adjacent lanes, allowing them to merge ahead of general purpose traffic. Both BAT lanes and queue-jumps help keep Swift on schedule and minimize impacts to car traffic. High tech, high speed Transit Technologies make Swift work better. ORCA (regional electronic fare card) readers and ticket vending machines at each station make paying fares fast and easy. Signal priority throughout the corridor can provide a shortened red light or an extended green light to keep Swift moving quickly. Automated stop announcements clearly indicate upcoming stations. Automatic vehicle locating systems provide for consistent bus spacing on the corridor. Automated passenger counters track ridership at each station. 9 TRANSIT DEVELOPMENT PLAN
14 SERVICE CHARACTERISTICS Other Core Routes Other core routes in Community Transit s system generally provide straight, direct frequent service between major destinations. In addition to Swift, core service includes Routes 101, 105, 115, 116, 196, 201 and 202. These are the trunk lines of Community Transit s local service network, providing the fastest way to get between major destinations on the bus. As described in the Long Range Transit Plan, over time, some of these corridors will transition to Swift service. FIGURE 3-1 CORE ROUTES 10 TRANSIT DEVELOPMENT PLAN
15 SERVICE CHARACTERISTICS COMMUNITY-BASED SERVICE Community-based service feeds core service and connects outlying communities. Routes in this category are less frequent but more flexible than core routes, sometimes following a less direct path to link smaller scale destinations. While not considered to be trunk lines, community-based service routes play a vital supporting role to the transit network and provide 17 percent of all Community Transit passenger boardings. Feeder Routes In southwest Snohomish County, the Marysville-Tulalip area, and the Highway 2 corridor from Everett to Monroe, local routes provide neighborhood connections and carry riders to core service routes we call these feeder routes. Feeder service includes Routes 106, 109, 111, 112, 113, 119, 120, 130, 209, 222 and 271. FIGURE 3-2 FEEDER ROUTES 11 TRANSIT DEVELOPMENT PLAN

16 SERVICE CHARACTERISTICS Rural Routes In less-densely populated areas of north and east Snohomish County, rural routes provide important connections between outlying communities and the core service network. Rural service includes Routes 220, 230, 240, 270 and 280. FIGURE 3-3 RURAL ROUTES 12 TRANSIT DEVELOPMENT PLAN
17 SERVICE CHARACTERISTICS COMMUTER SERVICE Commuter service generally provides peak period, peak direction service for trips destined to and from major activity centers. This service is comprised of in-county commuter routes serving Boeing in southwest Everett and inter-county commuter routes to downtown Seattle and the University District. Commuter service provides 28 percent of all Community Transit passenger boardings. Commuter service includes Routes 107, 227, 247, 270, 271 and 280 to Boeing- Everett; Routes 402, 405, 410, 412, 413, 415, 416, 417, 421, 422, 424, 425 and 435 to downtown Seattle; and Routes 810, 821, 855, 860, 871 and 880 to the University District. FIGURE 3-4 COMMUTER SERVICE ROUTES 13 TRANSIT DEVELOPMENT PLAN
 which include 7-, 12-, and 15- passenger vans.")
18 SERVICE CHARACTERISTICS Vanpool/Ride-Matching Vanpools are a cost-effective way to serve commuters whose schedule or origin/destination are not conducive to fixed-route bus travel. Community Transit s vanpool program is one of the largest in the nation. The fleet consists of 432 vehicles (including 30 loaner spare vans) which include 7-, 12-, and 15- passenger vans. Vanpools serve commuter groups with an origin or destination in Snohomish County. The groups pay a fare each month based on the size of their van and round-trip mileage. Fares cover program supervision, fuel, maintenance and insurance. Community Transit staff provides assistance to vanpool groups with monthly bookkeeping, maintenance, emergencies, and any other vanpool program issues. A staff person is on call 24 hours a day to respond to vanpool emergencies such as accidents or breakdowns. Community Transit also offers ride-matching services throughout the region to those interested in carpooling and vanpooling. Commuters are matched by where they live, their destination, and their work schedule. When a person applies for a ride match, a list of others looking to share the ride will be sent to them. In addition, their name will be added to the Rideshareonline database of more than 25,000 commuters who want to share the ride within the Puget Sound region. In 2016, vanpools provided 8.5 percent of all Community Transit passenger trips, or nearly 0.9 million rides. In 2016, there were 367 active Community Transit vanpools serving almost 70 major employers. DART Paratransit For customers who cannot use fixed-route bus services due to disability, Community Transit offers comparable origin to destination paratransit service within ¾-mile of all local fixed-routes during hours of fixed-route operation. Community Transit currently provides Dial-A-Ride Transit (DART) paratransit service to almost 5,000 registered disabled customers, with an average daily ridership greater than 600. Community Transit s paratransit service requirements are strongly tied to the local service network. As local bus service expands or contracts in geographic coverage and operating hours, DART operations are adjusted in response. DART service is operated under contract with Senior Services of Snohomish County. Education Programs Community Transit has two programs to educate specific populations on how to ride the bus. One program targets children and young adults while the other works with seniors and the disabled. 14 TRANSIT DEVELOPMENT PLAN


19 SERVICE CHARACTERISTICS School Transit Education Program (STEP) The STEP program educates students throughout Snohomish County about our transit system and how to ride the bus. STEP is an entertaining and informative program developed by Community Transit to promote sustainable and active transportation. The program focuses on the benefits and safety of public transportation. Immediately following the in-classroom presentation, everyone participates in a 30-minute ride on a comfortable 60-foot articulated bus. The rolling classroom allows students to apply their newly-discovered skills. The program reaches approximately 10,000 children each year in Snohomish County, with over 200 classroom presentations and 250 bus rides. Transit Instruction Program The Transit Instruction Program is like Bus Riding 101 provided to senior citizens, persons with disabilities, and non-english speaking customers. The free program is designed to provide practical training on how to use Community Transit's regular fixedroute bus system. Instruction is customized to meet individual needs and can last from one hour to several days however long it takes for the rider to feel safe and confident using Community Transit s regular bus service. Group presentations and training are available for senior centers, residential facilities, adult family homes, schools, and other organizations. These presentations provide a basic orientation to Community Transit's bus system and public transit options for Snohomish County residents. Van GO Program Van GO originated in 2000 following revenue and service reductions as a result of passage of I-695. That year, Community Transit s Board of Directors unanimously approved a staff proposal that six wheelchair accessible minibuses and six 15- passenger vans be granted to qualifying non-profit organizations throughout Snohomish County. The goal was to ease some of the pain for senior citizens, the disabled and youth caused by the service cuts. Since then, Community Transit has granted 126 vehicles to non-profit organizations in Snohomish County to provide transportation services to residents. Vehicles that are earmarked for surplus auction are instead granted to non-profit agencies. Usually, 15 TRANSIT DEVELOPMENT PLAN
20 SERVICE CHARACTERISTICS retired Community Transit vans sold at auction net a few thousand dollars each for the agency. By granting some of these surplus vehicles to community groups, they can continue to provide many times that value in transportation services. Community Transit's Van GO program accepts applications when the program is open. Sign up here and we'll contact you when Van GO is accepting applications. Fare Structure TABLE 3-1 AGENCY FARE STRUCTURE Fixed-Route Bus and DART Paratransit Fares (effective July 1, 2015) Reduced Fare Service Category Adult (age 19-64) Youth (age 6 to 18) Permit (age 65+, disabled, Medicare) Monthly Pass (Adult Fare) Local $2.25 $1.50 $1.00 $81 Commuter - South/Everett $4.25 $3.00 $2.00 $153 Commuter North/East $5.50 $4.00 $2.50 $198 DART Paratransit $2.25 $81 Vanpool rates are based on van size, daily mileage and number of Vanpool days used. Rates effective January 1, 2014 vary from $250 to $1,681 per van per month for currently active Vanpool groups. Passenger fares cover at least 20 percent of the cost to provide transit service. In 2009, Community Transit, along with other central Puget Sound transit agencies, introduced the ORCA electronic fare card. The ORCA smart card provides a seamless, customerfriendly way for riders to pay their bus, ferry or train fare without worrying about the complexities of fare payment on different services and transit systems. Customers can load monthly passes onto the card or use E-purse, a pre-paid value that may be used to pay a fare. Many employers and academic institutions purchase annual business account ORCA cards for their employees and students. ORCA has been very successful, with more than 80 percent of Community Transit s bus riders using the card. 16 TRANSIT DEVELOPMENT PLAN

21 FACILITIES 4. Facilities Operations/Administration Community Transit s primary operating and maintenance functions and corporate administrative offices are located at the Merrill Creek Operating Base at 7100 Hardeson Road, Everett, Washington. Contracted bus service, and vanpool/fleet vehicle maintenance as well as additional administrative offices are located at the Kasch Park Operating Base at 2300 Kasch Park Road, Everett, Washington. Facilities maintenance and distribution/storage are located at the Kasch Park Casino Road site at 2312 W. Casino Road, Everett, Washington. Community Transit s RideStore provides ORCA fare card and Regional Reduced Fare Permit (RRFP) sales and information as well as Lost and Found. The RideStore is located at the Lynnwood Transit Center at th Avenue W, Lynnwood, Washington. Park & Rides and Transit Centers Community Transit serves 22 park and rides and transit centers with parking capacity for more than 8,000 automobiles and 172 bicycles (Maps 4-1, 4-2, and Tables 4-1, 4-2). Major facilities (defined by the Puget Sound Regional Council as regionally significant if more than 250 spaces) are located in southwest Snohomish County from Everett to the King County line. Smaller park & rides (250 and fewer spaces) are located in north and east Snohomish County. Eastmont and South Everett park & rides are listed in the tables but are served by Sound Transit and Everett Transit buses only. There are also 16 park & pool lots in Snohomish County with a total of 518 parking stalls. The park & pool at I-5 and SR-531 is owned by Washington State Department of Transportation (WSDOT). The remaining 15 park & pools are leased by Community 17 TRANSIT DEVELOPMENT PLAN

22 FACILITIES Transit from churches and other private parties. Some park & pools are near Community Transit fixed-route service and provide a parking alternative to some of the larger park & ride facilities. All park & pools provide a convenient gathering place for formation of carpools and vanpools. The tables and maps that follow provide the name, location and size of park & rides, transit centers and park & pools in Snohomish County. FIGURE 4-1 PARK & RIDES AND TRANSIT CENTERS 18 TRANSIT DEVELOPMENT PLAN
23 FACILITIES FIGURE 4-2 PARK & POOL LOTS 19 TRANSIT DEVELOPMENT PLAN
24 FACILITIES TABLE 4-1 MAJOR PARK & RIDES AND TRANSIT CENTERS Major Park & Rides & Transit Centers (Park & Rides with 250 or more parking stalls, Transit Centers with frequent bus service, sorted by size) Name Owner Service Provider Maintenance Lynnwood Transit Center WSDOT/ST Community Transit /ST Everett Station Everett Community Transit /ET/ST/SKAT Ash Way Park & Ride WSDOT Community Transit /ST Mountlake Terrace Transit Center & Freeway Station WSDOT Community Transit /ST/KCM Mariner Park & Ride WSDOT Community Transit /ET Swamp Creek Park & Ride WSDOT Community Transit McCollum Park Park & Ride Snohomish County Community Transit South Everett Freeway Station WSDOT ST/ET Eastmont Park & Ride WSDOT ST/ET Canyon Park Park & Ride WSDOT Community Transit /ST Community Transit /ST Car Stalls Bicycle 1 1, ET 1, Community Transit Community Transit Community Transit Community Transit Community Transit Community Transit /ST Community Transit /ST Community Transit /ST 1, Edmonds Park & Ride WSDOT Community Transit Community Transit Aurora Village Transit Center* KCM Community Transit /KCM KCM 202* Edmonds Com. College Transit Community EdCC Community Transit Center Transit 0 Edmonds Station (bus facility) Community Community Community Transit Transit Transit 0 Smokey Point Transit Center Community Community Community Transit Transit Transit Bicycle storage is in the form of lockers and racks: there are 5 bike spaces per bicycle rack. Service Provider: ST = Sound Transit, ET = Everett Transit, KCM = King County Metro, SKAT = Skagit Transit, WSDOT = Washington State Department of Transportation *Aurora Village Transit Center is listed under major facilities due to the regional nature of this hub and the frequency of service. 20 TRANSIT DEVELOPMENT PLAN
25 FACILITIES TABLE 4-2 SMALLER PARK & RIDES Smaller Park & Rides (Less than 250 parking stalls sorted by size) Name Owner Service Provider Maintenance Marysville Cedar and Grove Park & Ride Lake Stevens Transit Center Community Transit Community Transit Community Transit Community Transit Marysville Ash Ave Park & Ride WSDOT Community Transit Stanwood I-5 Park & Ride Stanwood/ Snohomish County Community Transit Monroe Park & Ride WSDOT Community Transit Snohomish Park & Ride WSDOT Community Transit Marysville I South Park & Ride WSDOT Community Transit Stanwood 267th Park & Ride WSDOT Community Transit /IT Marysville II 116th & I-5 Park & Ride WSDOT Community Transit Sultan Park & Ride WSDOT Community Transit Gold Bar Park & Ride WSDOT Community Transit Arlington Park & Ride WSDOT Community Transit Community Transit Community Transit Community Transit Community Transit Community Transit Community Transit Community Transit Community Transit Community Transit Community Transit Community Transit Community Transit/WSDOT Brier Park & Ride Brier Community Transit Brier 13 1 Bicycle storage is in the form of lockers and racks: there are 5 bike spaces per bicycle rack. Car Stalls Bicycles TRANSIT DEVELOPMENT PLAN
26 FACILITIES TABLE 4-3 PARK & POOL LOTS Park & Pools (sorted by size) Name Jurisdiction Owner Maintenance Stalls Martha Lake Covenant Church Snohomish County Private Party Owner Provided 75 United Presbyterian Church of Seattle Edmonds Private Party Owner Provided 58 Smokey Point Community Church Arlington Private Party Owner Provided 50 Advent Lutheran Church Mill Creek Private Party Owner Provided 62 Holy Cross Lutheran Church Lake Stevens Private Party Owner Provided 35 I-5 & SR-531 Marysville WSDOT Owner Provided 32 Cypress Semiconductor Lynnwood Private Party Owner Provided 31 Mill Creek Community Church Snohomish County Private Party Owner Provided 30 Marysville United Methodist Church Marysville Private Party Owner Provided 25 Seattle Meditation Center Mountlake Terrace Private Party Owner Provided 22 Bethesda Lutheran Church Mountlake Terrace Private Party Owner Provided 22 Calvary Chapel Marysville Private Party Owner Provided 20 Edmonds Lutheran Church (84th Ave) Edmonds Private Party Owner Provided 13 Ebenezer Lutheran Church Lake Stevens Private Party Owner Provided 10 Edgewood Baptist Church Edmonds Private Party Owner Provided 10 North Creek Presbyterian Church Mill Creek Private Party Owner Provided TRANSIT DEVELOPMENT PLAN
27 FACILITIES Bus Stops & Swift Stations Community Transit buses serve more than 1,600 bus stops in Snohomish and King Counties; More than 250 of these bus stops are equipped with a passenger shelter. In addition to regular bus stops, Community Transit s system includes 31 Swift BRT stations, which have raised platforms, passenger shelters, benches and off-board fare payment. FIGURE 4-3 BUS STOPS & SWIFT STATIONS 23 TRANSIT DEVELOPMENT PLAN
28 24 TRANSIT DEVELOPMENT PLAN FACILITIES


29 FLEET 5. Fleet Community Transit currently owns, operates, and maintains 263 fixed-route buses, 432 vanpool vans and 52 DART paratransit vehicles. Our bus fleet is comprised of 30-foot, 40-foot and 60-foot buses as well as 62-foot Swift BRT buses, and 42-foot double decker buses dubbed Double Talls, the first of their kind in Washington State. The average age of our fixed-route fleet is greater than nine years. Innovations within our bus fleet include passive restraint systems for wheelchair users, on-board bicycle racks on our Swift BRT buses and the agency s first fixed-route 40-foot diesel-electric hybrid buses. The fleet by vehicle type in December 2016 is shown in Table 5-1. TABLE 5-1 REVENUE VEHICLE FLEET Revenue Vehicle Fleet by Type, December 2016 Type Propulsion Count 30 Foot Bus Diesel Foot Bus Diesel Foot Bus Hybrid Foot Bus Diesel 80 Double Tall Bus Diesel 45 Swift Bus Hybrid 15 Fixed-Route Subtotal 263 DART Gasoline & Diesel 52 Vanpool Gasoline 432 Total Fleet All Types TRANSIT DEVELOPMENT PLAN

30 FLEET Over the course of this six-year Transit Development Plan, Community Transit s bus, DART and vanpool fleets will undergo significant change. Many aging vehicles will be replaced and the fleets will grow. Additionally, in order to support near-term service expansion, many buses that had been retired to the Contingency Fleet will be activated into service while we await delivery of new buses from the manufacturer. Details of vehicle fleet replacement and expansion are provided in the Capital Plan section of this plan. 26 TRANSIT DEVELOPMENT PLAN
31 TECHNOLOGY 6. Technology Community Transit relies on technology to assist with nearly every aspect of delivering service to our customers. This includes business applications that support administrative functions like payroll and purchasing, planning, and operating functions like scheduling trips and assigning drivers to work. It also includes customer facing tools to deliver timely information to our customers via their personal devices, vehicle and station signage. Intelligent Transportation Systems (ITS) provide for operational and customer needs like wireless connectivity for voice and data communications to our bus fleet, fare collection, real-time fleet management, automatic vehicle locating, trip planning and signal priority to keep buses moving in heavy traffic. Corporate IT Backbone In recent years, Community Transit has worked to replace and upgrade corporate technology infrastructure comprising the backbone of our technology systems. This work, encompassing cabling, switches, servers, backup systems and other components, was an important step required to provide a foundation for many current and future critical technology systems and applications. Customer Information Much of Community Transit s customer information is now delivered via technology systems. Our corporate website, blog and social media are all active forums for sharing the latest information on our services and interacting with customers. Community Transit s mobile and desktop website allow customers to find important information regarding their journey such as trip planning and real-time departure information. Additionally, electronic rider alerts allow riders to sign up for information regarding specific routes and services. Community Transit s call center is also supported by technology with voice over Internet Protocol (IP) telephones and desktop applications to help customers with trip planning. Intelligent Transportation Systems Intelligent Transportation Systems (ITS) is an industry term describing the many technologies that improve transit system operations, allow for a seamless customer experience, and provide transit priority on congested roadways. Transit Technology Suite Transit Technologies has been implemented on both the DART paratransit fleet and fixed-route buses, allowing dispatchers to increase productivity, improve on-time 27 TRANSIT DEVELOPMENT PLAN
32 TECHNOLOGY performance and reduce operating costs. These technology suites are continuously collecting data, further improving access to high quality data, and enabling Community Transit to more rapidly respond to customer needs. Transit Technologies were launched on commuter buses to Seattle in 2012 and the entire fixed-route bus fleet was operational with real-time location technology by fall of With the new system, customers now experience onboard automated audio announcements clearly identifying their bus route and major destinations along the way. Onboard electronic signs provide visual identification of the next stop, alerting passengers when their destination is approaching. Next-bus arrival signs have been installed at Swift stations and at major transit centers to help customers complete their trips by providing real-time departure information. Community Transit launched its electronic BusFinder application in 2015 that provides real-time bus information. Customers are able to check real-time information for any bus by phone, computer or mobile devices up to an hour before a stop is scheduled. The complete suite includes the following components: Tracking each vehicle s location with GPS Providing passengers with an estimated time of departure at any given stop Automatically counting passengers Automatically announcing stops Utilizing computer-aided dispatch More sophisticated tools and communication for drivers and dispatchers ORCA Community Transit participates in the regional ORCA electronic fare card program. Our customers have embraced the ORCA program with more than 80 percent of Community Transit s bus fares paid via the electronic fare card. This technology is an important element of providing seamless and convenient transit service among six Puget Sound transit agencies and Washington State Ferries. Radio Community Transit operates and maintains both 800 MHz Voice and 700 MHz Mobile Data radio systems to support fixed-route and paratransit operations. These systems are critical to ongoing safe and efficient operation of the transit system. Voice communications support operation of fixed-route services from both the Merrill 28 TRANSIT DEVELOPMENT PLAN
33 TECHNOLOGY Creek and Kasch Park operating bases. The 700 MHz Mobile Data radio system supports operation of the Transit Technologies suite on fixed-route operations at both operating bases as well as DART paratransit service. Current activity to upgrade and replace the radio system is described in the Capital section (page 30) of this plan. Transit Signal Priority (TSP) Transit Signal Priority (TSP) is an on-street technology provided by local jurisdictions to improve the reliability of bus service on congested roadways. TSP can provide a longer green light or a shorter red light to buses equipped with appropriate transponder equipment. TSP is an important component of local partnerships to develop transportation corridors that serve many users cars, bikes, pedestrians and transit. The technology helps keep buses on schedule and saves operational dollars that might otherwise be expended waiting in traffic. Community Transit s Swift Blue Line currently uses two TSP systems. In Edmonds, Lynnwood and Snohomish County, the radio tag-based McCain system provides priority for Swift Blue Line buses along Highway 99. In Everett, Swift Blue Line uses the Opticom system based on optical signals between the bus and traffic signal. During the next two years, the entire TSP system is being migrated to the Opticom system. This will reduce the operational costs and provide consistency throughout the entire corridor. Community Transit is coordinating with Snohomish County, WSDOT and Everett on design for a new Adaptive Signal Control Technology / Transit Signal Priority project that has been funded for implementation in the future Swift Green Line corridor. This new ASCT/TSP architecture will represent a new standard for transit priority and the integration of bus and traffic operations in Snohomish County. The project will begin implementation in Queue Jump Queue jumps are another element of on-street technology that help buses maintain speed and reliability. Swift buses now get a head start with a queue jump light at Highway 99 and 148th Street between Lynnwood and Everett, where the northbound transit lane ends. The new traffic signal on the northbound traffic pole at 148th above the pedestrian light is visible only to those in the right-hand transit lane. When a Swift bus is in this lane, the queue jump arrow lights green several seconds before the regular green light is activated for all northbound traffic. This head start allows time for the bus to cross the intersection and safely merge into the general traffic lane. 29 TRANSIT DEVELOPMENT PLAN
34 TECHNOLOGY When a Swift bus is not at this intersection, the arrow matches the color of the regular signal green, yellow or red. 30 TRANSIT DEVELOPMENT PLAN
35 TDM/TSM 7. Transportation Demand Management/Transportation System Management TRANSPORTATION DEMAND MANAGEMENT Transportation Demand Management (TDM) is a set of strategies and activities that help people use our transportation system more effectively by targeting travel behavior change to minimize the use of single-occupancy vehicles. With more people and businesses moving to Snohomish County, traffic congestion is increasing on our roadways affecting our ability to move goods and people. TDM is a cost-effective way to encourage people to use current transportation infrastructure and services more efficiently by connecting people with existing transit, vanpool, carpool and active transportation options. There are many community benefits to providing TDM programs and strategies including: Increasing person throughput on existing roadways Decreasing the need for additional and expensive road capacity projects Reducing greenhouse gas emissions (GHG) Providing access to jobs, vital services, shopping and recreation Supporting active and healthy lifestyles Community Transit has been providing TDM programs and services in Snohomish County for over 25 years. These programs help reduce traffic congestion making our existing transportation investments perform better, and improve outcomes for new transportation investments by developing the market for Community Transit bus and vanpool services to potential riders throughout the county. The TDM programs that Community Transit provides leverage funding through a variety of local, state and federal sources. This funding is critical to develop, maintain and grow effective programming to target behavior change throughout the county. Community Transit TDM programs and services include: Choice Connections Targeting large employers in 9 jurisdictions within Snohomish County affected by the Washington State Commute Trip Reduction Efficiency Act 31 TRANSIT DEVELOPMENT PLAN


 program to test new program elements, increase program")
.")

36 TDM/TSM Curb the Congestion Targeting residents, students, commuters and businesses along congestion roadways throughout Southwest Snohomish County Urban Growth Area School Transit Education Program Targeting K-12 students throughout the Community Transit service area (see Section 3, page 19) COMMUNITY TRANSIT TDM FUNDING: $745,867 17% 30% Local - Community Transit State CTR - WSDOT 28% 8% 17% State RMG - King County Metro Federal CMAQ - Snohomish County Federal CMAQ - WSDOT Choice Connections Community Transit partners with nine jurisdictions in Snohomish County and north King County affected by the Washington State Commute Trip Reduction Efficiency Act to administer strategies that increase the use of non-drive alone commute trips. In 2013, Community Transit was selected by the Washington State Commute Trip Reduction Board to participate in a pilot alternate Commute Trip Reduction (CTR) program to test new program elements, increase program efficiencies through easy quarterly worksite reports and improve data collection methodologies through non-drive alone trip logging through an online trip calendar system (RideshareOnline.com). During this period, worksites under the alternate program realized a 16.9 percent increase in non-drive alone trips. Incorporating the successful data collection and reporting elements of the alternate CTR program, Community Transit is in the process of working with partner jurisdictions to update their CTR Plan and Ordinance. 32 TRANSIT DEVELOPMENT PLAN
37 TDM/TSM Under the Choice Connections program, Community Transit works with 69 large employers representing over 32,000 employees to develop and implement transportation programs at their worksites. Customized employer services provided include: Commute Trip Reduction Program Development and Support TDM Strategy Consultation and Worksite Assessment and Support Transportation Options Training and Marketing/Incentive Programs On-site Transportation Events Guaranteed Ride Home and Ridematching Services ORCA Business Transit Pass Program Development Trip Data Collection through Online Calendaring System, RideshareOnline.com Curb the Congestion Through an ongoing partnership with Snohomish County and other transportation agencies, Community Transit implements an innovative, residential corridor-based TDM program proven to increase non-drive alone trips on seven of the most congested roadways in Snohomish County. The program covers 73 miles of roadways and a traffic shed of over 175,000 households and 4,500 businesses. The primary goal of the program is to increase non-drive alone trips during peak hours by educating and motivating people to try ridesharing and active transportation options for commute and discretionary trips. Since 2013, the program has expanded partnerships with corridor-impacted jurisdictions (Bothell, Mill Creek, Lynnwood and unincorporated Snohomish County) to promote transportation options to key markets and identify opportunities for supportive infrastructure and policies that enhance access to transportation options. The program is continuing to grow to reach different target audiences, increasing the potential for non-drive alone trips along the corridors, through the development of three new sub-programs: Curb@Home, Curb@School and Curb@Work. Curb@Home This sub-program will continue to target residents along corridors through a variety of TDM measures including: Oversight of Snohomish County s Voluntary Trip Reduction mitigation program for new multi-family residential developments located in unincorporated urban growth areas Development and distribution of travel educational materials including customized neighborhood travel options maps Free ORCA cards pre-loaded with fare value to residents within ¼ mile of transit service to incentivize trying the bus 33 TRANSIT DEVELOPMENT PLAN
38 TDM/TSM Starting in 2017, Curb the Congestion will implement an innovative personalized trip planning program that utilizes door-to-door individualized marketing strategies to effect behavior change through the use of motivational interviewing and personalized transportation assistance. The program will target 5,000 single-family households located along key corridors (128 th Street and SR-527). This is a market development area for the new Swift Green Line that will start service in early Deploying a personalized trip planning program will incentivize residents to utilize current transit service, gaining them as riders before the new line opens. Curb@School This sub-program will target students, K-8 and collegiate, to increase awareness and use of transportation options other than driving-alone. The program services include: Campus Ambassador program utilizing students, faculty and staff who currently use transportation options as a resource to others on campus to promote campus-based transportation programming Development of transportation improvement grants in coordination with campus student leadership and appropriated staff and faculty to implement one major improvement on each campus to increase the use of transportation options On-site Transportation Events & Marketing/Incentive Programs Promote active transportation to students K-8 in conjunction with national Bike to School and Walk to School days. In 2017, Curb@School will begin development of an ORCA card distribution campaign for high school students within the Community Transit service area to educate and provide resources for them to try the bus. The program will also partner with local jurisdictions Safe Routes to School and initiatives to provide active transportation and transit education programming in coordination with infrastructure improvements. Curb@Work This sub-program targets employers and employees at small businesses (99 or less employees) to develop and implement worksite transportation programs. TDM services include: TDM Strategy Consultations & Worksite Transportation Assessments On-site Transportation Events & Marketing/Incentive Programs ORCA Business Transit Pass Development and Rebate Program Expansion of the Curb the Congestion program can be modeled for other transitemphasis corridors to develop the market for new transit riders, with proven measurable results and long-term behavior change. 34 TRANSIT DEVELOPMENT PLAN
39 NON-DRIVE ALONE TRIPS TDM/TSM Curb the Congestion Program Results 500, , , , , , , , , , , , ,200 92, ,000 50,000 6,268 13,875 18, Curb the Congestion has seen exponential increases in non-drive alone trips along the program corridors since launching the program in 2008, reaching a saturation point in With the development of three sub-programs targeting new audiences, the program has the potential to effect behavior change for a significant portion of previously untapped drive-alone trips. Looking Ahead Over the next six years, Community Transit s TDM programs in Snohomish County will continue to provide education, resources and incentives to commuters and residents to increase non-drive alone trips. A keen emphasis will be focused on using customer research and insights to ensure we are delivering on customer needs. A new area of importance for TDM programs will include market development for our transit and vanpool services, providing first and last mile solutions, as well as enhanced partnerships with local and regional agencies to develop polices and plans that support sustainable transportation options. In order to provide these enhanced services, Community Transit will require additional funding to maintain and grow TDM staff and program offerings. Community Transit will need $2-$3M in additional funding to be able to provide program enhancements including: Expanding Curb the Congestion to other transit-emphasis corridors throughout the county Growing the Curb@Home personalized trip planning program to other eligible corridors Partnering with Choice Connections employers to provide first/last mile solutions to business parks Offering ORCA card distribution campaigns to new and in-need markets 35 TRANSIT DEVELOPMENT PLAN
40 TDM/TSM Developing alternative service options in partnership with other Community Transit departments, local jurisdictions & businesses Community Transit s TDM division will continue to utilize current funding sources, as well as explore new funding and partnership opportunities such as Washington State CTR Efficiency Grants, Regional Mobility Grants, and Safe Routes to School Grants, as well as private grant opportunities through public health and environmental organizations. 36 TRANSIT DEVELOPMENT PLAN

41 TDM/TSM FIGURE 7-1 COMMUNITY TRANSIT TDM PROGRAM SERVICE AREAS 37 TRANSIT DEVELOPMENT PLAN
42 TDM/TSM Land Use & Road Planning (Transit System Management - TSM) Community Transit works with local jurisdictions to coordinate transit and land use planning. Cities and counties have great influence over transit market development through land use and infrastructure decisions that direct the location and design of housing, commercial and public facilities. The Long Range Transit Plan describes a coordinated framework for matching frequent transit service with high levels of development density on Transit Emphasis Corridors. This coordinated planning is proving to be an effective strategy for many communities in Snohomish County. Some examples of Community Transit s role in ongoing work include: Participation in Washington State Department of Transportation (WSDOT) Route Development Planning. Review of development proposals and sub-area plans for transit-supportive land use and strategic TDM elements. Coordination with local jurisdictions on designation of transit-oriented development (TOD) land use development overlay zones around transit facilities. Participation in development of Countywide Planning Policies. Participation in development of countywide roadway policies and standards. Support of local jurisdiction Comprehensive Plan updates. Advocacy for transit priority infrastructure such as Business Access and Transit (BAT) lanes as well as preservation or enhancement of existing transit access. Coordinate with local jurisdictions to implement transit signal priority (TSP) systems within key transit corridors. Service Development Community Transit s service levels are planned to match the market. As described in the Long Range Transit Plan, service guidelines prioritize frequent service on Transit Emphasis Corridors where high transit travel demand can be expected to develop. A key element of the overall TDM/TSM program is ongoing monitoring of travel demand, community development and infrastructure investment to ensure that service levels keep pace with overall corridor development. 38 TRANSIT DEVELOPMENT PLAN
43 SYSTEM PERFORMANCE 8. System Performance & Market Ridership Community Transit provided more than 10 million passenger trips in 2016 on bus, DART paratransit and vanpool service. Ridership was more than 2 percent higher than in 2015, largely due to growth in weekend travel. The chart below illustrates ridership by mode and performance center, with 9.2 million fixed-route bus boardings, 0.87 million vanpool boardings, and 0.2 million DART boardings. Average weekday ridership was 36,591. Ridership on Saturdays averaged 11,706, while Sunday & holiday ridership averaged 7,208 riders System Ridership By Mode and Performance Center Total Boardings: 10,251,698 Vanpool 867, % DART Paratransit 194, % Bus Rapid Transit 1,734, % Commuter Bus 2,868, % Corridor-Based Bus 2,746, % Suburban/Rural Lifeline Bus 478, % Local Feeder Bus 1,361, % FIGURE RIDERSHIP BY SERVICE TYPE 39 TRANSIT DEVELOPMENT PLAN
44 Swift Vanpool DART SYSTEM PERFORMANCE Figure 8-2 compares 2016 annual ridership by route and mode. The Swift Blue Line, with more than 1.7 million boardings, carried more than triple the ridership of any other route. In 2016, nearly one in five Community Transit bus boardings were on the Swift Blue Line. Total vanpool and DART ridership is also shown in the chart for comparison with individual bus routes. 1,800, Year End Ridership by Route & Service Type 1,600,000 1,400,000 1,200,000 1,000, , , , ,000 0 FIGURE 8-2 RIDERSHIP BY ROUTE & SERVICE TYPE 40 TRANSIT DEVELOPMENT PLAN
45 749, , , , , , , , , , , ,934 SYSTEM PERFORMANCE Fixed-Route Bus Fixed-route service accounts for 89 percent of Community Transit s ridership with nearly 9.2 million boardings in The chart below illustrates monthly 2016 fixed-route ridership. The monthly variation in ridership follows historic patterns, largely driven by college and university schedules as well as seasonal vacations for commuters. 900,000 FIGURE 8-3 MONTHLY FIXED-ROUTE BOARDINGS 2016 Fixed-Route Boardings: 9,190, , , , , , , , ,000 0 Jan Feb Mar Apr May Jun Jul Aug Sep Oct Nov Dec 41 TRANSIT DEVELOPMENT PLAN
46 14,940 15,570 17,311 16,650 16,520 16,571 15,927 17,043 16,278 16,614 15,787 14,964 SYSTEM PERFORMANCE DART DART provided 194,175 Americans with Disabilities Act (ADA) paratransit trips in The chart below provides 2016 monthly DART ridership. In 2016, DART service provided 2.23 passenger trips per hour of service. DART productivity numbers are lower than fixed-route due to the federally-required curb-to-curb, demand-response nature of this service. 20, DART Paratransit Boardings: 194,175 18,000 16,000 14,000 12,000 10,000 8,000 6,000 4,000 2,000 0 Jan Feb Mar Apr May Jun Jul Aug Sep Oct Nov Dec FIGURE 8-4 MONTHLY DART PARATRANSIT BOARDINGS 42 TRANSIT DEVELOPMENT PLAN
47 65,411 61,420 72,097 74,075 72,325 74,063 69,861 80,871 76,109 72,056 70,780 78,408 SYSTEM PERFORMANCE Vanpool Community Transit s vanpool program continues to be among the largest in the nation with 366 active vans and 867,476 passenger trips in Each weekday, Community Transit s vanpool program carries commuters to about 70 employers in the central Puget Sound area. At year-end, there were 2,669 riders registered in the vanpool program. The following chart provides 2016 monthly vanpool ridership. A fleet utilization table shows the composition of Community Transit s vanpool fleet and the average occupancy of vans in each category. Note that 30 of the 432 van fleet are reserved as spares. FIGURE 8-5 MONTHLY VANPOOL BOARDINGS 90, Vanpool Boardings: 867,476 80,000 70,000 60,000 50,000 40,000 30,000 20,000 10,000 0 Jan Feb Mar Apr May Jun Jul Aug Sep Oct Nov Dec TABLE 8-1 VANPOOL FLEET UTILIZATION, 2016 Van Type Total Vehicles (year-end) Active Vanpools (year-end) Average Occupancy (Percent Seats Filled) 7-Passenger % 12-Passenger % 15-Passenger % All Vans % 43 TRANSIT DEVELOPMENT PLAN
48 Boardings in Millions SYSTEM PERFORMANCE Ridership Forecast Ridership is expected to grow substantially over the next six years as service levels are increased by 40 percent. More trips on existing routes, more mid-day service, more evening service, more weekend service and new routes to new destinations will all provide more opportunities for customers to use transit. More vanpools will also provide opportunities to increase ridership. The projection below is an estimate of potential ridership based on planned service growth and expected productivity (riders per hour of service). By 2022, projected ridership could exceed 14 million annual boardings. Achieving this forecast will require effective marketing of services and partnerships with employers and other agencies to incentivize transit use. The future ridership forecast is shown as a range, recognizing that new service takes time to reach its full market potential. External factors like employment levels and the cost of gasoline also significantly impact transit ridership and the ability to forecast future growth Annual System Boardings & Forecast Future ridership dependent on market factors such as employment, population growth & distribution, and gas prices Forecast Annual Fixed Route, Vanpool and DART ridership as reported to National Transit Database FIGURE 8-6 ANNUAL SYSTEM BOARDINGS & FORECAST TRANSIT DEVELOPMENT PLAN
 was home to 565,244 people (Washington State Office of Financial Management estimate).")
49 SYSTEM PERFORMANCE Population and Employment Snohomish County and Community Transit s service district continue to experience strong travel demand as people commute to work or school and conduct their daily lives. In 2016, the Public Transit Benefit Area (PTBA) was home to 565,244 people (Washington State Office of Financial Management estimate). The geographic distribution of population is illustrated in Figure 8-7. In 2016, 49 percent of PTBA population and 38 percent of overall Snohomish County population lived within ¼-mile of a Community Transit bus stop. Based on 2016 ridership and population, Community Transit provided 18 rides per capita. FIGURE 8-7 POPULATION DISTRIBUTION 45 TRANSIT DEVELOPMENT PLAN
.")
50 SYSTEM PERFORMANCE In 2015, the Puget Sound Regional Council estimated Snohomish County employment to be 276,361,000 jobs. PSRC identified 170,459 of these jobs as being in the PTBA. Based on the current service network, 61 percent of all jobs in the county and 74 percent of all jobs in the PTBA are within ¼-mile walk distance of Community Transit bus service (Figure 8-8). An additional 192,861 jobs in King County and 41,232 jobs in Everett are also within ¼-mile walk distance of Community Transit bus service. In all, 360,649 jobs are within ¼-mile walk distance of Community Transit bus service. Some job sites that do not have convenient access to fixed-route service are destinations for other services like Community Transit s vanpool program. FIGURE 8-8 EMPLOYMENT DISTRIBUTION 46 TRANSIT DEVELOPMENT PLAN
. A high proportion of this growth is planned to occur in urbanized areas.")
51 Annual Hours of Bus Service SYSTEM PERFORMANCE By 2040, population in Snohomish County is forecast to increase by more than 50 percent and employment is forecast to grow by more than 60 percent (Community Transit Long Range Transit Plan, Puget Sound Regional Council Vision 2040). A high proportion of this growth is planned to occur in urbanized areas. A key transportation assumption in local and regional plans is that transit will carry a significantly greater proportion of future travel demand than it does today. Current regional plans forecast the need for a 100 percent increase over 2008 levels in local transit service to meet this demand. For Community Transit, this increase is forecast to be an additional 500,000 service hours over current levels. With the passage of Proposition 1, Community Transit is now able to make substantial progress towards meeting the travel demand needs of Snohomish County. During the next six years, the agency plans to add over 136,000 hours of new transit service. Figure 8-9 illustrates how this infusion of new revenue enables the agency to grow service, including the progress that has already been made during the past two years. Growing to Meet Demand Community Transit Bus Service Level 700,000 Service Hour History Forecast 600, , , , ,000 Service Level in TDP 100, FIGURE 8-9 COMMUNITY TRANSIT BUS SERVICE GROWTH, AND PSRC TRANSPORTATION TRANSIT DEVELOPMENT PLAN
52 SYSTEM PERFORMANCE Current Market Factors In addition to longer-term population and employment growth, there are more immediate factors impacting the operating environment and demand for transit service. Significant market forces include a post-recession surge in land use development, a growing job market, limited road capacity, the cost and scarcity of parking, traffic congestion and the volatility of gasoline prices. New Land Use Development As described earlier in this section, Community Transit coordinates with local land use authorities regarding land use applications and long range planning efforts. As a result of this planning, higher density developments are being constructed near major transit facilities and along transit corridors. Examples include the multi-family residential units along 164 th Street SW and Ash Way within walking distance of the transit center and buses running on the 164 th Street corridor. More than 1,600 residential units have been constructed or permitted during the last three years. Hundreds more are currently under construction near the Swift station at Airport Road and Highway 99. More than 600 new units and new commercial development are approved along the 128 th Street corridor. More than 1,000 new residential units are permitted or under construction in Marysville. Finally, the City of Lynnwood has approved the construction of several hundred units and a new hotel within the 196 th Street corridor. Coordination with cities and Snohomish County to concentrate high-density and mixeduse developments around arterials with frequent bus service is a central goal of Community Transit s Long Range Transit Plan. The strategy is working. All of the new development cited above is within walking distance of frequent bus service. More than half of all Community Transit bus ridership occurs along these corridors. Employment Employment is the largest driver of Community Transit ridership: more than half of all Community Transit trips are trips for work (55 percent). In March 2017, the seasonally adjusted unemployment rate for the Seattle-Bellevue-Everett was 3.7 percent (Bureau of Labor & Statistics). Current projections by with Washington State Economic and Revenue Forecast Council (ERCF) point towards continued low unemployment rates in Washington State through the year This suggests sustained demand by commuters for transit service. Traffic Congestion, Travel Time, Parking Traffic congestion, long travel times and the lack and cost of available parking present both opportunities and challenges for transit. Two key drivers of our ridership success in the I-5 corridor to Seattle are the long, unpredictable travel times, and high cost of parking faced by commuters who drive a single occupant car. Buses are economical, 48 TRANSIT DEVELOPMENT PLAN

53 SYSTEM PERFORMANCE convenient and are granted a measure of priority in HOV lanes that bypass much of the daily traffic congestion, making transit an appealing alternative to driving alone. As employment has grown, traffic has increased and the incentive to take transit is higher than ever. The Washington State Department of Transportation s (WSDOT) 2014 Corridor Capacity Report further confirms what commuters already know; congestion is on the rise within the I-5 corridor. The report states the target travel time between Everett and Seattle is 28 minutes, while it s taking an average of 50 minutes during the morning commute. The problem became particularly acute in fall 2014, with a remarkable series of difficult commutes. Puget Sound Regional Council s Stuck in Traffic: 2015 Report also noted the dramatic increase in HOV travel time to Seattle and the impact on Community Transit service (Figure 8-10). FIGURE 8-10 I-5 TRAVEL TIME, FALL 2014 (PSRC STUCK IN TRAFFIC: 2015 REPORT) Unfortunately, congestion also affects bus commuters. Policies managing HOV lanes on I-5 have not kept up with the demand. Travel times for transit have become significantly longer and less reliable. Many transit users who willingly stand up for a minute commute to Seattle are too frequently encountering minute or longer travel times due to congested HOV lanes. As noted earlier, buses carry 25 percent of the people on I-5 during the peak commute hour but represent less than 1 percent of the vehicles. 49 TRANSIT DEVELOPMENT PLAN
54 SYSTEM PERFORMANCE Maintaining performance for transit in this corridor is critical to the entire roadway as well as the regional economy. In September 2015, Community Transit invested more than $2 million in additional running time for I-5 commuter bus trips just to make schedules more reliable. This did not add any new trips or capacity, nor did it make trips faster. The added time makes schedules more realistic, reflecting actual conditions and improving reliability and predictability for customers. The added annual expense is a real indicator of the cost of traffic congestion and underperforming HOV lanes in this corridor. Community Transit is committed to working with WSDOT and other stakeholders to identify solutions that will continue to make transit the preferred choice for I-5 and I-405 commuters. Two solutions include buses running in Express Toll Lanes (ETLs) and on the shoulders. Community Transit began using the right-hand shoulder lane on I-405 during the morning commute and under limited circumstances, with the implementation of the toll lanes in October Initial analysis indicates the transit using ETLs and curb lanes on I-405 are experiencing significant time savings when comparing travel times in the corridor between 2014 and WSDOT is working to improve a section of shoulder for transit use on southbound I-5 between Lynnwood Transit Center and Mountlake Terrace Transit Center. Planned for completion in 2017, the improvement is part of the larger strategy by WSDOT and transit agencies to improve reliability of bus service in the I-5 corridor. Gasoline Prices Gasoline prices are often cited as a big driver of transit ridership. This is true, to a degree, but the effect is variable and asymmetric. According to a 2012 article written by the American Public Transit Association (APTA), Public Transportation Protects Americans from Gas Price Volatility, there is a stronger link to increases in transit ridership when gas prices rise than decreases in transit ridership when gas prices fall. The article cites eight separate studies, including one completed by Maley and Weinberger that concludes sustained growth in ridership, even after gas prices fall, could be the result of changes in people s commuting behavior. This pattern is reflected in Community Transits ridership, with the largest demand for service occurring in 2008 when gasoline prices first exceeded $4 per gallon, to today when national gasoline prices average $2.30 per gallon (AAA, March 2017). As gas prices have remained low for the past several years, Community Transit is seeing some impacts. While ridership is growing (2.1 percent in 2016), growth is slower than prerecession levels. Continued focus on improving service level and quality, combined with effective marketing, will help reconnect riders with our service, and re-establish ridership habits. This will be an important strategy as service expands into new areas and the agency s hours of operation are extended. 50 TRANSIT DEVELOPMENT PLAN
55 SERVICE PLAN 9. Service Plan Fixed-Route Bus Service: This Transit Development Plan forecasts capacity to add more than 136,000 hours of bus service over the next six years. Building on a base of 375,000 hours, this represents a 36 percent increase over 2016 and a 55 percent increase over 2015 service levels. This service expansion, funded by the 2015 Proposition 1 measure, will provide significantly enhanced transit throughout Community Transit s service area. Guiding the service plan are future network and integration principles described in Community Transit s Long Range Transit Plan. The plan emphasizes service investment on Transit Emphasis Corridors to provide direct, frequent trips between jobs, commercial activity and housing throughout our service area. The focus is on building a convenient, and reliable transit network that will sustain economic growth and quality of life for decades to come. As described above, service expansion is planned around three themes: 1. Making what we have better: more trips throughout the system to increase capacity and reliability. 2. More Swift lines: building the Swift network with the Swift Green Line starting in 2019 and the Swift Orange Line and Swift Blue Line Extension in development. 3. Going more places more often: new routes in areas we don t currently serve and connecting communities we already serve in new ways. This chapter provides an overview of planned service increases for each year. Greater detail is provided in years while are more conceptual. Specific service proposals will be refined and approved through annual public outreach and input provided to Community Transit staff and its board of directors. Outreach occurred in March 2017 for service expansion to be implemented in September 2017 and March Planned service will also require significant growth in equipment. By 2022, Community Transit s bus fleet will be considerably larger than our pre-recession high-water mark. Table 9-1 provides a forecast of growth in annualized bus service hours and fleet through Service expansion will also require more employees to drive buses, perform maintenance and provide other supporting functions. A discussion and forecast of workforce needs is provided in this chapter. ACTION: 36 percent expansion of bus service by TRANSIT DEVELOPMENT PLAN
56 SERVICE PLAN TABLE 9-1 BUS SERVICE ADDITIONS, BUS FLEET AND OPERATORS Year Annual Bus Service Hours Added Total Hours Operated Total Bus Fleet 2016 Baseline 375, March , , September , , March , , September , , March , , September , , , , , , , , Service Expansion March 2017 (approved, implemented March 12, 2017) Community Transit continued the theme of making what we have better by expanding bus service beginning March 12. More than 40 new trips were added to increase weekday frequencies during the middle of the day and extend some service later at night on weekdays and Saturdays. In addition, Saturday and Sunday schedules on several routes were adjusted to allow for better connections to other bus service. Table 9-2 provides details of the March 2017 service improvements. 52 TRANSIT DEVELOPMENT PLAN
57 SERVICE PLAN TABLE 9-2 MARCH 2017 SERVICE CHANGE (IMPLEMENTED) March 2017 Additional Service Hours: 7,700 Theme: Making what we have better Strategy: More trips on commuter service Route 402 (Lynnwood Seattle) added one southbound trip Route 810 (McCollum Park University District added one northbound trip Strategy: Extended span of service (earlier morning, later evening) Swift Blue Line (Everett Station Aurora Village) added three weekday late-night trips in each direction, extending service until 11 p.m. Route 101 (Mariner P&R Aurora Village) added two weekday late-night trips in each direction, extending service until 11 p.m. Route 113 (Mukilteo Lynnwood) added weekday late-night northbound trip Route 115 (Mariner P&R Aurora Village) added weekday late-night westbound trip Route 201 (Smokey Point Lynnwood) added weekday late-night southbound trip, add Saturday late-night northbound trip Route 202 (Smokey Point Lynnwood) added weekday late-night northbound trip, add Saturday late-night southbound trip Route 222 (Marysville Tulalip) added weekday early-morning eastbound trip, add two Saturday late-night trips Strategy: More mid-day service Route 119 (Ash Way Mountlake Terrace) added five mid-day weekday trips in each direction to provide 30 minute service throughout the day, until 7 p.m. Route 120 (Canyon Park Edmonds Community College) added seven mid-day weekday trips in each direction to provide 30 minute service throughout the day, until 6 p.m. Strategy: Reliability, schedule adjustments Schedules adjusted on Routes 109, 115, 116, 222, 402, 810 September 2017 (Approved) Adding new network connections, increasing frequency of service, extending the span of service hours and improving reliability are priorities for the September 2017 service change. The approved changes include: Extension of service in the future Swift Green Line corridor to prepare for implementation of the new Swift line. 53 TRANSIT DEVELOPMENT PLAN

58 SERVICE PLAN A new route to Boeing/Paine Field to test the market for this connection from the Lynnwood area. Extension of Route 196 in Lynnwood to provide connections to regional transit. Realignment of east County routes in Everett, Lake Stevens, Granite Falls and along Highway 2 to improve ridership and efficiency. More commuter trips to Seattle and the University District. More mid-day trips on Sundays & holidays. TABLE 9-3 SEPTEMBER 2017 SERVICE CHANGE September 2017 Additional Service Hours: 17,227 Theme: Going more places more often Strategy: New routes New Route 107 A new Route 107 will operate between Lynnwood Transit Center and Boeing/Paine Field via Mukilteo Speedway. Route 107 will operate weekdays only, peak hour, peak direction. There will be three morning northbound trips, and three evening southbound trips. The new route will meet growing demand for service to the Paine Field area from the south. 54 TRANSIT DEVELOPMENT PLAN
59 SERVICE PLAN Theme: Making what we have better Strategy: Restructured routes Route 105 Extension Route 105 will be extended north from the Mariner Park & Ride via Airport Road to Paine Field, Boeing, Seaway Blvd. and Hardeson Road. Extended trips will operate both directions weekdays only from 5-8 a.m. and 1:45-6 p.m... The extended route will establish local bus service all along the future Swift Green Line corridor. 55 TRANSIT DEVELOPMENT PLAN

60 SERVICE PLAN Route 115 Realignment The northern terminal for Route 115 will be moved to McCollum Park Park & Ride. The relocated terminal will improve schedule reliability of this route and will provide better access to local bus service in the McCollum Park area. Route 196 Extension Route 196 will be extended north from Alderwood Mall to Ash Way Park & Ride. The extended route will increase bus service between Alderwood Mall and Ash Way Park & Ride. The extension will create more regional connections. 56 TRANSIT DEVELOPMENT PLAN
61 SERVICE PLAN Route 209 Extension Route 209 will be extended north from Quil Ceda Village via I-5 to the Smokey Point Transit Center. The extended route will create singletransfer connections to Quil Ceda from Routes 220, 230 & 240. Route 277 Eliminated/Replaced Route 277 will be eliminated. Hwy 2 service to Boeing will be provided by extended trips on Routes 270 & 271. Hwy 2 service levels to Boeing will remain the same. 57 TRANSIT DEVELOPMENT PLAN

62 SERVICE PLAN Route 280 Realignment Route 280 peak hour trips ending in Lake Stevens will have a shorter turnaround to/from 20th Street. The route will be realigned in Granite Falls off Hwy 92 via Quarry Road, Burn Road and Jordan Road. The route would also serve Granite Falls High School and new development in that area. Strategy: More trips on commuter service Downtown Seattle and University of Washington. Approximately 16 trips will be added to downtown Seattle and the University of Washington. Trips will be split between morning and evening service. Routes and trips are to be determined based on ridership demand. Strategy: More mid-day service Sunday Service. Thirty seven midday trips will be added on Routes 240, 271 and 280 to create 60-minute, all-day service on Sundays. 58 TRANSIT DEVELOPMENT PLAN
63 SERVICE PLAN 2018 Service Expansion March 2018 (Approved) The March 2018 service change includes later evening trips on Sundays and holidays providing a more consistent level of service across the network on these days. TABLE 9-4 MARCH 2018 SERVICE CHANGE March 2018 Additional Service Hours: 1,474 Theme: Making what we have better Strategy: Extended span of service (later evening) Sunday Service. Eleven evening trips will be added to extend Sunday service hours on the Swift Blue Line, & Routes 105, 109, 113, 130, 196 and 202. ACTION: Implement approved September 2017 and March 2018 service changes. September 2018 (conceptual) Making what we have better is the overall theme for the September 2018 expansion. The strategy is improving frequency (departures every 10 minutes) and span of operations for the existing Swift Blue Line service between Everett Station and the Aurora Village Transit Center. The Swift Blue Line is Community Transit s most popular route. Returning the weekday service to 10 minute headways will reduce wait times, provide better connections to other routes, and provide consistency with the Swift Green Line to be implemented in Increased frequencies are also planned for other routes, improving connections and enhancing the network by providing more options to move around the county using transit. More early morning and late evening trips are also planned to continue extending operating span and provide more consistent connections throughout the day. 59 TRANSIT DEVELOPMENT PLAN
64 SERVICE PLAN TABLE 9-5 SEPTEMBER 2018 SERVICE CONCEPTS September 2018 Additional Service Hours: 6,700 Theme: Making what we have better Strategy: Extended span of service (earlier morning, later evening) Local service span Strategy: More trips on local service Swift Blue Line (Everett Aurora Village) return weekday service to 10 minute frequencies, 6:00 a.m. to 7 p.m. Local service frequency 2019 Service Expansion Service expansions for 2019 focus on Swift Green Line service. March 2019 (conceptual) Implementation of the Swift Green Line is one of the cornerstones of the Proposition 1 service expansion plan. Continuing the theme of Going more places more often, The Swift Green Line will provide a new connection between the Boeing/Paine Field manufacturing center and the Canyon Park high-tech job center. The new line crosses the Swift Blue Line at Airport Road and Highway 99, making a Swift network that will provide much of south Snohomish County with convenient access to frequent BRT service. Infrastructure to support the Swift Green Line includes a new transit center terminal at Seaway Blvd. and 75 th St SW, adjacent to the Boeing-Everett site. Seaway Transit Center will provide a connection point between the Swift Green Line, other bus routes and shuttles throughout southwest Everett. Other infrastructure for the project includes new transit lanes on the approaches to the Interstate 5 overcrossing along 128 th St SW and more than 30 BRT stations at 15 intersections along the 12.5 mile route. When complete, the Swift Green Line will provide world-class bus rapid transit to thousands of residents and commuters traveling in Bothell, Mill Creek, Snohomish County and Everett. TABLE 9-6 MARCH 2019 SERVICE CONCEPTS 60 TRANSIT DEVELOPMENT PLAN
65 SERVICE PLAN March 2019 (Conceptual) Additional Service Hours: 42,900 Theme: Going more places more often Strategy: New routes Swift Green Line (Seaway Transit Center Canyon Park P&R) new all day, bi-directional bus rapid transit service connecting the Paine Field Manufacturing and Industrial Center, in Everett, and the Canyon Park Regional Center, in Bothell, via Seaway Blvd., SR-526, Airport Road, 128 th Street and SR-527 (Bothell-Everett Highway). ACTION: Refine service change proposals for September 2018, March 2019, complete public review process and Board adoption, and implement approved proposals. September 2019 (conceptual) With the primary focus in 2019 being Swift Green Line implementation in March, the September 2019 service change will prioritize ongoing refinement and improvement of existing service. This is likely to include additional trips on existing routes and adjustments to schedules for improved reliability. The forecast level of investment is an additional 6,500 hours of service Service Expansion Concepts Service expansion is expected to continue through the final years of this plan. Priorities will continue to include improvement to existing routes, implementation of new routes and continued development of the Swift network. Financial forecasts indicate capacity for an additional 15,000 hours of bus service each year for Specific service initiatives will be developed and described in subsequent annual updates to this plan. Conceptual plans for this period include: Adding trips to existing routes to provide service more often. Investing in commuter trips to increase capacity and improve reliability. Adding more trips and longer operating hours on Sundays to provide more consistent weekend service. Studying options for new routes and new connections. Restructuring service to be more effective and convenient (such as redesigning how existing local routes connect to the new Swift Green Line). 61 TRANSIT DEVELOPMENT PLAN
66 SERVICE PLAN Planning and designing the Swift Orange Line to connect with Sound Transit s Link Light Rail, starting in Planning and designing the Swift Blue Line Extension to connect with Link Light Rail, starting in Implementing other services that will integrate with Link light rail opening in Shoreline, Mountlake Terrace and Lynnwood in ACTION: Develop service expansion proposals for September 2019, 2020, 2021 and DART: Along with bus service growth, this plan anticipates approximately 3 percent annual growth in DART paratransit service hours. This forecast growth is attributed to both the general trends of an aging population and increasing travel demand of all types as well as new routes and increases in bus service hours of operation. TABLE 9-7 DART SERVICE LEVELS DART Service Hours Actual Planned ,000 85,000 87,000 90,000 92,000 95,000 98,000 ACTION: Provide complementary paratransit service to meet demands of expanding fixed-route bus service and aging population. Vanpool: The Vanpool program is expected to grow in terms of total fleet and active vans. There were 432 vans (including spares) in the fleet and 367 active vanpools in In addition to replacing aging vehicles, this TDP adds 30-vanpools to the fleet (five per year) through Vanpool maintenance requirements reserve 30 vehicles as spare/loaner vans. The forecast assumes that all available vans (excluding spares) are assigned to active vanpool groups. 62 TRANSIT DEVELOPMENT PLAN
67 Vanpools SERVICE PLAN Vanpool Program, Active Vanpools Total Fleet (total fleet includes 30 spare vans for maintenance needs) FIGURE 9-1 VANPOOL PROGRAM ACTION: Expand vanpool program by 30 vans. Maximize number of vanpool groups and ridership per van to meet growing demands for service. Swift Network Development Community Transit s Long Range Transit Plan identifies a service network constructed around transit emphasis corridors that provide convenient travel options along arterial streets. Building on the transit emphasis corridors concept, Community Transit began operation of its first line of Swift Bus Rapid Transit along Highway 99 from downtown Everett to Aurora Village Station in The Swift Blue Line was the first bus rapid transit in the Puget Sound region. It traverses a 16.7-mile signalized route through the cities of Everett, Mukilteo, Lynnwood, Mountlake Terrace, Edmonds and Shoreline, as well as Snohomish and King Counties. In 2013, Community Transit identified the second Swift line, which combines portions of two transit emphasis corridors: Airport Road/128 th Street (Paine Field to SR-9) and SR- 526/SR-527 (Everett to Bothell). To date, the agency has completed both a statefunded corridor planning study that confirmed the market and feasibility of the proposed route, as well as the Federal Transit Administrations (FTAs) Project Development phase for a federal Small Starts grant. 63 TRANSIT DEVELOPMENT PLAN
68 SERVICE PLAN The Swift Green line will operate between a new transit center on Seaway Boulevard, in Everett, and the Canyon Park Park & Ride, in Bothell, via Airport Road, 128 th Street/132 nd Street SE and SR-527. Significant capital components of the project include a transit center at the northern terminal adjacent to Boeing, roadway improvements at the 128 th /I-5 interchange and 30 BRT stations. All environmental approvals, partner agreements and final design elements are complete. Right-of-way acquisition has been underway since mid The project entered the construction phase with work beginning on Seaway Transit Center in May Next steps: Complete right-of-way acquisition Order buses Complete federal; Small Starts Grant Agreement Construct capital elements ACTION: Complete the Swift Green Line for service in TRANSIT DEVELOPMENT PLAN
69 SERVICE PLAN FIGURE 9-2 PROPOSED SWIFT GREEN LINE 65 TRANSIT DEVELOPMENT PLAN
70 SERVICE PLAN During the planning horizon for this TDP, Community Transit will also begin planning the third Swift line, the Swift Orange Line. The planned Swift Orange Line runs in the 196 th Street/164 th Street corridors. The Swift Orange Line will be an important part of bus services planned for integration with Sound Transit s Lynnwood Link Extension light rail to open in Lynnwood in Confirmation of route alignment and project feasibility is the subject of a feasibility study underway in ACTION: Complete Feasibility Study for the Swift Orange Line, in the 196th Street/164th Street corridors. When Sound Transit s Lynnwood Link Extension opens for service in 2023, there will be a planned connection between Link and the Swift Blue Line at the N 185 th Street/I-5 Link station. This connection will require extension of the Swift Blue Line south along Highway 99/Aurora Avenue to N 185 th Street and then east along N 185 th Street to Interstate 5. Sound Transit is constructing a Swift platform at its N 185th Street station to facilitate this connection. Before the 2022 end year of this TDP, Community Transit will need to complete a feasibility study to determine Swift Blue Line Extension station locations and any transit priority infrastructure required to provide this extension to Link. ACTION: Complete Swift Blue Line Extension to N 185 th Street Feasibility Study. 66 TRANSIT DEVELOPMENT PLAN

71 SERVICE PLAN FIGURE 9-3 LONG RANGE TRANSIT PLAN: FUTURE NETWORK MAP 67 TRANSIT DEVELOPMENT PLAN
72 SERVICE PLAN Service Performance Community Transit s service expansion plan for is based on objectives reflecting significant public-facing planning efforts including the Long Range Transit Plan, annual Transit Development Plan updates, market surveys, and a Transit Values Exercise outreach program. These efforts involved stakeholders such as transit system users, the general public, community groups, partner agencies, and business and elected leaders. Themes common throughout these plans and conversations are: Service every day, including Sundays and holidays. An efficient and productive system, providing high value for every dollar spent. Complete network, providing connections throughout the PTBA. The first theme was addressed in June 2015 when Community Transit restored Sunday and holiday bus and DART services. The community has embraced the new 365 day operation with more people riding per hour of Sunday and holiday service in 2016 than prior to service cuts in Most recently, these themes were incorporated into the successful 2015 Proposition 1 ballot measure as a foundation for service expansion. Specific objectives for Proposition 1 include: Increased service on existing routes. More Swift service. New routes connecting more destinations. Figure 9-4 shows how each of these values and priorities has been addressed by recent service growth and by planned expansion for described in this TDP. 68 TRANSIT DEVELOPMENT PLAN
73 SERVICE PLAN 60,000 50,000 40,000 30,000 20,000 10,000 0 Recovery Bus Service Hour Adds Proposition 1 Expansion 49,400 37,000 37,000 30,500 9,000 15,000 11,800 15,000 15,000 15, Transit Values Frequency, Span, Reliability Sunday & Holiday New Markets Productivity / Efficiency FIGURE 9-4 SERVICE GROWTH AND TRANSIT VALUES Note that the three most significant phases of service growth, in 2015, 2016/2017 and 2017/2019, connect to an overarching value-driven strategy for system development: 2015: Sunday & Holiday service 2016/2017: New Markets (new routes) 2017/2019: Productivity/Efficiency (Swift and commuter service) As the service expansion plan is implemented, bus service ridership and productivity will change according to the characteristics of new service. The overall plan is designed to significantly increase ridership while maintaining an efficient, productive system. As service grows, there will be years where productivity (riders per hour of service) is reduced while ridership matures on new routes. Some services (like new routes in rural areas) will take longer to mature and will have lower overall productivity than other routes in more urban markets. In general, it is expected that new routes may take up to three years to reach their expected ridership potential. Table 9-8 illustrates recent trends in ridership and service levels, highlighting a significant increase in productivity (boardings per hour of service) between 2009 and 2015 (due in large part to elimination of lower productivity service during the economic downturn). Looking forward, productivity is expected to moderate with the 2016/ TRANSIT DEVELOPMENT PLAN
74 SERVICE PLAN service expansion, where the goal is network coverage and new connections. Productivity will grow again following the 2018/2019 service changes as higher ridership Swift and commuter services are added in more urban areas. TABLE 9-8 SERVICE LEVEL & PRODUCTIVITY Service Proposals Service Level/Performance (bus only) Pre- Recession Recession, Service Cuts Recovery, Sunday Service Expansion, New Markets Expansion, Swift II & Commuter Revenue Hours 414, , , , ,000 Ridership 9.7 M 7.9 M 8.9 M 9.9 M-10.7 M 11.1 M 12 M Productivity (boardings per hour) Regional Connections Community Transit s network includes important connections with several partner agencies at a variety of regional transit centers and terminals. These connections include: Sound Transit: ST Express bus at Everett Station, Ash Way Park & Ride, Lynnwood Transit Center, Mountlake Terrace Transit Center, Canyon Park Park & Ride and UW Bothell/Cascadia CC. Sounder Commuter rail at Everett Station, Mukilteo Station and Edmonds Station. Everett Transit: Everett Station, Mariner Park & Ride, North Broadway and the Swift corridor. King County Metro: Aurora Village Transit Center, Mountlake Terrace Transit Center, UW Bothell/Cascadia CC, the University District and downtown Seattle. Washington State Ferries: Mukilteo and Edmonds ferry terminals. Skagit Transit: Everett Station Island Transit: Stanwood, Everett Station 70 TRANSIT DEVELOPMENT PLAN
75 SERVICE PLAN Through regular, ongoing coordination and integration with partner agencies, Community Transit works to maintain and improve inter-system connections to provide a convenient regional transit experience for the riding public. Future Planning Community Transit is also engaged with partner agencies and jurisdictions in planning for future improvements to the regional transit system, new stations, terminals and modes and their integration with our network. Examples of this planning include: Coordination with Sound Transit, Lynnwood, Mountlake Terrace and Shoreline around extension of Link light rail to Lynnwood in 2023 and eventually Everett. Participation in WSDOT s planning of new multi-modal Washington State Ferry terminals in Mukilteo and Edmonds. Coordinate transit integration with WSDOT s design of the Legislative Evaluation & Accountability Committee (LEAP) Transportation projects. Cooperation with the City of Shoreline in their Transit Service Integration Plan (TSIP) that will identify policies addressing future transit needs throughout Shoreline once light rail service begins (2023). The TSIP is a coordinated plan in which Shoreline is working with Community Transit, King County Metro Transit and Sound Transit. Working with Bothell, King County Metro, Sound Transit and UW Bothell/Cascadia College on master plans for transit service and the UWB/CCC campus. Coordination with Sound Transit, City of Seattle, WSDOT and King County Metro in Downtown Seattle Transit Coordination (DSTC). This group successfully coordinated on planning and delivery of projects with a common goal of maintaining or improving mobility in downtown Seattle during the next decade while major projects such as the Highway 99 tunnel, waterfront seawall, ST-2 Link extension and street car lines are constructed. Participation in the Seattle City Center Mobility Plan. This plan will further the efforts of the Downtown Seattle Transit Coordination by considering longer range investments and policies that will be completed by the City of Seattle, in partnership with King County Metro, Sound Transit, the Downtown Seattle Association, Community Transit, WSDOT and others. This effort will also include more in-depth technical analysis of approaches to improve transportation, land use and community development near downtown Seattle. Ongoing participation in the Next Generation ORCA Regional Fare Coordination System project as the region plans for the upgrade and evolution of electronic fare collection. 71 TRANSIT DEVELOPMENT PLAN
76 SERVICE PLAN Coordination with PSRC on Transportation Policy Board, Transit Operators Committee, Regional Project Evaluation Committee, Regional Staff Committee, Regional Traffic Operations Committee, Transportation 2040 update and Bicycle Pedestrian Advisory Committee. ACTION: Continue working with partner transit agencies and local jurisdictions to improve connections between transit systems and plan for integration with new modes such as light rail. 72 TRANSIT DEVELOPMENT PLAN
77 Employee Count SERVICE PLAN Supporting Service Expansion As Community Transit increases service, the agency staffing will need to grow to support more trips on the road. The greatest need will be hiring additional coach operators. We will also need more mechanics to maintain a larger fleet and other support staff to support longer hours of operation and more facilities. Community Transit s 2016 employment was 627 full and part-time employees. Most are staff who operate or directly support service in Transportation and Maintenance. Remaining staff support operations through Customer Experience, Information Technology, Planning & Development, External Affairs, Administration and the Executive Department. Over the next six years, the agency will need to increase the coach operator ranks by more than 100 to operate higher service levels. With mechanics and all other supporting functions, overall employment will increase to more than 800 by Potential Staffing Increase Baseline Growth FIGURE 9-5 POTENTIAL STAFFING INCREASE Employment Experience Community Transit is a company that creates an employment experience where employees feel valued and are inspired to contribute as part of a world-class team. Many employees have made a career of working here, with tenures spanning 15, 20 and even 25 or more years. The company has a reputation for attracting and retaining high-quality people. Community Transit s services are innovative, effective and seen as leading examples by the industry. Competitive wages, excellent benefits, opportunity 73 TRANSIT DEVELOPMENT PLAN

78 SERVICE PLAN for advancement, and a culture that values the individual, all contribute to the depth of our workforce. Recruiting for Service Expansion Increasing staff to support new service is an agency-wide effort. Service Planners and Schedulers coordinate with Transportation operations staff to forecast how many coach operators will be needed to deploy new trips. Human Resources, Training and Transportation collaborate to determine the scope and schedule for recruitment and training. Marketing plays a key role in creating materials and media to spread the word about new employment opportunities. Finance ensures that resources and budgets are in place to support the expanded operation. The recruitment effort is underway, with online, electronic and print media describing new career opportunities at Community Transit. It takes, on average, five months for a new coach operator to complete the hiring and training process, from the time an application is accepted. Allowing adequate time for this process, along with planning for more vehicles, new bus stops and the other requirements that go with more bus trips are important considerations when planning the scope and pace of service expansion. ACTION: Recruit staff to operate and support service expansion 74 TRANSIT DEVELOPMENT PLAN
79 SERVICE PLAN Annexing New Areas to the PTBA As illustrated in the map below, there are areas within Snohomish County, outside the City of Everett, that are not part of Community Transit s PTBA, such as Cathcart, Maltby, Clearview and Lake Goodwin. Annexation is generally required before Community Transit will provide transit service outside the PTBA because it is the mechanism for the agency to collect sales tax revenue that supports such service. There are three ways that an area can annex into Community Transit s PTBA: Community Transit s Board of Directors can call for an election, the Board can consider valid petitions for annexation presented by four percent of the area s eligible voters, or a jurisdiction that is already within the PTBA approves an annexation of land that is not currently within our boundary, thereby expanding the PTBA. FIGURE 9-6 PUBLIC TRANSPORTATION BENEFIT AREA In 2008, Community Transit s Board, using the election method, initiated a ballot measure for the voters within the Cathcart, Clearview and Maltby areas to consider annexing into Community Transit s PTBA. After the ballot measure failed, the Board recommended that future consideration of annexations be only when a valid petition is 75 TRANSIT DEVELOPMENT PLAN
80 SERVICE PLAN presented, instead of pursuing an annexation through a Community Transit-initiated process. A primary consideration in whether or not to annex a new area to the PTBA is potential revenues that would be generated from the area versus potential costs of services and facilities for the area. This is critical to determine if the area could be reasonably served without reducing service in other areas of the PTBA. SR-9 has been identified in regional and state transportation plans as a highway of statewide significance. This important transportation link is also identified as a transit emphasis corridor with long-term transit market potential in Community Transit s longrange planning. Future annexation of the SR-9 corridor into the PTBA and growth of transit service on this highway may be desirable as markets continue to develop. In anticipation of future transit service, Community Transit participated with local jurisdictions, Snohomish County and WSDOT in defining a Route Development Plan for SR-9 in Snohomish County in Since 2009, we have been active in the SR-9 Coalition, a group of agencies and officials who advocate for funding and implementation of projects identified in the Route Development Plan. ACTION: Continue to monitor economic development, travel demand and transit service potential in areas eligible for annexation to the PTBA. 76 TRANSIT DEVELOPMENT PLAN
81 CAPITAL PLAN 10. Capital Plan Supporting the 38 percent increase in transit service forecast by 2022 requires an ambitious capital program encompassing fleet, facilities and technology. Fleet plans call for both major replacements and expansion to maintain quality and meet higher service levels. Park & ride and transit center construction will improve opportunities for system access and integration of services. New BRT stations and roadway improvements will be built as part of the Swift Green Line project. Master planning for operating facilities will identify improvements needed to accommodate service growth. Technology projects will replace aging legacy systems as well as provide new capabilities to enhance customer information, fare payment and operational effectiveness. Fleet Replacement Bus: Regular fleet replacement is a high priority for Community Transit in terms of providing the best possible service as well as a cost-effective vehicle maintenance program. While FTA guidelines provide for fixed-route bus replacement after 12 years or 500,000 miles, Community Transit extends bus life significantly beyond this target due to the work of our award-winning mechanics as well as via mid-life engine rebuilds. The average age of fixed-route buses to be replaced under this plan ( ) is 16 years, a target established during the recent recession to conserve capital funding. The vehicle replacement reserve strategy in this plan returns the agency to bus replacements at 15 years, our pre-recession target, by the year Specific bus orders planned to replace older vehicles include foot buses, foot buses and 6 Double Tall buses (replacing 60-foot buses). Vanpool: Replacements include 54 to 57 vans per year for a total of 334 vehicles, DART: Fleet replacement will total 52 DART buses over the plan period. Fleet Expansion Bus: Planned service expansion will require significant growth in the bus fleet. By 2022, Community Transit s fleet will grow by 47 buses over 2016 levels. A portion of this growth reflects vehicle purchases initiated in 2016 that will enter service in New purchases to be initiated during the period include 26 expansion buses. These include three 40-foot buses, 15 Swift BRT buses and eight Double Tall buses. New buses require a significant specification process and build times can be long. 77 TRANSIT DEVELOPMENT PLAN
82 Vehilces in Fleet CAPITAL PLAN Community Transit typically plans for a 12 to 24 month development cycle from vehicle order to delivery. Given the priority on delivering service expansion quickly and the time required to acquire new buses, Community Transit s contingency fleet will play an important role in supporting new service growth. Contingency fleet buses will provide a portion of the extra vehicles to support service expansion in 2017 and As new buses arrive in late 2017 and 2018, contingency buses will be phased out of active operation. Vanpool: Community Transit is also planning for continued growth of the Vanpool program. An expansion of five vans per year, is planned for DART: The agency will study future DART fleet needs as bus service expands. New bus routes will expand the footprint of Community Transit s network and the corresponding DART service area. Study will determine what level of fleet expansion is required to support future DART service demand. Figure 10-1 and Table 10-1 provide a summary of overall fleet growth by mode and a detailed breakdown of vehicle replacement and expansion by type and year Revenue Vehicle Fleet Forecast Bus DART Vanpool FIGURE 10-1 REVENUE VEHICLE FLEET FORECAST 78 TRANSIT DEVELOPMENT PLAN
83 CAPITAL PLAN TABLE 10-1 FLEET REPLACEMENT & EXPANSION (YEAR OF VEHICLE ORDER FROM MANUFACTURER) YEAR BUS FLEET REPLACEMENT 40 Foot Bus Foot Bus Double Tall Bus (replace 60 ) 6 BUS FLEET EXPANSION 40 Foot Bus 3 60 Foot Bus Double Tall Bus 2 6 Swift BRT 15 VANPOOL REPLACEMENT Vanpool Van VANPOOL EXPANSION Vanpool Van DART REPLACEMENT DART Bus ACTION: Maintain regular replacement of Fixed-Route, DART and Vanpool fleet. ACTION: Expand fleet, adding 26 Fixed Route buses and 30 Vanpools. ACTION: Study market and operations to inform DART fleet growth. New Capital Facilities Seaway Transit Center The future Seaway Transit Center will be located on a three acre parcel at the intersection of Seaway Boulevard and 75 th Street SW cross from the Boeing factory in southwest Everett. Seaway Transit Center will be the northern terminus for the new Swift Green Line connecting Boeing/Paine Field with Canyon Park in Bothell. Buses will access the transit center via Seaway Boulevard and enter and exit via 75 th Street SW. The facility is being designed to accommodate up to 13 bus zones, including Swift Green Line, other Community Transit routes, Everett Transit, King County Metro and private employer shuttles. The facility will include passenger shelters, walkways, landscaping, driver restrooms, accommodation for supervision and security and will take advantage of low impact development practices. 79 TRANSIT DEVELOPMENT PLAN
84 CAPITAL PLAN Seaway Transit Center has been funded through a State Regional Mobility grant, federal Small Starts grant and local match. Design was completed in 2016 and construction started in May I-5 Approach Widening on 128 th Street for Swift Green Line The Swift Green Line will cross Interstate-5 at 128 th Street. This is an already congested interchange that adds significant delay to east-west bus trips crossing I-5. Approaches to the interchange require modifications to maintain speed and reliability for the Swift service. The proposed 128 th Street and I-5 approach widening project includes: Add an eastbound queue jump at 128 th Street/I-5 southbound ramps. This includes adding an additional eastbound right-turn lane from just east of 4 th Avenue W, extending to the southbound I-5 on-ramp. Swift buses will proceed eastbound from the in-lane stop west of 4 th Avenue W, continuing in the same lane which becomes the 2 nd lane from the curb as the new right turn lane begins. Dual right-turns are maintained at the I-5 ramp so the transit queue jump is shared with right turns. Add an additional westbound lane from 3 rd Avenue SE to the east bridge abutment. General purpose traffic can use this lane to make right-turns, but otherwise it is a transit-only lane. Add a westbound queue jump at the 128 th Street/I-5 northbound ramps. Add bus refuge areas after the 128 th Street and I-5 ramp intersections in both directions. Optimize signal timing offset and phase order. The approach widening project is a component of the overall Swift Green Line program. Snohomish County and the Washington State Department of Transportation are partners in the project, providing design input, and following construction, ongoing maintenance. The project will be finance with a FTA Small Starts grant and local match funds. Final design was complete in Construction will begin in 2017 and the improvement will be ready for Swift Green Line service startup in Swift Green Line Corridor Stations In addition to the future terminus at Seaway Transit Center, the Swift Green Line project includes construction of 31 BRT stations at 16 intersections in the corridor and a station at Canyon Park Park & Ride. Station design will be consistent with the first Swift line on Highway-99. Amenities include the uniquely branded Swift shelter design, benches, wind screens, 10 inch raised curbs for near-level boarding, ORCA fare card readers, ticket vending machines, maps and customer service information and electronic real- 80 TRANSIT DEVELOPMENT PLAN
85 CAPITAL PLAN time passenger information signs. Concrete improvements to the adjacent road lane will provide a durable platform for Swift buses stopping at the stations. From north to south, stations will be constructed at the following intersections: Airport Road & Kasch Park Road Airport Road & 100th Street SW Airport Rd & 112th Street SW Airport Road & Highway 99 Airport Road & Gibson Road 128th Street SW & 4th Avenue W 128th Street SE & 3rd Avenue 132nd Street SE & Dumas Road 132nd Street SE & 16th Avenue SR-527 & Trillium Road SR-527 & 153rd Street SE SR-527 & 164th Street SE SR-527 & 180 th Street SE SR-527 & 196 th Street SE SR-527 & 208th Street SE Bothell Everett Highway (SR-527) & 220th Street SE Canyon Park Park & Ride Station design and locations have been selected to prioritize customer safety, comfort and efficient transit and traffic operations. Station construction will be financed with an FTA Small Starts grant and local match funds. Final design was completed in Right-of-way acquisition will conclude and construction will begin in Stations will be complete for Swift Green Line service startup in Capital Facilities Preservation Community Transit operates and maintains transit facilities consisting of administrative offices, two operating bases, the Mountlake Terrace Transit Center Garage, 34 Swift Bus Rapid Transit stations, 24 park & rides, numerous park & pool lots and 1,584 bus stops. Many of our facilities are nearing their life expectancy. The Capital Development Division regularly updates an assessment of building conditions to evaluate and prioritize capital needs for Community Transit. Community Transit s Capital program will continue to address preservation and rehabilitation in the next six years, which is in line with the federal transportation plan, Fixing America s Surface Transportation (FAST) Act. In 2011 a dedicated fund was 81 TRANSIT DEVELOPMENT PLAN
86 CAPITAL PLAN created to defray these annual preservation and rehabilitation needs. This TDP continues to invest in this fund as part of ensuring regular maintenance and preservation of capital facilities. Preservation projects completed in 2016 included the Merrill Creek Operating Base trench and yard repairs, roof replacement of the Merrill Creek Administration building, Kasch Park Building C HVAC replacement, and efficient lighting updates for both operating bases. ACTION: Continue to fund capital facility preservation projects. 82 TRANSIT DEVELOPMENT PLAN
87 CAPITAL PLAN Future Operating Base Capacity By 2019, Community Transit will return to pre-recession service levels and fleet size. Service and fleet expansion beyond 2019 will begin to stretch the capacity of maintenance bays, bus parking and operational support space. Additionally, the Merrill Creek operating base does not currently support operation of Double Tall buses. Retrofitting the base to fully accommodate Double Talls would increase operational flexibility and open this bus platform to more routes and customers. During the next two years, the agency will study operating base capacity, identify deficiencies, scope base expansion needs and/or retrofits, and build the financial capacity to design, engineer and construct identified projects. As described in the Financial section of this TDP, Community Transit plans to reserve $50 million to fund this operating base expansion by ACTION: Study operating base capacity and complete project and funding plans for future base expansion and retrofits. Intelligent Transportation Systems (ITS) Technology infrastructure (network and servers) modernization and applications development is underway as the agency readies itself for the deployment of critical Intelligent Transportation Systems such as the Transit Technologies Suite (see below). These systems are new to the agency in that they operate on a 24x7 basis, require high availability, and are customer facing. Finishing the required infrastructure to run Transit Technologies will be a challenge with constrained funding for the upcoming years and ongoing capital improvement and maintenance will be required. Fare Collections Program The Fare Collection Program provides customers with convenient, reliable, and secure technologies to pay fares. This program proactively supports Community Transit s future growth plans by ensuring that fare collection technologies are available and adaptable to meet agency needs, and the needs of specific customer markets. A primary goal of this program is to reduce or eliminate onboard cash payment by increasing adoption of electronic fare payment by customers. These projects will be focused on empowering the customer, maximizing our technology investments through an open architecture and protecting our customers and the agency utilizing secure payment methods. 83 TRANSIT DEVELOPMENT PLAN
88 CAPITAL PLAN ngorca (Next Generation Fare Collections System) The next generation of fare collections addresses many of our current customer complaints such as the effort involved in reloading a card and lack of mobile payment. This regional project is the large, complex replacement of our current Fare Collections System. The new system will be an account-based system instead of a card-based system. Customers will be able to pay with a variety of media Add Value Locations FIGURE 10-2 NGORCA CONCEPT ngorca Central System Payment Equipment Customer Apps and Mobile Payment such as their mobile phone, smart wearables, or a card such as using mobile payment or mobile ticketing. The project will be designed to meet higher customer expectations and be easier to maintain. The project will be designed with open architecture (not tied to a single vendor) to allow agencies to upgrade or replace system components independently using the existing core system. The ngorca project schedule calls for finalizing requirements in 2017, procurement in 2018 and implementation beginning in The target for full implementation is Community Transit s financial share of the regional project is forecast to be $9.2 million. ACTION: Complete design and implementation planning to refine Next Generation ORCA project costs and identify needed operational changes. Swift Ticket Vending Machines Two projects are underway related to Swift Ticket Vending Machines (TVMs). The TVM s along the Swift Blue Line have created confusion for customers due to the complexity of the interface and the inability to buy multiple tickets in one purchase. The TVM Door Replacement project is designed to improve the customer experience and extend the useful life of the TVMs currently deployed on the Swift Blue Line corridor. The project will replace the existing screen with a 84 TRANSIT DEVELOPMENT PLAN
89 CAPITAL PLAN larger, colorful screen that uses a more intuitive screen flow. The new screens allow customers to buy multiple tickets at one time, along with solving other current customer issues. The project also includes a software upgrade that will minimize operational processes by allowing IT operations staff to push changes out from a central location. Upgrades will also include improvements for our ADA customers. The project is scheduled for completion in As a piece of the overall Swift Green Line project, Community Transit is also procuring compatible TVM equipment for each of the new Swift station locations. The procurement is expected to be complete in ACTION: Complete Swift TVM upgrade & procurement. Mobile Ticketing Study The goal of this study is to gain insights on customer needs, evaluate technology options and costs. At the end of the study there will be a recommendation for a mobile ticketing pilot or full implementation on the Swift routes. This would provide Swift customers with the ability to purchase a mobile ticket instead of a paper ticket which will increase customer satisfaction. ACTION: Complete mobile ticketing study. TSP (Transit Signal Priority) Program The TSP Program supports the agency s Transit Signal Priority projects. Transit signal priority (TSP) is an operational strategy that uses technology to facilitate the faster movement of transit vehicles through a signal controlled intersection by giving transit vehicles a little more green time or little less red time to reduce transit delay. TSP equipment is also used to facilitate transit queue jumps. TSP advances ITS strategic priorities by maximizing technology investments and improving the efficiency of existing and future routes, increasing productivity, and improving the service quality to the community. Implementing TSP advances Community Transit s vision for fast, frequent and reliable service that is affordable and cost effective. McCain to Opticom Transition Community Transit s first generation TSP and Transit Queue-Jump equipment has reached end-of-life and is obsolete. The agency is working with local jurisdictions to decommission the older McCain equipment and license and install newer Opticom equipment. The new equipment includes improved reporting that will be used to measure the performance and effectiveness of the TSP Program. Full transition to the Opticom system will be complete in TRANSIT DEVELOPMENT PLAN
90 CAPITAL PLAN ACTION: Complete McCain to Opticom TSP & Queue-Jump equipment transition. Transit Information Program The Transit Information Program provides strategic planning, procurement, and implementation of technologies improving operations, data collection and real time passenger information. The overall objective of the Transit Information Program is to provide high quality service information to Community Transit customers, operational staff, and third party developers. The Transit Information Program and its associated projects ladder up to our ITS strategic priorities such as but not limited to "empowering customers" and "innovation". The future state of this program focuses on providing richer information with higher quality by investing in technology, tools, and processes that will standardize data, monitor quality, and efficiently provide information to users. GTFS & GTFS-RT/Open Data Community Transit Customers want high quality real-time information at their fingertips. Customers express some frustration with the quality of data we provide through our website and busfinder now. Along with that, customers would like to be able to use other tools such as google or OneBusAway to retrieve that information. The goal of this project is to provide high quality passenger information to Community Transit customers and developers by following widely adopted standards (not proprietary to a vendor or region) that will feed our schedule and real-time data to multiple passenger information applications. This project is the fundamental underpinning of all other projects. Phase 2 of this project will continue to improve data and add additional data fields such as fares. It is anticipated that GTFS and GTFS-RT data will be available in ACTION: Become a provider of GTFS real-time data to software application developers and the community at large. Passenger Information Control System This project follows on the heels of GTFS & GTFS-RT by enabling Community Transit to quickly and easily monitor, measure, and control real-time information, including service alerts, vehicle locations, arrival/departure predictions, and provide high-quality open data interfaces to multiple customer-facing tools. In addition to the central system, the Passenger Information Control System also includes two major customer-facing components. Passenger Information Display 86 TRANSIT DEVELOPMENT PLAN

91 CAPITAL PLAN Software will ensure consistency of transit information as well as improving access to information while at bus stops. Service Alerts Software will improve the accuracy, delivery and availability of transit service alerts. ACTION: Implement Passenger Information Control System Real-Time Passenger Information for web and mobile With the adoption of uber and other real-time services, customers have come to expect that they can see the bus on a map in real-time. This project will improve our customers experience by incorporating real-time passenger information into Community Transit s website, including redesigning our current real-time customer application (BusFinder) and providing vehicle locations on a map through mobile applications. ACTION: Implement Real-Time Passenger Information for web & mobile Wireless Communications Program The Wireless Communications Program provides strategic planning, procurement, and implementation of innovative technology to replace and improve communications onboard our coaches and for staff in the field and operations centers. The Wireless Communications Program aligns with ITS strategic priorities, including innovation and maximizing technology investments by providing more reliable, higher-quality communications and richer, more efficient tools for staff to deliver service. On-Board Architecture Phase 1 (Data Communications) This project focuses on extending the wireless machine- 2-machine network onto every coach by installing a Mobile Access Router (MAR) equipped with a cellular card. This will build a foundation for future plug and play technologies onboard the vehicles and provide a way of more FIGURE 10-3 WIRELESS COMMUNICATION COMPONENTS 87 TRANSIT DEVELOPMENT PLAN
92 CAPITAL PLAN frequently updating vehicle position and providing more accurate information to customers in the future. Voice Communications (VoIP) This project focuses on replacing the existing end-of-life Land Mobile Radio (LMR) system with a Voice over Internet Protocol (VoIP) system. The VoIP solution is an application that communicates via the Mobile Access Router and cellular data service. This system will save operational costs and will also reduce the equipment footprint on the vehicles. Field & Portable Devices (Supervisor Laptops) This project will equip supervisor vehicles with Mobile Access Routes and laptops with limited dispatching capabilities suitable for a mobile environment. This will allow field staff to have an in-office experience to better and more efficiently perform their daily operations. Mini Fleet Trial This project is a pilot for On-Board Architecture Phase 2. This project puts new technology components on ten in-service vehicles in multiple combinations to evaluate how the technology components and the central system will perform. This will ensure that service will not be affected during the implementation of On- Board Architecture Phase 2, as vehicle equipment is upgraded across the whole fleet. On-Board Architecture Phase 2 (Equipment Upgrade) After a successful completion of the Mini Fleet Trial and the selection of a VoIP vendor, this phase will focus on upgrading onboard equipment such as displays, voice hardware, etc. Much of the existing onboard hardware is near end of life and the goal is to upgrade to latest generation hardware in order to take advantage of more processing power, faster data processing, and more accurate customer facing information. The full set of Wireless Communications Program projects are funded with a $13 million budget in the TDP financial plan. ACTION: Complete design, engineering and operational changes to implement cellular voice and data communications system. 88 TRANSIT DEVELOPMENT PLAN
93 CAPITAL PLAN Research & Development Evolution of equipment and technology will drive several research initiatives over the period of this Transit Development Plan. Electric Vehicles Vehicle propulsion is a rapidly evolving area of bus technology. Propulsion choices are important to the agency; buses represent Community Transit s largest capital expense. The agency s current bus inventory is primarily a conventional diesel fleet using ultralow sulfur diesel fuel. Recent additions to the fleet have also included hybrid-electric diesel buses. Experience with hybrid-electric vehicles and associated maintenance costs are driving a re-evaluation of future bus purchase decisions and a new consideration of fully electric propulsion. Study of electric propulsion will be a focus of vehicle research during this plan. ACTION: Complete electric vehicle study. Managed Parking Demand for parking at crowded park & rides presents an ongoing challenge for autobased transit access in our service area. Demand management strategies, dynamic customer information on capacity and other tools may be considered to help mitigate these issues. Regional pilot projects are underway to test initial options. Community Transit will monitor these efforts and may study the issue, including related technology elements during the horizon of this plan. ACTION: Continue to monitor regional parking management. 89 TRANSIT DEVELOPMENT PLAN
94 90 TRANSIT DEVELOPMENT PLAN CAPITAL PLAN
95 FINANCIAL PLAN 11. Financial Plan This Transit Development Plan continues with key financial policies that guided Community Transit through the economic recovery and have made the agency a model for fiscal responsibility and business management. Evidence of this success is seen with the public support and trust expressed in voter approval of Proposition 1 in November With Proposition 1, renewed federal support for transit in the Fixing America s Surface Transportation (FAST) Act and state funding from the Connecting Washington transportation package, we now have resources to build a lasting legacy for transit in Snohomish County. The overall financial goal of this TDP is to manage these resources to provide maximum public benefit and long-term sustainability. Key fiscal strategies in the plan include: Effective control of agency cost growth. Scheduled fare increases for bus, DART and vanpool. Priority on service effectiveness to reduce operating cost per rider. Align revenue forecasts with realistic expectations and regional peers. A new bond issue to complete funding of bus fleet expansion. Reserves at recommended levels for operations, vehicle replacement and facility preservation. Planning for long term financial health and the ability to withstand and rebound from adverse financial circumstances. Controlling Cost Growth The forecast capacity to add more than 136,000 hours of new bus service is dependent on our ability to control average annual agency cost growth to 3.3 percent per unit of service. Effective management of cost growth allowed Community Transit to rebound successfully after the recession. While Proposition 1 provides substantial capacity for expansion, the agency remains focused on efficiency and stewardship of resources to ensure that the focus is on maximizing the level of service that will be sustainable over the long-term. The chart below provides a forecast of hourly bus service cost and how the growth of that cost must be controlled. This financial plan limits annual service unit cost growth to 3.3 percent. The cost includes all direct and indirect bus service expense, including coach operators, fuel, maintenance, supervision, security, training, facilities, technology, customer service, planning and administration. 91 TRANSIT DEVELOPMENT PLAN
96 FINANCIAL PLAN $350 Fully-Allocated Cost: One Hour of Bus Service Average of directly operated & contracted bus revenue service, operating expense only. $300 $250 $239 $247 $255 $263 $272 $281 $290 $200 $150 $100 $50 $ actual forecast FIGURE 11-1 HOURLY COST OF BUS SERVICE 92 TRANSIT DEVELOPMENT PLAN
97 FINANCIAL PLAN Cost per Rider In 2010, Community Transit began to monitor the cost per rider or net cost (after fare payment) per passenger trip on all of our services. Cost per rider is a fundamental measurement of fiscal responsibility and system efficiency. The agency identified three strategies and several associated measures to be emphasized and tracked in making progress on cost per rider. These strategies are: 1. Reduce Expenses Every Community Transit employee has a role to play in controlling the cost of service. For some, this will entail efficiency and cost savings in the direct operation of our services through strategies such as improved health and attendance. For others, it may involve negotiation of lower rates for goods and services. Still others may find new efficiencies in administrative processes. Everyone can contribute to controlling cost growth. Measures: Cost per Service Hour Cost per Platform Hour Ratio of time buses are in-service, carrying passengers to the time they are out of service between trips. 2. Increase Service Productivity and Ridership A key element of reducing cost per rider is ensuring that services are productive, carrying as many riders as possible. Most new services will be directed to markets with a demonstrated potential to reduce cost per rider. Where agency mission requires service coverage in lower productivity areas (such as rural towns and Sunday service), these services will be scaled appropriately to demand. Measure: Passenger Boardings per Service Hour 3. Increase Fare Revenue Cost per rider is the expense per trip not covered by fares. An increase in fare revenue for the same service expense will reduce cost per rider. Growth in ridership productivity, fare increases and reduced fare evasion will all increase fare revenue and reduce cost per rider. Measures: Fare Revenue Per Quarter Fare Revenue per Service Hour Average Fare Per Boarding Farebox Cost Recovery 93 TRANSIT DEVELOPMENT PLAN
98 FINANCIAL PLAN Cost per rider measures for the past three years are provided below. Overall, the agency has been successful in controlling cost growth while maintaining market share and increasing fare revenue. Cost Per Rider, Agency (Net cost per passenger trip, after fare payment) $6.57 $7.06 $7.36 Cost Per Bus Rider (Net cost per passenger trip, after fare payment) $7.02 $7.26 $ Cost Per Vanpool Rider (Net cost per passenger trip, after fare payment) $1.63 $1.18 $ Cost Per Dart Rider (Net cost per passenger trip, after fare payment) $37.55 $37.07 $ FIGURE 11-2 COST PER RIDER ACTION: Continue efforts to reduce Cost per Rider by controlling cost growth, increasing ridership and increasing fare revenue. 94 TRANSIT DEVELOPMENT PLAN
99 Millions FINANCIAL PLAN Operating Expense Forecast Overall operating expense for the baseline service level is forecast to grow from $137 million in 2017 to $159 million in This operating expense includes bus service, DART and vanpool. Growth of baseline operating expense is limited to a four percent annual increase, reflecting increases in labor, benefits, fuel, supplies and services required to support transit operations. New service, added to baseline operating expense, in each year of the plan, is projected to grow in cost from $7.1 million in 2018 to $36 million in The chart below provides a summary of forecast operating expense through Total cost of operations, baseline and new service, is forecast to grow from $137 million in 2017 to $196 million in $250.0 Total Operating Expense: Baseline + New $200.0 $150.0 $100.0 $50.0 $196.0 $184.9 $174.4 $162.8 $36.7 $30.5 $147.6 $24.6 $137.3 $17.6 $7.1 $137.3 $140.6 $145.2 $149.8 $154.5 $159.3 New Service Expense "Baseline Operating Expense" $ FIGURE 11-3 OPERATING EXPENSE, BASELINE + NEW Sources of Revenue Community Transit is a locally-funded agency. Retail sales tax collected in the Public Transportation Benefit Area (PTBA) is our primary revenue source. PTBA residents recently approved an increase to a new maximum taxation rate of 1.2 percent, or 12 cents on a $10 purchase. Through a partnership agreement, Everett Transit also contributes sales tax funding (½ of one tenth of one percent or ½ cent on a $10 purchase) toward operation of Swift service in Everett. In 2017 retail sales tax accounts for about 73 percent of the agency s operating revenue. Rider fares provide about 13 percent of total operating revenue and cover about 20 percent of the cost to operate Community Transit branded service (excluding Sound Transit routes). Pass-through 95 TRANSIT DEVELOPMENT PLAN


100 FINANCIAL PLAN funding for Sound Transit ST Express bus service represents about 10 percent of operating revenue. State and local grant funding represent less than two percent and federal operating subsidies are at about one percent. Advertising and miscellaneous revenues comprise less than one percent of the total. Operating Revenue Forecast, 2017 Investment income, $0.6 million State & Local, $2.8 million Other misc. revenues (expenses), $0.4 million Federal, $2.2 million Fares, $23.0 million Sound Transit contract, $18.3 million Advertising, $0.7 million Sales Tax, $128.3 million Total: $176.3 million FIGURE 11-4 OPERATING REVENUE FORECAST TRANSIT DEVELOPMENT PLAN
101 Millions FINANCIAL PLAN Retail Sales Tax In 2016, Community Transit collected $108.9 million in local retail sales tax revenue. Revenue was more than 30 percent higher than in 2015, exceeding budget projections by $1.3 million. Sales tax revenue for is expected to grow substantially due to the expansion of Community Transit s taxation authority from the previous 0.9 percent to 1.2 percent with approval of Proposition 1, and continued economic growth in the region. Collection of the additional 0.3 percent started in April 2016, with revenue flowing to the agency beginning in June In 2016, the 7 months of Proposition 1 funding from June to December increased agency revenues by about $18 million. By December 2017, the full-year value of the new taxation authority will exceed $30 million. The underlying growth rate for retail sales tax in the PTBA is forecast to be 5 percent in 2017, 5 percent in 2018 and 4 percent each year 2019 through Growth over the previous five years has averaged 7.7 percent with a high of 10.9 percent in The 4 percent assumption for is in closer to the 20+ year growth trend for sales tax and allows for the possibility of an economic downturn during the next six years. With underlying growth and expanded taxation authority, revenue from retail sales tax is forecast to exceed $157 million by $175 $155 $135 $115 $95 $75 $55 Sales Tax: 2016 Actuals & Forecast $157.6 $151.5 $145.7 $140.1 $134.7 $128.3 $ FIGURE 11-5 SALES TAX, HISTORY & FORECAST Passenger Fares Fare revenue is a critical component of funding service in this plan. In 2016, Community Transit collected nearly $22 million in fares. This revenue covered about 23 percent of operating expense, not including service operated for Sound Transit. Community Transit has increased passenger fares as needed to sustain service and maintain consistency with peer agencies in the region. 97 TRANSIT DEVELOPMENT PLAN

102 $22 $23 $25 $28 $31 $34 $37 $96 $116 $124 $138 $149 $159 Millions $170 FINANCIAL PLAN This Transit Development Plan includes fare increases for bus and DART services in 2018, 2020 and Vanpool rates are evaluated annually and may be adjusted as part of annual budget adoption. Increased fare revenue will help maintain and expand service levels, offsetting cost increases due to the rising price of goods, services, insurance and benefits. It is likely that overall cost recovery may decline as Community Transit expands service over the next six years and operating cost increases more rapidly than ridership and fare revenue. A goal will be maintaining cost recovery above the 20 percent minimum and working to increase ridership and fares to improve this ratio. Figure 11-6 provides a forecast of operating expense, fare revenue and cost recovery for ACTION: Implement regular fare increases in 2018, 2020 and $180 $160 $140 Cost Recovery: How Much Operating Expense is Paid by Fare Revenue? $120 $100 $80 $60 $40 $20 $0 23% 20% 20% 21% 21% 22% 22% Fare Revenue Operating Cost Fares as Percentage of Operating Cost Bus & DART fare increases planned: 2018, 2020 and 2022 Vanpool rates adjusted annually FIGURE 11-6 FAREBOX COST RECOVERY 98 TRANSIT DEVELOPMENT PLAN
103 FINANCIAL PLAN Grant Funding The FAST Act was signed into law on December 4, 2015, and is effective October 1, 2016 through September 30, The FAST Act is the first long-term federal transportation authorization act in a decade. It provides five years of funding certainty for infrastructure planning and investment and authorizes $61.1 billion dollars of FTA funding. Funding levels for all FTA programs were increased, formula funding programs from MAP 21 were retained and a discretionary Bus & Bus Facilities (5339) program was reintroduced. Community Transit s formula fund share is tied to the amount of service we operate, so as service expansions are implemented we will see an increase in federal funding. There is also opportunity to secure funding through the discretionary FTA 5339 bus and bus facility program for capital projects. Due to the large scope of capital expansion, both vehicles and facilities, in this TDP, competitive grants are a significant element of the project financing. Competitive grant awards and assumptions include: $6.8 million WSDOT Regional Mobility grant for Swift Green Line Seaway Transit Center (awarded) $7 million WSDOT Regional Mobility grant for Swift Green Line buses (awarded) $10 million WSDOT LEAP operational funding for Swift Green Line ( ) (awarded) $43.1 million FTA Small Starts grant for Swift Green Line construction & vehicles (planned) $50 million grant funding assumed for Swift Orange Line $10 million grant funding assumed for Swift Blue Line Extension The six-year forecast for grant revenue is illustrated in Figure 11-7: 99 TRANSIT DEVELOPMENT PLAN
104 Millions FINANCIAL PLAN Grant Funding Forecast $90.0 $80.0 $70.0 $60.0 Swift Green Line: FTA Small Starts WSDOT Regional Mobility, Snohomish County Swift Orange Line and Swift Blue Line Extension grant funding $50.0 $40.0 $30.0 $61 $61 Competitive Grants State Formula Grants Federal Formula Grants $20.0 $10.0 $0.0 $3 $1 $3 $3 $3 $3 $3 $12 $12 $12 $12 $12 $ FIGURE 11-7 GRANT FUNDING FORECAST Bond Issue: Funding Bus Fleet Expansion Bonding is a finance tool that Community Transit has used successfully to buy vehicles and pay for capital construction. Community Transit s most recent debt obligation was retired with a final principal and interest payment of $1.85 million in The agency plans to issue new bonds for the purpose of bus fleet expansion in As described in the Capital section of the TDP, new buses were ordered in 2016 for delivery in 2017 and Bond funding will be an important component of the finance plan to purchase these vehicles. This $13 million bond issue is incorporated into the six-year cash flow and the first principal and interest payment of $1.47 million will be paid in Sound Transit Contract Sound Transit Regional Express operating expense is a pass-through element of this plan, fully funded by Sound Transit via an Operating Agreement. Since 1999, Sound Transit has contracted with Community Transit to provide ST Regional Express bus service between Snohomish County and King County. The current Operating Agreement is effective through 2017 with options to extend through Planning for Resilience As this 6-Year TDP plans for substantial growth in service, the agency continues to carefully manage cost growth and follow financial strategies to ensure Community 100 TRANSIT DEVELOPMENT PLAN
105 FINANCIAL PLAN Transit remains sustainable, even during economic downturns. Given the history of financial cycles and the fact that the current phase of economic growth began seven years ago, it is likely that we will experience a recession within the six-year horizon of this TDP. Resilience and sustainability balanced with growth is the goal of the TDP financial plan. The pace of service expansion and planned financial strategies are designed to meet these objectives: High priority on delivering a substantial portion of service and facility expansion identified in Proposition 1 ballot measure by Maintaining financial reserves at recommended levels to sustain services and complete capital projects without cutting jobs or requiring major changes to agency programs in the event of an economic downturn. Retaining sufficient unallocated financial capacity to fund projects currently under study for which there is not yet a clear funding scope (such as operating base expansion). Community Transit s fiscal planning is designed to sustain service plans and programs during a typical economic recession without requiring significant organizational change. Should a much more unusual financial event occur (such as the recent Great Recession), the focus would shift to sustaining current services with a revised plan and adjust future growth and agency programs to achieve that goal. ACTION: Maintain resilient financial strategies to ensure sustainability of services and programs through future economic downturns. Reserves The TDP maintains reserve cash balances at required and/or recommended levels. Community Transit maintains three significant cash reserve funds designated for operating, vehicle replacement and facility preservation. Two smaller funds are maintained for workers compensation claims and bond debt payments. A Facility and Technology Expansion Fund represents funds designated for specific projects associated with expanded services and technologies. 101 TRANSIT DEVELOPMENT PLAN

106 Millions FINANCIAL PLAN Operating Reserve The Operating Reserve Fund provides capacity to maintain transit service in the event of a revenue shortfall or unforeseen increase in operating expense. Contractual and policy guidance for this reserve calls for maintaining a minimum cash balance consisting of: A legally-required bond covenant equal to 10 percent of the current year's total operating budget. Two months capacity for all agency operating expenses, exclusive of Sound Transit service. A $3 million fuel reserve to cover increases in the cost of fuel above budget. Over the horizon, this minimum balance is forecast to increase from $35 million to $50 million. In 2017, Operating Reserve cash is forecast to be $48 million. The balance in this reserve over and above the minimum requirement represents new revenue from Proposition 1. Over the plan period, this capacity is utilized to add new bus service, increase the size of our fleet and construct new facilities. $100 $90 $80 $70 $60 $50 $40 $30 $20 $10 $- Operating Reserve: $87.0 $69.4 $64.4 $56.2 $55.7 $51.7 $53.2 $39.8 $36.5 $30.2 $29.4 $29.5 $3.0 $3.0 $3.0 $3.0 $3.0 $3.0 $19.3 $20.7 $23.1 $24.9 $26.6 $ Future Service Expansion Fuel Reserve 2 Months Operating FIGURE 11-8 OPERATING RESERVE 102 TRANSIT DEVELOPMENT PLAN

107 Millions FINANCIAL PLAN Vehicle Replacement Reserve The Vehicle Replacement Reserve Fund provides for the locally-funded portion of costs to replace both vehicles for revenue service and support. The balance in this fund is based on a calculation of the anticipated lifespan of each vehicle, the forecast replacement cost at end-of-life and the planned local funding share of that replacement cost. For example: 1. Bus purchased in 2015, expected life of vehicle is 15 years, to be replaced in Forecast replacement cost is $500,000, local share $100,000, grant share $400, Reserve funding required in year one is 1/15 of $100,000 local share ($6,700) 4. Reserve funding required in year two is 2/15 ($13,300). 5. Additional local share reserved each year until $100,000 is available at replacement. The balance of this fund over the horizon averages about $37 million. Current policy guidance regarding the locally-funded share of vehicle replacement is: Bus DART Vanpool Support Vehicles Local share equals 20 percent of replacement cost Local share equals 100 percent of replacement cost Local share equals 100 percent of replacement cost Local share equals 100 percent of replacement cost. Replacement need is 60 percent of support fleet due to 40 percent consisting of retired vanpool vehicles. $45 $40 $35 $30 $25 $20 $15 $10 $5 $- Vehicle Replacement Reserve: $38.8 $37.9 $39.6 $39.4 $2.4 $2.6 $2.7 $2.5 $33.7 $32.7 $4.3 $4.4 $4.5 $2.3 $4.2 $2.2 $2.8 $2.8 $8.5 $8.7 $8.9 $9.1 $8.0 $8.3 $23.6 $22.4 $23.7 $19.7 $20.3 $ Support Veh. (100%) DART (100%) Vanpool (100%) Bus (20%) FIGURE 11-9 REPLACEMENT RESERVE 103 TRANSIT DEVELOPMENT PLAN
108 Millions FINANCIAL PLAN Facility Preservation Reserve Beginning in 2013, Community Transit began to reserve funds to cover both planned and unplanned expenses related to preservation of service and operating facilities. Needs in this area are becoming significant as many of the agency s facilities are 30 or more years old. A key element of planning for this reserve fund was completion of a facility condition assessment (FCA) in 2012, documenting the condition and useful life of all major facilities and systems, and their associated replacement/preservation costs. Policy guidance for this reserve fund consists of: The local share of current year preservation projects. The local share of preservation projects anticipated in the two years following the current year. 1.5 percent of the total replacement cost of all facility/system/technology assets, excluding vehicles. Any additional reserve designated for special preservation/replacement projects. In the plan horizon, the balance in this reserve grows from $8.6 million to $9.2 million. Annual expenditures for preservation projects are forecast to be $1.7 million to $1.9 million. $10 $9 $8 $8.6 $1.0 Facility Preservation Reserve: $9.1 $9.1 $9.1 $9.2 $8.8 $1.0 $1.0 $1.0 $1.0 $1.0 $7 $6 $5 $4 $3 $2 $1 $- $1.8 $1.9 $1.9 $1.9 $1.7 $1.7 $3.3 $3.5 $3.7 $3.7 $3.7 $3.7 $2.6 $2.6 $2.6 $2.6 $2.6 $ Other Current Year Projects Two Year Look-Ahead 1.5% Replacement FIGURE FACILITY PRESERVATION RESERVE 104 TRANSIT DEVELOPMENT PLAN

109 Millions FINANCIAL PLAN Facility and Technology Expansion Fund The Facility and Technology Expansion Fund includes capital funding designated for specific projects related to service or technology expansion. The TDP calls for moving $84 million local funding to the Facility and Technology Expansion Fund. Swift Green Line capital construction will require approximately $5 million of this funding. Operating base expansion, forecast for 2020, has been allocated $50 million. Community Transit s portion of the ngorca project is allocated $9.2 million. Future development of the Swift Orange Line and Swift Blue Line Extension have been allocated $25 million. Beginning in 2022, the fund begins to accumulate an annual contribution toward another future operating base expansion project, projected in 20 years. $80 $70 $60 $50 $40 $30 $20 $10 $- Facility & Technology Expansion Fund: $72.1 $62.1 $57.9 $10.0 $47.9 $5.0 $9.2 $9.2 Other $5.0 $37.1 Future Swift Development $30.2 ngorca Base Expansion $50.0 $50.0 $50.0 $40.0 $25.0 $25.0 $9.2 $ FIGURE FACILITY & TECHNOLOGY EXPANSION FUND 105 TRANSIT DEVELOPMENT PLAN
110 Millions FINANCIAL PLAN Total Reserve & Fund Balance Overall, Community Transit s cash reserve and fund balance is forecast to vary between $152 million and $189 million over the plan horizon. The balance in each year reflects compliance with policy guidance for each reserve, as well as funding designated for facility expansion to support service growth described in this plan. All Reserves: $200 $180 $160 $140 $120 $100 $80 $60 $168 $155 $1 $1 $8 $8 $14 $14 $58 $48 $33 $34 $180 $1 $8 $14 $62 $39 $146 $1 $8 $12 $22 $38 $156 $1 $8 $10 $28 $40 $150 $1 $8 $9 $5 $39 Bond Workers Comp Facility Preservation Facility Expansion Veh. Replacement Operating $40 $20 $52 $53 $56 $64 $69 $87 $ FIGURE RESERVE SUMMARY ACTION: Maintain reserve balances at legally required and/or recommended levels. 106 TRANSIT DEVELOPMENT PLAN


111 THE ROUTE AHEAD 12. The Route Ahead Community Transit is moving forward with more service, more often, to serve the daily transportation needs of more people. We are improving the quality of today s network and planning for new services that will expand future mobility in Snohomish County. With Proposition 1, and new State and Federal funding we are building a future transit vision that will continue to grow our economy and maintain quality of life in our communities for decades to come. Important steps toward that vision are included in this Transit Development Plan such as: Swift Green Line connecting Boeing/Paine Field and Canyon Park More trips serving Seattle and the University District Better connections for Mill Creek, Boeing, Quil Ceda, Marysville & Arlington Faster trips to job centers in Snohomish County More connections to more places, more often and more reliably Expanded TDM program More buses and Vanpools DART service growing with increased ADA travel demand Planning for Swift Orange Line and Swift Blue Line Extension 107 TRANSIT DEVELOPMENT PLAN
1. Introduction The Agency Service Characteristics Facilities Fleet Technology...
 ADOPTED 5/5/2016 Table of Contents 1. Introduction... 1 2. The Agency... 5 3. Service Characteristics... 7 4. Facilities... 19 5. Fleet... 27 6. Technology... 29 7. Transportation Demand Management/Transportation
FREQUENTLY ASKED QUESTIONS
 FREQUENTLY ASKED QUESTIONS 2018 What is the More MARTA Atlanta program? The More MARTA Atlanta program is a collaborative partnership between MARTA and the City of Atlanta to develop and implement a program
Fall 2018 Guide to SERVICE EXPANSION. and FARE CHANGE
 Fall 2018 Guide to SERVICE EXPANSION and FARE CHANGE Fall 2018 Guide Service Expansion & Fare Change This fall, Community Transit is adding more trips on popular routes, and changing some routes to serve
Transportation Demand Management Element
 Transportation Demand Management Element Over the years, our reliance on the private automobile as our primary mode of transportation has grown substantially. Our dependence on the automobile is evidenced
5. OPPORTUNITIES AND NEXT STEPS
 5. OPPORTUNITIES AND NEXT STEPS When the METRO Green Line LRT begins operating in mid-2014, a strong emphasis will be placed on providing frequent connecting bus service with Green Line trains. Bus hours
CEDAR AVENUE TRANSITWAY Implementation Plan Update
 CEDAR AVENUE TRANSITWAY Implementation Plan Update EECUTIVE SUMMARY DECEMBER 2015 Executive Summary In 2013, the Twin Cities metropolitan area s first bus rapid transit (BRT) line, the METRO Red Line,
Downtown Transit Connector. Making Transit Work for Rhode Island
 Downtown Transit Connector Making Transit Work for Rhode Island 3.17.17 Project Evolution Transit 2020 (Stakeholders identify need for better transit) Providence Core Connector Study (Streetcar project
Swift Green Line April 11, 2019
 Swift Green Line April 11, 2019 Overview Swift BRT Overview Swift Green Line Project Snohomish County Partnership Early Results Swift Washington s first BRT Overlay BRT Stations approx. 3/4-1 mile apart
EUGENE-SPRINGFIELD, OREGON EAST WEST PILOT BRT LANE TRANSIT DISTRICT
 EUGENE-SPRINGFIELD, OREGON EAST WEST PILOT BRT LANE TRANSIT DISTRICT (BRIEF) Table of Contents EUGENE-SPRINGFIELD, OREGON (USA)... 1 COUNTY CONTEXT AND SYSTEM DESCRIPTION... 1 SYSTEM OVERVIEW... 1 PLANNING
PUBLIC TRANSPORTATION
 PUBLIC TRANSPORTATION PROJECT TITLE U-MED DISTRICT MULTI-MODAL IMPROVEMENTS- PHASE II Transit Vehicles and Upgrades MUNICIPALITY OF ANCHORAGE Capital Improvement Program PROJECT LIST BY DEPARTMENT Public
Metropolitan Council Budget Overview SFY
 Metropolitan Council Budget Overview SFY 2016-2017 H T t ti C itt House Transportation Committee February 4, 2015 Transit connects us to the places that matter Transportation Needs Grow as the Region Grows
Policy Note. Vanpools in the Puget Sound Region The case for expanding vanpool programs to move the most people for the least cost.
 Policy Note Vanpools in the Puget Sound Region The case for expanding vanpool programs to move the most people for the least cost Recommendations 1. Saturate vanpool market before expanding other intercity
A Transit Plan for the Future. Draft Network Plan
 A Transit Plan for the Future Draft Network Plan Project Overview and Status Completed Market Analysis and Service Evaluation. Developed Plan Framework and Guiding Principles. Developed a draft Five Year
Vanpooling and Transit Agencies. Module 3: Benefits to Incorporating Vanpools. into a Transit Agency s Services
 Vanpooling and Transit Agencies Module 3: Benefits to Incorporating Vanpools into a Transit Agency s Services A common theme we heard among the reasons why the transit agencies described in Module 2 began
COMMUNITY REPORT FISCAL YEAR We are making progress, are you on board? GOLD COAST TRANSIT DISTRICT
 FISCAL YEAR 178 GOLD COAST TRANSIT DISTRICT COMMUNITY REPORT We are making progress, are you on board? OJAI OXNARD PORT HUENEME VENTURA COUNTY OF VENTURA GENERAL MANAGER S MESSAGE STEVEN P. BROWN DEAR
The Case for. Business. investment. in Public Transportation
 The Case for Business investment in Public Transportation Introduction Public transportation is an enterprise with expenditure of $55 billion in the United States. There has been a steady growth trend
Sales and Use Transportation Tax Implementation Plan
 Sales and Use Transportation Tax Implementation Plan Transportation is more than just a way of getting from here to there. Reliable, safe transportation is necessary for commerce, economic development,
More than $9 Million coming to Central Valley for transportation
 More than $9 Million coming to Central Valley for transportation From free bus service to electric buses Part of overall $97 Million awarded to public transportation projects A total of 152 local public
STRATEGIC PRIORITIES AND POLICY COMMITTEE MAY 5, 2016
 STRATEGIC PRIORITIES AND POLICY COMMITTEE MAY 5, 2016 Shift Rapid Transit Initiative Largest infrastructure project in the city s history. Rapid Transit initiative will transform London s public transit
Parking Management Element
 Parking Management Element The State Transportation Planning Rule, adopted in 1991, requires that the Metropolitan Planning Organization (MPO) area implement, through its member jurisdictions, a parking
REPORT CARD FOR CALIFORNIA S INFRASTRUCTURE WHAT YOU SHOULD KNOW ABOUT CALIFORNIA S TRANSIT FACILITIES
 TRANSIT GRADE: C- WHAT YOU SHOULD KNOW ABOUT TRANSIT FACILITIES California needs robust, flexible and reliable transit systems to reduce peak congestion on our highways, provide options for citizens who
Sustainability SFMTA Path to Platinum
 Sustainability SFMTA Path to Platinum Ed Reiskin San Francisco Municipal Transportation Agency, Director of Transportation San Francisco, CA Timothy Papandreou Deputy Director Strategic Planning & Policy
Help shape your community investment in Wake Transit. Fiscal Year 2019 Draft Work Plan Summary
 Help shape your community investment in Wake Transit Fiscal Year 2019 Draft Work Plan Summary Wake County, growth and transit The Triangle is one of the fastest-growing regions in the nation. Wake County
Organization. SDOT Date and Commute Seattle. Dave Sowers, Deputy Program Administrator
 Organization SDOT Date and Commute Seattle Dave Sowers, Deputy Program Administrator October 22, 2018 TODAY S FOCUS The big picture #Realign99 closure/opening the tunnel Removal, decommissioning, surface
Utah Transit Authority Rideshare. CTAA Conference June 12, 2014
 Utah Transit Authority Rideshare CTAA Conference June 12, 2014 UTA Statistics and Info A Public Transit Agency Six counties, about 1600 square miles Within this area is 80% of the state s population, an
Click to edit Master title style
 Nelson/Nygaard Consulting Associates SERVICE IMPROVEMENT STRATEGIES September 22, 2015 1 PROJECT OVERVIEW & WORK TO DATE 1. Extensive stakeholder involvement Throughout 2. System and market assessment
2 VALUE PROPOSITION VALUE PROPOSITION DEVELOPMENT
 2 VALUE PROPOSITION The purpose of the Value Proposition is to define a number of metrics or interesting facts that clearly demonstrate the value of the existing Xpress system to external audiences including
Waco Rapid Transit Corridor (RTC) Feasibility Study
 Feasibility Study") Waco Rapid Transit Corridor (RTC) Feasibility Study Chris Evilia, Director of Waco Metropolitan Planning Organization Allen Hunter, General Manager Waco Transit System Jimi Mitchell, Project Manager AECOM
Waco Rapid Transit Corridor (RTC) Feasibility Study Chris Evilia, Director of Waco Metropolitan Planning Organization Allen Hunter, General Manager Waco Transit System Jimi Mitchell, Project Manager AECOM
ACT Canada Sustainable Mobility Summit Planning Innovations in Practice Session 6B Tuesday November 23, 2010
 ACT Canada Sustainable Mobility Summit Planning Innovations in Practice Session 6B Tuesday November 23, 2010 Presentation Outline Context t of Mississauga i City Centre Implementing Paid Parking and TDM
Colorado Association of Ski Towns August 26, 2016
 Colorado Association of Ski Towns August 26, 2016 1 Presentation RFTA Overview Long Range Forecast Integrated Transportation System Plan Questions Roaring Fork Transportation Authority (RFTA) RFTA Overview
Service Quality: Higher Ridership: Very Affordable: Image:
 Over the past decade, much attention has been placed on the development of Bus Rapid Transit (BRT) systems. These systems provide rail-like service, but with buses, and are typically less expensive to
The City of Toronto s Transportation Strategy July 2007
 The City of Toronto s Transportation Strategy July 2007 Presentation Outline Transportation Statistics Transportation Building Blocks Toronto s Official Plan Transportation and City Building Vision Projects
Leadership NC. November 8, 2018
 v Leadership NC November 8, 2018 Planning for our region s growth The Triangle is one of the fastestgrowing regions in the nation. More than 2 million people are already part of the equation, and the
Public Meeting. City of Chicago Department of Transportation & Department of Housing and Economic Development
 Public Meeting City of Chicago Department of Transportation & Department of Housing and Economic Development Funded by Regional Transportation Authority September 12, 2011 In partnership with Presentation
6/6/2018. June 7, Item #1 CITIZENS PARTICIPATION
 June 7, 2018 Item #1 CITIZENS PARTICIPATION 1 Item #2 APPROVAL OF MINUTES Item #3 TRAC GOALS, FRAMEWORK & AGENDA REVIEW 2 COMMITTEE GOALS Learn about Southern Nevada s mobility challenges, new developments
Executive Summary October 2013
 Executive Summary October 2013 Table of Contents Introduction... 1 Rider Transit and Regional Connectivity... 1 Plan Overview... 2 Network Overview... 2 Outreach... 3 Rider Performance... 4 Findings...
CITY OF LONDON STRATEGIC MULTI-YEAR BUDGET ADDITIONAL INVESTMENTS BUSINESS CASE # 6
 2016 2019 CITY OF LONDON STRATEGIC MULTI-YEAR BUDGET ADDITIONAL INVESTMENTS BUSINESS CASE # 6 STRATEGIC AREA OF FOCUS: SUB-PRIORITY: STRATEGY: INITIATIVE: INITIATIVE LEAD(S): BUILDING A SUSTAINABLE CITY
ROCHESTER, MINNESOTA
 ROCHESTER, MINNESOTA Rochester Public Works TRANSIT AND PARKING DIVISION Transit and Parking Manager Tony Knauer tknauer@rochestermn.gov SERVICE ATTITUDE CONSISTENCY - TEAMWORK ROCHESTER TRANSIT & PARKING
Strategic Plan
 2005-2015 Strategic Plan SUMMARY OF THE REVISED PLAN IN 2011 A decade focused on developing mass transit in the Outaouais A updated vision of mass transit in the region The STO is embracing the future
2011 Saskatoon Transit Services Annual Report
 2011 Annual Report Saskatoon Transit provides a high quality of service for all citizens in our community, and is undertaking initiatives focused on building its ridership. Saskatoon, like most North American
Car Sharing at a. with great results.
 Car Sharing at a Denver tweaks its parking system with great results. By Robert Ferrin L aunched earlier this year, Denver s car sharing program is a fee-based service that provides a shared vehicle fleet
QUALITY OF LIFE EXECUTIVE SUMMARY REPORT I O N S TAT I O N
 QUALITY OF LIFE EXECUTIVE SUMMARY REPORT UN I O N S TAT I O N T R AV E L by TR A I N Published September 2017 2015 PROGRESS MAP This document reports FasTracks progress through 2015 BACKGROUND RTD The
Appendix C. Parking Strategies
 Appendix C. Parking Strategies Bremerton Parking Study Introduction & Project Scope Community concerns regarding parking impacts in Downtown Bremerton and the surrounding residential areas have existed
Connected Vehicle and Autonomous Vehicle (CV/AV) Mobility and Technology
 Mobility and Technology") Connected Vehicle and Autonomous Vehicle (CV/AV) Mobility and Technology Randy Iwasaki Executive Director Contra Costa Transportation Authority May13, 2016 WHO WE ARE The Contra Costa Transportation Authority
Connected Vehicle and Autonomous Vehicle (CV/AV) Mobility and Technology Randy Iwasaki Executive Director Contra Costa Transportation Authority May13, 2016 WHO WE ARE The Contra Costa Transportation Authority
Rapid Transit and Land-Use Integration a Reality
 City of Charlotte Rapid Transit and Land-Use Integration a Reality Transportation Oversight Committee Carolyn Flowers CEO Charlotte Area Transit System April 29, 2010 Charlotte Region Statistics Mecklenburg
Paid Parking at Park & Ride Lots: Framing the Issues. Capital Programs Committee May 2014
 Paid Parking at Park & Ride Lots: Framing the Issues Capital Programs Committee May 2014 Outline Current Status Industry Review DART Case Study Issues Alternatives Mechanics 2 Current Status: All Lots
Denver Car Share Program 2017 Program Summary
 Denver Car Share Program 2017 Program Summary Prepared for: Prepared by: Project Manager: Malinda Reese, PE Apex Design Reference No. P170271, Task Order #3 January 2018 Table of Contents 1. Introduction...
Aren t You Really a Mobility Agency? Why The Vanpool Works for Transit
 Aren t You Really a Mobility Agency? Why The Vanpool Works for Transit Presenter: Kevin Coggin, Coast Transit Authority, Gulfport, MS Presenter: Lyn Hellegaard, Missoula Ravalli TMA, Missoula, MT Moderator:
WAKE TRANSIT PLAN Summer 2018
 WAKE TRANSIT PLAN Summer 2018 Planning for growth WAKE COUNTY s population already exceeds ONE MILLION and grows by more than 60 people a day. That s 23,000 people a year or basically another Morrisville.
US 29 Bus Rapid Transit Planning Board Briefing. February 16, 2017
 US 29 Bus Rapid Transit Planning Board Briefing February 16, 2017 Project Goals Improve the quality of transit service Improve mobility opportunities and choices Enhance quality of life Support master
FasTracks News. RTD s Eagle P3 Transit Project Nears Halfway Mark to Opening Day EP3 will add three commuter rail lines to metro area in 2016
 July 29, 2013 Welcome to Inside RTD FasTracks a monthly e- update to keep you informed about the progress of the Regional Transportation District's FasTracks program. FasTracks News RTD s Eagle P3 Transit
TRANSIT FEASIBILITY STUDY Town of Bradford West Gwillimbury
 TRANSIT FEASIBILITY STUDY Town of Bradford West Gwillimbury Open House Presentation January 19, 2012 Study Objectives Quantify the need for transit service in BWG Determine transit service priorities based
2 EXISTING ROUTE STRUCTURE AND SERVICE LEVELS
 2 EXISTING ROUTE STRUCTURE AND SERVICE LEVELS In the Study Area, as in most of the Metro Transit network, there are two distinct route structures. The base service structure operates all day and the peak
UC Santa Cruz TAPS 3-Year Fee & Fare Proposal, through
 UC Santa Cruz TAPS 3-Year Fee & Fare Proposal, 2016-17 through 2018-19 Introduction Transportation and Parking Services (TAPS) proposes a three-year series of annual increases to most Parking fees and
Sound Transit 3. Appendix C: Benefits, Costs, Revenues, Capacity, Reliability, and Performance Characteristics
 Sound Transit 3 Appendix C: Benefits, Costs, Revenues, Capacity, Reliability, and Performance Characteristics Table of contents Introduction... 4 Background... 5 Benefits of ST3 investments in the regional
Executive Summary. Treasure Valley High Capacity Transit Study Priority Corridor Phase 1 Alternatives Analysis October 13, 2009.
 Treasure Valley High Capacity Transit Study Priority Corridor Phase 1 Alternatives Analysis October 13, 2009 Background As the Treasure Valley continues to grow, high-quality transportation connections
Charlotte-Mecklenburg Region Rapid Transit and Land-Use Integration
 Charlotte-Mecklenburg Region Rapid Transit and Land-Use Integration Legislative Committee on Urban Growth and Infrastructure Carolyn Flowers CEO Charlotte Area Transit System March 23, 2010 Charlotte Region
PUBLIC TRANSPORTATION
 PUBLIC TRANSPORTATION An Overview of the Industry, Key Federal Programs, and Legislative Processes American Public Transportation Association 1 The Public Transportation Industry: What is "public transportation"?
Transportation: On the Road to Cleaner Air Did you know?
 Opposite and above State transportation officials are urging commuters to use mass transit, carpool, ride a bike, or to telecommute, in a campaign to help communities get cleaner air. Cities are also turning
GO Transit s deliverable: the 2020 Service Plan
 GO Transit s deliverable: the 2020 Service Plan GO Transit s 2020 Service Plan describes GO s commitment to customers, existing and new, to provide a dramatically expanded interregional transit option
Metro Reimagined. Project Overview October 2017
 Metro Reimagined Project Overview October 2017 Reimagining Metro Transit Continuing our Commitment to: Provide mobility based on existing and future needs Value the role of personal mobility in the quality
PROPOSAL OF HIGH CAPACITY URBANAUT PUGET SOUND REGIONAL MONORAIL MASTERPLAN WASHINGTON STATE, USA
 PROPOSAL OF HIGH CAPACITY URBANAUT PUGET SOUND REGIONAL MONORAIL MASTERPLAN WASHINGTON STATE, USA Not to be copied in part without reference to author Urbanaut Company Inc. Monorail Tel: 425 434-6570 Fax:
Mississauga Transit 2009 Budget
 Mississauga Transit 2009 Budget Budget Committee Presentation December 2, 2008 Revenue Ridership Forecasted 2008 Total Rides Including transfers 11% growth in the last 24 months Transit Service Area Business
April 2010 April 2010 Presented by Alan Eirls
 April 2010 April 2010 Presented by Alan Eirls A Partnership Between the Coeur d Alene Tribe, the State of Idaho, the KMPO, and Kootenai County. Current System The Citylink system began on the Coeur d Alene
Executive Summary. Draft Environmental Impact Statement/Environmental Impact Report ES-1
 Executive Summary Introduction The Eastside Transit Corridor Phase 2 Project is a vital public transit infrastructure investment that would provide a transit connection to the existing Metro Gold Line
2018 Long Range Development Plan Update Community Advisory Group- February 21, 2018
 Transportation @ UC San Diego 2018 Long Range Development Plan Update Community Advisory Group- February 21, 2018 Agenda UC San Diego Transportation Services Organizational Overview Current State Parking,
CITY of GUELPH Transit Growth Strategy and Plan, Mobility Services Review. ECO Committee
 CITY of GUELPH Transit Growth Strategy and Plan, Mobility Services Review ECO Committee July 19, 2010 1 Study Purpose Vision and growth strategy for Guelph Transit, ensuring broad consultation Operational
Point A Point B Point C Point D. Fulton County Board of Commissioners and Mayors Meeting December 14, 2017
 Fulton County Board of Commissioners and Mayors Meeting December 14, 2017 Master Plan Overview Phase 1 Community Vision and Existing Transit Conditions Phase 2 Scenario Development Phase 3 Transit Master
Redefining Mobility Ready or not: Autonomous and connected vehicle planning and policy, now and in the future
 Redefining Mobility Ready or not: Autonomous and connected vehicle planning and policy, now and in the future Randy Iwasaki November 30, 2017 WHO WE ARE The Contra Costa Transportation Authority (CCTA)
Incentives for Green Fleets
 Incentives for Green Fleets 2012 Green Vehicle Funding Workshop East Bay Clean Cities Coalition Karen Schkolnick Air Quality Programs Manager Bay Area Air Quality Management District Overview Introduction
Tempe Streetcar. March 2, 2016
 Tempe Streetcar March 2, 2016 Tempe Profile 40 sq. miles, highest density in state University Town, center of region Imposed growth boundaries (density increase) Mixed use growth/intensifying land use
Facts and Figures. October 2006 List Release Special Edition BWC National Benefits and Related Facts October, 2006 (Previous Versions Obsolete)
") Facts and Figures Date October 2006 List Release Special Edition BWC National Benefits and Related Facts October, 2006 (Previous Versions Obsolete) Best Workplaces for Commuters - Environmental and Energy
Facts and Figures Date October 2006 List Release Special Edition BWC National Benefits and Related Facts October, 2006 (Previous Versions Obsolete) Best Workplaces for Commuters - Environmental and Energy
Kenosha-Racine-Milwaukee (KRM)
") Kenosha-Racine-Milwaukee (KRM) Commuter Rail #147925 November 6, 2009 1 Guidance of KRM Commuter Rail Studies Intergovernmental Partnership Technical Steering Committee Temporary and Limited Authority
Kenosha-Racine-Milwaukee (KRM) Commuter Rail #147925 November 6, 2009 1 Guidance of KRM Commuter Rail Studies Intergovernmental Partnership Technical Steering Committee Temporary and Limited Authority
Strategies to keep people and goods moving in and through Seattle
 Strategies to keep people and goods moving in and through Seattle SR 99 Closure and the Seattle Squeeze 2018-2024 DON Information Session Department of Transportation Delridge Community Center November
TransNet Dollars Keep San Diego Moving
 TransNet Dollars Keep San Diego Moving In 1987, San Diego region voters approved the TransNet program a half-cent sales tax to fund a variety of important transportation projects throughout the region.
August 2, 2010 Public Meeting
 Public Meeting LYMMO Expansion Alternatives Analysis Study Purpose of study is to provide a fresh look at potential LYMMO expansion, following Federal Transit Administration (FTA) Alternatives Analysis
GODURHAM PROGRESS REPORT
 GODURHAM PROGRESS REPORT OVERVIEW OPERATIONS & PERFORMANCE With the service enhancements, total revenue hours increased In 2016, GoDurham connected 5.9 million passengers to jobs, education and health
Draft Results and Open House
 Waco Rapid Transit Corridor (RTC) Feasibility Study Draft Results and Open House Chris Evilia, Director of Waco Metropolitan Planning Organization Allen Hunter, General Manager Waco Transit System Jimi
EVALUATION OF MTC S CLIMATE PROGRAM. May 7, 2015 TRB Sustainability for Transportation
 EVALUATION OF MTC S CLIMATE PROGRAM May 7, 2015 TRB Sustainability for Transportation Metropolitan Transportation Commission Created by the California Legislature in 1970 Jurisdiction includes all 9 Bay
SUPPORTING TOD IN METRO CHICAGO
 www.rtachicago.org SUPPORTING TOD IN METRO CHICAGO Tuesdays at APA November 18, 2014 OVERVIEW OF RTA 2 11/18/2014 Tuesdays at APA: Supporting TOD in Metro Chicago RTA Region 8.5 million people 3,700 square
Transportation 2040: Plan Performance. Transportation Policy Board September 14, 2017
 Transportation 2040: Plan Performance Transportation Policy Board September 14, 2017 Today Background Plan Performance Today s Meeting Background Board and Committee Direction 2016-2017 Transportation
I-26 Fixed Guideway Alternatives Analysis
 I-26 Fixed Guideway Alternatives Analysis Public Meetings: North Charleston, January 25, 2016 Charleston: January 26, 2016 Summerville: January 28, 2016 Agenda I. Project Update II. III. IV. Screen Two
DRAFT Evaluation Scores. Transit
 DRAFT Evaluation s The criteria for evaluating applications for new funding commitments are used to measure how well they advance the six goals identified for the MTP. Through transportation: Reduce per
Metro Transit Update. Christina Morrison, Senior Planner Metro Transit BRT/Small Starts Project Office. John Dillery, Senior Transit Planner
 Metro Transit Update Christina Morrison, Senior Planner Metro Transit BRT/Small Starts Project Office John Dillery, Senior Transit Planner Metro Transit Service Development May 16, 2013 1 Transit Planning
Kendall Drive Premium Transit PD&E Study Project Kick-Off Meeting SR 94/Kendall Drive/SW 88 Street Project Development and Environment (PD&E) Study
 Study") Florida Department of Transportation District Six Kendall Drive Premium Transit PD&E Study Project Kick-Off Meeting SR 94/Kendall Drive/SW 88 Street Project Development and Environment (PD&E) Study What
Florida Department of Transportation District Six Kendall Drive Premium Transit PD&E Study Project Kick-Off Meeting SR 94/Kendall Drive/SW 88 Street Project Development and Environment (PD&E) Study What
May 23, 2011 APTA Bus & Paratransit Conference. Metro ExpressLanes
 May 23, 2011 APTA Bus & Paratransit Conference Metro ExpressLanes Program Overview > Conversion of HOV lanes to HOT lanes on I-10 and I-110 > Multi-modal Integrated Corridor Emphasis > 1 of 6 Nationwide
Maryland Gets to Work
 I-695/Leeds Avenue Interchange Reconstruction Baltimore County Reconstruction of the I-695/Leeds Avenue interchange including replacing the I-695 Inner Loop bridges over Benson Avenue, Amtrak s Northeast
Parking Management Strategies
 Parking Management Strategies Policy Program Potential Effectiveness (percent reduction in demand) Comments Parking Pricing Unbundling and Cash-Out Options Reduced Parking Requirements Transit/TOD Supportive
MARTA s blueprint for the future. COFFEE AND CONVERSATION Kyle Keahey, More MARTA Atlanta Dec. 5, 2018
 MARTA s blueprint for the future COFFEE AND CONVERSATION Kyle Keahey, More MARTA Atlanta Dec. 5, 2018 TODAY S AGENDA About MARTA Economic development/local impact More MARTA Atlanta program Program summary/timeline
CTfastrak Expansion. Stakeholder Meeting #4 Manchester Town Hall June 3, 2016
 CTfastrak Expansion Stakeholder Meeting #4 Manchester Town Hall June 3, 2016 Today s Agenda Phase I Update 2016 Service Plan Implementation Schedule & Cost Update Phase II Services Timeline Market Analysis
SamTrans Business Plan Update May 2018
 SamTrans Business Plan Update May 2018 SamTrans Business Plan Core Principles: 1. Sustain and enhance services for the transit-dependent 2. Expand and innovate mobility services 3. Promote programs that
Back ground Founded in 1887, and has expanded rapidly Altitude about 2500 meters above MSL Now among the ten largest cities in Sub Saharan Africa
 Back ground Founded in 1887, and has expanded rapidly Altitude about 2500 meters above MSL Now among the ten largest cities in Sub Saharan Africa Annual growth rate is 3.8% By 2020 population growth would
Northeast Corridor Alternatives Analysis. Public Involvement Round 2 Input on Alternatives for Further Study
 Northeast Corridor Alternatives Analysis Public Involvement Round 2 Input on Alternatives for Further Study Feb. 7-9, 2012 Agenda Review project background Progress summary Recommended alternatives for
METRONext. Vision & Moving Forward Plans. Board Workshop. December 11, DRAFT For Preliminary Discussion Only
 METRONext Vision & Moving Forward Plans Board Workshop December 11, 2018 Disclaimer This presentation is being provided solely for discussion purposes by the Board of Directors of the Metropolitan Transit
Amman Green Policies Projects and Challenges. Prepared by: Eng. Sajeda Alnsour Project coordinator Sept. 20, 2017
 Amman Green Policies Projects and Challenges Prepared by: Eng. Sajeda Alnsour Project coordinator Sept. 20, 2017 Amman: Demographics Greater AMMAN Municipality GAM Amman is the capital of Jordan with a
Branch Edmonton Transit
 Introduction to exceed 90 million by the end of 2015. This trend confirms Transit s on-going success towards achieving The Way We Move: by providing a comprehensive public transportation system that supports
M E M O R A N D U M INTRODUCTION. POTENTIAL TDM STRATEGIES Marketing & Management. Residents & Employees. Exhibit 6
 Exhibit 6 M E M O R A N D U M To: From: Joe Ernst and Bryan Graves Nelson\Nygaard Date: February 6, 2015 Subject: Preliminary TDM Strategies INTRODUCTION The memorandum provides an overview of potential
29 April Sound Transit 3 Draft Plan. Dear Sound Transit Boardmember:
 29 April 2016 Re: Sound Transit 3 Draft Plan Dear Sound Transit Boardmember: Thank you for the opportunity to comment on the Sound Transit 3 Draft Plan. Sierra Club supports transportation policies that
JOINT FACILITIES ADVISORY COMMISSION. ART and APS Bus Parking Informational Session July 27, :30 pm
 ART and APS Bus Parking Informational Session July 27, 2017 7 8:30 pm 2 Agenda Introductions & overview APS Bus Parking APS Bus Facts APS Bus Operations ART Bus Parking Story of ART and its role in County
Efficient Transportation Six Case Stories
 CALIFORNIA CLIMATE ACTION NETWORK Efficient Transportation Six Case Stories These case stories were compiled in July 2009 in partnership with the California Air Resources Board. Additional climate change