Transit and Shuttle Service Plan
|
|
|
- Christiana Boyd
- 5 years ago
- Views:
Transcription

1 Final Report Lansdowne Revitalization MRC McCORMICK RANKIN CORPORATION A Member of: October 2011
2 This page intentional left blank
3 Technical Report Global Transportation Engineering October 2011 McCORMICK RANKIN CORPORATION
4 October 2011 Lansdowne Revitalization
5 TABLE OF CONTENTS 1. OVERVIEW SPECIAL EVENTS TRANSPORTATION SERVICES TRANSIT SERVICE PLAN TRANSIT STOPS AND FACILITIES ON BANK STREET AT LANSDOWNE PARK DAY-TO-DAY OPERATIONS ARENA EVENTS WITH ATTENDANCE OF LESS THAN 10, Transit Services Resources and Service Scheduling Costs STADIUM EVENTS WITH ATTENDANCE OF BETWEEN 10,000 AND 15, Transit Services Resources and Service Scheduling Costs STADIUM EVENTS WITH ATTENDANCE MORE THAN 15, Transit Services Resources and Service Scheduling Costs SERVICE SUPERVISION AND WORK COVERAGE RESTRICTIONS ON TIMING OF EVENTS SHUTTLE SERVICES AND OFF-SITE PARKING PLAN INTRODUCTION SATELLITE PARKING REQUIREMENTS PARKING LOTS AVAILABLE Carleton University Canada Post PWGSC Confederation Heights SATELLITE PARKING FOR EVENTS BETWEEN 10,000 AND 15, Parking Facilities Transportation Services Resources and Costs SATELLITE PARKING FOR EVENTS BETWEEN 15,000 AND 25, Parking Facilities Transportation Services Resources and Costs SATELLITE PARKING FOR EVENTS MORE THAN 25, Parking Facilities Transportation Services Resources and Costs SHUTTLE DROP-OFF AND PICK-UP FACILITIES AT LANSDOWNE PARK SHUTTLE BUS STORAGE DURING EVENTS FLEET AND SERVICE PROVIDERS PROMOTION AND PUBLIC INFORMATION PROMOTION AND INFORMATION AHEAD OF EVENT REAL-TIME INFORMATION PROVISION October 2011 Lansdowne Revitalization - i
6 5. MONITORING AND ADJUSTING SERVICE OVERVIEW TRANSIT SERVICES (OC TRANSPO AND STO) SATELLITE PARKING AND SHUTTLE SERVICES COORDINATION AND COOPERATION SUMMARY OF EVENT TRANSIT AND SHUTTLE SERVICES TRANSIT SERVICES SATELLITE PARKING AND SHUTTLE SERVICES COSTS AND RESOURCES Appendices APPENDIX A TRIP GENERATION / DISTRIBUTION / MODE SPLIT APPENDIX B DAY TO DAY OPERATIONS APPENDIX C TRANSIT SERVICES, SCHEDULES, AND COSTS APPENDIX D SHUTTLE SERVICES, SCHEDULES, AND COSTS APPENDIX E SATELLITE PARKING MOU S APPENDIX F RESTRICTION ON TIMING OF EVENTS October 2011 Lansdowne Revitalization - ii
7 List of Tables Transit and Shuttle Service Plan TABLE 1-1: MODE SHARE FOR VARIOUS EVENT SIZES... 2 TABLE 1-2: TRANSIT AND PARKING DEMAND FOR VARIOUS EVENT SIZES... 2 TABLE 1-3: TRANSPORTATION SERVICES FOR VARIOUS EVENT ATTENDANCE LEVELS... 3 TABLE 2-1: TRANSIT SERVICE REQUIREMENTS AND COSTS FOR EVENTS WITH ATTENDANCE OF 7,000 AND 10, TABLE 2-2: TRANSIT SERVICE REQUIREMENTS AND COSTS FOR EVENTS WITH ATTENDANCE OF 13, TABLE 2-3: TRANSIT DEMAND FOR STADIUM EVENTS LARGER THAN 15, TABLE 2-4: TRANSIT SERVICE HEADWAYS FOR STADIUM EVENTS LARGER THAN 15, TABLE 2-5: TRANSIT SERVICE REQUIREMENTS AND COSTS FOR EVENTS WITH ATTENDANCE LARGER THAN 15, TABLE 3-1: SATELLITE PARKING REQUIREMENTS TABLE 3-2: VEHICLE PARKING VOLUMES SENSITIVITY ANALYSIS OF VEHICLE OCCUPANCY AND TRANSIT MODAL SHARE TABLE 3-3: PARKING SUPPLY AND DEMAND TABLE 3-4: SUMMARY OF OFF SITE PARKING MOU AGREEMENTS TABLE 3-5: SATELLITE PARKING AT CARLETON UNIVERSITY TABLE 3-6: SATELLITE PARKING AT CANADA POST TABLE 3-7: SHUTTLE SERVICE REQUIREMENTS AND COSTS FOR EVENTS WITH ATTENDANCE BETWEEN 10,000 AND 15, TABLE 3-8: SHUTTLE SERVICE REQUIREMENTS AND COSTS FOR EVENTS WITH ATTENDANCE BETWEEN 15,000 AND 25, TABLE 3-9: SATELLITE PARKING FACILITIES REQUIRED FOR EVENTS WITH ATTENDANCE LARGER THAN 25, TABLE 3-10: SHUTTLE SERVICE REQUIREMENTS AND COSTS FOR EVENTS WITH ATTENDANCE LARGER THAN 25, TABLE 3-11: SHUTTLE BUSES REQUIRED FOR SPECIAL EVENTS TABLE 6-1: TRANSIT AND PARKING DEMAND FOR VARIOUS EVENT SIZES TABLE 6-2: TOTAL TRANSIT SERVICES, RESOURCES AND COSTS FOR VARIOUS EVENT SIZES TABLE 6-3: SATELLITE PARKING FACILITIES FOR VARIOUS EVENT SIZES TABLE 6-4: SHUTTLE SERVICES AND RESOURCES FOR VARIOUS EVENT SIZES TABLE 6-5: TOTAL PARKING AND SHUTTLE SERVICE COSTS FOR VARIOUS EVENT SIZES List of Figures FIGURE 2-1: PEDESTRIAN AREAS ON BANK STREET... 5 FIGURE 2-2: SUPPLEMENTAL ROUTE 1 TRANSIT SERVICE ARENA EVENTS... 6 FIGURE 2-3: SUPPLEMENTAL TRANSIT SERVICES SMALL STADIUM EVENTS... 9 FIGURE 2-4: SPECIAL OC TRANSPO TRANSIT ROUTES FIGURE SUPPLEMENTAL ROUTE 1 TRANSIT SERVICE STADIUM EVENTS FIGURE 2-6: SPECIAL OC TRANSPO TRANSIT ROUTES OUTBOUND FOLLOWING EVENTS FIGURE 2-7: SPECIAL STO TRANSIT ROUTES FROM PARK AND RIDE LOTS FIGURE 2-8: SPECIAL STO TRANSIT ROUTES OUTBOUND FOLLOWING EVENTS FIGURE 3-1: OFF SITE PARKING LOCATIONS FIGURE 3-2: SUPPLEMENTARY SERVICE ON ROUTE 7 FOR EVENTS WITH ATTENDANCE BETWEEN 10,000 AND 15, FIGURE 3-3: SHUTTLE SERVICE ROUTING ALTERNATIVES FIGURE 3-4: SHUTTLE SERVICE ROUTING ON QUEEN ELIZABETH DRIVEWAY (40,000 EVENT) FIGURE 3-5: SHUTTLE DROP-OFF AND PICK-UP FOR SPECIAL EVENTS FIGURE 3-6: SHUTTLE BUS STORAGE DURING A LARGE EVENT BROOKFIELD HIGH SCHOOL FIGURE 6-1: TRANSIT SERVICE FOR EVENTS MORE THAN 15, October 2011 Lansdowne Revitalization - iii
8 1. OVERVIEW prepared the Lansdowne Revitalization Transportation Impact and Assessment Study and Transportation Demand Management Plan (dated July 2010). This transportation study assessed the potential impacts of the redevelopment and revitalization proposal for Lansdowne Park by the Ottawa Sports and Entertainment Group (OSEG) referred to as the Lansdowne Partnership Plan (LPP). A primary outcome of the study indicated that the transportation systems serving Lansdowne Park were sufficient to support the mixed use development. In addition, with respect to the planned future refurbishment of the 11,000 seat arena, 24,000 seat stadium and the development of the Urban Park the assessment also identified that a number of transportation strategies were required to support various planned special events with attendance of 10,000, 25,000 and 40,000. The specific strategies identified to support Lansdowne special events included enhanced transit services, introduction of shuttle bus services with satellite parking lots, a comprehensive transportation demand management program which, for example, included the costs for enhanced transportation services within the price of all special event tickets and a commitment for ongoing monitoring and intervention aimed at increasing the usage of sustainable transportation modes for event patrons. Following City Council s approval of the Stage 1 Site Plan in November of 2010, a number of detailed transportation studies which focused on the special events were identified as being required prior to final site plan approval (Stage II Site Plan Approval) and included the following: Transit and Shuttle Service Plan The transit service needs were identified based on the planned special events with attendance thresholds of 7,000 to 14,000 patrons (Civic Centre, smaller stadium and urban park events), 15,000 to 24,000 patrons (full stadium events and larger urban park events) and large events with 40,000 plus patrons (expanded stadium events). The shuttle services to serve satellite parking lots and associated operational requirements were to be consistent a Memorandum of Understanding between the National Capital Commission and the City of Ottawa to allow shuttle buses to use Queen Elizabeth Driveway for a three-year pilot project period. Traffic and Parking Management Plan The traffic and parking management operations plan for off-site traffic and parking operations related to special events with attendance thresholds of 10,000 patrons (Civic Centre, smaller stadium and urban park events) to 25,000 patrons (full stadium events and larger urban park events) and 40,000 plus (expanded stadium events); Transportation Demand Management Plan The Transportation Demand Management Plan for the different land uses planned for the site (residential, office, retail/entertainment, and special events) and in particular to encourage pedestrian, cycling and transit access to and reduce the use of automobiles and, in particular, single occupant vehicles. The purpose of this report is to describe the plans for transit services and satellite parking lots and shuttle services for a range of special events with attendance from 7,000 to 40,000. October 2011 Lansdowne Revitalization - 1
9 1.1 Special Events Transit and Shuttle Service Plan For special events at Lansdowne Park additional transportation services will be required. This report describes service plans for six 1 sizes of special events at Lansdowne Park: 7,000 and 10,000 as representative of an average and sold-out OHL game; 13,000, 18,000 and 25,000 as representative of a concert, an average CFL game and a sold-out CFL game, respectively; and 40,000 as representative of a large event like the Rolling Stones concert or the Grey Cup. However, the emphasis in this report is on events with attendance of up to 25,000 which will take place regularly at Lansdowne Park. For very large events that are unlikely to occur more than once every few years, a special multi-disciplinary team would be formed including the event organizers, Ottawa Police Services, OC Transpo, and Traffic Operations from the City as well as STO, NCC, the shuttle providers and the TDM Coordinator. Mode shares will vary depending on the size of the event with higher pedestrian, cycling and transit usage for larger events. The analysis also considers higher pedestrian and cycling shares from areas closer to the Park. The following table presents the average mode share for each event type. Table 1-1: Mode Share for Various Event Sizes Arena Stadium Large Stadium Attendance 7,000 10,000 13,000 18,000 25,000 40,000 % Transit 10% 10% 20% 20% 20% 25% % Bicycle / Pedestrian 10% 10% 12% 12% 12% 13% % Auto 80% 80% 68% 68% 68% 62% The mode shares presented above were used to determine the number of transit passengers that would need to be accommodated. With limited on-site and on-street auto parking, the number of event goers that would be using satellite parking facilities and shuttle services to access Lansdowne Park was determined. Details regarding the on-site and on-street parking can be found in the Traffic and Parking Management Plan. Table 1-2: Transit and Parking Demand for Various Event Sizes Attendance 7,000 10,000 13,000 18,000 25,000 40,000 Transit Passengers Bicycle / Pedestrian on street & on site Satellite facilities 700 1,000 2,550 3,550 4,925 10, ,000 1,550 2,150 2, ,600 8,000 8,125 8,125 8,125 6, ,175 8,975 17,775 1 These event sizes were used for modeling purposes to represent ranges of event sizes. For example, events with attendance of 13,000 represent smaller stadium events from 10,000 to 15,000 (see Table 1-3) October 2011 Lansdowne Revitalization - 2
10 1.2 Transportation Services The plan is based on providing services of three sorts for special events: Transit and Shuttle Service Plan supplementary transit service on the regular route network for all events; special routes focused on suburban park and ride lots for larger special events, running directly to Lansdowne Park along the lines of the 400-Series routes that operate to Scotiabank Place for hockey games; shuttle service from satellite parking facilities The following table summarizes the transit, satellite parking, and shuttle services required for events of various attendance levels. These are discussed in more detail in subsequent sections of this report. Transportation Service Table 1-3: Transportation Services for Various Event Attendance Levels Day to Day Arena Events less than 10,000 less than 15,000 Stadium Events 15,000 to 25,000 40,000 Transit Service Satellite Parking Requirements Routes 1&7 with minor increased service No requirement Additional service on Route 1 extended to Hurdman Parking at Carleton University with supplementary service on Route 7 (Carleton to Lansdowne) (up to 500 parking spaces) Supplementary service on regular route network (as required) Special services focused on suburban Park & Ride lots (like 400 series to Scotiabank Place) Parking at Carleton University, Canada Post and Vincent Massey Park (500 to 3,500 spaces) Parking at Carleton University, Confederation Heights, City Hall and new Trade Show Centre, etc (More than 3,500 spaces) Shuttle Service No requirement Special shuttle services to Lansdowne STO will also provide services to support special events at Lansdowne Park and discussions have taken place to determine how these will be coordinated with those of OC Transpo. The plan for larger events 2 is for STO to run allow special routes directly to Lansdowne Park similar to the special OC Transpo routes that are planned. Satellite parking lots will be required for events with attendance of more than 10,000. For events with attendance of less than 15,000 it is proposed to provide parking at Carleton University and to shuttle event-goers to and from Lansdowne Park using supplementary service on Route 7 serving regular bus stops on Bank Street. 2 Events with attendance of 15,000 or more. October 2011 Lansdowne Revitalization - 3
11 For events with attendance of 15,000 or more typical of football games satellite parking will be provided at Carleton University and Confederation Heights. Satellite parking lots will be connected to Lansdowne Park by special shuttle services. The NCC and the City of Ottawa have signed letter of intent (LOI) which covers a three-year pilot project permitting shuttle buses to use Queen Elizabeth Driveway for some events, during which time the impacts will be monitored. For some events, including all football games 3, the shuttle services will operate on Bronson Avenue, Lakeside Avenue and Queen Elizabeth Driveway, using the special shuttle drop-off and pick-up facilities at the northern Queen Elizabeth Driveway entrance to Lansdowne Park. For other events, in accordance with an agreement between the NCC and the City of Ottawa, the shuttles will operate on Bronson Avenue, Sunnyside, Fifth Avenue and Bank Street. These shuttles may be operated by OC Transpo or through contracting with other service providers (e.g. STO or private operators). Event ticket holders will be able to access transit services on both STO and OC Transpo routes two hours before the start of the event and two hours after the end of the event. Satellite parking and shuttle services will also not require additional fees for event-goers. Transit costs and the cost of satellite parking and shuttle services will be included in the price of the event tickets. This key Transportation Demand Management (TDM) initiative will attract a strong modal share to transit for special events and make the post-event transit operations more manageable since there will be no need to collect fares and all-door boarding will be possible. It will also make the satellite parking more attractive and reduce congestion in the immediate vicinity of Lansdowne Park. In this report typical events are featured: arena events with up to 10,000 attendees; stadium events with less than 15,000 attendees; stadium events with 15,000 to 25,000 attendees; and expanded stadium events with attendance of 40,000. However, it should be recognized that smaller events may well take place in the stadium and also that there may be events in the urban park drawing large crowds. The parameter governing the applicable transportation services is the peak on-site attendance level. All events with peak on-site attendance of 5,000 or more will require some level of enhanced transportation services. In addition, although in this report the costs are assumed to be covered by adding a supplement to ticket prices, the same transportation demand management principles will apply to non-ticketed events and the costs will need to be covered by event organizers. 3 NCC will confirm this commitment to CFL games, subject to what may be previously committed dates for the Queen Elizabeth Driveway to be closed, for the three-year period of the pilot project. October 2011 Lansdowne Revitalization - 4

12 2. TRANSIT SERVICE PLAN Transit and Shuttle Service Plan 2.1 Transit Stops and facilities on Bank Street at Lansdowne Park The Lansdowne Park Site Plan has been developed to respect the principles behind the plan for the Bank Street reconstruction that was approved in The result is shown in Figure 2-1. The sidewalks will be wider than they are today. On the west side of Bank Street the sidewalks today are approximately 2 metres wide. This will increase to a little more than 4 metres in the vicinity of the main entrance of the site. There are bus stops nearside of the main entrance on the west side of Bank Street and nearside of Lansdowne Way on the east. These will be used for day-to-day transit service and will be provided with bus shelters, as shown. Two more bus stops are identified in Figure 2-1: one nearside of the main entrance on the east side and one on the west side nearside of Wilton Crescent. The stop on the east side of Bank Street, at which there is a large area for transit passengers to wait, will be used as the main northbound OC Transpo stop for large stadium events. During larger special events the regular stop on the east side of Bank Street, nearside of Lansdowne Way, will be used for Kanata-bound special services. The stop on the west side of Bank Street, nearside of Wilton Crescent, will be used for southbound shuttle bus pick-up for those events for which shuttle bus services operate on Bank Street. Figure 2-1: Pedestrian Areas on Bank Street Primary Stop Special Event Stop Pedestrian Area 2.2 Day-to-day Operations The initial analysis undertaken for the July 2010 report 4 confirmed that OC Transpo will largely have sufficient capacity on existing transit service (routes 1 and 7) to accommodate the demand from the development at Lansdowne Park. It is anticipated that there will be a requirement to increase the frequency of service in the evenings and on Sunday afternoons. This service will be added through OC Transpo s normal planning and monitoring processes, as it would for any other new development in the city. 4 Transportation Impact Assessment Study and Transportation Demand Management Plan, July 2010 October 2011 Lansdowne Revitalization - 5
13 2.3 Arena Events with Attendance of less than 10,000 The arena regularly hosts the games of Ottawa s Ontario Hockey League team, the 67 s. These games generally take place on Friday evenings, starting at 7:30 PM and on Sunday afternoons starting at 2 PM. Attendance varies from 5,000 to 10,000, with average attendance being in the order of 7,000. In the 2010/11 season, there were 34 home games scheduled between late September and late March. For this analysis, events with attendance of 7,000 and 10,000 were selected as typical and extreme examples, respectively, of Lansdowne Park arena events. The strong Transportation Demand Management plan (described separately 5 ) proposes that transit services be provided free to and from events with the costs included in ticket prices. With this assumption, along with limited on-site parking, a 10% modal share to transit for these events should be achievable. Events with attendance of 7,000 and 10,000 will therefore attract 700 and 1,000 transit riders, respectively Transit Services Arena events at Lansdowne Park will be served by supplementing OC Transpo service, as required, on route 1. The times at which 67 s games take place coincide with relatively low frequencies (on Friday evenings the combined service frequency at Lansdowne Park on routes 1 and 7 is 4 trips per hour and on Sunday afternoons, 6 trips per hour). These will be improved marginally to accommodate the general Lansdowne development, but will not provide capacity for special events. It is proposed that service on route 1 be supplemented between Rideau Centre and Billings Bridge with an extension to Hurdman Transitway Station as presented in Figure 2-2. Figure 2-2: Supplemental Route 1 Transit Service Arena Events Route 1 Bank Street 5 Transportation Demand Management Plan: Lansdowne Revitalization October 2011 Lansdowne Revitalization - 6
14 If event-goers from the east-end are encouraged to use the southeast Transitway, rather than traveling into downtown and then south on Bank Street, journey times will be minimized and the use of buses optimized. If the information on special services were available well ahead of the event through OC Transpo s automated trip planner, this would be a highly effective strategy. It takes at least 42 minutes in-vehicle time to go from Place d Orléans to Lansdowne Park via the downtown, while Route 95 plus route 1 extended to Hurdman would take only 32 minutes. This routing also results in better balanced northbound and southbound transit demand on Bank Street. STO has agreed that for events of 10,000 or less taking place in the evenings or over the weekend, regular services will likely suffice and, if necessary, they will supplement busy routes. Gatineau transit users would transfer to OC Transpo services on Wellington or Rideau Street. A separate arrangement between STO and OC Transpo will be prepared to compensate STO for the reduction in fares collected due to the free transit with the presentation of event tickets Resources and Service Scheduling For events of this size the supplementary service is to operate for 60 minutes before the start of the event and for 60 minutes afterwards. With the service design described above for route 1, eight and twelve trips in each direction will need to be added between the Rideau Centre and Hurdman Station to provide adequate transit capacity to accommodate the transit demand for 7,000 and 10,000 person events, respectively. Since the route round trip is over one hour, eight vehicles will be required to be in operation for 7,000 person events and twelve for 10,000 person events. During the event, the additional buses will travel back to the OC Transpo St. Laurent garage and would be on stand-by waiting for service to resume after the event. After the event the same number of buses will provide service to downtown Ottawa and Hurdman Station from where regular service would have sufficient capacity. For 10,000 person events, supplementary service may also be needed on routes 12 and 118 which provide service to the Rideau Centre and Billings Bridge Station where passengers will transfer to route 1 for access to Lansdowne Park. The analysis suggests the need for an additional trip on each route to provide adequate transit capacity to accommodate the demand. The single inbound trip before the event and outbound trip after the event would be accommodated by either assigning articulated buses to scheduled regular route trips to increase carrying capacity and/or possibly making use of deadheading buses. Costs and resources for supplementary services on these routes are therefore not included for events with attendance of 10,000 persons or less. In-service hours includes 30 minutes of time before and after the event to get to and from the OC Transpo garage on St. Laurent Boulevard. Standby time includes the time that buses would be waiting at the OC Transpo garage during the event. Assuming that an arena event would last about three hours, buses would be on stand-by for 2.5 hours as 30 minutes is spent in operation returning to garage before the event and leaving garage after event. Hours of Operation = Hours of Standby = 30 minutes to/from Garage before event + Round Trip Time before game + 30 minutes to/from Garage after event + Round Trip Time after game Length of Event (Assumed to be 3 hours) - 30 minutes to/from Garage during event October 2011 Lansdowne Revitalization - 7
15 2.3.3 Costs The supplementary services required for events of 7,000 and 10,000 are summarized in Table 2-1. The table also shows the cost of the supplementary service in $2011 based on the hourly costs of $126 for in-service buses and $60 for stand-by periods. Table 2-1: Transit Service Requirements and Costs for Events with Attendance of 7,000 and 10,000 Supplementary Transit 7,000 10,000 OC Transpo Buses (standard) 8 12 In service hours Stand by hours Cost $ 4,560 $ 6,840 Cost per Ticket $ 0.66 $ 0.69 Transit passengers from Gatineau would access the site using OC Transpo route 1 as well which operates from the Rideau Centre to Lansdowne Park. The passenger demand on route 1 as described previously includes passengers from Gatineau that have transferred buses in the downtown to access the site. The total costs for additional transit would be covered in the ticket price, adding $0.66 to $0.70 to the price of each ticket. This cost covers the operation of supplementary service on route 1 from Rideau Centre to Hurdman Station to provide a 5 minute and 3.75 minute headway for an hour before and after 7,000 and 10,000 person events, respectively. 2.4 Stadium Events with Attendance of between 10,000 and 15,000 Small stadium events would generally fall into this category. For this analysis, events with attendance of 13,000 were selected as a typical example. The strong Transportation Demand Management plan proposes that transit services be provided free to and from events with the costs included in ticket prices. With this assumption, along with limited on-site parking, a 20% modal share to transit for these events should be achievable. Events with attendance of 13,000 will therefore attract approximately 2,600 transit riders Transit Services For stadium events with attendance of between 10,000 and 15,000 persons, both STO and OC Transpo transit services will be supplemented OC Transpo Services OC Transpo will take a similar approach to service provision as for arena events with attendance of less than 10,000. Route 1 will be supplemented and extended to Hurdman Station but there will also be a requirement for supplementary service on routes 12 and 118 to support east and west Ottawa as well as on Transitway routes 95 and 96 to support suburban areas such as Orleans, Kanata and Barrhaven as presented in Figure 2-3. In addition, OC Transpo will supplement service on route 7 between Carleton University and Lansdowne Park to provide shuttle service to and from Lansdowne for people using the satellite parking facility. This is considered separately in Section 3 with off-site parking and shuttle services. October 2011 Lansdowne Revitalization - 8

16 Figure 2-3: Supplemental Transit Services Small Stadium Events STO Services For events with attendance of greater than 10,000 but less than 15,000, STO will supplement regular services as required. It is estimated that a total of 430 transit passengers will use Gatineau services for an event of 13,000 and STO has agreed that, while there will be a need to supplement regular service, this will be relatively minor. Gatineau transit users would transfer between STO routes on Wellington or Rideau Street to OC Transpo Routes 1 or 7 operating on Bank Street with service to Lansdowne Park Resources and Service Scheduling OC Transpo To accommodate the transit demand on route 1 between the Rideau Centre and Hurdman Station for an event of 13,000, fourteen trips per hour will need to be added using articulated buses. Considering the 70 minute round trip time for route 1 and the distribution of passenger demand over 1.5 hours, 17 in-service articulated buses will be required to accommodate the transit demand. Other routes requiring supplementary service are regular routes 12 and 118 which provide additional east-west services that connect to route 1 at the Rideau Centre and at Billings Bridge. Two additional articulated vehicles will be required for route 12 while route 118 will require an additional three vehicles in service. Transitway routes 95 and 96 would also require some supplementary service to accommodate additional transit passengers from Orléans and Kanata. Two additional articulated buses will be required for each route to provide the required transit capacity. In-service hours includes 30 minutes before and after the event to get to and from the OC Transpo Garage. The service is to operate beginning 90 minutes before the event and will terminate 90 minutes after the event. Standby time includes the time that buses would be waiting at the OC Transpo Garage during the event. Considering events of this size would likely be about October 2011 Lansdowne Revitalization - 9
17 3 hour in duration, buses would be on stand-by for 2.5 hours as 30 minutes is spent in operation returning to garage before the event and leaving garage after event. An additional three OC Transpo vehicles are also included as extras to be introduced into service as required. Costs for these extra vehicles are also included as 5 hours of service per bus STO Services Transit passengers from Gatineau would access the site using OC Transpo route 1 or 7. The passenger demand on route 1 as described previously includes passengers from Gatineau that have transferred buses in the downtown to access the site. An additional 3 STO vehicles is proposed to supplement service as required. The analysis includes 5 hours of in-service operation with no standby per vehicle Costs The supplementary services required for events of 13,000 are summarized in Table 2-2. The table also shows the cost of the supplementary service in $2011 based on the hourly costs of $126 for in-service buses and $60 for stand-by periods. Costs for OC Transpo include supplementary transit services on route 1, 12, 118, 95 and 96. The costs below do not include the additional service on route 7 to accommodate satellite parking at Carleton University. Costs include the operation of 3 extra buses for 5 hours each for both OC Transpo and STO. Table 2-2: Transit Service Requirements and Costs for Events with Attendance of 13,000 Supplementary Transit 13,000 OC Transpo Buses (articulated) 26 In service hours 124 Stand by hours 65 Cost $19,520 Extras OC Transpo Buses (articulated) 3 In service hours 15 Stand by hours Cost $1,890 STO Buses (standard) 3 In service hours 15 Stand by hours Cost $1,890 Total Cost $ 23,300 Cost per ticket $ 1.80 This would add approximately $1.80 to the price of tickets to cover additional transit services for events of this size. This cost is for operating a supplementary route 1 service from Rideau Centre to Hurdman Station as well as additional trips on route 12, 118, 95 and 96 for 90 minutes before and after a special event. The cost also includes 3 extra buses in both Ottawa and Gatineau. October 2011 Lansdowne Revitalization - 10
18 2.5 Stadium Events with Attendance more than 15,000 Events with an attendance larger than 15,000 would include all CFL football games and other sports and concerts that are likely to take place regularly at the site. The analysis considers events of 18,000 and 25,000 as representative of average and sold-out stadium events, respectively. Large stadium events in excess of 25,000 would not be a regular occurrence and are not considered in as great detail. An event of 40,000 is discussed as representative of a large event. The Transportation Demand Management plan proposes that transit services be provided free to and from events with the costs included in ticket prices. With this assumption, along with limited on-site and on-street parking, a 20% modal share for transit should be achievable for events between 15,000 and 25,000. Events with more than 25,000 are expected to attract a 25% transit mode share. The following table presents the mode shares and transit demand for stadium events larger than 15,000. Table 2-3: Transit Demand for Stadium Events larger than 15,000 Attendance 18,000 25,000 40,000 Transit Mode Share 20% 20% 25% Transit Passengers 3,550 4,925 10, Transit Services For stadium events with attendance in excess of 15,000, both transit agencies (STO and OC Transpo) will operate a series of special routes designed to minimize travel times to Lansdowne Park, to provide direct service from major suburban Park and Ride lots, and to achieve a high transit modal share. Services will differ before and after events to simplify transit operations on Bank Street following events. Events between 15,000 and 25,000 would include service on these routes for approximately 90 minutes before and after events. Larger events would include transit service for 2 hours before and after OC Transpo Services For events with attendance of greater than 15,000, OC Transpo will run five special routes before the event as presented in Figure 2-4. The routes would travel directly to Lansdowne Park from the following areas: Terry Fox, Eagleson (Kanata) 1,700 Park and Ride spaces; Strandherd, Fallowfield (Barrhaven) 1,361 Park and Ride spaces; Greenboro (SUC / Leitrim) 678 Park and Ride spaces; Trim, Place d Orleans (Orleans) 1,184 Park and Ride spaces; and Bells Corners / Baseline Road Corridor. The special services are expected to carry about half of the transit users. Other event-goers who choose transit will use regular service, supplemented as required by additional trips. Route 1 and route 12 will be supplemented prior to an event to provide improved headways and enhanced transit capacity. There will be no need to supplement Transitway routes because of the special routes that will be in operation. October 2011 Lansdowne Revitalization - 11

19 Figure 2-4: Special OC Transpo Transit Routes Only a portion of route 1 between the downtown and Billings Bridge will need to be supplemented therefore a variation to the existing route is proposed for these events with termini at LeBreton and at Billings Bridge as presented in Figure 2-5. Figure Supplemental Route 1 Transit Service Stadium Events Route 1 Bank Street After events, it is planned to simplify the services on Bank Street as much as possible by operating the special routes, with the exception of the Kanata-bound route, from Billings Bridge Transitway Station. Transit passengers would therefore use a supplemented Route 1 service to October 2011 Lansdowne Revitalization - 12


20 access Billings Bridge Station where passengers would transfer onto their appropriate special service. Passengers will board any southbound bus at the stop on the east side of Bank Street, nearside of Aberdeen Way. At Billings Bridge Station, separate platform areas will be provided for each special route to simplify passenger way finding as presented in Figure 2-6. Kanata-bound passengers will use the regular northbound stop nearside of Lansdowne Way. OC Transpo service to downtown (northbound) will be supplemented on Bank Street, turning west on Albert Street to LeBreton. This route provides connections to the supplemented route 12, Ottawa s Transitway and special event routes being operated by STO from LeBreton. This northbound service to downtown will use the stop nearside of Aberdeen Way. Figure 2-6: Special OC Transpo Transit Routes Outbound Following Events Billings Bridge Station STO Services For events with attendance of greater than 15,000, STO will run three special routes before the event as presented in Figure 2-7. The routes would travel directly to Lansdowne Park from the following park and ride lots: Rivermead (Aylmer sector) 507 spaces Les Promenades (Gatineau sector) 300 spaces Centre Robert Guertin (Hull sector) 120 spaces October 2011 Lansdowne Revitalization - 13


21 The special STO routes prior to the event will travel from Downtown Gatineau over the Chaudière Bridge, and use Bronson Avenue and Sunnyside for access to Lansdowne Park. This will ensure that passengers are dropped off on the east side of Bank Street minimizing pedestrian conflicts in the area. Figure 2-7: Special STO Transit Routes from Park and Ride Lots After the event, STO will run the three special routes back to the park and ride lots from LeBreton. To reduce crowding on Bank Street, Gatineau bus-users will take frequent OC Transpo northbound service from the bus stop near-side of Aberdeen Way at Lansdowne Park to connect with the Gatineau service at LeBreton. Figure 2-8: Special STO Transit Routes Outbound Following Events Route 1 Bank Street October 2011 Lansdowne Revitalization - 14
22 STO does not believe that significant supplementary services will be required over and above the special service routes that are planned. However, should supplementary services be required, extra buses will be provided on busy routes to meet the demand. STO will use their articulated bus fleet as far as possible to avoid the need to supplement regular services. This will become increasingly possible as the size of STO s articulated bus fleet grows in the next few years Resources and Service Scheduling OC Transpo For large stadium events (25,000 and more) demand supports at least 15 minute service for all routes. However, for events with only 15,000 the service frequency required by the projected demand would be lower. For transit service to be as attractive as possible, it is proposed that a minimum of three trips an hour (20-minute headway) be operated for all OC Transpo special routes for stadium events of all sizes. This will ensure that the service will be attractive to eventgoers and that the projected transit modal share of at least 20% is achieved. Special and supplementary transit routes would operate for 1.5 hours prior to and following events with an attendance of 25,000 or less and the length of the event is assumed to be 3 hours. Larger events would provide transit services for 2 hours before and after the event and the length of the event is assumed to be 4 hours long. The number of buses and the cost required to provide this service will vary depending on whether intra-lining or inter-lining is used to schedule the service. With intra-lining, all scheduled trips on a route are linked together into vehicle blocks on that route. Therefore, when a trip is completed, the bus deadheads back to the start of the same route to do the next available trip. With inter-lining, trips can be linked to any other trip on any other route. This means when a trip is completed, the bus is deadheading to the next available trip on any route. The technique of inter-lining is an optimization strategy that is used extensively by OC Transpo where opportunities exist to produce efficient schedules and realize cost savings. The potential for savings are greatest when there are many one way trips on many routes with either a common origin or destination point centrally located. The special event service, although offering limited routes and trips, does have a central common location at Lansdowne Park. Overall, special event services represent just over half of all OC Transpo transit costs for stadium events so any savings resulting from inter-lining will have an impact on the bottom line. In the preparation of this plan, OC Transpo scheduling staff was involved in developing costeffective schedules for these special routes for events with attendance of 18,000, and 25,000 persons. This was done by assuming the services will be interlined using dead-head connections to minimize the number of buses required. The consultant identified the routings and frequency of service for each route and estimated the travel times for both the revenue and deadhead links. These were then reviewed with OC Transpo and, where necessary, adjustments made to reflect their operational experience. OC Transpo created the base schedule data in their production scheduling software package, Hastus, and then used the inter-lining Hastus module, known as Minbus, to produce the final schedules and vehicle requirements. This was done for both the before and after event service. The schedules can be found in Appendix C. The post-event service connecting Lansdowne Park to Billings Bridge Station was also included in the Minbus-produced schedules. The analysis has identified that 20 and 28 buses would be October 2011 Lansdowne Revitalization - 15
23 required to operate the special routes for 18,000 and 25,000 person events and that 34 buses would be required for events of 40,000 people. Route 1 will be supplemented with an additional 9, 12 and 16 buses to provide the required service frequency for the 18,000, 25,000 and 40,000 person event, respectively. Additional buses are also required for route 12. Three buses are included as extras to be added into service for 18,000 and 25,000 person events, while 40,000 person events would require 6 buses to be added into service. The following table summarizes the service frequencies to be provided. Table 2-4: Transit Service Headways for Stadium Events larger than 15,000 Attendance 18,000 25,000 40,000 Transit Span 90 minutes 90 minutes 2 hours Special Routes Kanata 15 min 10 min 8.5 min Barrhaven 20 min 15 min 12 min SUC/Leitrim 20 min 15 min 12 min Orleans 15 min 10 min 7.5 min Bells Corners / Baseline 15 min 10 min 8.5 min Supplementary Routes Route min 3.5 min 3 min Additional buses are also included as extras that can be introduced into service as required. A total of 3 additional buses for medium sized events (15,000 to 25,000) and 4 buses for large events (25,000+) should be secured STO STO staff was involved in determining the transit service that will be provided to accommodate their residents. The three special routes will operate from the park-and-ride lots in Gatineau directly to Lansdowne Park for 1.5 hour prior to a medium sized event (less than 25,000) and for 2 hours prior to a large event. Following an event, Gatineau residents will use Ottawa s northbound route 1 on Bank Street to Lebreton flats where the STO special routes will depart. The service will be more condensed after than before the event to accommodate the departing event goers within 1 hour and minimize passenger waiting at LeBreton. Bus drivers in Gatineau operate with 2-hour blocks, and in-service costs are not significantly different than standby costs, therefore the estimate includes 2 hours of service following the game. Costs are not included for standby time during the event. Regarding supplementary services, it is proposed that STO secure 3 additional buses for medium sized events (15,000 to 25,000) and 4 buses for large events (25,000+) to be added to service as required Costs Table 2-5 summarizes the special services that will be operated and associated resources for special events of sizes 18,000, 25,000 and 40,000. The costs are presented in $2011. October 2011 Lansdowne Revitalization - 16
24 Table 2-5: Transit Service Requirements and Costs for Events with attendance larger than 15,000 SPECIAL SERVICES 18,000 25,000 40,000 OC Transpo Buses (articulated) In service hours Stand by hours Cost $ 10,800 $ 13,800 $28,600 STO Buses (articulated) In service hours Stand by hours Cost $2,600 $6,000 $14,400 SUPPLEMENTARY SERVICES 18,000 25,000 40,000 OC Transpo Buses (articulated) In service hours Stand by hours Cost $ 9,200 $12,200 $25,200 EXTRA 18,000 25,000 40,000 OC Transpo Buses (articulated) In service hours Stand by hours Cost $ 1,900 $ 1,900 $ 2,500 STO Buses (articulated) In service hours Stand by hours Cost $ 1,900 $ 1,900 $ 2,500 Total Buses Required TOTAL TRANSIT COSTS $ 26,400 $ 35,800 $ 73,200 Cost per Ticket $ 1.47 $ 1.43 $ 1.83 The additional ticket price to cover the costs of transit services will be $1.50 for events with attendance of 18,000 and 25,000. Larger events (attendances of 40,000) would have a higher transit share and would result in a cost of approximately $1.85 per ticket. 2.6 Service Supervision and Work Coverage Service supervision procedures for these events will evolve as experience is gained. Therefore the objective of this section is to provide a starting point for operations when Lansdowne Park events come on stream. Regular OC Transpo and STO service is centrally monitored and controlled. All buses are equipped with GPS SmartBus devices and their positions and schedule adherence are known at all times. However, for Lansdowne Park special events, this control will need to be augmented by on-site supervisory staff resources. It is expected that, early on, because services that people are not used to will be operated, there may be a need to supplement supervisory staff with customer service staff. October 2011 Lansdowne Revitalization - 17
25 The level of service supervision will depend on the size of the event. For smaller events (7,000 and 10,000) OC Transpo will have a supervisor on-site an hour before the event, and again as the event finishes until most event-goers have been dispersed. Early on, there may also be a need to have a supervisor stationed at Hurdman Transitway Station after the event. For larger events there will be a need for good coordination between OC Transpo and STO. An OC Transpo supervisor will be assigned to coordinate services for each event with the assistance of other supervisory staff. It is anticipated that there will be a need to have supervisors on-site for 90 minutes before the event start-time and for half an hour before the event ends until the crowds disburse. There will also be a need for supervisory staff to be stationed at Billings Bridge after the event to manage the departure of special services. For all events, OC Transpo and STO will maintain close communication through their control centres. For events when STO operate special routes, it will be necessary to have an STO supervisor at LeBreton after the event to oversee the Gatineau-bound service. For the largest events (over 25,000 and up to 40,000), the scope and level of supervision and management expands significantly. With very large crowds and road closures there is much more need for Ottawa Police Services (OPS) involvement and traffic management. For the purposes of this report this aspect is not addressed since these events are very rare and detailed information is available from past events, e.g. the Grey Cup. It is assumed that, to cover the work reliably, it will be necessary to package the work before and after the event as one work shift. The operational plan is for most OC Transpo drivers to return to St. Laurent garage during the event. This has the advantages of allowing operators to wait in the operators room where they have access to washrooms, refreshments and a climate-controlled waiting area, as well as facilitating supervision, operational control and flexibility. There would be an OC Transpo supervisor at Lansdowne Park throughout the event who would make the call about when the buses should leave the garage and go into service after the event. STO buses dedicated to special services for both before and after events will be scheduled as different work-shifts, providing maximum operational flexibility. This is possible because of the very much smaller number of operators required for STO services. 2.7 Restrictions on Timing of Events The availability of buses to provide service for larger events will be an important factor in the programming of Lansdowne Park special events. OC Transpo and STO both have as a priority the provision of peak period service for regular customers which employs the vast majority of their active fleets. This means that events on weekday evenings should be timed so that the required buses are available without compromising the afternoon peak period service. Therefore for special events on weekday evenings the start time should be no earlier than 7:30PM In addition, both OC Transpo and STO fall under Federal Government work-rest rules that call for bus drivers to have a minimum of eight hours of consecutive time off during a 24-hour period. The rules also restrict the number of hours a driver can work in any 24-hour period to 14 hours of duty, of which a maximum of 13 hours can be platform time. An examination of the implications of these rules for what could potentially be a five-hour event (e.g. a football game with overtime) shows that evening events could only take place on Fridays and Saturdays. Otherwise, drivers would not have the minimum eight hours off before the following day s morning peak service, which starts between 5:30 and 6:30AM. On Sundays, the latest start time October 2011 Lansdowne Revitalization - 18
26 for a stadium events with attendance of 10,000 to 25,000 would be 3:30PM; for very large events (>25,000), it would be 2PM. In summary, the restrictions on event times arising from transit service requirements are as follows: Events with attendance of <10,000: Arena events of up to 10,000 people can be operated on any evening with supplemented transit service without compromising the peak period service on the following day. Start times should be no earlier than 7:30PM. Events with attendance of >10,000: Evening events on Fridays and Saturdays only; earliest start time 7:30PM. Saturday daytime; no restrictions on start time Sunday latest start time 3:30PM. Events with attendance of >25,000: Same as for medium events, except Sunday latest start time 2PM. This analysis considers that bus drivers shifts would extend through the actual event. If some shifts could be divided into pre- and post-game duties, this would reduce the impact of the 24- hour work restrictions. However, in practice this would be very difficult because the work would be covered by voluntary overtime, and short pieces of work are unlikely to attract enough drivers. More detail about the restrictions on event timing arising from constraints on transit service provision is provided in Appendix F. October 2011 Lansdowne Revitalization - 19
27 3. SHUTTLE SERVICES AND OFF-SITE PARKING PLAN 3.1 Introduction Transit and Shuttle Service Plan The provision of convenient, well-publicized satellite parking connected to Lansdowne Park by frequent shuttle service is a key element in the Transportation Demand Management (TDM) Plan. The satellite parking and shuttle service will be perceived as free to the user as its costs will be included in the event ticket price. The attendance level at which satellite parking will be required is tied to the assessment of available on-site parking and neighbourhood on-street parking. This is discussed in a separate report 6. Analysis of the neighbourhood parking and on-site parking likely to be available has confirmed that there will be an estimated supply of between 3,100 and 3,400, with of these being on-site. The approximate requirements for satellite parking for events of various sizes are shown in Table 3-1. Table 3-1: Satellite Parking Requirements 7 Event Size Satellite Parking Spaces Required 7, , , , , , With limited on-site and on-street parking, events with attendances larger than 10,000 would require satellite parking to be made available with associated transportation services to connect the parking areas to Lansdowne Park. For events with attendances of between 10,000 and 15,000 persons, satellite parking will be provided at Carleton University. For these events the shuttle service will be provided by supplementing OC Transpo route 7 services between Carleton and Lansdowne Park. The supplementary service would need to dead-head on Fifth Avenue between Bank and Bronson to provide efficient service - westbound before the event and eastbound afterwards. For larger events up to 25,000 parking will be provided at Carleton University, Canada Post surface parking and if necessary at Vincent Massey Park. When more parking is required, the structured parking at Canada Post would be utilized. Special shuttle service will be provided to connect the satellite parking with Lansdowne Park. For events larger than 25,000 additional satellite parking will be provided at other City of Ottawa facilities including Ottawa City Hall, Mooney s Bay, and at the new trade show centre. This section discusses the need for satellite parking, where it can be provided, how passengers will travel to and from Lansdowne Park, management and operating costs of this service. 6 Traffic and Parking Management Operational Plan 7 Assuming 3,250 cars can be accommodated on-site and in the neighbourhood for events up to 25,000. October 2011 Lansdowne Revitalization - 20
28 3.2 Satellite Parking Requirements The amount of satellite parking required is a function of: the size of the event; the transit modal share; the amount of walking and cycling; auto occupancy; and available on-site and neighbourhood parking. Transit and Shuttle Service Plan Table 3-2 shows the number of autos that would be expected to be used for events of various sizes depending on auto-occupancy and transit modal share assumptions. For the development of the service plan the high-lighted middle-range values are used. Table 3-2: Vehicle Parking Volumes Sensitivity Analysis of Vehicle Occupancy and Transit Modal Share Vehicle Occupancy Event Size 7,000 10,000 13,000 18,000 25,000 40,000 Transit Modal Share 10% 10% 20% 20% 20% 25% Cars (2 occ) Cars (2.5 occ) ,900 Cars (3 occ) Transit Modal Share 5% 7.5% 10% 15% 15% 20% Cars (2 occ) Cars (2.5 occ) Cars (3 occ) Transit Modal Share 3% 5% 5% 10% 10% 15% Cars (2 occ) Cars (2.5 occ) Cars (3 occ) For the purposes of this analysis 500 parking spaces have been assumed to be available on-site and approximately 3,000 on-street spaces for evening and 2,500 for day-time events of 25,000 persons or less. In the analysis 2750 spaces have been assumed. These, together with the on-site parking would accommodate approximately 3250 cars. Events with more than 25,000 persons would have no on-site parking available as spaces would be reserved for media parking and event services. The following table presents the parking spaces that are required as well as the available on-street and on-site parking for each event size. Table 3-3: Parking Supply and Demand Satellite Parking Requirements Event Size 7,000 10,000 13,000 18,000 25,000 40,000 Parking Spaces Required 2,235 3,190 3,560 4,925 6,840 9,860 On site Parking Available On street Parking Available 2,750 2,750 2,750 2,750 2,750 2,750 Satellite Parking Required 310 1,675 3,590 7,110 October 2011 Lansdowne Revitalization - 21
.")

29 3.3 Parking Lots Available Transit and Shuttle Service Plan As part of the development of the preliminary plan, several conveniently situated parking lots were identified as being suitable for satellite parking (Figure 3-1). The City of Ottawa Legal Team has negotiated Memoranda of Understanding with the lot owners and the conditions in these are summarized in Table 3-4. Figure 3-1: Off Site Parking Locations City of Ottawa City Hall Carleton Vincent Massey RA Centre Canada Post Brookfield High School October 2011 Lansdowne Revitalization - 22
30 # Location Size Management 1 Carleton University 1,250-1,500 Transit and Shuttle Service Plan Table 3-4: Summary of Off Site Parking MOU Agreements Discretion of Carleton University. LPP can provide support / management on event day. 2 Canada Post 1,500 Discretion of Canada Post. 3 PWGSC (Vincent Massey) 4 Brookfield H.S LPP can provide support / management on event day. 600 Discretion of PWGSC LPP can provide support / management on event day. 180 Discretion of the Board. LPP can provide support / management on event day. Event Charge / Rate per Vehicle To be determined. Dependent on management of lot. Payment terms can be fixed per event or based on actual usage. To be determined. Rates/charges to be based on time, duration. To be determined. Rates/charges to be based on time, duration, who is managing lot. Payment can be fixed per event or based on actual usage. To be determined. Based on time and duration of use. Minimum $500 flat fee. Flat fee waived if total parking fees greater than flat fee. (i.e. minimum vehicle fees of $5.00 car/$15.00 bus) Comments Staff discussions on applying Carleton flat rate and sharing net profits. A maximum of 8 events per season contemplated. Notice of events 60 days in advance. Wk night: 17:30 5:30 Wknd/holiday: 12:00 5:30 15 days notice required prior to events. Prefer to use lot for staging area for buses to Can Post & PWGSC. Board retains 10% of lot (20 spaces). 5 RA Centre 300 Discretion of RA Center. 6 City of Ottawa LPP can provide support / management on event day. To be determined. 750 Contractor Set by Council $3.75 / vehicle Rates/charges to be based on time, duration, who is managing lot. Payment can be fixed amount or based on usage. Staff discussions at $5 to $6 per car. Notice of events required in June each year events per year The three main lots that are to be used for special events include Carleton University, Canada Post and Vincent Massey Park. When additional parking is required, the other lots will be considered. In the course of the preparation of this plan, site visits and meetings were held with those responsible for the operation of Carleton University and Canada Post parking lots to develop a better understanding of the way in which satellite parking at those lots would be managed. October 2011 Lansdowne Revitalization - 23

31 3.3.1 Carleton University Carleton University is located within 2 km of Lansdowne Park and is therefore recommended as the primary satellite parking facility for special events. Lot 7 is the primary lot that is to be used first. Once this lot reaches capacity, Lot 6 will be used followed by lot 5. Parking Facilities October 2011 Lansdowne Revitalization - 24

32 Table 3-5: Satellite Parking at Carleton University Lot Number Total Spaces Available for Event Total Vehicle Access Vehicles can access all three lots from University Road and Campus Avenue which connect to Bronson Avenue and Colonel By Drive. The 3 lots operate with a pay and display system and do not require crossing a gated access. Shuttle Routing Shuttle buses will be able to circulate through the lots to turn around. Passengers will be able to board/alight the shuttle near the lot access. Operation and Maintenance Carleton University charges a fee of $6 per vehicle to cover operation and maintenance of the facilities. Considering that the cost of event parking will have been included in the ticket price, there needs to be a process for documenting the number of satellite parking vehicles at Carleton University. It is proposed that event staff check event tickets at the lot entrance, and issue a parking pass for event day. The event staff can therefore keep a record of how many passes have been issued and each vehicle would display the pass consistent with the University s pay and display system Canada Post The Canada Post parking facility is located approximately 3.5 km from Lansdowne Park and approximately 1.5 km from Carleton University. There is both surface and structured parking at this location. The surface parking is to be used prior to using the structured parking is a conservative estimate of the minimum number of spaces and in reality more space would be available. A total of 1500 spaces are considered for Carleton University. October 2011 Lansdowne Revitalization - 25

33 Parking Facilities Table 3-6: Satellite Parking at Canada Post Total Spaces Available for Event Surface Parking Structured Parking Visitors Area On street/metered Accessible Parking Total Vehicle Access: Vehicles can access the facility from Brookfield Road or Heron Road. Structured and surface parking lots share a two access point each with 2 lanes. The lot is gated and operates with automated systems; no attendant. The visitors parking lot is also gated and has an attendant during business hours Spaces are leased to PWGSC. An agreement would be required to allow use of these reserved spaces for events. The analysis will consider a total of 1500 spaces at Canada Post. October 2011 Lansdowne Revitalization - 26


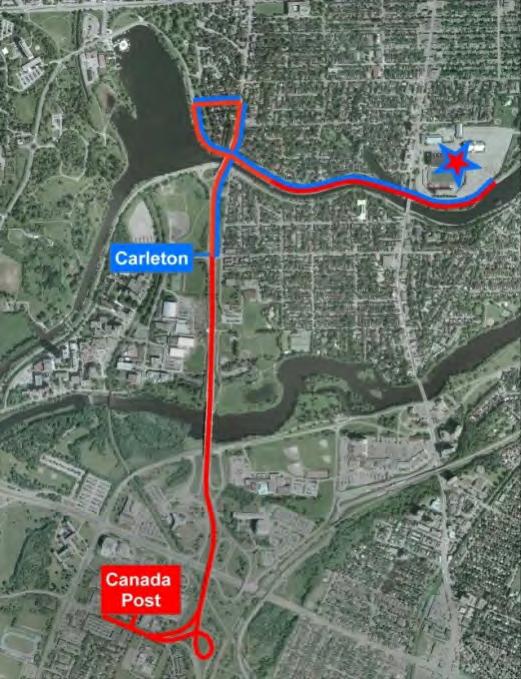
34 Shuttle Routing There are 2 shuttle routing that are considered for this site depending on whether the bus would operate on QED or Bank Street. When the Vincent Massey Parking facility is in use, the same shuttle will service both lots. That shuttle route is shown in the section Operation and Maintenance Canada Post Parking is currently operated and maintained by Standard Life for daily operations. For special events, the parking will be made available to OSEG, as long as operations, management, and cleaning be undertaken by a third party. The operator would need to be approved by Canada Post and Standard life to ensure that the service would be satisfactory and that any damage / injury be the responsibility of the operator. To be consistent with Carleton University parking fees, a $6 per vehicle fee is assumed. During special events, the gates would be left open and the management of the lots would be the responsibility of the operator. The operation will be similar to that of Carleton with event staff issuing parking slips upon arrival to the facility which are to be displayed in the vehicle window PWGSC Confederation Heights Once the Canada Post surface parking is occupied, this lot will also be included for satellite parking. It is in close proximity to the Canada Post parking and would be serviced with the same shuttle bus. Parking Facilities There are two lots located at Vincent Massey Park. One lot has few spaces and is intended for visitors of Vincent Massey Park. This lot will not be used for satellite parking and access will remain unimpeded by shuttle traffic. The second lot has space for 600 vehicles and will be used for satellite parking. October 2011 Lansdowne Revitalization - 27

35 Vehicle Access: Access to this parking facility is provided from both eastbound and westbound Heron Road. Shuttle Routing The shuttle will service both the Vincent Massey Lot and the Canada Post Lot. There are two shuttle routings that are considered; using QED and using Bank Street. With both options, buses would be on Heron Road westbound either from Bronson Avenue or Data Centre Road. Shuttle buses would enter the Vincent Massey Parking Area and would travel under Heron road using the internal Vincent Massey Park roadway. The shuttle buses would then merge onto eastbound Heron Road and travel to the Canada Post Parking as presented below. From Canada Post, buses would either be routed to Brookfield Road and use Bronson and the QED, or they would circulate around the surface& Structured lot and return back onto Heron Road to Data Centre and Bank Street. Operation and Maintenance A similar arrangement will be considered as for the operation and maintenance of the Canada Post Parking Lot. The regular operator does not want to be responsible for special event operations and maintenance. 3.4 Satellite Parking for Events between 10,000 and 15, Parking Facilities For events of between 10,000 and 15,000, some satellite parking will be required. A maximum of 850 spaces would be required which could be accommodate at Carleton University, the parking lot closest to the site with capacity of up to 1500 spaces. The university can provide three lots each with varying capacities. Lot 7 would be the primary lot where event-goers will be directed to park. Once the lot is at capacity, Lot 6 would be used. Should both lots 6 and 7 reach capacity, lot 5 could also be used, although the university would prefer to retain this lot for students and faculty as long as possible as it is directly adjacent to the Carleton sports facility. October 2011 Lansdowne Revitalization - 28

36 3.4.2 Transportation Services For these events the shuttle service will be provided by supplementing OC Transpo route 7 services between Carleton University and Lansdowne Park. The supplementary service would need to dead-head on Fifth Avenue between Bank and Bronson to provide efficient service - westbound before the event and eastbound afterwards - requiring parking restrictions on that section of Fifth Avenue. Supplementary Route 7 trips would operate on Sunnyside both to and from Lansdowne Park, signed as Route 7- Special. Figure 3-2: Supplementary service on route 7 for events with attendance between 10,000 and 15,000 Route 7 Carleton to Lansdowne Resources and Costs There is a cost associated with the operation and maintenance of the parking facility as well as the additional transit service to transport people to/from Lansdowne Park. This cost will be included in the ticket price as described in the TDM plan. The existing evening and weekend rate for parking at Carleton University is $6.00 per vehicle. This price includes the regular operation and maintenance and cleaning of the lots. It does not include the additional staff resources to check/issue parking passes, nor does it include the additional signage and way-finding within and surrounding the parking facilities that would be required for special events. Signage would be required for vehicles to locate the parking facility in relation to Lansdowne Park, and for people to locate the shuttle pick-up / drop-off area. A cost of $6 per vehicle is included in the analysis as the use of the facility. The additional transit service is to operate for 1.5 hours before the start of an event and for 1.5 hours after the event. During the event it is assumed that the buses return to the OC Transpo garage and standby until the post-event service commences. After the event, the service can be more peaked since people generally all exit at once. This would mean using articulated buses or adding more buses to the route, but the in-service hours would be reduced and should be considered if the resources are available. The following table presents the total cost of parking as well as for transportation to/from Lansdowne Park for events with attendance of between 10,000 and 15,000. October 2011 Lansdowne Revitalization - 29
37 Table 3-7: Shuttle Service Requirements and Costs for Events with Attendance between 10,000 and 15,000 Attendance 13,000 15,000 Parking Number of Vehicles Cost per Vehicle $ 6.00 $ 6.00 Cost $ 1,860 $ 5,130 Supplemented Route 7 Buses 5 standard 8 articulated In service hours Stand by hours Cost $ 3,300 $ 5,230 Total Cost $ 5,160 $ 10,360 Cost per Ticket $ 0.40 $ 0.69 The additional service on Route 7 would be operated with a maximum of 5 minute headways for these events. 3.5 Satellite Parking for Events between 15,000 and 25, Parking Facilities For events with attendances of 18,000 and 25,000 persons, a total of 1675 and 3590 satellite parking spaces would be required, respectively. All three Carleton University lots (Lot 5, 6 and 7) would provide a total of 1,500 parking spaces therefore additional satellite parking facilities would be required. Parking at the Canada Post surface parking lot with 850 spaces would also be used for events larger than 15,000. Events larger than 20,000 require the use of the Vincent Massey parking facility in addition to Canada Post and Carleton University, providing an additional 600 spaces. The Canada Post structured parking lot with approximately 650 more spaces would only be used if all other lots have reached capacity Transportation Services For special events with attendance of 15,000 or more, special shuttle services will be provided from the satellite parking lots to Lansdowne Park. For purposes of analysis, events in this size range, events of 18,000 and 25,000 attendance were selected. For these events 4,190 and 8,975 event-goers, respectively, are estimate to use that park at the satellite parking facilities. A shuttle service will therefore operate between the satellite parking lots and Lansdowne Park. Two shuttle routes are proposed; one with service from Carleton University, and another that services Confederation Heights including the Canada Post facility as well as Vincent Massey Park. There are two possible shuttle routings that are being considered. The shuttle could operate on Bronson Avenue / Lakeside Avenue / Queen Elizabeth Driveway with direct service to Lansdowne Park although the NCC has a policy that prohibits the operation of commercial vehicles on the Driveway. An alternative using Heron / Data Centre / Sunnyside / Bank Street was therefore developed Agreement with National Capital Commission A Letter of Intent between the City of Ottawa and the NCC provides for a three-year pilot period during which the use of the Driveway for satellite parking shuttle services will be permitted on some occasions, even though this is not consistent with NCC s policies that restrict use of the October 2011 Lansdowne Revitalization - 30
38 Driveway by commercial vehicles. During this three-year pilot period the concept of running the shuttle services on Bank Street will also be tested. The Letter of Intent includes an objective to reduce the requirement for satellite parking and shuttle service over time by the encouragement of other modes (transit, cycling and walking). Key objectives to encourage sustainable transportation are addressed in the Transportation Demand Management Plan 10. It also includes a commitment for public consultation during the pilot project period to ensure that a mechanism for the transmission of concerns and ideas for improvement is available. The plan for the operation of satellite parking shuttles for Lansdowne Park outlined in this report is consistent with this agreement. It is proposed to make satellite parking available for stadium events with attendance of greater than 10,000 but, for events with attendance less than 15,000, to provide shuttle services to and from Lansdowne Park in the form of supplementary service on route 7 between Carleton University and Lansdowne Park (i.e. using Bank Street). For larger events (15,000+) shuttle service will run on Queen Elizabeth Driveway for some events and on Bank Street for others. The impacts of the shuttle operations on the Driveway and on Bank Street will be monitored and subject to review annually. For very large events with attendance of 40,000+ the shuttles will run on Queen Elizabeth Driveway will likely be closed between Laurier and Preston Street, as will Bank Street from Sunnyside to Fifth Avenue Shuttle Buses on Queen Elizabeth Driveway The shuttle services would operate on Bronson Avenue, Lakeside Drive and Queen Elizabeth Driveway (as shown in Figure 3-3) to the shuttle drop-off and pick-up facility on the northeastern side of Lansdowne Park and return to the parking lot, taking the same route, to repeat the circuit. For this to be possible, a modification to the intersection of Lakeside Drive and Bronson Avenue to allow a northbound to westbound left turn by transit buses will be necessary. This option enables people to be picked up and dropped off at the same stop on site at Lansdowne and avoids conflict between the large numbers of shuttle-users (8,975 for a 25,000 event) and vehicular traffic Shuttle Buses on Bank Street In accordance with the agreement with NCC, for some events of more than 15,000 shuttle services will run on Bank Street to determine the impact of this arrangement. In this case, before the event, shuttle buses from Carleton University would travel north on Bronson, East on Fifth Avenue and south on Bank Street, dropping passengers off on the west side of Bank Street, at the main bus stop north of the main entrance. They would then return to Carleton via Sunnyside and repeat the circuit. From the Canada Post lot, or Vincent Massey Park, they would travel north on Bank Street to Lansdowne Park, dropping passengers at the transit stop south of the main entrance. They would return to Canada Post or Vincent Massey Park via Fifth Avenue and Bronson to repeat the circuit. After the event it will be a challenge to accommodate shuttle buses on Bank Street given the large crowds of both shuttle bus users and transit riders waiting for service. Shuttles bound for Carleton University will use a stop on the west side of Bank Street, south of Wilton Crescent. Using this stop will require police assistance to allow the crowds that will be emerging on the east side of Bank just across from the stop, to safely cross Bank Street. It is unlikely that they 10 The TDM Plan is a separate document which includes the Letter of Intent between the City of Ottawa and the NCC. October 2011 Lansdowne Revitalization - 31

39 will walk north to the pedestrian crossing to get to this stop although some will use the pedestrian connection under the bridge that will be enhanced through the site development. Pick-ups for the Canada Post and Vincent Massey Park lots would be made on the east side of Bank Street. There is no equivalent to the Wilton Crescent stop on the east side of Bank Street and so large crowds will be waiting at the stop on the south side of the main entrance. Shuttles will be mixed in with downtown-bound buses at this stop and will compromise the principle of keeping things simple after events by introducing another destination in the queue of buses (the proposal for regular transit service is to run all buses from that stop northbound to downtown). The arrangement will pose operational and crowd-control challenges and will call for strong coordination of services between OC Transpo, the shuttle service provider and police. Shuttle services on Bank Street for a sold-out stadium event (25,000) would almost certainly require Bank Street to be closed from Fifth Avenue to Sunnyside after the event. In addition, longer boarding times after events (resulting from the mixture of OC Transpo services and shuttle services) and slower travel speeds on Bank Street, Sunnyside and Fifth Avenue are likely to require additional resources (buses, operators and supervision) and increase the costs of both shuttle services and OC Transpo services compared to the Queen Elizabeth Driveway option. Figure 3-3: Shuttle Service Routing Alternatives On Queen Elizabeth Driveway On Bank Street Proposed Strategy It is always desirable to keep things as simple as possible when developing transit ridership on new services to allow people to develop the habit of transit use as easily as possible. The most frequent large events at Lansdowne Park are expected to be CFL games with average attendance October 2011 Lansdowne Revitalization - 32
40 of around 18,000 and maximum attendance of 25,000. There are expected to be 10 to 12 of these games in the season spanning May to October. Since these are likely to be attended by many of the same people (season ticket holders), to the extent that dates permit, it would be preferable to operate satellite parking shuttles consistently using Queen Elizabeth Driveway and the special shuttle facility on-site at Lansdowne Park for all games. In addition, satellite parking would be provided at both Carleton University and Canada Post for all these games. This would make it possible to provide one information brochure for the season with a clear message about where to park and how to get back to the lot and avoid surprising people by what appears to be arbitrary change. If the CFL 11 game shuttles operate on Queen Elizabeth Driveway, to comply with NCC s conditions of use for the Driveway, unique events (e.g. concerts) should operate shuttle service on Bank Street. It is recommended that initially shuttle services on Bank Street be tested for events with attendance at the lower end of the 15,000-25,000 range Resources and Costs There is a cost associated with the operation and maintenance of the parking facilities as well as the additional transit service to transport people to/from Lansdowne Park. This cost will be included in the ticket price as described in the TDM plan. The existing evening and weekend rate for parking at Carleton University is $6.00 per vehicle. This price includes the regular operation, maintenance and cleaning of the lots by Carleton University staff. It does not include the additional staff resources to check/issue parking passes, nor does it include the additional signage and way-finding within and surrounding the parking facilities that would be required for special events. Canada Post and Vincent Massey Park are available for satellite parking, but the operation and maintenance would need to be provided by OSEG. A cost of $6 per vehicle is included to account for these services. As with Carleton University, staff would be required prior to and during an event to check / issue parking passes and help people efficiently park their vehicle. Signage would be required for vehicles to locate the parking facility in relation to Lansdowne Park, and for people to locate the shuttle pick-up / drop-off area. The additional transit service is to operate for 1.5 hours before the start of an event and for 1.5 hours after the event. During the event it is assumed that the buses return to the OC Transpo garage and standby until the post-event service commences. After the event, the service can be more peaked since people generally all exit at once. This would mean using articulated buses or adding more buses to the route, but the in-service hours would be reduced and should be considered if the resources are available. Two shuttle buses are also proposed to circulate between the satellite parking facilities and Lansdowne Park during the event. OC Transpo scheduling staff was involved in developing the schedules for the shuttle service scenarios. The consultant identified the route and frequency of service and estimated travel 11 The NCC is unable to guarantee that the QED will be available for the shuttle service for all CFL games at Lansdowne. The multiple demands submitted each year for the use of the Driveway for a variety of events and activities are assessed and scheduled on an annual basis, in concert with the input of other agencies and emergency services providers. Requests for shuttle service on the QED for CFL games will be assessed in this context. October 2011 Lansdowne Revitalization - 33
41 times. OC Transpo schedulers reviewed the timings and where necessary changes were made based on their operational experience. OC Transpo created the schedules in their production scheduling software package, Hastus, and produced final schedules, vehicle requirements and costs. The shuttle schedules can be found in Appendix D. The following table presents the total cost of parking as well as for transportation to/from Lansdowne Park for events with attendance of between 15,000 and 25,000. Table 3-8: Shuttle Service Requirements and Costs for Events with Attendance between 15,000 and 25,000 Attendance 18,000 25,000 Parking Number of Vehicles 1,675 3,590 Cost per Vehicle $ 6.00 $ 6.00 Cost $ 10,050 $ 21,540 Satellite Parking Shuttle Buses (standard) In service hours Stand by hours Cost $ 10,000 $ 24,650 Total Cost $ 20,050 $ 46,190 Cost per Ticket $ 1.12 $ Satellite Parking for Events more than 25, Parking Facilities For events with attendances of more than 25,000 persons, a minimum of 3590 satellite parking spaces would be required. A large event with an attendance of 40,000 would require satellite parking for 7,100 vehicles which is more than can be provided in the vicinity of Lansdowne Park. The following table presents the available parking lots as well as the number of spaces. Table 3-9: Satellite Parking Facilities Required for Events with Attendance Larger than 25,000 Parking Facility Spaces Carleton University 1,500 Canada Post 1,500 Vincent Massey 600 Brookfield High School 180 RA Centre 300 Mooney s Bay 150 City of Ottawa 750 Total 4,830 Additional Parking Required 2,270 There are a number of parking facilities in the Ottawa downtown that could also be used for event goers. The world exchange plaza provides free evening and weekend parking and there are other lots located at the NAC, the War museum, the Convention Centre and the Rideau Centre. The City of Ottawa also has plans for a new Trade Show Centre located at the Airport, which would provide additional parking for surplus vehicles. October 2011 Lansdowne Revitalization - 34
 to the shuttle drop-off and pick-up")
42 3.6.2 Transportation Services The NCC agreed that, as in the past, Queen Elizabeth Driveway would be available for very large events (more than 25,000 in attendance). Shuttle services from Carleton and Confederation Heights would operate on Bronson Avenue, Lakeside Drive and Queen Elizabeth Driveway (as shown in Figure 3-4) to the shuttle drop-off and pick-up facility on the northeastern side of Lansdowne Park and return to the parking lot, taking the same route, to repeat the circuit. For this to be possible, a modification to the intersection of Lakeside Drive and Bronson Avenue to allow a northbound to westbound left turn by transit buses will be necessary. Another shuttle would be provided from the City of Ottawa City Hall to Lansdowne Park via the Queen Elizabeth driveway and would also use the shuttle drop-off / pick-up facility on the northeast side of the Park. Figure 3-4: Shuttle Service Routing on Queen Elizabeth Driveway (40,000 event) This option enables people to be picked up and dropped off at the same stop on site at Lansdowne and avoids conflict between the large numbers of shuttle-users (17,770 for a 40,000 event) and vehicular traffic. October 2011 Lansdowne Revitalization - 35
43 Depending on the usage of the trade show centre parking at the Airport, an additional shuttle may be considered from this facility with direct service to Lansdowne Park. The alternative is for passengers to board Transitway route 97 and transfer to route 1 at Billings Bridge Resources and Costs There is a cost associated with the operation and maintenance of the parking facilities as well as the additional transit service to transport people to/from Lansdowne Park. This cost will be included in the ticket price as described in the TDM plan. The existing evening and weekend rate for parking at Carleton University is $6.00 per vehicle. This price includes the regular operation, maintenance and cleaning of the lots by Carleton University staff. It does not include the additional staff resources to check/issue parking passes, nor does it include the additional signage and way-finding within and surrounding the parking facilities that would be required for special events. There are many lots are available for satellite parking throughout the city, but the operation and maintenance would need to be provided by OSEG. A cost of $6 per vehicle is included to account for these services. As with Carleton University, staff would be required prior to and during an event to check / issue parking passes and help people efficiently park their vehicle. Signage would be required for vehicles to locate the parking facility in relation to Lansdowne Park, and for people to locate the shuttle pick-up / drop-off area. The shuttle service is to operate for 2 hours before the start of an event and for 2 hours after the event. It is assumed that a large event would include pre-shows and would have other activities on-site which would lengthen the duration of the event itself as well as the span when transportation services would be provided. The following table presents the total cost of parking as well as for transportation to/from Lansdowne Park for events with attendance of 40,000. Table 3-10: Shuttle Service Requirements and Costs for Events with Attendance larger than 25,000 Attendance 40,000 Parking Number of Vehicles 7,110 Cost per Vehicle $ 6.00 Cost $ 42,660 Satellite Parking Shuttle Buses (standard) 81 In service hours 380 Stand by hours 280 Cost $64,680 Total Cost $ 107,340 Cost per Ticket $ Shuttle Drop-off and Pick-up Facilities at Lansdowne Park The site plan has been developed to include two 42-metre platforms in the north east corner of the site arranged in such a way as to permit shuttle buses to enter and leave the site using the northeast entrance. This is illustrated in Figure 3-5. The two platforms will handle shuttles for October 2011 Lansdowne Revitalization - 36
 additional temporary shuttle services will be provided near the southern Queen Elizabeth Driveway entrance to the site. This is also shown in Figure 3-5.")

44 events with attendance up to 25,000 and allow the shuttle services to be divided after the event so that each platform serves a single destination. For larger events (40,000) additional temporary shuttle services will be provided near the southern Queen Elizabeth Driveway entrance to the site. This is also shown in Figure 3-5. Figure 3-5: Shuttle Drop-off and Pick-up for Special Events Platforms for events less than 25,000 Additional platforms for events more than 25,000 For shuttle buses on Bank Street, an additional stop will be placed on the west side of Bank Street nearside of Wilton Crescent to handle the Carleton-bound trips. On the west side of Bank Street, shuttle buses will share the transit stop at the main entrance to the site. 3.8 Shuttle Bus Storage During Events If the operator of the shuttle service is OC Transpo, buses would return to the garage during events. If the operator is other than OC Transpo, there will be a need to store shuttle buses during events. Shuttle buses could be stored at the satellite parking facilities at Carleton University and Canada Post. Considering the many buses required for events of over 25,000, additional space would be required. The Brookfield High School parking lot could also be used for storage of buses during an event and could accommodate up to 20 buses as presented in Figure 3-6. If this were used, there would be a need to provide access to washrooms and a waiting area for drivers. October 2011 Lansdowne Revitalization - 37
45 Figure 3-6: Shuttle bus Storage during a Large Event Brookfield High School 3.9 Fleet and Service Providers Satellite parking at Carleton University for events with attendance of less than 15,000 will be served by supplementary service on route 7 between Carleton University and Lansdowne Park. The resources required were derived from actual schedules developed with the assistance of OC Transpo and are based on standard length 45 seat coaches. The following table presents the resources required to provide the shuttle services for special events: Table 3-11: Shuttle Buses Required for Special Events Event Size 13,000* 18,000 25,000 40,000 Number of Buses Service Frequency 12/hr 47/hr 100/hr 200/hr Carleton: 12/hr 30/hr 50/hr 42/hr Canada Post: 17/hr 50/hr 67/hr City Hall: 21/hr Other 70/hr This service may be provided by OC Transpo if sufficient fleet is available but, for larger events it will be necessary to involve STO and, potentially, private bus companies such as Leduc, Laidlaws or Bergeron. However, operations will be most efficient and cost-effective if urban transit buses can be used, preferably articulated buses. 12 These are standard buses. If articulated buses are used, the requirements would be for two-thirds of these numbers. October 2011 Lansdowne Revitalization - 38
46 4. PROMOTION AND PUBLIC INFORMATION 4.1 Promotion and Information Ahead of Event It will be important to promote and provide potential users with accurate information about the services being offered in order to encourage uptake. The success of the transportation plan relies on achieving a high transit modal share. The key element of the promotion package, and the main driver to high transit ridership, must be the emphasis that every event ticket includes free transit to and from the event on both OC Transpo and STO transit systems. For those using satellite parking facilities, there will be no charge for parking and free shuttle service between the lot and Lansdowne Park. These costs will also be included in the price of the event ticket. Each person attending an event at Lansdowne Park must be made aware of the transit service options available to them as well as the satellite parking and shuttle options. The event organizer, through the Transportation Demand Management Coordinator, will be responsible for determining, along with the event sponsor, the estimated attendance for each event. This information will dictate the level and type of transit and parking services to be provided. The Coordinator will have a list of recipients who must receive this information by certain advance notification periods. For example, OC Transpo and STO will need to know event sizing to make arrangements for operator coverage of their workshifts one month in advance of an event date. Should significant changes in projected attendance take place in the month leading up to the event, the Coordinator would inform the service providers who would adjust the service plan and promotional material accordingly. The event organizer will be responsible for providing the available transportation options to all event goers when tickets are sold. This will be provided on their website for online ticket purchases and by print material for over-the-counter sales. The advertising programs for all events should also emphasize transportation options by including web links where the information is available. A full description of the transit service, including routings and schedules, should be provided on both the OC Transpo and STO web sites. The schedules of the supplementary and special event services should be incorporated into the integrated trip planners of both OC Transpo and STO. The City of Ottawa s web site should describe all transit options and provide a direct link to the OC Transpo web site. People planning to go to Lansdowne Park will need to have information about the satellite parking and shuttle services well ahead of the event. This can be provided in a variety of ways: brochures distributed with ticket purchases; information sent out to the event organizer s list; newspaper ads, websites of OSEG, City of Ottawa, etc. 4.2 Real-time Information Provision Transit service to and from events will continually be adjusted to better meet the needs of event goers. These changes will range from adjusting the amount of service on the different routes to modifying trip times. The timely notification of these changes to users is vital to building a longterm, successful relationship. As changes are made, the database feeding the various websites and trip planners should be updated and made active. Last minute changes should be sent out as a media release to newspapers, and radio and television stations. October 2011 Lansdowne Revitalization - 39
47 The shuttle service and satellite parking arrangements offer a specific challenge for real-time information. An on-going tally of parking lot usage will need to be broadcast in real-time by various means to event-goers. It is recommended that an app be developed for smart phones, similar to that used by Bixi Bikes in Montreal, that shows the space availability at the parking lots designated for the events. Variable message signs should be used at the entrances to both Carleton University and Canada Post to announce the availability of parking. When Carleton is full, a sign announcing e.g. PARKING LOTS FULL GO TO CANADA POST should be installed at the Sunnyside entrance at Carleton University and a call should go out to radio stations requesting them to make announcements over the air. For very large events, the parking lot at Vincent Massey Park will be used to provide overflow capacity. October 2011 Lansdowne Revitalization - 40
48 5. MONITORING AND ADJUSTING SERVICE Transit and Shuttle Service Plan 5.1 Overview The overall monitoring plan is described in the Traffic and Parking Management Plan. This proposes the formation of a Special Event Transportation Management Committee chaired by a senior member of the City of Ottawa s Traffic and Transportation Department and coordinated by the TDM Coordinator. This section focuses on the aspects of the monitoring plan relating to transit and satellite parking and shuttle services. 5.2 Transit Services (OC Transpo and STO) OC Transpo and STO will monitor all aspects of their service to determine ridership and schedule adherence for each trip. This information will be used to initially fine-tune the service and ensure it is being operated as planned. It is expected there will be minor additions and deletions to tailor service to meet the needs of event goers. The data collected will also provide total ridership by event and the transit modal share. As with the introduction of any new service, it takes time for ridership to build to mature levels. For this reason, it is recommended that the general level of service be maintained for at least a year when a review of all service would be undertaken. For larger events, special event routes are a key component of the service package and are expected to carry over 50% of those using transit. This service is crucial to achieving the overall transit modal share of 20%. For higher attendance events of 18,000 and greater, service frequencies on all routes are attractive. To ensure a high modal share for smaller events with attendance of 15,000, it is recommended that minimum service frequencies of 3 trips per hour (20 minute service) be maintained. This should be upheld in the monitoring program and the subsequent adjustment and fine-tuning of the service. To gain user confidence and build ridership, it will be important to maintain the highest standard of service delivery possible. To learn how the service is viewed, surveys of both users and nonusers of the service should be carried out. For the user group, the results will indicate what is being done right and what could be improved to better the transit experience. For the non-user group, the results should provide reasons why transit isn t used and what would be needed to convince them to use it. 5.3 Satellite Parking and Shuttle Services The shuttle service linking Carleton and Canada Post/Vincent Massey parking lots to Lansdowne Park will need to be closely monitored so that users are well served. The operator of the service (OC Transpo, STO or private contractor) must collect and record individual lot usage by time interval and ridership on all trips. The arrival pattern of cars is unknown although the flatter the distribution of arrival, the less the service will cost. The calculations in this report are based on the assumption that for events taking place in the stadium people will aim to arrive at Lansdowne Park in the 90-minutes before the event start time. The information collected should be used to match supply of trips to the demand. As well, the information will reveal bottlenecks in the service that could be addressed by innovative promotion and marketing to try and change the pattern of arrival times of cars. October 2011 Lansdowne Revitalization - 41
49 Real time monitoring will be required at all satellite lots in order to notify users when a lot is full and to direct them to an alternative lot. This is a critical component of the service that if not done properly will cause great frustration among users. The consequences of this monitoring responsibility must be emphasized to the service operator. It will be important to monitor the use of satellite parking lots and shuttle service, the quality of service provided and the satisfaction level of users with the service. The parking lots will likely be managed jointly by the parking lot owners and by representatives of the LPP, although the discussions held at Carleton University and Canada Post to discuss the practical implementation of the MoUs revealed that the Canada Post staff responsible for parking would want little to do with the operation, while Carleton University s approach will be much more hands-on. The shuttle service operator will provide supervision for their services at each parking lot. Before the event there is little need for supervision at Lansdowne Park. It is after the event that the shuttle service provider will need to have staff on-site to both assist passengers and supervise the service. A responsibility of staff at the parking lots will be to record the arrival of cars in the lots. When a lot at Carleton becomes full, arriving cars will need to be directed to another Carleton lot with capacity. If all space is taken, then cars will need to be directed to Canada Post. As well, the shuttle bus service operator will be responsible to collect and record ridership for each shuttle trip before and after the event. The availability of information on parking lot use and shuttle ridership will allow adjustments to be made to improve the service from one event to the next. The ridership data will also be used as part of the transit modal share calculation. A survey of users should be carried out from time to time to learn the views of the service from the users perspective. Topics to be covered should include wait times for buses both before and after events, clarity of parking lot signage, quality of lot overflow signage directions, overall impression of service, suggestions etc. A survey of vehicle occupancy should be carried out periodically at each lot. This will be used to explain the overall parking demand and fine-tune future parking strategies. 5.4 Coordination and Cooperation There are many players who must coordinate and cooperate with one another to make the service successful. These include OC Transpo and STO for provision of transit service, possibly a private transit contractor operating the shuttle service from parking lots, OSEG, Carleton University and Canada Post for use of their parking lot facilities, City of Ottawa Operations Department and Ottawa Police Services for traffic control and National Capital Commission for the use of Queen Elizabeth Driveway. Within this large effort, there are smaller alliances that must work well. OSEG, and the Transportation Demand Management Coordinator, must monitor all upcoming event sizes and keep all parties informed of the expected attendances as this will dictate the service package for the event and traffic measures that must be invoked. OC Transpo and STO must keep in close contact regarding the provision of transit service and resolve any issues in real time that affect transferring passengers. The provider of the shuttle service and Carleton and Canada Post must work well together and act quickly to inform people when a lot is full and where there is space available. October 2011 Lansdowne Revitalization - 42
50 6. SUMMARY OF EVENT TRANSIT AND SHUTTLE SERVICES This section provides a summary of the study findings and conclusions. The analysis considered the transit services, off-site parking, and shuttle service requirements to support special events at Lansdowne Park and was carried out in close consultation with OC Transpo and STO staff. The study focuses on the following event sizes: 7,000 and 10,000 representing average and sell-out arena events 13,000 representing events with between 10,000 and 15,000 18,000 and 25,000 representing average and sell-out stadium events 40,000 representing large stadium events when additional temporary seating is provided For each event size transit passengers and vehicular parking spaces are determined and services and facilities to accommodate this demand are provided. With limited on-site and on-street parking, additional satellite parking facilities are required with shuttle services to connect the facility with Lansdowne Park. The number of event-goers that are to be accommodated using transit and shuttle services to access Lansdowne Park are presented below. Table 6-1: Transit and Parking Demand for Various Event Sizes Attendance 7,000 10,000 13,000 18,000 25,000 40,000 Transit Passengers Bicycle / Pedestrian on street & on site Satellite facilities 700 1,000 2,550 3,550 4,925 10, ,000 1,550 2,150 2, ,600 8,000 8,125 8,125 8,125 6, ,175 8,975 17, Transit Services Transit services are to be supplemented to provide the additional capacity required to accommodate the demand. Using transit for special events will also be encouraged as parking is limited on-site and in the surrounding neighbourhood. The TDM plan recommends that the price of transit be included in the cost of the event ticket simplifying the use of public transit for events. Events less than 15,000 requires some transit routes to be supplemented, most notably route 1 with an extension from Billings Bridge to Hurdman Station via the southeast Transitway. For events larger than 15,000 special transit routes are to be provided from suburban park and ride lots with service directly to Lansdowne Park. Both STO and OC Transpo will operate these special routes prior to the event. After these events, most transit passengers (both OC Transpo and STO) will board route 1 on Bank Street to access Billings Bridge and LeBreton Station from where the special routes will depart. October 2011 Lansdowne Revitalization - 43
51 Figure 6-1: Transit Service for events more than 15,000 Before After The following table presents the total cost for the additional transit services provided for each event type as well as the number of additional buses in operation. Considering the cost is to be included in the ticket price, the per ticket cost is also presented below. Table 6-2: Total Transit Services, Resources and Costs for Various Event Sizes Attendance 7,000 10,000 13,000 18,000 25,000 40,000 Transit Passengers Transit Services Buses (articulated) 700 1,000 2,550 3,550 4,925 10,000 Route 1 to Hurdman Route 1 to Hurdman Route 1, 12, 118, 95, 96 Route 1, 12, Specials Route 1, 12, Specials Route 1, 12, Specials Costs $ 4,600 $ 6,850 $ 23,300 $ 26,400 $ 35,700 $ 73,200 Cost per Ticket $ 0.66 $ 0.69 $ 1.80 $ 1.47 $ 1.43 $ 1.83 Note: Specials include both OC Transpo and STO services 6.2 Satellite Parking and Shuttle Services With limited on-site and on-street parking, events larger than 10,000 would require the use of satellite parking facilities. The following table presents the number of parking spaces required for each event size and the satellite parking facilities to be used. The cost of satellite parking is also presented considering a rate of $6 per car. October 2011 Lansdowne Revitalization - 44
52 Table 6-3: Satellite Parking Facilities for Various Event Sizes Attendance 7,000 10,000 13,000 18,000 25,000 40,000 Satellite Parking Parking Facilities 310 1,675 3,590 7,110 Carleton Carleton, Canada Post Carleton, Canada Post, Vincent Massey Carleton, Canada Post, Vincent Massey, City of Ottawa Costs $ 1,860 $ 10,050 $ 21,540 $ 42,660 Shuttle services are to be provided to transport event-goers between satellite parking facilities and Lansdowne Park. The primary facility lot for satellite parking is at Carleton University. When more space is required the surface parking at Canada Post will be used followed by the lot at Vincent Massey Park. Additional parking would also be available at the structure parking at Canada Post, at the RA Centre, and at City of Ottawa Parking facilities (City Hall, Mooney s Bay & the new trade show centre). For events less than 15,000 OC Transpo route 7 will be supplemented between Carleton University and Lansdowne Park. Events larger than 15,000 would require the operation of special event shuttle routes. Events between 15,000 and 25,000 will operate 2 shuttle routes with service to Carleton University and Confederation Heights which includes both the Canada Post and Vincent Massey Parking facilities. Events larger than 25,000 would include a 3rd shuttle service that would provide service to Ottawa City Hall in the downtown. For CFL 13 football games and events larger than 25,000 shuttle services would operate on Queen Elizabeth Driveway in accordance with the NCC agreement. Other events would operate shuttle services on Bank Street. The following table summarizes the shuttle services, resources and costs to provide the service for each event size. Table 6-4: Shuttle Services and Resources for Various Event Sizes Attendance 7,000 10,000 13,000 18,000 25,000 40,000 Shuttle Passengers Shuttle Services Buses (standard) 775 4,175 8,975 17,775 Route 7 Carleton, Confederation Carleton, Confederation Carleton, Confederation, Downtown Costs $ 3,300 $ 10,000 $ 24,650 $ 64, NCC will confirm this commitment to CFL games, subject to what may be previously committed dates for the Queen Elizabeth Driveway to be closed, for the three-year period of the pilot project. October 2011 Lansdowne Revitalization - 45
53 The following table presents the total costs for providing the required satellite parking and shuttle services. Table 6-5: Total Parking and Shuttle Service Costs for Various Event Sizes Attendance 7,000 10,000 13,000 18,000 25,000 40,000 Parking Costs $ 1,860 $ 10,050 $ 21,540 $ 42,660 Shuttle Costs $ 3,300 $ 10,000 $ 24,650 $ 64,700 Total $ 5,160 $ 20,050 $ 46,190 $ 107,360 Cost per Ticket $ 0.40 $ 1.12 $ 1.85 $ Costs and Resources The TDM plan for special events at Lansdowne Park recommends that the cost of transportation services be included in the event ticket price. Transportation services include the supplementary and special transit services being provided as well as the satellite parking and shuttle services that are required. The following table presents the total transportation cost and the per ticket cost that would be added to the price of the event ticket. Attendance 7,000 10,000 13,000 18,000 25,000 40,000 Transit Services Parking & Shuttle $ 4,600 $ 6,850 $ 23,300 $ 26,400 $ 35,700 $ 73,200 $ 5,160 $ 20,050 $ 46,190 $ 107,360 Total $ 4,600 $ 6,850 $ 28,460 $ 46,450 $ 81,890 $ 180,560 Cost per Ticket $ 0.66 $ 0.69 $ 2.20 $ 2.59 $ 3.28 $ 4.52 It is recommended that event less than 10,000 include a cost of $0.70 per ticket while events between 10,000 and 25,000 include a cost of $3.00. Large events that require high transit mode shares and the use of multiple satellite parking facilities would include a cost of $4.50 per ticket. October 2011 Lansdowne Revitalization - 46
54 This page intentional left blank
55 Appendix A APPENDIX A TRIP GENERATION / DISTRIBUTION / MODE SPLIT... 1 Special Event Trip Generation... 1 Definition of Modes... 2 Trip Distribution and Mode split for Events with Attendance of 10, Trip Distribution and Mode split for Events with Attendance of 25, Trip Distribution and Mode split for Events with Attendance of 40, October 2011 McCORMICK RANKIN CORPORATION
56

57 APPENDIX A TRIP GENERATION / DISTRIBUTION / MODE SPLIT From: Lansdowne Transportation Impact Assessment Study and Transportation Demand Management Plan, July 2010 Special Event Trip Generation To develop a picture of the origins of trips to Lansdowne Park for special events, the approach was to base the analysis on the population in the areas across the National Capital Region. The zones used as a basis for this analysis are shown in FIGURE A-1. As a starting point, trips to events at Lansdowne Park were assumed to be generated in proportion to the population in the zones. However, for small and medium-size events i.e. with attendance of 10,000 and 25,000, respectively an adjustment was made to reduce the 24 percent of trips that would come from Quebec based purely on population, to 14 percent to reflect the more local nature of the event (for example, Ontario Hockey League games). The postal codes of Ottawa Renegades season ticket holders were reviewed as part of this analysis, however it is recognized that the distribution of season ticket holders may reflect a bias in the distribution as well as noting the tendency of a number of reported season ticket holders with out-of-town addresses (likely corporate head offices responsible for purchasing season tickets). FIGURE A-1: Trip Origin Zones for the National Capital Region TABLE A-1 shows the results of this approach for events with attendance of 10,000, 25,000 and 40,000. October 2011 Lansdowne Revitalization A-1
58 TABLE A-1: Trip Generation 10,000-, 25,000- and 40,000-Person Events Trip Origin Population (% of Total) 10,000 person event % of Total # of Trips 25,000 person event % of Total # of Trips 40,000 person event % of Total # of Trips Ottawa Core Area 9,400 (1%) 1% 90 1% 230 1% 330 Ottawa Inner Area 86,400 (8%) 9% 860 9% 2,140 8% 3,010 Ottawa East/Orleans 204,800 (18%) 20% 2,020 20% 5,070 18% 7,120 Alta Vista 79,500 (7%) 8% 790 8% 1,970 7% 2,760 Ottawa Southeast 89,000 (8%) 9% 880 9% 2,200 8% 3,090 Merivale 77,800 (7%) 8% 770 8% 1,920 7% 2,710 Ottawa West 49,300 (4%) 5% 490 5% 1,220 4% 1,720 Kanata/ Stittsville 193,700 (17%) 19% 1,910 19% 4,790 17% 6,740 Ottawa Southwest 80,900 (7%) 8% 800 8% 2,000 7% 2,820 Gatineau Centre 58,300 (5%) 3% 290 3% 720 5% 2,030 Gatineau West 71,800 (6%) 4% 360 4% 890 6% 2,500 Gatineau East 149,000 (13%) 7% 740 7% 1,840 13% 5,180 TOTAL 1,149,900 (100%) 100% 10, % 24, % 40,010 Definition of Modes For special events the modes are defined as follows: Non-motorized (Pedestrian and Cycling) o People who travel from their origin (usually home) to Lansdowne Park by walking or cycling Public Transit (Regular, Special and Supplementary Services) o People who either walk or cycle to a bus stop, or drive to a Park and Ride Lot (e.g.: Eagleson, Trim) and then board a bus to the event Auto (Private car) o People who drive and either park on-site, on-street (within the study area) or at an off-site (satellite) parking lot (using a shuttle bus to/from the site) Trip Distribution and Mode split for Events with Attendance of 10,000 The analysis considers a public transit mode share of 10 percent and a non-motorized share of 10 percent for events with an attendance up to 10,000 people. Walking and cycling shares would depend on the distances people are travelling. TABLE A-2 shows the percentage of walking, cycling and transit trips expected for residents at increasing distances from Lansdowne Park. It should be noted that within the study area, 80% of the event goers walk or cycle to the event. Trips that originate from areas beyond 10km are not accommodated by non-motorized modes. The trips that are not by transit, walking or cycling would be by car, with an average of 2.5 persons per vehicle. For 10,000-person events, this would mean that 8,000 people would be arriving by car, using 3,200 cars. October 2011 Lansdowne Revitalization A-2
59 TABLE A-2: Mode Shares for 10,000-Person Event Distance from Site Mode Share Walk Cycle Transit Auto Study area 70% 10% 5% 15% Study area - 2 km 60% 10% 10% 20% 2 km - 3 km 20% 5% 10% 65% 3 km - 5 km 10% 5% 10% 75% 5 km - 8 km 5% 10% 85% 8 km - 10 km 1% 10% 89% 10 km - 15 km 10% 90% Beyond 15 km 11% 89% Overall share 7.2% 2.2% 10.3% 80.3% Total # people ,030 8,050 Trip Distribution and Mode split for Events with Attendance of 25,000 Medium-size events with attendance of 25,000 will take place in the stadium. Assuming a highquality transit service is provided, coupled with effective TDM measures, an overall transit modal share of 20 percent can be expected. As with the 10,000-person events, the transportation mode chosen will depend on the distance from Lansdowne Park; a person who lives less than two kilometres from the site will likely use non-motorized modes, while those travelling more than 10 kilometres will depend mostly on cars and transit. The mode shares for a 25,000 person event is presented in TABLE A-3 below. TABLE A-3: Mode Shares for 25,000-Person Event Distance from Site Mode Share Walk Cycle Transit Auto Study area 75% 10% 5% 10% Study area 2 km 65% 10% 5% 20% 2 km 3 km 25% 10% 5% 60% 3 km 5 km 20% 10% 15% 55% 5 km 8 km 5% 20% 75% 8 km 10 km 2% 20% 78% 10 km 15 km 22% 78% Beyond 15 km 24% 76% Overall share 8.9% 3.0% 19.7% 68.4% Total # people 2, ,910 17,090 October 2011 Lansdowne Revitalization A-3
60 Trip Distribution and Mode split for Events with Attendance of 40,000 The approach taken to developing mode shares and travel patterns to large events was very similar to that adopted for medium-size events, although the quantity of service would be greater. A 25 percent mode share for transit to 40,000-person events was considered reasonable for this region. The bigger crowds plus the higher transit share result in a greater number of transit trips compared with the 25,000-person event. The results of combining these assumptions with the trip-generation assumptions above are shown in TABLE A-4. In this case, approximately 25,000 people would be assumed to arrive by car, in approximately 10,000 vehicles. TABLE A-4: Mode Shares for 40,000-Person Event Distance from Mode Share Site Walk Cycle Transit Auto Study area 80% 10% 5% 5% Study area 2 km 70% 10% 5% 15% 2 km 3 km 35% 15% 10% 40% 3 km 5 km 30% 15% 15% 40% 5 km 8 km 5% 25% 70% 8 km 10 km 3% 27% 70% 10 km 15 km 30% 70% Beyond 15 km 30% 70% Overall share 9.9% 3.5% 25.1% 61.5% Total # people 3,970 1,400 10,050 24,600 October 2011 Lansdowne Revitalization A-4
61 The number of event goers from each region is assumed to be proportional to the population of the region (except for 25,000 person events where Gatineau's share is less than its population share) Table 1: Population Distribution Table 2 # of Event Goers (attendance x % of Total pop) Population % of Total % of Total % of Total 10,000 attendance 25,000 attendance attendance 10,000 25,000 40,000 1 Ottawa Core Area % 0.9% 0.8% Ottawa Inner Area % 8.6% 7.5% ,139 2,140 3,006 3,010 3 Ottawa East / Orleans % 20.3% 17.8% 2,027 2,030 5,068 5,070 7,124 7,120 4 Alta Vista % 7.9% 6.9% ,966 1,970 2,764 2,760 5 Ottawa Southeast % 8.8% 7.7% ,201 2,200 3,094 3,090 6 Merivale % 7.7% 6.8% ,924 1,920 2,705 2,710 7 Ottawa West % 4.9% 4.3% ,221 1,220 1,716 1,720 8 Kanata / Stittsville % 19.2% 16.8% 1,917 1,920 4,792 4,790 6,737 6,740 9 Ottawa Southwest % 8.0% 7.0% ,003 2,000 2,815 2, Gatineau Centre % 2.9% 5.1% ,030 2, Gatineau West % 3.6% 6.2% ,499 2, Gatineau East % 7.4% 13.0% ,843 1,840 5,181 5,180 TOTAL % 100% 100% 10,000 10,020 25,000 24,990 40,000 40,010 The transportation mode selected will depend on the persons distance from Lansdowne Park; a person that is less than 2km from the site will likely use nonmotorized modes while trips larger than 10km will depend mostly on auto and transit Table 3: Mode Shares -10%, 20% and 25% Transit Share 10,000 person Event (10% Transit) 25,000 person Event (20% Transit) 40,000 person Event (25% Transit) walk cycle Transit Auto walk cycle Transit Auto walk cycle Transit Auto Study Area 70% 10% 5% 15% 75% 10% 5% 10% 80% 10% 5% 5% SA - 2km 60% 10% 10% 20% 65% 10% 5% 20% 70% 10% 5% 15% 2km - 3km 20% 5% 10% 65% 25% 10% 5% 60% 35% 15% 10% 40% 3km - 5km 10% 5% 10% 75% 20% 10% 15% 55% 30% 15% 15% 40% 5km-8km 0% 5% 10% 85% 0% 5% 20% 75% 0% 5% 25% 70% 8km-10km 0% 1% 10% 89% 0% 2% 20% 78% 0% 3% 27% 70% 10km-15km 0% 0% 10% 90% 0% 0% 22% 78% 0% 0% 30% 70% beyond 15k 0% 0% 11% 89% 0% 0% 24% 76% 0% 0% 30% 70% Each population region in Table 1 corresponds to a distances from Lansdowne Park; the Ottawa core area is between 2 km and 5 km from Lansdowne Park. The following table presents the relationship between the regions and the distance from the site. Table 4: Distance from Site from Map Assumed Other Assumptions 1 Ottawa Core Area > 2 km < 5 km 2/3(2-3)+1/3(3-5) 2 Ottawa Inner Area < 3 km 2/3(SA+1/6(SA-2) (1/6(2-3) 3 Ottawa East / Orleans > 3 km > 15 km 1/4(5-8)+1/4(10-15)+1/2(15+) 4 Alta Vista > 2 km < 8 km 2/3(2-3)+1/3(3-5) 5 Ottawa Southeast > 5 km > 15 km beyond 15k 6 Merivale > 3 km < 10 km 1/2(3-5)+1/2(5-8) 7 Ottawa West > 3 km < 8 km 1/2(3-5)+1/2(5-8) 8 Kanata / Stittsville > 8 km > 15 km beyond 15k 9 Ottawa Southwest > 10 km > 15 km 1/2(10-15)+1/2(15+) 10 Gatineau Centre > 3 km < 10 km 5km-8km Gatineau attendance for 25,000 game = % of total/2 11 Gatineau West > 8 km > 15 km beyond 15k Gatineau attendance for 25,000 game = % of total/2 12 Gatineau East > 8 km > 15 km beyond 15k Gatineau attendance for 25,000 game = % of total/2 October 2011 Lansdowne Revitalization A-5
62 The mode splits presented in Table 3 are applied to each region based on its distance from the site as shown in Table 4. The following table presents the mode shares for each region and the number of trips by each mode for a 25,000 person event. 10,000 person Event (10% transit) Assumed Mode Splits # of Trips Walk Cycle Transit Auto Walk Cycle Transit Auto Total 1 Ottawa Core Area 17% 5% 10% 68% Ottawa Inner Area 60% 9% 7% 24% Ottawa East / Orlean 0% 1% 11% 88% ,790 2,030 4 Alta Vista 17% 5% 10% 68% Ottawa Southeast 0% 0% 11% 89% Merivale 5% 5% 10% 80% Ottawa West 5% 5% 10% 80% Kanata / Stittsville 0% 0% 11% 89% ,710 1,920 9 Ottawa Southwest 0% 0% 11% 90% Gatineau Centre 0% 5% 10% 85% Gatineau West 0% 0% 11% 89% Gatineau East 0% 0% 11% 89% TOTAL 7.2% 2.2% 10.3% 80.3% ,030 8,050 10, % 2.2% 10.3% 80.3% 100.0% Non-Motorized trips = 9.4% Transit Trips = 10.3% Auto Trips = 80.3% 25,000 person Event (20% transit) Assumed Mode Splits # of Trips Walk Cycle Transit Auto Walk Cycle Transit Auto Total 1 Ottawa Core Area 23% 10% 8% 58% Ottawa Inner Area 65% 10% 5% 20% 1, ,140 3 Ottawa East / Orlean 0% 1% 23% 76% ,140 3,860 5,060 4 Alta Vista 23% 10% 8% 58% ,150 1,970 5 Ottawa Southeast 0% 0% 24% 76% ,670 2,200 6 Merivale 10% 8% 18% 65% ,250 1,920 7 Ottawa West 10% 8% 18% 65% ,210 8 Kanata / Stittsville 0% 0% 24% 76% - - 1,150 3,640 4,790 9 Ottawa Southwest 0% 0% 23% 77% ,540 2, Gatineau Centre 0% 5% 20% 75% Gatineau West 0% 0% 24% 76% Gatineau East 0% 0% 24% 76% ,400 1,840 TOTAL 8.9% 3.0% 19.7% 68.4% 2, ,910 17,090 24, % 3.0% 19.7% 68.4% 100.0% Non-Motorized trips = 11.9% Transit Trips = 19.7% Auto Trips = 68.4% The mode splits presented in Table 3 are applied to each region based on its distance from the site as shown in Table 4. The following table presents the mode shares for each region and the number of trips by each mode for a 40,000 person event. 40,000 person Event (25% transit) Assumed Mode Splits # of Trips Walk Cycle Transit Auto Walk Cycle Transit Auto Total 1 Ottawa Core Area 77% 10% 5.0% 8% Ottawa Inner Area 71% 11% 5.8% 13% 2, ,020 3 Ottawa East / Orlean 0% 1% 28.8% 70% ,050 4,990 7,130 4 Alta Vista 33% 15% 11.7% 40% ,110 2,760 5 Ottawa Southeast 0% 0% 30.0% 70% ,170 3,100 6 Merivale 15% 10% 20.0% 55% ,490 2,710 7 Ottawa West 15% 10% 20.0% 55% ,710 8 Kanata / Stittsville 0% 0% 30.0% 70% - - 2,020 4,720 6,740 9 Ottawa Southwest 0% 0% 30.0% 70% ,970 2, Gatineau Centre 0% 5% 25.0% 70% ,420 2, Gatineau West 0% 0% 30.0% 70% ,750 2, Gatineau East 0% 0% 30.0% 70% - - 1,550 3,630 5,180 TOTAL 9.9% 3.5% 25.1% 61.5% 3,970 1,400 10,050 24,600 40, % 3.5% 25.1% 61.5% 100.0% Non-Motorized trips = 13.4% Transit Trips = 25.1% Auto Trips = 61.5% October 2011 Lansdowne Revitalization A-6
63 Appendix B APPENDIX B DAY TO DAY OPERATIONS... 1 October 2011 McCORMICK RANKIN CORPORATION
64
65 APPENDIX B - DAY TO DAY OPERATIONS From: Lansdowne Transportation Impact Assessment Study and Transportation Demand Management Plan, July 2010 Day-to-day transit service will be provided by simply augmenting the current Bank Street routes 1 and 7 to accommodate the increased transit requirements due to the planned land uses. The transit service is planned to accommodate 75 percent of the trips to/from the north while 25 percent are to/from south of the site. Also, standard 40-foot buses (capacity: 45 passengers) are being used since that is what is typically in operation for routes 1 & 7. TABLE B-1 shows the current service headways northbound and southbound on Bank Street and the headways estimated to be needed to support the day-to-day activities of the development. TABLE B-1: Additional Transit Service for Day-to-Day Activities Weekday Weekday Weekday Friday Saturday Frequency (bus/hr.) AM Peak PM Peak Midday Evening Midday Hour Hour Sunday Midday Direction NB (SB) NB (SB) NB (SB) NB (SB) NB (SB) NB (SB) Existing (Rte. 1 & 7) 16 (10) 13 (13) 8 (8) 4 (4) 10 (10) 6 (6) Additional standard bus/hr. 0 (0) 0 (0) 0 (0) 2 (1) 0 (0) 1 (1) The above table shows that the existing service frequency on Bank Street could accommodate the planned day-to-day activities during most time periods. The cinema and commercial development contribute to more trips on Friday evenings and Sunday midday, when the spare capacity would be exceeded and more service would be needed. These service improvements, which would mean additional buses for weekday evenings and weekends, would be managed through the normal OC Transpo annual budgeting process and would benefit all users of these routes by reducing waiting times. Because the extra service would not be needed in peak times, this would not mean buying more vehicles. Considering that the existing trip time for Route 1 is about an hour per direction, with the round trip taking about two hours, a total of four buses would be needed to provide the required frequencies for Friday evening. It should be noted that the additional service discussed above accounts only for the needs of passengers traveling to and from the new development on the site. On top of this would be the normal growth in transit ridership of approximately 1% per year. October 2011 Lansdowne Revitalization B-1
66
67 Appendix C APPENDIX C TRANSIT SERVICES, SCHEDULES, AND COSTS... 1 Total Transit Resources and Costs... 1 Summary of OC Transpo Resources and Costs... 2 OC Supplementary Services 7,000 Person Event... 3 OC Supplementary Services 10,000 Person Event... 4 OC Supplementary Services 13,000 Person Event... 5 OC Supplementary Services 18,000 Person Event... 6 OC Supplementary Services 25,000 Person Event... 8 OC Supplementary Services 40,000 Person Event OC Special Services 18,000 Person Event Resource Summary Block Summary Route Schedules OC Special Services 25,000 Person Event Resource Summary Block Summary Route Schedules OC Special Services 40,000 Person Event Resource Summary Block Summary Route Schedules Summary of STO Resources and Costs STO Resources Available/ Disponibles STO Services 10,000 to 15,000 Person Event STO Services 18,000 Person Event STO Services 25,000 Person Event STO Services 40,000 Person Event October 2011 McCORMICK RANKIN CORPORATION
68
69 APPENDIX C TRANSIT SERVICES, SCHEDULES, AND COSTS Total Transit Resources and Costs SPECIAL SERVICES OC Transpo 7,000 10,000 13,000 18,000 25,000 40,000 Buses (articulated) Cost $0 $0 $0 $10,763 $13,715 $28,560 STO Buses (articulated) Cost $0 $0 $0 $2,646 $6,048 $14,364 SUPPLEMENTARY SERVICES 7,000 10,000 13,000 18,000 25,000 40,000 OC Transpo Buses Cost $4,564 $6,840 $19,524 $9,180 $12,150 $25,200 STO Buses Cost $0 $0 $0 $0 $0 $0 EXTRAS OC Transpo 7,000 10,000 13,000 18,000 25,000 40,000 Buses (articulated) Cost $0 $0 $1,890 $1,890 $1,890 $2,520 STO Buses (articulated) Cost $0 $0 $1,890 $1,890 $1,890 $2,520 TOTAL 7,000 10,000 13,000 18,000 25,000 40,000 Buses (articulated) Cost $4,564 $6,840 $23,304 $26,369 $35,693 $73,164 Cost per ticket $0.66 $0.69 $1.80 $1.47 $1.43 $1.83 October 2011 Lansdowne Revitalization C-1
70 Summary of OC Transpo Resources and Costs SPECIAL SERVICES 7,000 10,000 13,000 18,000 25,000 40,000 Buses (articulated) In-service hours Stand-by hours Cost $0 $0 $0 $10,763 $13,715 $28,560 SUPPLEMENTARY SERVICES 7,000 10,000 13,000 18,000 25,000 40,000 Buses In-service hours Stand-by hours Cost $4,564 $6,840 $19,524 $9,180 $12,150 $25,200 EXTRAS 7,000 10,000 13,000 18,000 25,000 40,000 Buses (articulated) In-service hours Stand-by hours Cost $0 $0 $1,890 $1,890 $1,890 $2,520 TOTAL 7,000 10,000 13,000 18,000 25,000 40,000 Buses (articulated) In-service hours Stand-by hours Cost $4,564 $6,840 $21,414 $21,833 $27,755 $56,280 October 2011 Lansdowne Revitalization C-2
71 7,000 Person Event Supplementary Service on RTE 1 - Standard buses Route 1 from Rideu Centre to Billings Bridge and to Hurdman via the Southeast Transitway No Special Event Routes Event Size 7,000 people Transit Share 10% transit Non - Motorized Share 10% 700 trips Transit Special Span 1 hours Operator Cost/hr Stand By Cost/hr Length of Event Distribution of Transit Demand 126 $ / hr 60 $ / hr 3 hours Area Population (2005) % of total Attendance % transit Transit Passenger span (hrs) Transit passenger / hr Pass/veh # of Transit Trips / hr Type of Service Route Orleans 98, ,580 99, % Supplementar 95W, 1S Barrhaven 56, ,018 57, % Supplementar 95E, 1S Kanata 88, ,233 89, % Supplementar 96E, 1S SUC/Leitrim 63, ,757 63, % Supplementar 97N, 1N Baseline/Nepean 121, , , % Supplementar 118E, 1N Westboro/Carlingwood 71,216 77,174 71, % Supplementar 96E 97S, 1S Vanier/Beacon 57,402 69,956 57, % Supplementar 12W, 1S Blackburn/Industrial 44,901 44,755 45, % Supplementar 94W, 1S Alta Vista/Smyth 62,842 66,168 63, % Supplementar 1N Carleton/Confed 5,801 8,330 6, % Supplementar 1N Old Ottawa South 8,466 8,800 8, % Supplementar 1N Glebe 13,685 14,575 14, % Supplementar 1S Gatineau 139, , , % Supplementar STO, 1S Centretown/sandy hill 61,525 75,421 62, % Supplementar 1S Lebreton/preston 25,530 37,183 26, % Supplementar 1S Rural Ottawa 84, ,829 85, % Supplementar 1S/N Other 4,193 5,150 4, % Supplementar 12W, 1S TOTAL 1,009,136 1,501,925 1,011,000 7, % 720 Supplementary Transit Transit passenger / hr Remaining Passenger s/hr # of Transit Trips / hr # of Bus Vehicles required Route From / to Transit Passenger span (hrs) Reserve Capacity Pass/veh Transit Trip Time (min) Layover time (min) Round Trip Time (min) 1NB Billings to Rideau Centre SB Rideau Centre to Billings WB Blair to Bank EB Baseline Road EB WB EB WB EB WB SB NB TOTAL 1,165 9 There is a total of 720 passengers on route % of rte 1 passengers are from STO The additional trip on route 118 is ignored Route trips required Operating Hours Operating Cost Standby Hours Standby Cost Total Cost 1NB 1SB 8 0 buses make 1 trips and 8 buses make 1 trip $ 3, $ 1,200 $ 4,560 12WB 118EB 94EB 94WB 95EB 95WB 96EB 96WB 97SB 97NB TOTAL A total of 8 buses are required $ 3, $ 1,200 $ 4,560 Same transit demand and services before and after the event Existing Frequency = 4 buses / hr 15 min headway Supplemented Service = 8 buses / hr Transit Service Frequency = 12 buses / hr 5 min headway
72 10,000 Person Event Supplementary Service on RTE 1 - Standard buses Route 1 from Rideu Centre to Billings Bridge and to Hurdman via the Southeast Transitway No Special Event Routes Event Size 10,000 people Transit Share 10% transit Non - Motorized Share 10% 1000 trips Transit Special Span 1 hours Operator Cost/hr Stand By Cost/hr Length of Event Special Event Transit Services 126 $ / hr 60 $ / hr 3 hours Area Population (2005) % of total Attendance % transit Transit Passenger span (hrs) Transit passenger / hr Pass/veh # of Transit Trips / hr Type of Service Route Orleans 98, ,580 99, % Supplementary 95W, 1N Barrhaven 56, ,018 57, % Supplementary 95E, 1S Kanata 88, ,233 89, % Supplementary 96E, 1S SUC/Leitrim 63, ,757 63, % Supplementary 97N, 1N Baseline/Nepean 121, , , ,207 10% Supplementary 118E, 1N Westboro/Carlingwood 71,216 77,174 71, % Supplementary 96E 97S, 1S Vanier/Beacon 57,402 69,956 57, % Supplementary 12W, 1S Blackburn/Industrial 44,901 44,755 45, % Supplementary 94W, 1N Alta Vista/Smyth 62,842 66,168 63, % Supplementary 1N Carleton/Confed 5,801 8,330 6, % Supplementary 1N Old Ottawa South 8,466 8,800 8, % Supplementary 1N Glebe 13,685 14,575 14, % Supplementary 1S Gatineau 139, , , ,385 10% Supplementary STO, 1S Centretown/sandy hill 61,525 75,421 62, % Supplementary 1S Lebreton/preston 25,530 37,183 26, % Supplementary 1S Rural Ottawa 84, ,829 85, % Supplementary 1S/N Other 4,193 5,150 4, % Supplementary 12W, 1S TOTAL 1,009,136 1,501,925 1,011,000 10, % 1,028 Supplementary Transit Services Transit passenger / hr Remaining Passenger s/hr # of Bus Vehicles required Transit span Reserve # of Transit Transit Trip Layover Round Trip Route From / to Passenger (hrs) Capacity Pass/veh Trips / hr Time (min) time (min) Time (min) 1NB Hurdman to Rideau Centre SB Rideau Centre to Hurdman WB Blair to Bank EB Baseline Road EB WB EB WB EB WB SB NB TOTAL 1, There is a total of 1,028 passengers on route % of rte 1 passengers are from STO The additional trips on RTE 118 & RTE 12 are ignored Route trips required Operating Hours Operating Cost Standby Hours Standby Cost Total Cost 1NB 1SB 12 0 buses make 1 trips and 12 buses make 1 trip 40.0 $ 5, $ 1,800 $ 6,840 12WB 1 0 buses make 1 trips and 1 buses make 1 trip 3.7 $ $ 150 $ EB 2 0 buses make 1 trips and 2 buses make 1 trip 10.8 $ 1, $ 300 $ 1,661 94EB 94WB 95EB 95WB 96EB 96WB 97SB 97NB TOTAL A total of 15 buses are required $ 6, $ 2,250 $ 9,112 Same transit demand and services before and after the event Existing Frequency = 4 buses / hr 15 min headway Supplemented Service = 12 buses / hr Transit Service Frequency = 16 buses / hr 3.75 min headway
73 13,000 Person Event Supplementary Service on RTE 1, RTE 12, and TWAY 95 & 96 - Articulated Buses Route 1 from Rideu Centre to Billings Bridge and to Hurdman via the Southeast Transitway No Special Events Routes Event Size 13,000 people Transit Mode Split target 20% transit Non - Motorized Share 12% 1547 trips Transit Special Span 1.5 hours Operator Cost/hr Stand By Cost/hr Length of Event Special Event Transit Services 126 $ / hr 60 $ / hr 3 hours Area Population (2005) % of total Attendance % transit Transit Passenger span (hrs) Transit passenger / hr Pass/veh # of Transit Trips / hr Type of Service Route Orleans 98, ,580 99, ,273 24% Supplementary 95W, 1N Barrhaven 56, ,018 57, % Supplementary 95E, 1S Kanata 88, ,233 89, ,144 24% Supplementary 96E, 1S SUC/Leitrim 63, ,757 63, % Supplementary 97N, 1N Baseline/Nepean 121, , , ,569 18% Supplementary 118E, 1N Westboro/Carlingwood 71,216 77,174 71, % Supplementary 96E 97S, 1S Vanier/Beacon 57,402 69,956 57, % Supplementary 12W, 1S Blackburn/Industrial 44,901 44,755 45, % Supplementary 94W, 1N Alta Vista/Smyth 62,842 66,168 63, % Supplementary 1N Carleton/Confed 5,801 8,330 6, % Supplementary 1N Old Ottawa South 8,466 8,800 8, % Supplementary 1N Glebe 13,685 14,575 14, % Supplementary 1S Gatineau 139, , , ,800 24% Supplementary STO, 1S Centretown/sandy hill 61,525 75,421 62, % Supplementary 1S Lebreton/preston 25,530 37,183 26, % Supplementary 1S Rural Ottawa 84, ,829 85, ,093 25% Supplementary 1S/N Other 4,193 5,150 4, % Supplementary 12W, 1S TOTAL 1,009,136 1,501,925 1,011,000 13, % 2,561 Supplementary Transit Services Transit passenger / hr Remaining Passengers/ hr # of Transit Trips / hr Transit span Reserve Transit Trip Layover Round Trip # of Bus Vehicles Route From / to Passenger (hrs) Capacity Pass/veh Time (min) time (min) Time (min) required 1NB 1, SB 1, WB Blair to Bank EB EB millenium to Tunney's WB Tunney's to Millenium EB Barrhaven TC to Trim WB Trim to Barrhaven TC EB Stittsville/Fernbank to Hurdm WB Hurdman to Stittsville/fernbank EB/SB Bayshore to South Keys WB/NB South Keys to Bayshore TOTAL 4, There is a total of 2,561 passengers on route 1 1,646 passengers transfer onto RTE 1 from other routes (OC and STO) 16.9% of RTE 1 passengers are from STO Route trips required Operating Hours Operating Cost Standby Hours Standby Cost Total Cost 1NB 1SB 21 4 buses make 2 trips and 13 buses make 1 trip 66.0 $ 8, $ 2,550 $ 10,866 12WB 2 0 buses make 1 trips and 2 buses make 1 trip 7.3 $ $ 300 $ 1, EB 4 1 buses make 2 trips and 2 buses make 1 trip 20.6 $ 2, $ 450 $ 3,046 94EB 94WB 95EB 95WB 2 0 buses make 1 trips and 2 buses make 1 trip 12.5 $ 1, $ $ 1,875 96EB 3 1 buses make 2 trips and 1 buses make 1 trip $ 2, $ $ 2,474 96WB 97 EB/SB 97WB/NB TOTAL 26 buses $ 15, $ 3,900 $ 19,482 Same transit demand and services before and after the event Existing Frequency = 4 buses / hr 15 min headway Supplemented Service = 14 buses / hr Transit Service Frequency = 18 buses / hr 3.3 min headway
74 18,000 Person Event Supplementary Service on RTE 1 & RTE 12 Route 1 from Lebreton to Billings Bridge Special Transit Routes from P&R lots to Lansdowne Park Event Size 18,000 people Transit Mode Split target 20% transit Non - Motorized Share 12% 2142 trips Transit Special Span 1.5 hours Operator Cost/hr Stand By Cost/hr Length of Event Special Event Transit Services 126 $ / hr 60 $ / hr 3 hours Area Population (2005) % of total Attendance % transit Transit Passenger span (hrs) Transit passenger / hr Pass/veh # of Transit Trips / hr Type of Service Route Orleans 98, ,580 99, ,763 24% Special Barrhaven 56, ,018 57, ,015 24% Special Kanata 88, ,233 89, ,585 24% Special SUC/Leitrim 63, ,757 63, ,122 24% Special Baseline/Nepean 121, , , ,172 18% Special Westboro/Carlingwood 71,216 77,174 71, ,264 18% Supplementary 94E 97E, 1S Vanier/Beacon 57,402 69,956 57, ,015 18% Supplementary 12W, 1S Blackburn/Industrial 44,901 44,755 45, % Supplementary94W 95W, 1S Alta Vista/Smyth 62,842 66,168 63, ,122 8% Supplementary 1N Carleton/Confed 5,801 8,330 6, % Supplementary 1N Old Ottawa South 8,466 8,800 8, % Supplementary 1N Glebe 13,685 14,575 14, % Supplementary 1S Gatineau 139, , , ,493 24% Special Centretown/sandy hill 61,525 75,421 62, ,104 10% Supplementary 1S Lebreton/preston 25,530 37,183 26, % Supplementary 1S Rural Ottawa 84, ,829 85, ,513 25% Supplementary 1S/N Other 4,193 5,150 4, % Supplementary 12W, 1S TOTAL 1,009,136 1,501,925 1,011,000 18, % 3,545 Supplementary Transit Services Before the Event Transit passenger / hr Remaining Passenger s/hr # of Transit Trips / hr # of Bus Vehicles required Route From / to Transit Passenger span (hrs) Reserve Capacity Pass/veh Transit Trip Time (min) Layover time (min) Round Trip Time (min) 1NB SB WB Blair to Bank EB EB millenium to Tunney's WB Tunney's to Millenium EB Barrhaven TC to Trim WB Trim to Barrhaven TC EB Stittsville/Fernbank to Hurdman WB Hurdman to Stittsville/fernbank EB/SB Bayshore to South Keys WB/NB South Keys to Bayshore TOTAL 12 There is a total of 1,240 passengers on route passengers transfer onto RTE 1 from other routes (OC Transpo) There is a total of 1,707 on OC special routes There is a total of 598 on STO special routes Route trips required Operating Hours Operating Cost Standby Hours Standby Cost Total Cost 1NB 1SB 13 4 buses make 2 trips and 5 buses make 1 trip 17.5 $ 2, $ 1,350 $ 3,555 12WB 3 0 buses make 1 trips and 3 buses make 1 trip 5.5 $ $ 450 $ 1, EB 94EB 94WB 95EB 95WB 96EB 96WB 97 EB/SB 97WB/NB Before 12 buses $ 2, $ 1,800 $ 4,697 After 16 buses $ 4,031 - $ - $ 4,031 Total $ 6, $ 1,800 $ 8,727 Existing Frequency = 4 buses / hr 15 min headway Supplemented Service = 9 buses / hr Transit Service Frequency = 13 buses / hr 4.6 min headway
75 Supplementary Transit Services After the Event Transit passenger / hr Remaining Passenger s/hr # of Transit Trips / hr # of Bus Vehicles required Route From / to Transit Passenger span (hrs) Reserve Capacity Pass/veh Transit Trip Time (min) Layover time (min) Round Trip Time (min) 1SB NB 1, , EB Blair to Bank EB EB millenium to Tunney's WB Tunney's to Millenium EB Barrhaven TC to Trim WB Trim to Barrhaven TC EB Stittsville/Fernbank to Hurdman WB Hurdman to Stittsville/fernbank EB/SB Bayshore to South Keys WB/NB South Keys to Bayshore TOTAL 16 There is a total of 1,838 Passengers on route passengers transfer onto other OC Transpo routes 598 passengers transfer onto STO Specials at Leb There is a total of 1,327 SB Special to Billings Bridge There is a total of 380 NB Special to Kanata Route trips required Operating Hours Operating Cost Standby Hours Standby Cost Total Cost 1SB 1NB 20 7 buses make 2 trips and 6 buses make 1 trip 26.5 $ 3,339 $ 3,339 12EB 3 0 buses make 1 trips and 3 buses make 1 trip 5.5 $ 692 $ EB 94EB 94WB 95EB 95WB 96EB 96WB 97 EB/SB 97WB/NB TOTAL 16 buses $ 4,031 - $ - $ 4,031 Existing Frequency = 4 buses / hr 15 min headway Supplemented Service = 13 buses / hr Transit Service Frequency = 17 buses / hr 3.5 min headway
76 25,000 Person Event Supplementary Service on RTE 1 & RTE 12 Route 1 from Lebreton to Billings Bridge Special Transit Routes from P&R lots to Lansdowne Park Event Size 25,000 people Transit Mode Split target 20% transit Non - Motorized Share 12% 2975 trips Transit Special Span 1.5 hours Operator Cost/hr Stand By Cost/hr Length of Event Special Event Transit Services 126 $ / hr 60 $ / hr 3 hours Area Population (2005) % of total Attendance % transit Transit Passenger span (hrs) Transit passenger / hr Pass/veh # of Transit Trips / hr Type of Service Route Orleans 98, ,580 99, ,448 24% Special Barrhaven 56, ,018 57, ,409 24% Special Kanata 88, ,233 89, ,201 24% Special SUC/Leitrim 63, ,757 63, ,558 24% Special Baseline/Nepean 121, , , ,017 18% Special Westboro/Carlingwood 71,216 77,174 71, ,756 18% Supplementary 94E 97E, 1S Vanier/Beacon 57,402 69,956 57, ,409 18% Supplementary 12W, 1S Blackburn/Industrial 44,901 44,755 45, ,113 18% Supplementary94W 95W, 1S Alta Vista/Smyth 62,842 66,168 63, ,558 8% Supplementary 1N Carleton/Confed 5,801 8,330 6, % Supplementary 1N Old Ottawa South 8,466 8,800 8, % Supplementary 1N Glebe 13,685 14,575 14, % Supplementary 1S Gatineau 139, , , ,462 24% Special Centretown/sandy hill 61,525 75,421 62, ,533 10% Supplementary 1S Lebreton/preston 25,530 37,183 26, % Supplementary 1S Rural Ottawa 84, ,829 85, ,102 25% Supplementary 1S/N Other 4,193 5,150 4, % Supplementary 12W, 1S TOTAL 1,009,136 1,501,925 1,011,000 25, % 4,924 Supplementary Transit Services Before the Event Transit passenger / hr Remaining Passenger s/hr # of Transit Trips / hr # of Bus Vehicles required Route From / to Transit Passenger span (hrs) Reserve Capacity Pass/veh Transit Trip Time (min) Layover time (min) Round Trip Time (min) 1NB SB 1, WB Blair to Bank EB EB millenium to Tunney's WB Tunney's to Millenium EB Barrhaven TC to Trim WB Trim to Barrhaven TC EB Stittsville/Fernbank to Hurdman WB Hurdman to Stittsville/fernbank EB/SB Bayshore to South Keys WB/NB South Keys to Bayshore TOTAL 15 There is a total of 1,722 passengers on route passengers transfer onto RTE 1 from other routes (OC Transpo) There is a total of 2,371 on OC special routes There is a total of 831 on STO special routes Before During Route trips required Operating Hours Operating Cost Standby Hours Standby Cost Total Cost 1NB 1SB 18 6 buses make 2 trips and 6 buses make 1 trip 24.0 $ 3, $ 1,800 $ 4,824 12WB 4 1 buses make 2 trips and 2 buses make 1 trip 6.8 $ $ 450 $ 1, EB 94EB 94WB 95EB 95WB 96EB 96WB 97 EB/SB 97WB/NB Before 15 buses $ 3, $ 2,250 $ 6,133 After 22 buses $ 5,584 - $ - $ 5,584 Total $ 9, $ 2,250 $ 11,718 Existing Frequency = 4 buses / hr 15 min headway Supplemented Service = 12 buses / hr Transit Service Frequency = 16 buses / hr 3.8 min headway
77 Supplementary Transit Services 25,000 After Transit passenger / hr Remaining Passenger s/hr # of Transit Trips / hr # of Bus Vehicles required Route From / to Transit Passenger span (hrs) Reserve Capacity Pass/veh Transit Trip Time (min) Layover time (min) Round Trip Time (min) 1SB NB 2, , , EB Blair to Bank EB EB millenium to Tunney's WB Tunney's to Millenium EB Barrhaven TC to Trim WB Trim to Barrhaven TC EB Stittsville/Fernbank to Hurdman WB Hurdman to Stittsville/fernbank EB/SB Bayshore to South Keys WB/NB South Keys to Bayshore TOTAL 22 There is a total of 2,553 Passengers on route passengers transfer onto other OC Transpo routes 831 passengers transfer onto STO Specials at Leb There is a total of 1,843 SB Special to Billings Bridge There is a total of 528 NB Special to Kanata Route trips required Operating Hours Operating Cost Standby Hours Standby Cost Total Cost 1SB 1NB 28 9 buses make 2 trips and 10 buses make 1 trip 37.5 $ 4,725 $ 4,725 12EB 4 1 buses make 2 trips and 2 buses make 1 trip 6.8 $ 859 $ EB 94EB 94WB 95EB 95WB 96EB 96WB 97 EB/SB 97WB/NB TOTAL 22 buses $ 5,584 - $ - $ 5,584 Existing Frequency = 4 buses / hr 15 min headway Supplemented Service = 19 buses / hr Transit Service Frequency = 23 buses / hr 2.6 min headway
78 40,000 Person Event Supplementary Service on RTE 1 & RTE 12 Route 1 from Lebreton to Billings Bridge Special Transit Routes from P&R lots to Lansdowne Park Event Size 40,000 people Transit Mode Split target 25% transit Non - Motorized Share 13% 5360 trips Transit Special Span 2 hours Operator Cost/hr Stand By Cost/hr Length of Event Special Event Transit Services 126 $ / hr 60 $ / hr 4 hours Area Population (2005) % of total Attendance % transit Transit Passenger span (hrs) Transit passenger / hr Pass/veh # of Transit Trips / hr Type of Service Route Orleans 98, ,580 99, ,443 30% 1, Special Barrhaven 56, ,703 57, ,983 30% Special Kanata 88, ,233 89, ,096 30% Special SUC/Leitrim 63, ,757 63, ,191 30% Special Baseline/Nepean 121, , , ,243 20% Special Westboro/Carlingwood 71,216 77,174 71, ,470 20% Supplementary 94E 97E, 1S Vanier/Beacon 57,402 69,956 57, ,983 25% Supplementary 12W, 1S Blackburn/Industrial 44,901 44,755 45, ,565 25% Supplementary 94W 95W, 1S Alta Vista/Smyth 62,842 66,168 63, ,191 12% Supplementary 1N Carleton/Confed 5,801 8,330 6, % Supplementary 1N Old Ottawa South 8,466 8,800 8, % Supplementary 1N Glebe 13,685 14,575 14, % Supplementary 1S Gatineau 279, , , ,704 30% 2, , Special Centretown/sandy hill 61,525 75,421 62, ,157 12% Supplementary 1S Lebreton/preston 25,530 37,183 26, % Supplementary 1S Rural Ottawa 84, ,829 85, ,957 30% Supplementary 1S/N Other 4,193 5,150 4, % Supplementary 12W, 1S TOTAL 1,148,730 1,498,610 1,150,000 40, % 9,997 Supplementary Transit Services 40,000 Before Transit passenger / hr Remaining Passenger s/hr # of Transit Trips / hr # of Bus Vehicles required Route From / to Transit Passenger span (hrs) Reserve Capacity Pass/veh Transit Trip Time (min) Layover time (min) Round Trip Time (min) 1NB SB 2, , , WB Blair to Bank EB EB millenium to Tunney's WB Tunney's to Millenium EB Barrhaven TC to Trim WB Trim to Barrhaven TC EB Stittsville/Fernbank to Hurdman WB Hurdman to Stittsville/fernbank EB/SB Bayshore to South Keys WB/NB South Keys to Bayshore TOTAL 22 There is a total of 3,023 passengers on route 1 1,423 passengers transfer onto RTE 1 from other routes (OC Transpo) There is a total of 4,063 on OC special routes There is a total of 2,911 on STO special routes Route trips required Operating Hours Operating Cost Standby Hours Standby Cost Total Cost 1NB 1SB buses make 2 trips and 0 buses make 2 trip 40.0 $ 5, $ 3,360 $ 8,400 12WB 7 1 buses make 2 trips and 5 buses make 1 trip 12.3 $ 1, $ 1,260 $ 2, EB 94EB 94WB 95EB 95WB 96EB 96WB 97 EB/SB 97WB/NB Before 22 buses $ 6, $ 4,620 $ 11,211 After 40 buses $ 12,093 - $ - $ 12,093 Total $ 18, $ 4,620 $ 23,305 Existing Frequency = 4 buses / hr 15 min headway Supplemented Service = 16 buses / hr Transit Service Frequency = 20 buses / hr 3.0 min headway
79 Supplementary Transit Services 40,000 After Transit passenger / hr Remaining Passenger s/hr # of Transit Trips / hr # of Bus Vehicles required Route From / to Transit Passenger span (hrs) Reserve Capacity Pass/veh Transit Trip Time (min) Layover time (min) Round Trip Time (min) 1SB NB 5, , , EB Blair to Bank EB EB millenium to Tunney's WB Tunney's to Millenium EB Barrhaven TC to Trim WB Trim to Barrhaven TC EB Stittsville/Fernbank to Hurdman WB Hurdman to Stittsville/fernbank EB/SB Bayshore to South Keys WB/NB South Keys to Bayshore TOTAL 38 There is a total of 5,934 Passengers on route 1 1,423 passengers transfer onto other OC Transpo routes 2,911 passengers transfer onto STO Specials at Leb There is a total of 3,134 SB Special to Billings Bridge There is a total of 929 NB Special to Kanata Route trips required Operating Hours Operating Cost Standby Hours Standby Cost Total Cost 1SB 1NB buses make 2 trips and 0 buses make 2 trip 85.0 $ 10,710 $ 10,710 12EB 6 2 buses make 1 trips and 4 buses make 1 trip 11.0 $ 1,383 $ 1, EB 94EB 94WB 95EB 95WB 96EB 96WB 97 EB/SB 97WB/NB TOTAL 40 buses $ 12,093 - $ - $ 12,093 Existing Frequency = 4 buses / hr 15 min headway Supplemented Service = 34 buses / hr Transit Service Frequency = 38 buses / hr 1.6 min headway
80 OC Special Services 18,000 Person Event Resource Summary Before Trips 28 After Trips 23 Billings shuttle trips 17 Before Buses 20 After Buses 17 Total Revenue Hours 30:01:00 Total Deadhead Hours 06:35:00 Total Garage Hours 27:10:00 Total Standby Hours 45:21:00 Total Hours 109:07:00 In service hours 63:46:00 Notes - trips were scheduled using current operational rules now in effect - 5% layover applied - no trip shifting - no deadhead deviation October 2011 Lansdowne Revitalization C-12
81 Block Summary 18,000 person event Block Garage From Start From Start End To To End Duration : :52 17: :39 6h : :12 17: :49 6h : :32 17: :14 6h : :47 18: :49 6h : :43 18: :54 7h : :03 17: :19 6h : :23 17: :49 5h : :38 17: :54 5h : :53 13: :57 1h : :00 17: :50 6h : :20 17: :26 5h : :40 17: :31 5h : :55 13: :42 1h : :51 13: :57 2h : :16 18: :54 7h : :36 18: :31 6h : :56 17: :14 5h : :16 17: :56 5h : :15 17: :40 5h : :40 17: :19 5h59 October 2011 Lansdowne Revitalization C-13
82 HEADWAY SHEET EFFECTIVE January 01, 2014 LINE = 550 Kanata - Lansdowne SERVICE = Lansdowne 18,000 DIRECTION = 0 RUN GARAGE FR TERRY FOX EAGLESON LANSDOWNE TO GARAGE NO. RTE STATION PARK&RIDE PARK RTE :26 SN 11:52 11:58 12: :46 SN 12:12 12:18 12: :06 SN 12:32 12:38 13: :21 SN 12:47 12:53 13: :02 13:08 13: :17 13:23 13: LINE = 550 Kanata - Lansdowne SERVICE = Lansdowne 18,000 DIRECTION = 1 RUN GARAGE FR LANSDOWNE TERRY FOX TO GARAGE NO. RTE PARK STATION RTE :35 17:13 17:39 SN :40 17: :45 17:23 17:49 SN :10 17:48 18:14 SN :45 18:23 18:49 SN HEADWAY SHEET EFFECTIVE January 01, 2014 LINE = 551 Bells Corners - Lansdowne SERVICE = Lansdowne 18,000 DIRECTION = 0 RUN GARAGE FR ROBERTSON LANSDOWNE TO GARAGE NO. RTE MOODIE PARK RTE :19 SN 11:43 12: :39 SN 12:03 12: :59 SN 12:23 13: :14 SN 12:38 13: :29 SN 12:53 13:40 13:57 SN :08 13: LINE = 551 Bells Corners - Lansdowne SERVICE = Lansdowne 18,000 DIRECTION = 1 RUN GARAGE FR BILLINGS ROBERTSON TO GARAGE NO. RTE BR.TERMINL MOODIE RTE :40 17: :45 17:25 17:49 SN :50 17:30 17:54 SN :15 17:55 18:19 SN :50 18:30 18:54 SN October 2011 Lansdowne Revitalization C-14
83 HEADWAY SHEET EFFECTIVE January 01, 2014 LINE = 552 Orleans - Lansdowne SERVICE = Lansdowne 18,000 DIRECTION = 0 RUN GARAGE FR TRIM ROAD ORLEANS LANSDOWNE TO GARAGE NO. RTE PARK&RIDE STATION PARK RTE :42 SN 12:00 12:05 12: :02 SN 12:20 12:25 12: :22 SN 12:40 12:45 13: :37 SN 12:55 13:00 13:25 13:42 SN :10 13:15 13:40 13:57 SN :25 13:30 13: LINE = 552 Orleans - Lansdowne SERVICE = Lansdowne 18,000 DIRECTION = 1 RUN GARAGE FR BILLINGS TRIM ROAD TO GARAGE NO. RTE BR.TERMINL PARK&RIDE RTE :40 17: :45 17:08 17:26 SN :50 17:13 17:31 SN :15 17:38 17:56 SN :50 18:13 18:31 SN HEADWAY SHEET EFFECTIVE January 01, 2014 LINE = 553 Barrhaven - Lansdowne SERVICE = Lansdowne 18,000 DIRECTION = 0 RUN GARAGE FR BARRHAVEN FALLOWFIEL LANSDOWNE TO GARAGE NO. RTE CENTRE STATION PARK RTE :16 SN 11:51 11:59 12: :41 SN 12:16 12:24 12: :01 SN 12:36 12:44 13: :21 SN 12:56 13:04 13: :41 SN 13:16 13:24 13: LINE = 553 Barrhaven - Lansdowne SERVICE = Lansdowne 18,000 DIRECTION = 1 RUN GARAGE FR BILLINGS BARRHAVEN TO GARAGE NO. RTE BR.TERMINL CENTRE RTE :40 17: :45 17: :05 17:39 18:14 SN :45 18:19 18:54 SN October 2011 Lansdowne Revitalization C-15
84 HEADWAY SHEET EFFECTIVE January 01, 2014 LINE = 554 Leitrim - Lansdowne SERVICE = Lansdowne 18,000 DIRECTION = 0 RUN GARAGE FR LEITRIM LANSDOWNE TO GARAGE NO. RTE PARK&RIDE PARK RTE :55 SN 12:15 12: :20 SN 12:40 13: :00 13: :20 13: :40 14: LINE = 554 Leitrim - Lansdowne SERVICE = Lansdowne 18,000 DIRECTION = 1 RUN GARAGE FR BILLINGS LEITRIM TO GARAGE NO. RTE BR.TERMINL PARK&RIDE RTE :40 16: :45 16: :05 17: :45 17:59 18:19 SN HEADWAY SHEET EFFECTIVE January 01, 2014 LINE = 560 Billings Shuttle SERVICE = Lansdowne 18,000 DIRECTION = 0 RUN GARAGE FR LANSDOWNE BILLINGS TO GARAGE NO. RTE PARK BR.TERMINL RTE :30 16: :32 16: :33 16: :33 16: :36 16: :37 16: :38 16: :38 16: :38 16: :41 16: :43 16: :50 16: :55 17: :00 17: :08 17: :20 17:27 17:40 SN :30 17:37 17:50 SN October 2011 Lansdowne Revitalization C-16
85 OC Special Services 25,000 Person Event Resource Summary Before Trips 39 After Trips 34 Billings shuttle trips 22 Before Buses 28 After Buses 25 Total Revenue Hours 43:11:00 Total Deadhead Hours 09:40:00 Total Garage Hours 31:56:00 Total Standby Hours 50:31:00 Total Hours 135:18:00 In service hours 84:47:00 Notes - trips were scheduled using current operational rules now in effect - 5% layover applied - no trip shifting - no deadhead deviation October 2011 Lansdowne Revitalization C-17
86 Block Summary 25,000 person event Block Garage From Start From Start End To To End Duration : :47 17: :39 6h : :02 17: :44 6h : :17 17: :49 5h : :27 17: :54 5h : :37 18: :04 6h : :47 17: :14 5h : :38 17: :44 6h : :53 17: :49 6h : :08 17: :54 6h : :18 17: :59 6h : :28 17: :04 6h : :38 13: :42 1h : :48 13: :52 1h : :08 13: :12 1h : :55 17: :50 6h : :10 18: :39 6h : :25 17: :16 6h : :35 17: :14 5h : :45 17: :46 5h : :55 18: :41 6h : :46 18: :49 7h : :11 17: :54 6h : :31 18: :04 7h : :46 17: :19 6h : :01 17: :19 5h : :16 17: :40 4h : :10 18: :34 6h : :35 17: :44 5h29 October 2011 Lansdowne Revitalization C-18
87 HEADWAY SHEET EFFECTIVE January 01, 2014 LINE = 550 Kanata - Lansdowne SERVICE = Lansdowne 25,000 DIRECTION = 0 RUN GARAGE FR TERRY FOX EAGLESON LANSDOWNE TO GARAGE NO. RTE STATION PARK&RIDE PARK RTE :21 SN 11:47 11:53 12: :36 SN 12:02 12:08 12: :51 SN 12:17 12:23 12: :01 SN 12:27 12:33 13: :11 SN 12:37 12:43 13: :21 SN 12:47 12:53 13: :57 13:03 13: :07 13:13 13: :17 13:23 13: LINE = 550 Kanata - Lansdowne SERVICE = Lansdowne 25,000 DIRECTION = 1 RUN GARAGE FR LANSDOWNE TERRY FOX TO GARAGE NO. RTE PARK STATION RTE :35 17:13 17:39 SN :40 17:18 17:44 SN :45 17:23 17:49 SN :50 17:28 17:54 SN :55 17: :10 17:48 18:14 SN :30 18:08 18:34 SN :00 18:38 19:04 SN October 2011 Lansdowne Revitalization C-19
88 HEADWAY SHEET EFFECTIVE January 01, 2014 LINE = 551 Bells Corners - Lansdowne SERVICE = Lansdowne 25,000 DIRECTION = 0 RUN GARAGE FR ROBERTSON LANSDOWNE TO GARAGE NO. RTE MOODIE PARK RTE :14 SN 11:38 12: :29 SN 11:53 12: :44 SN 12:08 12: :54 SN 12:18 13: :04 SN 12:28 13: :14 SN 12:38 13:25 13:42 SN :24 SN 12:48 13:35 13:52 SN :58 13: :44 SN 13:08 13:55 14:12 SN LINE = 551 Bells Corners - Lansdowne SERVICE = Lansdowne 25,000 DIRECTION = 1 RUN GARAGE FR BILLINGS ROBERTSON TO GARAGE NO. RTE BR.TERMINL MOODIE RTE :40 17:20 17:44 SN :45 17:25 17:49 SN :50 17:30 17:54 SN :55 17:35 17:59 SN :00 17:40 18:04 SN :15 17:55 18:19 SN :35 18:15 18:39 SN :00 18:40 19:04 SN October 2011 Lansdowne Revitalization C-20
89 HEADWAY SHEET EFFECTIVE January 01, 2014 LINE = 552 Orleans - Lansdowne SERVICE = Lansdowne 25,000 DIRECTION = 0 RUN GARAGE FR TRIM ROAD ORLEANS LANSDOWNE TO GARAGE NO. RTE PARK&RIDE STATION PARK RTE :37 SN 11:55 12:00 12: :52 SN 12:10 12:15 12: :07 SN 12:25 12:30 12: :17 SN 12:35 12:40 13: :27 SN 12:45 12:50 13: :37 SN 12:55 13:00 13: :05 13:10 13: :15 13:20 13: :25 13:30 13: LINE = 552 Orleans - Lansdowne SERVICE = Lansdowne 25,000 DIRECTION = 1 RUN GARAGE FR BILLINGS TRIM ROAD TO GARAGE NO. RTE BR.TERMINL PARK&RIDE RTE :40 17: :45 17: :50 17: :55 17: :05 17:28 17:46 SN :15 17: :35 17:58 18:16 SN :00 18:23 18:41 SN October 2011 Lansdowne Revitalization C-21
90 HEADWAY SHEET EFFECTIVE January 01, 2014 LINE = 553 Barrhaven - Lansdowne SERVICE = Lansdowne 25,000 DIRECTION = 0 RUN GARAGE FR BARRHAVEN FALLOWFIEL LANSDOWNE TO GARAGE NO. RTE CENTRE STATION PARK RTE :11 SN 11:46 11:54 12: :36 SN 12:11 12:19 12: :56 SN 12:31 12:39 13: :11 SN 12:46 12:54 13: :26 SN 13:01 13:09 13: :41 SN 13:16 13:24 13: LINE = 553 Barrhaven - Lansdowne SERVICE = Lansdowne 25,000 DIRECTION = 1 RUN GARAGE FR BILLINGS BARRHAVEN TO GARAGE NO. RTE BR.TERMINL CENTRE RTE :40 17: :45 17:19 17:54 SN :50 17: :10 17:44 18:19 SN :40 18:14 18:49 SN HEADWAY SHEET EFFECTIVE January 01, 2014 LINE = 554 Leitrim - Lansdowne SERVICE = Lansdowne 25,000 DIRECTION = 0 RUN GARAGE FR LEITRIM LANSDOWNE TO GARAGE NO. RTE PARK&RIDE PARK RTE :50 SN 12:10 12: :15 SN 12:35 12: :55 13: :10 13: :25 13: :40 14: LINE = 554 Leitrim - Lansdowne SERVICE = Lansdowne 25,000 DIRECTION = 1 RUN GARAGE FR BILLINGS LEITRIM TO GARAGE NO. RTE BR.TERMINL PARK&RIDE RTE :40 16: :45 16: :50 17: :10 17:24 17:44 SN :40 17:54 18:14 SN October 2011 Lansdowne Revitalization C-22
91 HEADWAY SHEET EFFECTIVE January 01, 2014 LINE = 560 Billings Shuttle SERVICE = Lansdowne 25,000 DIRECTION = 0 RUN GARAGE FR LANSDOWNE BILLINGS TO GARAGE NO. RTE PARK BR.TERMINL RTE :28 16: :31 16: :32 16: :33 16: :33 16: :33 16: :35 16: :36 16: :37 16: :38 16: :38 16: :39 16: :40 16: :41 16: :43 16: :46 16: :48 16: :55 17: :00 17: :08 17: :20 17:27 17:40 SN :30 17:37 17:50 SN October 2011 Lansdowne Revitalization C-23
92 OC Special Services 40,000 Person Event Calculation of Resources Required Buses required 18,000 25,000 40,000 Previous Method* Minibus Scheduling Resource Savings 4 buses 7 buses 17 % 20 % *from July 2010 Analysis Assume 20% reduction due to scheduling of services for 40,000 person events = 34 Buses required (savings of 8 buses) 5 hours of service per bus, and 3.5 hours of standby per bus = 170 Hours of service 119 Hours of standby October 2011 Lansdowne Revitalization C-24
93 Summary of STO Resources and Costs SPECIAL SERVICES 7,000 10,000 13,000 18,000 25,000 40,000 Buses (articulated) In-service hours Stand-by hours Cost $0 $0 $0 $2,646 $6,048 $14,364 SUPPLEMENTARY SERVICES 7,000 10,000 13,000 18,000 25,000 40,000 Buses In-service hours Stand-by hours Cost $0 $0 $0 $0 $0 $0 EXTRAS 7,000 10,000 13,000 18,000 25,000 40,000 Buses (articulated) In-service hours Stand-by hours Cost $0 $0 $1,890 $1,890 $1,890 $2,520 TOTAL 7,000 10,000 13,000 18,000 25,000 40,000 Buses (articulated) In-service hours Stand-by hours Cost $0 $0 $1,890 $4,536 $7,938 $16,884 October 2011 Lansdowne Revitalization C-25
94 STO Resources available Lundi - Jeudi Vendredi * Chauffeurs Articulés Standard * Chauffeurs Articulés Standard Non garanti! Non garanti! En TS Samedi Dimanche * Chauffeurs Articulés Standard * Chauffeurs Articulés Standard 2013 jour : jour : soir : soir : non garanti En TS En TS Disponibilités établies selon les assignations des événements spéciaux (feux du Casino, Bal de neige, Festival des montgolfières ) * Chauffeurs disponibles pour remplir un quart de travail de soir en respectant la loi, cependant il n'est pas possible de garantir que ces quarts soient assignés STO Services 10,000 to 15,000 Person Event Costs for events between 10,000 and 15,000 includes 3 extra buses to be added into service as required Extra buses are assumed to operate in service for 5 hours October 2011 Lansdowne Revitalization C-26
95 STO Services 18,000 Person Event Before Event Origine NB depl. Nb usagers Ajout Capa. NB voyage Guertin Rivermead PO Origine Tps/voyage Couts/heure Cout/voyage inclus E/S Couts soirée Std-by Couts std-by Guertin $ 168 $ 252 $ 0 0 $ Rivermead $ 189 $ 252 $ 0 0 $ PO $ 386 $ 773 $ 0 0 $ TOTAL 1,277$ 0 $ resources chauffeurs: 4 After Event Origine NB depl. Nb usagers Ajout Capa. NB voyage Guertin Rivermead PO Origine Tps/voyage Couts/heure Cout/voyage inclus E/S Couts soirée Std-by Couts std-by Guertin $ 92 $ 252 $ $ Rivermead $ 113 $ 252 $ $ PO $ 235 $ 504 $ $ TOTAL 1,008 $ 360 $ resources chauffeurs: 7 Costs for events of 18,000 includes the operation of 4 buses for special services (21 in service hours) 3 extra buses to be added into service as required October 2011 Lansdowne Revitalization C-27
96 STO Services 25,000 Person Event Before Event Origine NB depl. Nb usagers Ajout Capa. NB voyage Guertin Rivermead PO Origine Tps/voyage Couts/heure Cout/voyage inclus E/S Couts soirée Std-by Couts std-by Guertin $ 336 $ 672 $ 0 0 $ Rivermead $ 378 $ 756 $ 0 0 $ PO $ 966 $ 1,932 $ $ TOTAL 3, resources chauffeurs: 10 After Event Origine NB depl. Nb usagers Ajout Capa. NB voyage Guertin Rivermead PO Origine Tps/voyage Couts/heure Cout/voyage inclus E/S Couts soirée Std-by Couts std-by Guertin $ 185 $ 504 $ $ Rivermead $ 227 $ 504 $ $ PO $ 588 $ 1,260 $ $ TOTAL 2, resources chauffeurs: 12 Costs for events of 25,000 includes the operation of 10 buses for special services (48 in service hours) 3 extra buses to be added into service as required October 2011 Lansdowne Revitalization C-28
97 STO Services 40,000 Person Event Before Event Origine NB depl. Nb usagers Ajout Capa. NB voyage Guertin Rivermead PO Origine Tps/voyage Couts/heure Cout/voyage inclus E/S Couts soirée Std-by Couts std-by Guertin $ 672 $ 1,344 $ 0 0 $ Rivermead $ 1,134 $ 2,268 $ 0 0 $ PO $ 2,318 $ 4,637 $ $ TOTAL 8,249 $ 120 $ resources chauffeurs: 23 After Event Origine NB depl. Nb usagers Ajout Capa. NB voyage Guertin Rivermead PO Origine Tps/voyage Couts/heure Cout/voyage inclus E/S Couts soirée Std-by Couts std-by Guertin $ 370 $ 1,008 $ $ Rivermead $ 680 $ 1,512 $ $ PO $ 1,411 $ 3,024 $ $ TOTAL 5,544 $ 480 $ resources chauffeurs: 26 Costs for events of 40,000 includes the operation of 26 buses for special services (114 in service hours) 4 extra buses to be added into service as required October 2011 Lansdowne Revitalization C-29
98
99 Appendix D APPENDIX D SHUTTLE SERVICES, SCHEDULES, AND COSTS... 1 Shuttle and Off site Parking for 13,000 Person Event... 2 Shuttle and Off site Parking for 18,000 Person Event... 3 Shuttle and Off site Parking for 25,000 Person Event Shuttle and Off site Parking for 40,000 Person Event October 2011 McCORMICK RANKIN CORPORATION
100
101 APPENDIX D SHUTTLE SERVICES, SCHEDULES, AND COSTS Summary of Appendix D Contents: 13,000 Person Event Resources and Costs 18,000 Person Event Resources and Costs Shuttle Schedules 25,000 Person Event Resources and Costs Shuttle Schedules 40,000 Person Event Resources and Costs October 2011 Lansdowne Revitalization D-1
102 Off Site Parking Shuttle Services 13,000 THESE SERVICES ARE TO BE ACCOMODATED USING SUPPLEMENTED RTE 7 Auto Person 8,892 drivers or passengers Vehicle Occupancy 2.5 pass/veh Total Vehicles 3,557 vehicles On Street Parking Available 2,750 spaces evening On-Site Parking Available 500 spaces Off-Site Parking Req'd 307 spaces 768 people use shuttles Parking fee $ 6.00 per/veh Shuttle Bus Capacity 45 pass/veh Off Site Parking Lot Available Capacity Spaces Required Vehicles/hr Persons/hr Shuttle Trips/hr Transit Trip Time (min) Layover time (min) Round Trip Time (min) # of Bus Vehicles required Operating Hours per Bus Stand By Hours per bus (4 hour game) Shuttle Cost Parking fee Carleton University $ 3,139 $ 1,842 Confederation Heights $ - $ - Ottawa City Hall (VIA QED) $ - $ - Extra $ - $ - Circulator during event 20 minutes to service Carleton & confederation TOTAL 3, $ 3, $ 1,842.00
103 Off Site Parking Shuttle Services 18,000 Auto Person 12,313 drivers or passengers Vehicle Occupancy 2.5 pass/veh Total Vehicles 4,926 vehicles On Street Parking Available 2,750 spaces day On-Site Parking Available 500 spaces Off-Site Parking Req'd 1,676 spaces 4190 people use shuttles Parking fee $ 6.00 per/veh Shuttle Bus Capacity 45 pass/veh Off Site Parking Lot Available Capacity Spaces Required Vehicles/hr Persons/hr total trips Transit Trip Time (min) Layover time (min) Round Trip Time (min) # of Bus Vehicles required Operating Hours per Bus Stand By Hours per bus (4 hour game) Shuttle Cost Parking fee Both routes, to from and dur , $ 9,990 $ 8,380 Carleton , Canada Post Circulator during event 20 minutes to service Carleton & confederation 12 $ - TOTAL 5,500 3, $ 9, $ 8,380.00
104 HEADWAY SHEET EFFECTIVE January 01, 2014 LINE = 562 Carleton U Shuttle SERVICE = LanLive-18,000 DIRECTION = 0 (Before event) RUN GARAGE FR CARL "U" LANSDOWNE TO GARAGE NO. RTE TERMINAL PARK RTE :09 SN 12:27 12: :14 SN 12:32 12: :18 SN 12:36 12: :20 SN 12:38 12: :40 12: :24 SN 12:42 12: :26 SN 12:44 12: :45 12: :28 SN 12:46 12: :30 SN 12:48 12: :49 12: :51 12: :34 SN 12:52 12: :54 13: :55 13: :38 SN 12:56 13: :58 13: :59 13: :01 13: :02 13: :04 13: :05 13: :06 13: :08 13: :09 13: :11 13: :12 13: :14 13: :15 13: :16 13: :18 13: :19 13: :21 13: :22 13: :24 13: :25 13: :26 13: :28 13: :29 13: :31 13: :32 13: :34 13: :35 13: :36 13: :38 13: October 2011 Lansdowne Revitalization D-4
105 LINE = 562 Carleton U Shuttle SERVICE = LanLive-18,000 DIRECTION = 0 (Before event) RUN GARAGE FR CARL "U" LANSDOWNE TO GARAGE NO. RTE TERMINAL PARK RTE :39 13: :41 13: :42 13: :44 13: :45 13: :46 13: :48 13: :49 13: :51 13: :52 13: :54 14: :57 14: :02 14: :09 14: :14 14: October 2011 Lansdowne Revitalization D-5
106 HEADWAY SHEET EFFECTIVE January 01, 2014 LINE = 562 Carleton U Shuttle SERVICE = LanLive-18,000 DIRECTION = (After event) RUN GARAGE FR LANSDOWNE CARL "U" TO GARAGE NO. RTE PARK TERMINAL RTE :30 16: :31 16: :32 16: :34 16: :36 16: :37 16: :38 16: :39 16: :40 16: :41 16: :42 16: :43 16: :44 16: :47 16: :27 SN 16:47 16: :49 16: :50 16: :51 16: :53 16: :55 17: :56 17: :57 17: :58 17: :59 17: :00 17: :01 17: :02 17: :03 17: :05 17: :07 17: :08 17: :09 17: :10 17: :11 17: :12 17: :13 17: :15 17: :17 17:23 17:40 SN :18 17: :19 17:25 17:42 SN :20 17:26 17:43 SN :21 17: :22 17:28 17:45 SN :23 17: :25 17:31 17:48 SN October 2011 Lansdowne Revitalization D-6
107 LINE = 562 Carleton U Shuttle SERVICE = LanLive-18,000 DIRECTION = (After event) RUN GARAGE FR LANSDOWNE CARL "U" TO GARAGE NO. RTE PARK TERMINAL RTE :26 17: :27 17:33 17:50 SN :29 17: :31 17:37 17:54 SN :34 17: :37 17:43 18:00 SN :39 17: :43 17:49 18:06 SN :48 17:54 18:11 SN :55 18:01 18:18 SN October 2011 Lansdowne Revitalization D-7
108 HEADWAY SHEET EFFECTIVE January 01, 2014 LINE = 564 Canada Post Shuttle SERVICE = LanLive-18,000 DIRECTION = (Before event) RUN GARAGE FR CANADA LANSDOWNE TO GARAGE NO. RTE POST RDWY PARK RTE :10 SN 12:26 12: :18 SN 12:34 12: :21 SN 12:37 12: :24 SN 12:40 12: :44 12: :30 SN 12:46 12: :32 SN 12:48 12: :34 SN 12:50 12: :53 13: :56 13: :00 13: :03 13: :06 13: :09 13: :11 13: :14 13: :17 13: :20 13: :23 13: :25 13: :28 13: :31 13: :34 13: :37 13: :40 13: :43 13: :46 13: :48 13: :51 14: :56 14: :02 14: :06 14: :11 14: October 2011 Lansdowne Revitalization D-8
109 HEADWAY SHEET EFFECTIVE January 01, 2014 LINE = 564 Canada Post Shuttle SERVICE = LanLive-18,000 DIRECTION = (After event) RUN GARAGE FR LANSDOWNE CANADA TO GARAGE NO. RTE PARK POST RDWY RTE :30 16: :33 16: :36 16: :39 16: :41 16: :43 16: :45 16: :48 16: :51 16: :53 17: :56 17: :58 17: :01 17: :03 17: :06 17: :09 17: :11 17:19 17:35 SN :13 17: :16 17: :19 17:27 17:43 SN :21 17: :23 17:31 17:47 SN :26 17:34 17:50 SN :29 17: :33 17:41 17:57 SN :38 17: :45 17:53 18:09 SN :55 18:03 18:19 SN October 2011 Lansdowne Revitalization D-9
110 HEADWAY SHEET EFFECTIVE January 01, 2014 LINE = 565 Carl U-Can Post Shuttle SERVICE = LanLive-18,000 DIRECTION = (During event) RUN GARAGE FR LANSDOWNE CARL "U" CANADA TO GARAGE NO. RTE PARK TERMINAL POST RDWY RTE :15 14:21 14: :30 14:36 14: :45 14:51 14: :00 15:06 15: :15 15:21 15: :30 15:36 15: :45 15:51 15: :00 16:06 16: :10 16:16 16: :15 16:21 16: :20 16:26 16: :22 16:28 16: October 2011 Lansdowne Revitalization D-10
111 Off Site Parking Shuttle Services 25,000 Auto Person 17,101 drivers or passengers Vehicle Occupancy 2.5 pass/veh Total Vehicles 6,841 vehicles On Street Parking Available 2,750 spaces day On-Site Parking Available 500 spaces Off-Site Parking Req'd 3,591 spaces 8978 people use shuttles Parking fee $ 6.00 per/veh Shuttle Bus Capacity 45 pass/veh Off Site Parking Lot Available Capacity Spaces Required Vehicles/hr Persons/hr total trips Transit Trip Time (min) Layover time (min) Round Trip Time (min) # of Bus Vehicles required Operating Hours per Bus Stand By Hours per bus (4 hour game) Shuttle Cost Parking fee Both routes, to from and dur 3,350 3, $ 24,630 $ 16,750 Carleton , Canada Post ,100 #DIV/0! 26 Vincent Massey 600 included with Canada Post Circulator during event 20 minutes to service Carleton & confederation 13 $ - TOTAL 6,700 6, #DIV/0! $ 24, $ 16,750.00
112 LINE = 562 Carleton U Shuttle SERVICE = LanLive-25,000 DIRECTION = (Before event) RUN GARAGE FR CARL "U" LANSDOWNE TO GARAGE NO. RTE TERMINAL PARK RTE :08 SN 12:26 12: :10 SN 12:28 12: :12 SN 12:30 12: :14 SN 12:32 12: :16 SN 12:34 12: :17 SN 12:35 12: :18 SN 12:36 12: :19 SN 12:37 12: :20 SN 12:38 12: :39 12: :22 SN 12:40 12: :41 12: :24 SN 12:42 12: :43 12: :26 SN 12:44 12: :45 12: :28 SN 12:46 12: :47 12: :48 12: :49 12: :50 12: :51 12: :33 SN 12:51 12: :52 12: :53 12: :54 13: :55 13: :56 13: :57 13: :58 13: :59 13: :41 SN 12:59 13: :00 13: :01 13: :02 13: :03 13: :04 13: :05 13: :06 13: :07 13: :08 13: :09 13: :09 13: :10 13: :11 13: :12 13: :13 13: :14 13: :15 13: :16 13: October 2011 Lansdowne Revitalization D-12
113 LINE = 562 Carleton U Shuttle SERVICE = LanLive-25,000 DIRECTION = (Before event) RUN GARAGE FR CARL "U" LANSDOWNE TO GARAGE NO. RTE TERMINAL PARK RTE :17 13: :18 13: :19 13: :19 13: :20 13: :21 13: :22 13: :23 13: :24 13: :25 13: :26 13: :27 13: :27 13: :28 13: :29 13: :30 13: :31 13: :13 SN 13:31 13: :32 13: :33 13: :34 13: :35 13: :36 13: :37 13: :37 13: :38 13: :39 13: :40 13: :41 13: :41 13: :42 13: :43 13: :44 13: :45 13: :46 13: :47 13: :48 13: :49 13: :49 13: :50 13: :51 13: :52 13: :53 13: :54 14: :57 14: :00 14: :03 14: :09 14: :14 14: October 2011 Lansdowne Revitalization D-13
114 LINE = 562 Carleton U Shuttle SERVICE = LanLive-25,000 DIRECTION = (After event) RUN GARAGE FR LANSDOWNE CARL "U" TO GARAGE NO. RTE PARK TERMINAL RTE :30 16: :31 16: :32 16: :33 16: :33 16: :34 16: :35 16: :36 16: :37 16: :37 16: :38 16: :39 16: :40 16: :41 16: :42 16: :42 16: :43 16: :44 16: :45 16:51 17:08 SN :25 SN 16:45 16: :46 16: :47 16: :48 16: :48 16: :49 16: :50 16: :51 16: :52 16: :53 16: :53 16: :54 17: :55 17: :56 17: :57 17: :57 17: :58 17: :59 17: :00 17: :01 17: :02 17: :03 17:09 17:26 SN :03 17: :04 17: :05 17: :06 17: :07 17: :07 17: :08 17: :09 17: :10 17: October 2011 Lansdowne Revitalization D-14
115 LINE = 562 Carleton U Shuttle SERVICE = LanLive-25,000 DIRECTION = (After event) RUN GARAGE FR LANSDOWNE CARL "U" TO GARAGE NO. RTE PARK TERMINAL RTE :11 17: :12 17: :13 17: :14 17: :15 17: :15 17:21 17:38 SN :16 17: :17 17: :18 17: :19 17: :20 17: :21 17: :22 17: :23 17: :24 17: :25 17: :25 17:31 17:48 SN :26 17: :27 17: :28 17:34 17:51 SN :29 17: :30 17:36 17:53 SN :31 17: :32 17:38 17:55 SN :33 17: :34 17:40 17:57 SN :35 17: :36 17:42 17:59 SN :37 17:43 18:00 SN :38 17:44 18:01 SN :39 17: :40 17:46 18:03 SN :42 17: :44 17: :46 17:52 18:09 SN :48 17:54 18:11 SN :52 17:58 18:15 SN :55 18:01 18:18 SN :58 18:04 18:21 SN October 2011 Lansdowne Revitalization D-15
116 LINE = 563 Vin Mass-Can Post Shuttle SERVICE = LanLive-25,000 DIRECTION = (Before event) RUN GARAGE FR VINCENT CANADA LANSDOWNE TO GARAGE NO. RTE MASSEY PK POST RDWY PARK RTE :01 SN 12:19 12:24 12: :03 SN 12:21 12:26 12: :05 SN 12:23 12:28 12: :07 SN 12:25 12:30 12: :09 SN 12:27 12:32 12: :11 SN 12:29 12:34 12: :12 SN 12:30 12:35 12: :13 SN 12:31 12:36 12: :14 SN 12:32 12:37 12: :15 SN 12:33 12:38 12: :16 SN 12:34 12:39 12: :17 SN 12:35 12:40 12: :18 SN 12:36 12:41 12: :19 SN 12:37 12:42 12: :20 SN 12:38 12:43 12: :21 SN 12:39 12:44 12: :22 SN 12:40 12:45 12: :41 12:46 12: :24 SN 12:42 12:47 12: :43 12:48 12: :25 SN 12:43 12:48 12: :26 SN 12:44 12:49 12: :45 12:50 12: :28 SN 12:46 12:51 12: :47 12:52 12: :30 SN 12:48 12:53 13: :49 12:54 13: :32 SN 12:50 12:55 13: :51 12:56 13: :34 SN 12:52 12:57 13: :52 12:57 13: :53 12:58 13: :54 12:59 13: :55 13:00 13: :56 13:01 13: :57 13:02 13: :58 13:03 13: :59 13:04 13: :00 13:05 13: :01 13:06 13: :44 SN 13:02 13:07 13: :02 13:07 13: :03 13:08 13: :04 13:09 13: :05 13:10 13: :06 13:11 13: :07 13:12 13: :08 13:13 13: :09 13:14 13: :10 13:15 13: October 2011 Lansdowne Revitalization D-16
117 LINE = 563 Vin Mass-Can Post Shuttle SERVICE = LanLive-25,000 DIRECTION = (Before event) RUN GARAGE FR VINCENT CANADA LANSDOWNE TO GARAGE NO. RTE MASSEY PK POST RDWY PARK RTE :11 13:16 13: :12 13:17 13: :12 13:17 13: :13 13:18 13: :14 13:19 13: :15 13:20 13: :16 13:21 13: :17 13:22 13: :18 13:23 13: :19 13:24 13: :20 13:25 13: :21 13:26 13: :21 13:26 13: :22 13:27 13: :23 13:28 13: :24 13:29 13: :25 13:30 13: :25 13:30 13: :26 13:31 13: :27 13:32 13: :28 13:33 13: :29 13:34 13: :30 13:35 13: :31 13:36 13: :13 SN 13:31 13:36 13: :32 13:37 13: :33 13:38 13: :34 13:39 13: :35 13:40 13: :35 13:40 13: :36 13:41 13: :37 13:42 13: :38 13:43 13: :39 13:44 13: :40 13:45 13: :41 13:46 13: :42 13:47 13: :43 13:48 13: :43 13:48 13: :44 13:49 13: :45 13:50 13: :46 13:51 13: :47 13:52 13: :48 13:53 14: :50 13:55 14: :53 13:58 14: :56 14:01 14: :03 14:08 14: :08 14:13 14: October 2011 Lansdowne Revitalization D-17
118 LINE = 563 Vin Mass-Can Post Shuttle SERVICE = LanLive-25,000 DIRECTION = (After event) RUN GARAGE FR LANSDOWNE CANADA VINCENT TO GARAGE NO. RTE PARK POST RDWY MASSEY PK RTE :30 16:37 16: :31 16:38 16: :32 16:39 16: :32 16:39 16: :33 16:40 16: :34 16:41 16: :35 16:42 16: :36 16:43 16: :37 16:44 16: :37 16:44 16: :38 16:45 16: :39 16:46 16: :40 16:47 16: :41 16:48 16: :42 16:49 16:54 17:12 SN :42 16:49 16: :43 16:50 16: :44 16:51 16: :45 16:52 16: :45 16:52 16: :46 16:53 16: :47 16:54 16: :48 16:55 17: :48 16:55 17:00 17:18 SN :49 16:56 17: :50 16:57 17: :51 16:58 17: :52 16:59 17: :52 16:59 17: :53 17:00 17: :54 17:01 17: :55 17:02 17: :56 17:03 17: :57 17:04 17: :57 17:04 17:09 17:27 SN :58 17:05 17: :59 17:06 17: :00 17:07 17: :01 17:08 17: :02 17:09 17: :02 17:09 17: :03 17:10 17: :04 17:11 17: :05 17:12 17: :06 17:13 17: :07 17:14 17:19 17:37 SN :07 17:14 17: :08 17:15 17: :09 17:16 17: :10 17:17 17: October 2011 Lansdowne Revitalization D-18
119 LINE = 563 Vin Mass-Can Post Shuttle SERVICE = LanLive-25,000 DIRECTION = (After event) RUN GARAGE FR LANSDOWNE CANADA VINCENT TO GARAGE NO. RTE PARK POST RDWY MASSEY PK RTE :11 17:18 17: :12 17:19 17: :13 17:20 17: :14 17:21 17: :15 17:22 17: :15 17:22 17:27 17:45 SN :16 17:23 17: :17 17:24 17: :18 17:25 17: :19 17:26 17:31 17:49 SN :20 17:27 17: :21 17:28 17:33 17:51 SN :22 17:29 17: :23 17:30 17:35 17:53 SN :24 17:31 17: :25 17:32 17:37 17:55 SN :25 17:32 17:37 17:55 SN :26 17:33 17: :27 17:34 17:39 17:57 SN :28 17:35 17:40 17:58 SN :29 17:36 17:41 17:59 SN :30 17:37 17: :31 17:38 17:43 18:01 SN :32 17:39 17:44 18:02 SN :33 17:40 17: :34 17:41 17:46 18:04 SN :35 17:42 17:47 18:05 SN :36 17:43 17: :37 17:44 17:49 18:07 SN :38 17:45 17:50 18:08 SN :39 17:46 17:51 18:09 SN :40 17:47 17:52 18:10 SN :42 17:49 17:54 18:12 SN :44 17:51 17:56 18:14 SN :46 17:53 17:58 18:16 SN :48 17:55 18:00 18:18 SN :52 17:59 18:04 18:22 SN :55 18:02 18:07 18:25 SN :58 18:05 18:10 18:28 SN October 2011 Lansdowne Revitalization D-19
120 LINE = 566 Carl U-Can Post-Vinc Mass Shutt SERVICE = LanLive-25,000 DIRECTION = (during event) RUN GARAGE FR LANSDOWNE CARL "U" CANADA VINCENT TO NO. RTE PARK TERMINAL POST RDWY MASSEY PK RTE :15 14:21 14:27 14: :30 14:36 14:42 14: :45 14:51 14:57 15: :00 15:06 15:12 15: :15 15:21 15:27 15: :30 15:36 15:42 15: :45 15:51 15:57 16: :00 16:06 16:12 16: :10 16:16 16:22 16: :15 16:21 16:27 16: :20 16:26 16:32 16: :25 16:31 16:37 16: :26 16:32 16:38 16: October 2011 Lansdowne Revitalization D-20
121 Off Site Parking Shuttle Services 40,000 Auto Person 24, drivers or passengers Vehicle Occupancy 2.5 pass/veh Total Vehicles 9,858 vehicles On Street Parking Available 2,750 spaces day On-Site Parking Available - spaces Off-Site Parking Req'd 7,108 spaces people use shuttles Parking fee $ 6.00 per/veh Shuttle Bus Capacity 45 pass/veh Off Site Parking Lot Available Capacity Spaces Required Vehicles/hr Persons/hr Shuttle Trips/hr Transit Trip Time (min) Layover time (min) Round Trip Time (min) # of Bus Vehicles required Operating Hours per Bus Stand By Hours per bus (4 hour game) Cost Parking fee Carleton University , , $ 9,482 $ 9,000 Ottawa City Hall $ 6,005 $ 4,500 Confederation Heights ,400 1,200 3, $ 23,192 $ 14,400 Extra - 2,458 1,229 3, $ 34,269 $ 14,748 Circulator during event 20 minutes to service Carleton & confederation, 10 minutes to City Hall $ 2,016 TOTAL 4,650 7,108 3,554 8, $ 74, $ 42,648.00
122
123 Appendix E APPENDIX E SATELLITE PARKING MOU S... 1 Carleton University... 2 Canada Post... 4 Public Works Government Services Canada (Vincent Massey)... 6 Brookfield High School... 8 RA Centre October 2011 McCORMICK RANKIN CORPORATION
124
125 APPENDIX E SATELLITE PARKING MOU S Summary of Appendix E Contents: 1. Carleton University Satellite Parking MOU 2. Canada Post Satellite Parking MOU 3. Public Works Government Services Canada (Vincent Massey) Satellite Parking MOU 4. Brookfield High School Satellite Parking MOU 5. RA Centre Satellite Parking MOU October 2011 Lansdowne Revitalization E-1
126
127
128
129
130
131
132
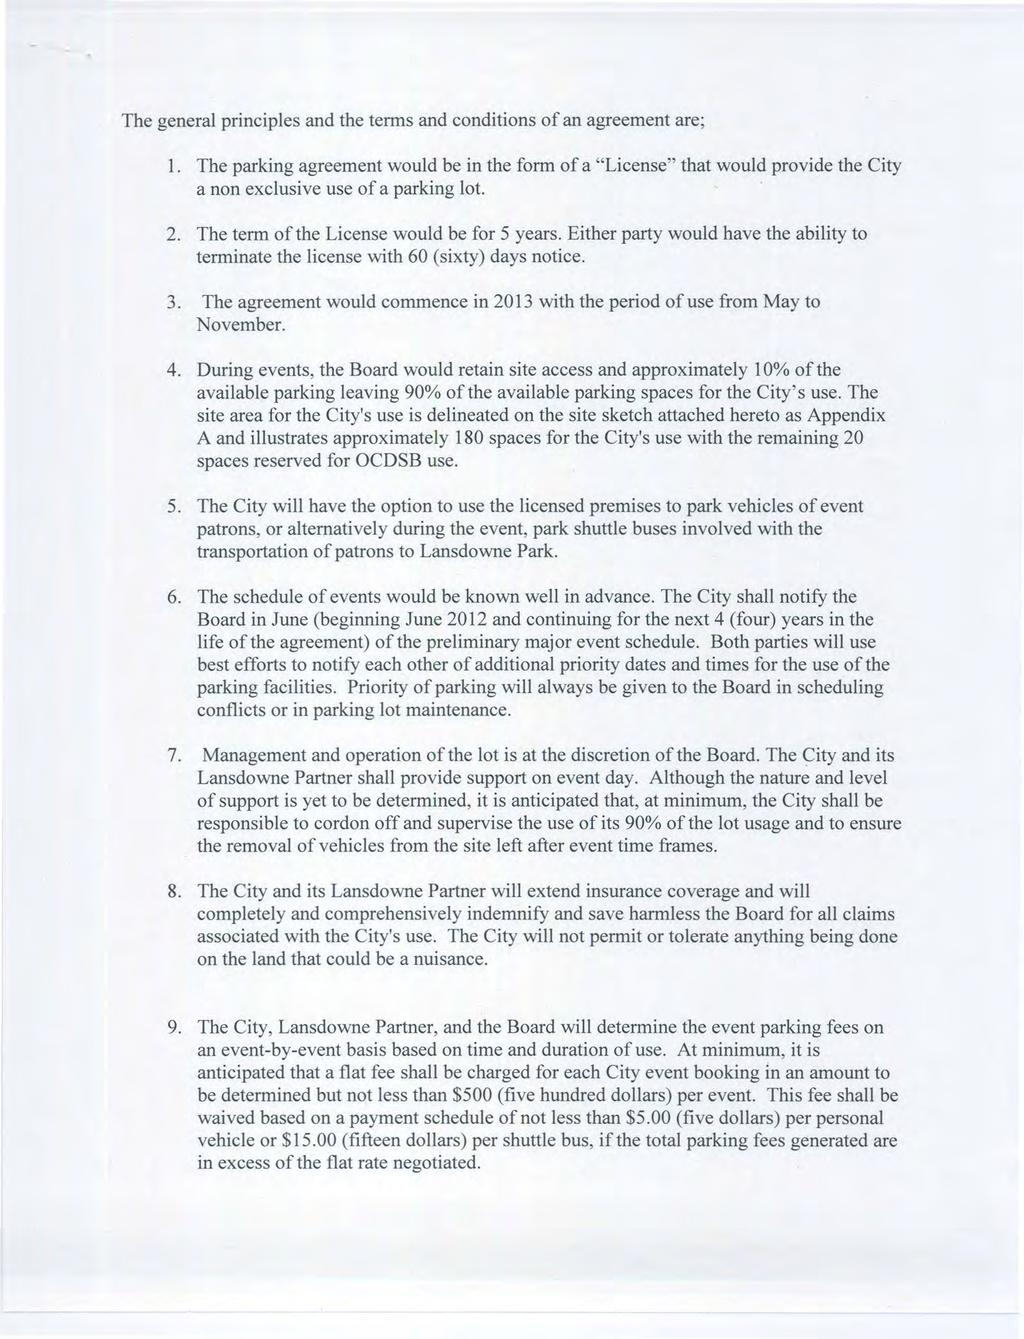
133
134
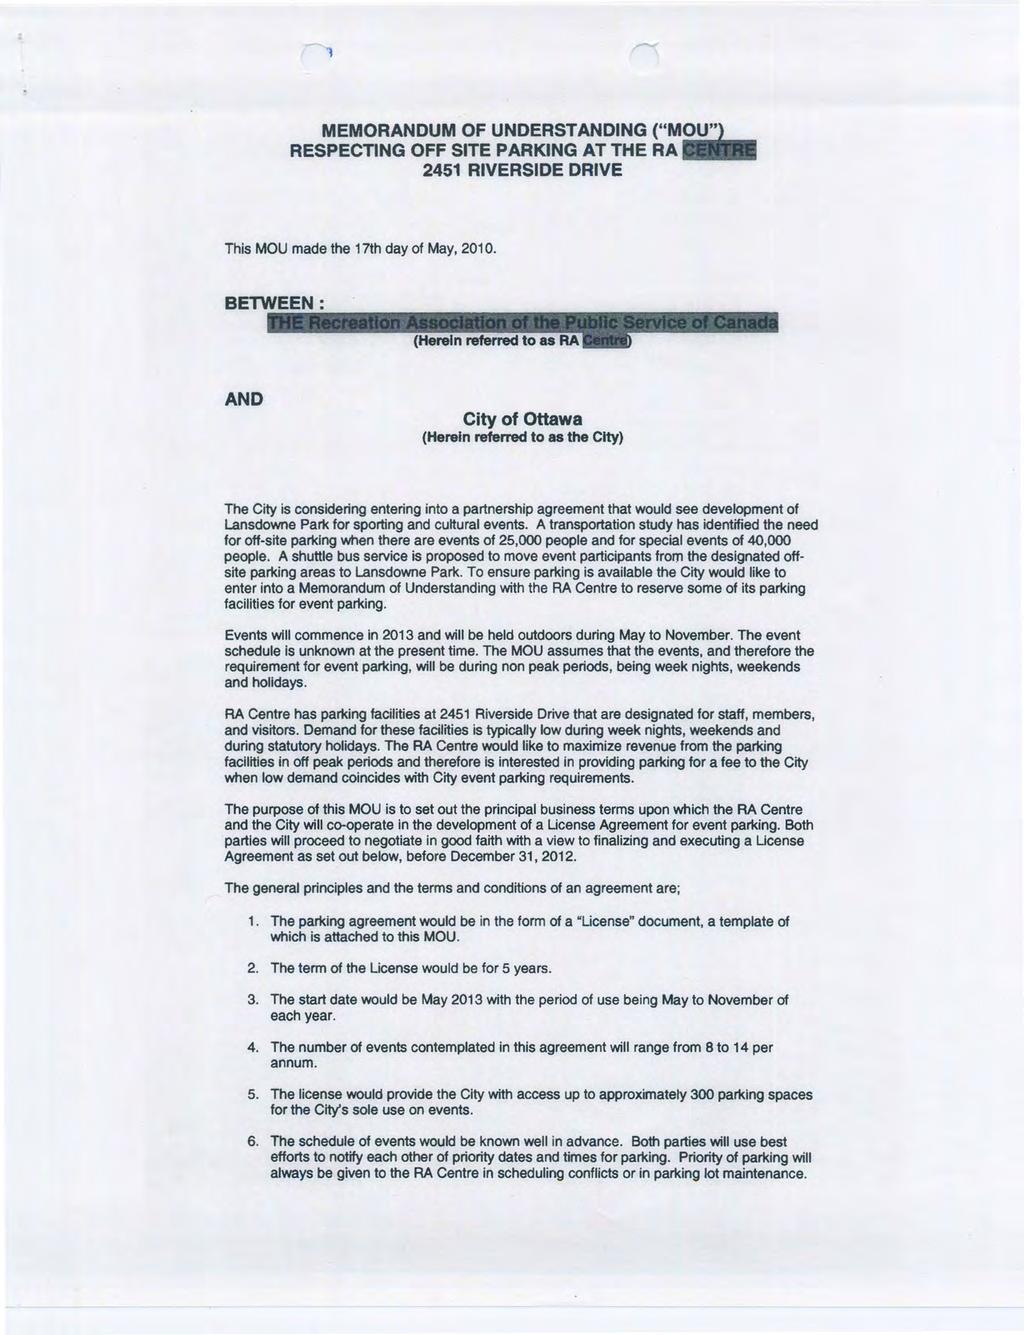
135
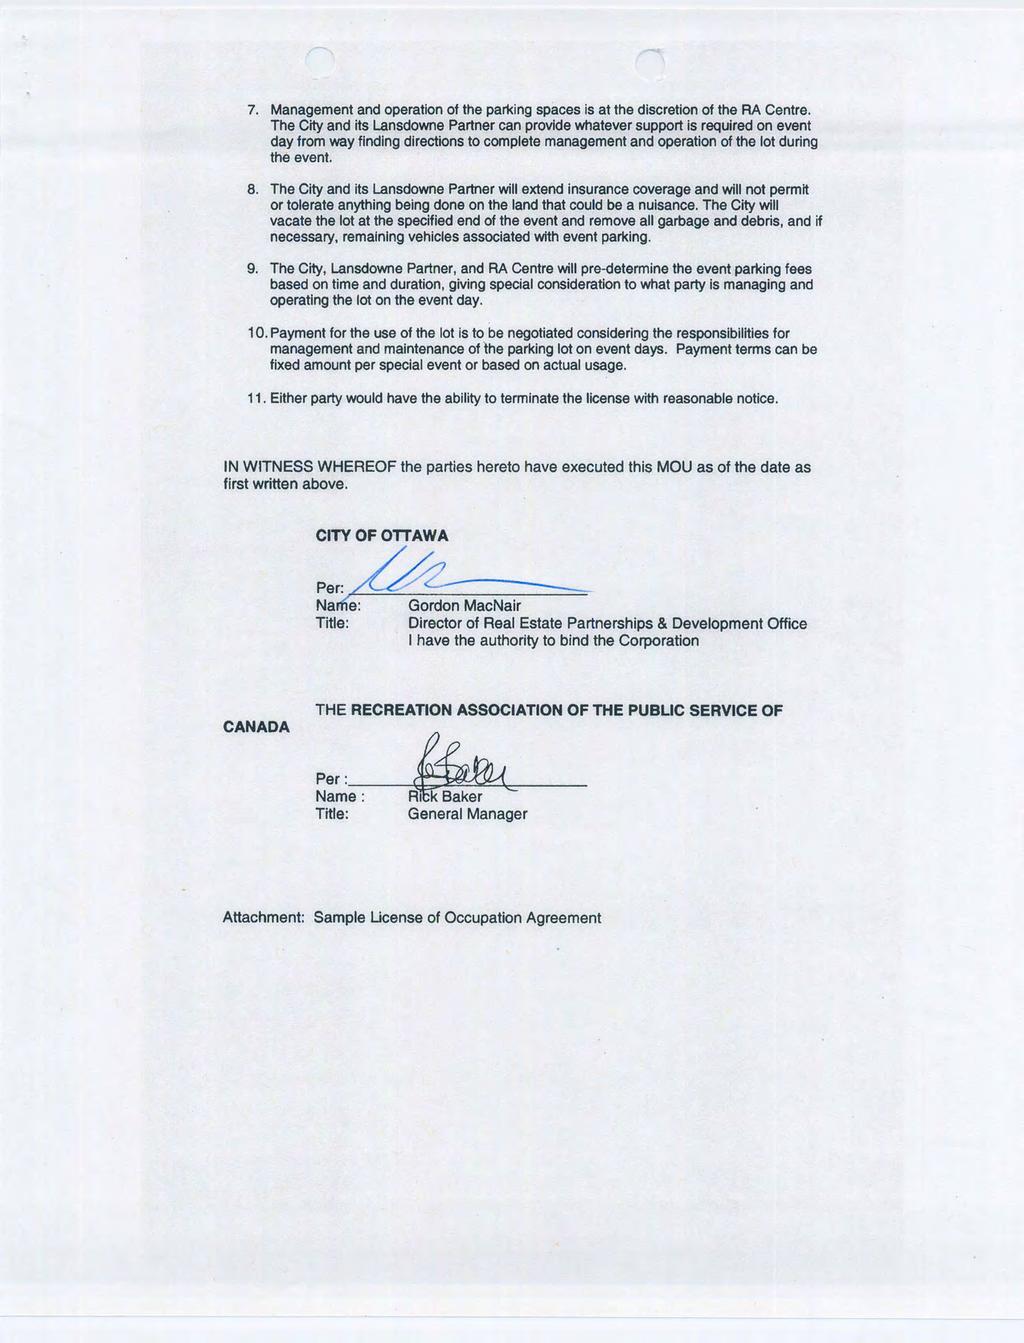
136
Stittsville OC Transpo Services
 Stittsville OC Transpo Services Transportation Services Department March 22, 2018 0 Ottawa s Transit Challenge 1 1 What s Coming in 2018 O-Train Network 2 2 Confederation Line - Alignment 3 3 VEHICLE AND
Service and Operations Planning for Ottawa s New Light Rail Line Pat Scrimgeour
 Service and Operations Planning for Ottawa s New Light Rail Line Pat Scrimgeour Manager, Transit Service Planning and Reporting OC Transpo Ottawa, Ontario Ottawa Light Rail Project 12.5 km, 13 stations
Key Transfer Stations - Technical Memo
 DOCUMENT 5 October 2008 Key - Technical Memo 1.0 INTRODUCTION In May 2008 Council approved a Primary Rapid Transit Network which includes both Light Rail Transit (LRT) and Bus Rapid Transit (BRT) corridors.
RE: Taggart Retail Site Plan: Kanata West Proposal for Traffic Impact Study: Addendum #2
 1223 Michael Street, Suite 100, Ottawa, Ontario K1J 7T2 Tel: 613.738.4160 Fax: 613.739.7105 www.delcan.com July 9, 2014 OUR REF: TO3073TOK00 BY EMAIL: jparkes@taggart.ca/aturner@taggart.ca Taggart Commercial
Husky Stadium: TMP Modernization Project
 Husky Stadium: TMP Modernization Project 1 Husky Stadium: TMP History 2 Husky Stadium TMP History 1986-1987 Husky Stadium adds the north upper deck. City of Seattle and UW agree on a plan (TMP) to mitigate
9. Downtown Transit Plan
 CORRADINO 9. Downtown Transit Plan KAT Transit Development Plan As part of the planning process for the TDP, an examination of downtown transit operations was conducted. The Downtown Transit Plan 1 is
BARRHAVEN FELLOWSHIP CRC 3058 JOCKVALE ROAD OTTAWA, ONTARIO TRANSPORTATION BRIEF. Prepared for:
 BARRHAVEN FELLOWSHIP CRC 3058 JOCKVALE ROAD OTTAWA, ONTARIO TRANSPORTATION BRIEF Prepared for: Barrhaven Fellowship CRC 3058 Jockvale Road Ottawa, ON K2J 2W7 December 7, 2016 116-649 Report_1.doc D. J.
IV. ENVIRONMENTAL IMPACT ANALYSIS K.2. PARKING
 IV. ENVIRONMENTAL IMPACT ANALYSIS K.2. PARKING ENVIRONMENTAL SETTING The following analysis summarizes the findings and conclusions of the Traffic Analysis (Traffic Study), prepared by The Mobility Group,
FREQUENTLY ASKED QUESTIONS
 FREQUENTLY ASKED QUESTIONS 2018 What is the More MARTA Atlanta program? The More MARTA Atlanta program is a collaborative partnership between MARTA and the City of Atlanta to develop and implement a program
5. OPPORTUNITIES AND NEXT STEPS
 5. OPPORTUNITIES AND NEXT STEPS When the METRO Green Line LRT begins operating in mid-2014, a strong emphasis will be placed on providing frequent connecting bus service with Green Line trains. Bus hours
Converting BRT to LRT in the Nation s Capital Ottawa, Canada. John Manconi City of Ottawa Ottawa, Canada
 Converting BRT to LRT in the Nation s Capital Ottawa, Canada John Manconi City of Ottawa Ottawa, Canada 1 The Challenge *Mackenzie King Bridge Ottawa, AM peak period 2 The Challenge Ottawa s population
TORONTO TRANSIT COMMISSION REPORT NO.
 Form Revised: February 2005 TORONTO TRANSIT COMMISSION REPORT NO. MEETING DATE: October 24, 2012 SUBJECT: DOWNTOWN RAPID TRANSIT EXPANSION STUDY (DRTES) PHASE 1 STRATEGIC PLAN ACTION ITEM RECOMMENDATIONS
appendix 4: Parking Management Study, Phase II
 appendix 4: Parking Management Study, Phase II A4-1 A4-2 Eastlake Parking Management Study Final Phase 2 Report Future Parking Demand & Supply January 6, 2017 Submitted by Denver Corp Center III 7900 E.
TORONTO TRANSIT COMMISSION REPORT NO.
 Revised: March/13 TORONTO TRANSIT COMMISSION REPORT NO. MEETING DATE: March 26, 2014 SUBJECT: COMMUNITY BUS SERVICES ACTION ITEM RECOMMENDATION It is recommended that the Board not approve any routing
Click to edit Master title style
 Nelson/Nygaard Consulting Associates SERVICE IMPROVEMENT STRATEGIES September 22, 2015 1 PROJECT OVERVIEW & WORK TO DATE 1. Extensive stakeholder involvement Throughout 2. System and market assessment
STRATEGIC PRIORITIES AND POLICY COMMITTEE MAY 5, 2016
 STRATEGIC PRIORITIES AND POLICY COMMITTEE MAY 5, 2016 Shift Rapid Transit Initiative Largest infrastructure project in the city s history. Rapid Transit initiative will transform London s public transit
EUGENE-SPRINGFIELD, OREGON EAST WEST PILOT BRT LANE TRANSIT DISTRICT
 EUGENE-SPRINGFIELD, OREGON EAST WEST PILOT BRT LANE TRANSIT DISTRICT (BRIEF) Table of Contents EUGENE-SPRINGFIELD, OREGON (USA)... 1 COUNTY CONTEXT AND SYSTEM DESCRIPTION... 1 SYSTEM OVERVIEW... 1 PLANNING
Phasing of TMP Transit Network
 DOCUMENT 6 Transportation Master Plan Infrastructure Requirement Study November 2008 PREFACE The recommendations and findings presented in this report are one component of a larger study to develop the
FINAL. Sound Transit Long-Range Plan Update. Issue Paper S.1: Tacoma Link Integration with Central Link. Prepared for: Sound Transit
 Sound Transit Long-Range Plan Update Issue Paper S.1: Tacoma Link Integration with Central Link Prepared for: Sound Transit Prepared by: Quade & Douglas, Inc. FINAL March 2005 Foreword This issue paper
Clean Harbors Canada, Inc.
 Clean Harbors Canada, Inc. Proposed Lambton Landfill Expansion Environmental Assessment Terms of Reference Transportation Assessment St. Clair Township, Ontario September 2009 itrans Consulting Inc. 260
Madison BRT Transit Corridor Study Proposed BRT Operations Plans
 Madison BRT Transit Corridor Study Proposed BRT Operations Plans This paper presents a description of the proposed BRT operations plan for use in the Madison BRT Transit Corridor Study. The objective is
Appendix C. Parking Strategies
 Appendix C. Parking Strategies Bremerton Parking Study Introduction & Project Scope Community concerns regarding parking impacts in Downtown Bremerton and the surrounding residential areas have existed
Downtown Lee s Summit Parking Study
 Downtown Lee s Summit Parking Study As part of the Downtown Lee s Summit Master Plan, a downtown parking and traffic study was completed by TranSystems Corporation in November 2003. The parking analysis
Lansdowne Development
 TRANSPORTATION INFORMATION TE WATER Lansdowne Development Prepared for: Ottawa Sports and Entertainment Group Prepared by: August 28, 2009 Transportation Strategy Prepared for: Ottawa Sports and Entertainment
Construction Staging Area 4 Avenue Road
 REPORT FOR ACTION Construction Staging Area 4 Avenue Road Date: September 27, 2017 To: Toronto and East York Community Council From: Acting Director, Transportation Services, Toronto and East York District
M E M O / N O T E D E S E R V I C E
 M E M O / N O T E D E S E R V I C E To / Destinataire Mayor and Members of Council Chair and Members of the Transit Commission File/N de fichier: T12-01 SER From / Expéditeur General Manager Transportation
RE: A Traffic Impact Statement for a proposed development on Quinpool Road
 James J. Copeland, P.Eng. GRIFFIN transportation group inc. 30 Bonny View Drive Fall River, NS B2T 1R2 May 31, 2018 Ellen O Hara, P.Eng. Project Engineer DesignPoint Engineering & Surveying Ltd. 200 Waterfront
Executive Summary October 2013
 Executive Summary October 2013 Table of Contents Introduction... 1 Rider Transit and Regional Connectivity... 1 Plan Overview... 2 Network Overview... 2 Outreach... 3 Rider Performance... 4 Findings...
CORE AREA SPECIFIC PLAN
 only four (A, B, D, and F) extend past Eighth Street to the north, and only Richards Boulevard leaves the Core Area to the south. This street pattern, compounded by the fact that Richards Boulevard is
Technical Memorandum
 To: Copy: From: Wally Dubyk Jennifer Murray André Sponder/Christopher Gordon, P.Eng. Re: Southminster Church 1040 Bank Street Residential Development Parking Review Technical Memorandum Date: Project:
Vanier Parkway and Presland Road Residential Development Transportation Impact Study
 Vanier Parkway and Presland Road Residential Development Transportation Impact Study Final Report (Revised) March 2011 Submitted to: Groupe Lépine Ottawa Project No. 09-1613 Submitted by: Groupe Lépine
TRANSIT FEASIBILITY STUDY Town of Bradford West Gwillimbury
 TRANSIT FEASIBILITY STUDY Town of Bradford West Gwillimbury Open House Presentation January 19, 2012 Study Objectives Quantify the need for transit service in BWG Determine transit service priorities based
Table 8-1: Service Frequencies for All Short-List Alternatives by Day of Week and Time of Day Frequency Day of Week Time of Day Time Period
 8. Operating Plans The following Section presents the operating plans for the Short-List Alternatives. The modern streetcar operating plans are presented for Alternatives 2 and 3, followed by bus rapid
The Engineering Department recommends Council receive this report for information.
 CORPORATE REPORT NO: R161 COUNCIL DATE: July 23, 2018 REGULAR COUNCIL TO: Mayor & Council DATE: July 19, 2018 FROM: General Manager, Engineering FILE: 8740-01 SUBJECT: Surrey Long-Range Rapid Transit Vision
Chapter 740, Street Vending One Year Review
 STAFF REPORT ACTION REQUIRED Chapter 740, Street Vending One Year Review Date: April 7, 2015 To: From: Wards: Reference Number: Licensing and Standards Committee Executive Director, Municipal Licensing
Chicago Transit Authority Service Standards and Policies
 Chicago Transit Authority Service Standards and Policies Overview and Objectives The Chicago Transit Authority (CTA) has revised its Service Standards and Policies in accordance with Federal Transit Administration
ROCHESTER, MINNESOTA
 ROCHESTER, MINNESOTA Rochester Public Works TRANSIT AND PARKING DIVISION Transit and Parking Manager Tony Knauer tknauer@rochestermn.gov SERVICE ATTITUDE CONSISTENCY - TEAMWORK ROCHESTER TRANSIT & PARKING
Troost Corridor Transit Study
 Troost Corridor Transit Study May 23, 2007 Kansas City Area Transportation Authority Agenda Welcome Troost Corridor Planning Study Public participation What is MAX? Survey of Troost Riders Proposed Transit
King County Metro. Columbia Street Transit Priority Improvements Alternative Analysis. Downtown Southend Transit Study. May 2014.
 King County Metro Columbia Street Transit Priority Improvements Alternative Analysis Downtown Southend Transit Study May 2014 Parametrix Table of Contents Introduction... 1 Methodology... 1 Study Area...
BROWARD BOULEVARD CORRIDOR TRANSIT STUDY
 BROWARD BOULEVARD CORRIDOR TRANSIT STUDY FM # 42802411201 EXECUTIVE SUMMARY July 2012 GOBROWARD Broward Boulevard Corridor Transit Study FM # 42802411201 Executive Summary Prepared For: Ms. Khalilah Ffrench,
IMPROVEMENT CONCEPTS
 IMPROVEMENT CONCEPTS for the South Novato Transit Hub Study Prepared by: January 11, 2010 DKS Associates With Wilbur Smith Associates IMPROVEMENT CONCEPTS Chapter 1: Introduction 1. INTRODUCTION The strategic
Transportation Feasibility Study
 Transportation Feasibility Study Nanaimo Event Centre 1 Port Drive, Nanaimo, BC Final Draft Report v3.1 Prepared for City of Nanaimo Date December 14, 2016 Project No. 4103.09 CORPORATE AUTHORIZATION
BUS SERVICES IN CHAMBERLAYNE ROAD NW10
 INTRODUCTION BUS SERVICES IN CHAMBERLAYNE ROAD NW10 1 LONDON BUSES 1. This note reviews the issues in Chamberlayne Road, Kensal Rise. It covers the range of bus routes in the area, their characteristics
TRAFFIC PARKING ANALYSIS
 TRAFFIC PARKING ANALYSIS NAPA FLEA MARKET COUNTY OF NAPA Prepared for: Tom Harding Napa-Vallejo Flea Market 33 Kelly Road American Canyon, CA 9453 Prepared by: 166 Olympic Boulevard, Suite 21 Walnut Creek,
Re: Addendum No. 4 Transportation Overview 146 Mountshannon Drive Ottawa, Ontario
 April 18 th, 2017 Mr. Kevin Yemm Vice President, Land Development Richraft Group of Companies 2280 St. Laurent Boulevard, Suite 201 Ottawa, Ontario (Tel: 613.739.7111 / e-mail: keviny@richcraft.com) Re:
Public Meeting. City of Chicago Department of Transportation & Department of Housing and Economic Development
 Public Meeting City of Chicago Department of Transportation & Department of Housing and Economic Development Funded by Regional Transportation Authority September 12, 2011 In partnership with Presentation
The Re:Queen and Sparks Traffic Brief - Addendum #2
 June 11, 2015 Ashcroft Homes 18 Antares Drive Ottawa, ON K2E 1A9 EMAIL: mpham@ashcrofthomes.com Attention: May Pham Development Planner Dear May, Re: The Re:Queen and Sparks Traffic Brief - Addendum #2
MERIVALE PRIORITY SQUARE 2852 MERIVALE ROAD CITY OF OTTAWA TRANSPORTATION BRIEF. Prepared for: ONT Inc. 25 Winding Way Nepean, Ontario K2C 3H1
 MERIVALE PRIORITY SQUARE 2852 MERIVALE ROAD CITY OF OTTAWA TRANSPORTATION BRIEF Prepared for: 2190986ONT Inc. 25 Winding Way Nepean, Ontario K2C 3H1 October 6, 2010 110-502 Report_1.doc D. J. Halpenny
2.4 TRANSIT VISION 2040 FROM VISION TO ACTION. Support the revitalization of urban cores STRATEGIC DIRECTION
 TRANSIT VISION 2040 FROM VISION TO ACTION TRANSIT VISION 2040 defines a future in which public transit maximizes its contribution to quality of life with benefits that support a vibrant and equitable society,
Report to Rapport au: Transit Commission Commission du transport en commun 15 June 2016 / 15 juin 2016
 1 Report to Rapport au: Transit Commission Commission du transport en commun 15 June 2016 / 15 juin 2016 Submitted on June 1, 2016 Soumis le 1 juin 2016 Submitted by Soumis par: Steve Kanellakos, City
TRANSPORTATION REVIEW
 TRANSPORTATION REVIEW - PROPOSED MIX OF LAND USES IS CONSISTENT WITH THE CITY S UNDER THE GRANVILLE BRIDGE POLICIES THAT AIM TO MEET NEIGHBOURING RESIDENTS SHOPPING NEEDS AND REDUCE RELIANCE ON AUTOMOBILE
Executive Summary EXECUTIVE SUMMARY Parking Issues Trenton Downtown Parking Policy and Sidewalk Design Standards E.S. Page 1 Final Report 2008
 EXECUTIVE SUMMARY A walkable environment that accommodates market demand while minimizing the negative impacts of growth is an important element in promoting the City s downtown revitalization. There are
Organization. SDOT Date and Commute Seattle. Dave Sowers, Deputy Program Administrator
 Organization SDOT Date and Commute Seattle Dave Sowers, Deputy Program Administrator October 22, 2018 TODAY S FOCUS The big picture #Realign99 closure/opening the tunnel Removal, decommissioning, surface
Bi-County Transitway/ Bethesda Station Access Demand Analysis
 Bi-County Transitway/ Bethesda Station Access Demand Analysis Prepared for: Washington Metropolitan Area Transit Authority Office of Planning and Project Development May 2005 Prepared by: in conjunction
RE: INNES / TRIM RETIREMENT RESIDENCE TRANSPORTATION OVERVIEW
 IBI GROUP 400 333 Preston Street Ottawa ON KS 5N4 Canada tel 63 225 3 fax 63 225 9868 ibigroup.com April 4, 207 Asad Yousfani, M.Eng., P.Eng. Project Manager, Infrastructure Approvals, Transportation City
2 EXISTING ROUTE STRUCTURE AND SERVICE LEVELS
 2 EXISTING ROUTE STRUCTURE AND SERVICE LEVELS In the Study Area, as in most of the Metro Transit network, there are two distinct route structures. The base service structure operates all day and the peak
A Transit Plan for the Future. Draft Network Plan
 A Transit Plan for the Future Draft Network Plan Project Overview and Status Completed Market Analysis and Service Evaluation. Developed Plan Framework and Guiding Principles. Developed a draft Five Year
Capital Metro Downtown Multimodal Station
 Capital Metro Downtown Multimodal Station Stakeholder Briefing December 11, 2015 Agenda 1 2 3 4 5 Project Summary Downtown Station Concept Evaluation 4 th Street Traffic Analysis 5 th Street Traffic Analysis
Operating & Maintenance Cost Results Report
 Operating & Maintenance Cost Results Report Prepared for: Hennepin County Regional Railroad Authority Prepared by: Connetics Transportation Group Under Contract To: Kimley-Horn and Associates FINAL June
CONFEDERATION LINE EAST SEGMENT
 The O-Train Confederation Line project is the first stage in Ottawa s future light rail network. The 12.5 kilometre electric rail system will replace existing diesel powered buses, providing rapid transit
CTfastrak Expansion. Stakeholder Meeting #4 Manchester Town Hall June 3, 2016
 CTfastrak Expansion Stakeholder Meeting #4 Manchester Town Hall June 3, 2016 Today s Agenda Phase I Update 2016 Service Plan Implementation Schedule & Cost Update Phase II Services Timeline Market Analysis
GO Transit s deliverable: the 2020 Service Plan
 GO Transit s deliverable: the 2020 Service Plan GO Transit s 2020 Service Plan describes GO s commitment to customers, existing and new, to provide a dramatically expanded interregional transit option
WATFORD LOCAL PLAN PART 2. Review of Car Parking Policy and Standards. Evidence Base. February 2012
 WATFORD LOCAL PLAN PART 2 Review of Car Parking Policy and Standards Evidence Base February 2012 1.0 Background 1.1 The Watford District Plan 2000 contains various policies relating to the provision of
Executive Summary. Treasure Valley High Capacity Transit Study Priority Corridor Phase 1 Alternatives Analysis October 13, 2009.
 Treasure Valley High Capacity Transit Study Priority Corridor Phase 1 Alternatives Analysis October 13, 2009 Background As the Treasure Valley continues to grow, high-quality transportation connections
Stadium Expansion Parking Plan and Transportation Management Program
 University of Washington Stadium Expansion Parking Plan and Transportation Management Program 2001 Data Collection Summary Contents Background... Introduction... Executive Summary... TMP Elements... Transit
Pedestrians, Cars, Buses and Trains? Considerations for Rapid Transit Service at Western University
 Pedestrians, Cars, Buses and Trains? Considerations for Rapid Transit Service at Western University Shift: The City of London s Rapid Transit Proposal Shift: The City of London s Rapid Transit Proposal
1 Downtown LRT Connector: Draft Concept
 Downtown LRT Connector: Draft Concept Plan November 2010 We re moving forward. Get involved. On June 21, 2010, City Council approved a street-level downtown LRT route, including a connector for the future
UTA Transportation Equity Study and Staff Analysis. Board Workshop January 6, 2018
 UTA Transportation Equity Study and Staff Analysis Board Workshop January 6, 2018 1 Executive Summary UTA ranks DART 6 th out of top 20 Transit Agencies in the country for ridership. UTA Study confirms
April 2010 April 2010 Presented by Alan Eirls
 April 2010 April 2010 Presented by Alan Eirls A Partnership Between the Coeur d Alene Tribe, the State of Idaho, the KMPO, and Kootenai County. Current System The Citylink system began on the Coeur d Alene
EXECUTIVE SUMMARY. Introduction
 EXECUTIVE SUMMARY Introduction The purpose of this study is to ensure that the Village, in cooperation and coordination with the Downtown Management Corporation (DMC), is using best practices as they plan
TORONTO TRANSIT COMMISSION REPORT NO.
 Revised: March/13 TORONTO TRANSIT COMMISSION REPORT NO. MEETING DATE: SUBJECT: August 19, 2014 OPPORTUNITIES TO IMPROVE TRANSIT SERVICE IN TORONTO ACTION ITEM RECOMMENDATIONS It is recommended that the
CITY OF LONDON STRATEGIC MULTI-YEAR BUDGET ADDITIONAL INVESTMENTS BUSINESS CASE # 6
 2016 2019 CITY OF LONDON STRATEGIC MULTI-YEAR BUDGET ADDITIONAL INVESTMENTS BUSINESS CASE # 6 STRATEGIC AREA OF FOCUS: SUB-PRIORITY: STRATEGY: INITIATIVE: INITIATIVE LEAD(S): BUILDING A SUSTAINABLE CITY
Mercer Island Center for the Arts Parking Management Plan
 Parking Stalls Mercer Island Center for the Arts Parking Management Plan June 15, 2016 This Parking Management Plan (P) covers all tenants at the Mercer Island Center for the Arts (MICA) campus, including
Final Report 1.0 INTRODUCTION 2.0 METHODOLOGY
 Final Report Date: December 7, 2015 To: Mitch Moroziuk cc: From: James Donnelly 1.0 INTRODUCTION The City of Penticton has requested that Urban Systems Ltd. investigate the potential parking impacts of
TIMBERVINE TRANSPORTATION IMPACT STUDY FORT COLLINS, COLORADO JANUARY Prepared for:
 TIMBERVINE TRANSPORTATION IMPACT STUDY FORT COLLINS, COLORADO JANUARY 2014 Prepared for: Hartford Companies 1218 W. Ash Street Suite A Windsor, Co 80550 Prepared by: DELICH ASSOCIATES 2272 Glen Haven Drive
The City of Toronto s Transportation Strategy July 2007
 The City of Toronto s Transportation Strategy July 2007 Presentation Outline Transportation Statistics Transportation Building Blocks Toronto s Official Plan Transportation and City Building Vision Projects
This letter summarizes our observations, anticipated traffic changes, and conclusions.
 Mr. David Jorschumb Project Manager Boulder Valley School District Re: Review of proposed school access improvements at the Foothills Elementary School in Boulder Dear Mr. Jorschumb, At your request, the
M E M O / N O T E D E S E R V I C E
 M E M O / N O T E D E S E R V I C E To / Destinataire From / Expéditeur Mayor and Members of Council Chair and Members of the Transit Commission General Manager Transportation Services Department File/N
Confederation Line West Queensway Terrace North. May 27, 2017
 Confederation Line West Queensway Terrace North May 27, 2017 Agenda Background Lincoln Fields Station Concept LRT alignment, southwest of Lincoln Fields to Queensway, including: Pedestrian bridge replacement
Strategic Plan
 2005-2015 Strategic Plan SUMMARY OF THE REVISED PLAN IN 2011 A decade focused on developing mass transit in the Outaouais A updated vision of mass transit in the region The STO is embracing the future
TRAFFIC IMPACT STUDY. USD #497 Warehouse and Bus Site
 TRAFFIC IMPACT STUDY for USD #497 Warehouse and Bus Site Prepared by: Jason Hoskinson, PE, PTOE BG Project No. 16-12L July 8, 216 145 Wakarusa Drive Lawrence, Kansas 6649 T: 785.749.4474 F: 785.749.734
Mississauga Transit 2009 Budget
 Mississauga Transit 2009 Budget Budget Committee Presentation December 2, 2008 Revenue Ridership Forecasted 2008 Total Rides Including transfers 11% growth in the last 24 months Transit Service Area Business
Travel Time Savings Memorandum
 04-05-2018 TABLE OF CONTENTS 1 Background 3 Methodology 3 Inputs and Calculation 3 Assumptions 4 Light Rail Transit (LRT) Travel Times 5 Auto Travel Times 5 Bus Travel Times 6 Findings 7 Generalized Cost
Table of Contents INTRODUCTION... 3 PROJECT STUDY AREA Figure 1 Vicinity Map Study Area... 4 EXISTING CONDITIONS... 5 TRAFFIC OPERATIONS...
 Crosshaven Drive Corridor Study City of Vestavia Hills, Alabama Table of Contents INTRODUCTION... 3 PROJECT STUDY AREA... 3 Figure 1 Vicinity Map Study Area... 4 EXISTING CONDITIONS... 5 TRAFFIC OPERATIONS...
Chapter 740, Street Vending One Year Bylaw Review
 Chapter 740, Street Vending One Year Bylaw Review Licensing and Standards Committee City Hall, 2 nd Floor, Committee Room 1 Tuesday April 21, 2015 Carleton Grant, Director, Policy and Strategic Support
Energy Technical Memorandum
 Southeast Extension Project Lincoln Station to RidgeGate Parkway Prepared for: Federal Transit Administration Prepared by: Denver Regional Transportation District May 2014 Table of Contents Page No. Chapter
1 On Time Performance
 MEMORANDUM: US 29 Travel Time & OTP To: From: Joana Conklin, Montgomery County DOT James A. Bunch, SWAI Subject: US 29 Travel Time and On Time Performance Analysis Date: This memorandum documents the US
PROPOSED TRAFFIC RESOLUTION
 Reference Number: TR 52-18 Location: Frobisher Street and Severn Street - Island Bay Proposal: Information: To provide two new bus stop locations on Frobisher Street, and change the time restriction on
ACT Canada Sustainable Mobility Summit Planning Innovations in Practice Session 6B Tuesday November 23, 2010
 ACT Canada Sustainable Mobility Summit Planning Innovations in Practice Session 6B Tuesday November 23, 2010 Presentation Outline Context t of Mississauga i City Centre Implementing Paid Parking and TDM
Location Concept Plan Amendment Recommendation Approved 2011 Concept Plan
 Valley Line West LRT Concept Plan Recommended Amendments Lewis Farms LRT Terminus Site Location Concept Plan Amendment Recommendation Approved 2011 Concept Plan Lewis Farms LRT terminus site, 87 Avenue/West
April 2011 April 2011 Presented by Robert Spaulding & Alan Eirls
 April 2011 April 2011 Presented by Robert Spaulding & Alan Eirls A Partnership Between the Coeur d Alene Tribe, FTA, the State of Idaho, the Local MPO, and Kootenai County. Current System The Citylink
CITY OF LOS ANGELES INTER-DEPARTMENTAL MEMORANDUM
 CITY OF LOS ANGELES INTER-DEPARTMENTAL MEMORANDUM Date: April 11, 2018 To: The Honorable City Council c/o City Clerk, Room 395, City Hall Attention: Honorable Mike Bonin, Chair, Transportation Committee
Update on Community or Heritage Rail Project (Project Manager Services) The Engineering Department recommends that Council:
 The Engineering Department recommends that Council:") Corporate NO: R279 Report COUNCIL DATE: DECEMBER 18, 2006 REGULAR COUNCIL TO: Mayor & Council DATE: December 15, 2006 FROM: General Manager, Engineering FILE: 8710-20 (Heritage) SUBJECT: Update on Community
Corporate NO: R279 Report COUNCIL DATE: DECEMBER 18, 2006 REGULAR COUNCIL TO: Mayor & Council DATE: December 15, 2006 FROM: General Manager, Engineering FILE: 8710-20 (Heritage) SUBJECT: Update on Community
TECHNICAL MEMORANDUM. Part A: Introduction
 TECHNICAL MEMORANDUM To: David J. Decker Decker Properties, Inc. 5950 Seminole Centre Ct. Suite 200 Madison, Wisconsin 53711 608-663-1218 Fax: 608-663-1226 www.klengineering.com From: Mike Scarmon, P.E.,
Maryland Gets to Work
 I-695/Leeds Avenue Interchange Reconstruction Baltimore County Reconstruction of the I-695/Leeds Avenue interchange including replacing the I-695 Inner Loop bridges over Benson Avenue, Amtrak s Northeast
Welcome The City has undertaken a naming exercise for the existing and future LRT lines. The SE to West LRT, as the project has been called to date,
 Welcome The City has undertaken a naming exercise for the existing and future LRT lines. The SE to West LRT, as the project has been called to date, is now called the Valley Line. We are here to present
RE: 67/71 Marquette Avenue Redevelopment Transportation Overview
 1223 Michael Street, Suite 100, Ottawa, Ontario K1J 7T2 Tel: 613.738.4160 Fax: 613.739.7105 www.delcan.com April 23, 2014 OUR REF: TO3157TOA00 BY EMAIL: mark.larose@urbanrisedevelopment.com Urban Rise
Washington Metropolitan Area Transit Authority
 Executive Summary: Metrobus Network Evaluation and Future Fleet Needs Presented to: Washington Metropolitan Area Transit Authority Submitted by: In Association with P 2 D Joint Venture Introduction Metrobus
Light rail, Is New Zealand Ready for Light Rail? What is Needed in Terms of Patronage, Density and Urban Form.
 Light rail, Is New Zealand Ready for Light Rail? What is Needed in Terms of Patronage, Density and Urban Form. THE PROBLEM LIGHT RAIL THE SOLUTION? INTRODUCTION Light rail transit (LRT) provides the opportunity
Parking Management Element
 Parking Management Element The State Transportation Planning Rule, adopted in 1991, requires that the Metropolitan Planning Organization (MPO) area implement, through its member jurisdictions, a parking