TransLink/MoTI SURREY RAPID TRANSIT ALTERNATIVES ANALYSIS PHASE 2 EVALUATION
|
|
|
- Myles Hunt
- 5 years ago
- Views:
Transcription
1 TransLink/MoTI SURREY RAPID TRANSIT ALTERNATIVES ANALYSIS PHASE 2 EVALUATION FINAL EVALUATION REPORT, AUGUST, 2012 In association with Hatch Mott Macdonald, Golder Associates, A. Steadman, and Coriolis

2 E1. Introduction TransLink and the BC Ministry of Transportation and Infrastructure (MoTI) sponsored a multi-phase study to evaluate alternatives for rapid transit in Surrey and surrounding communities. The Cities of Surrey and Langley, and Metro Vancouver were partners in the study. The Corporation of Delta, the City of White Rock, and the Township of Langley were also involved in the process at key milestones. Since the 1990s regional plans have identified expansion of rapid transit in Surrey as a priority to help shape future travel and growth there. Surrey and the South of the Fraser area are home to an already significant and growing portion of the region s population and employment. Surrey alone is expected to accommodate more than a quarter of Metro Vancouver s residential growth over the next 30 years. Surrey Metro Centre is also poised to become a second downtown for the region, with large scale residential, commercial and institutional growth expected, including SFU Surrey and a relocated Surrey City Hall. Transit usage is increasing across Surrey s communities, but remains well below the regional average at 8% of all trips. In December 2009, IBI Group was retained to examine a range of rapid transit technology and alignment alternatives to respond to these conditions. The study area, shown in Exhibit E.1, extends along King George Boulevard, Fraser Highway and 104 Avenue through most of Surrey. It encompasses the communities of Surrey Centre, Newton, Guildford, Fleetwood, Cloverdale/Clayton, South Surrey/White Rock, and Langley Centre, as well as significant agricultural lands within its almost 300 square kilometres. Exhibit E.1 Surrey Rapid Transit - Study Area Page vii.
3 The Surrey Rapid Transit Study is being undertaken in three phases and IBI Group has led the technical work of the first two phases. Phase 1 - Shortlist Identification: technology and alignment alternatives are identified and screened in order to arrive at a shortlist of alternatives for further development in Phase 2. Phase 2 - Alternatives Development and Evaluation: shortlisted alternatives are further developed and evaluated to support a decision on a preferred alternative. Phase 3 - Design Development: after selection of a preferred alternative, further design development and costing is undertaken. Phase 3 will establish a budget, timeline and phasing for the project and provide the basis for project definition, securing funding and procurement. The study has involved stakeholder and public consultation at each step and this has informed the study process and outcomes. E2. Evaluation Process and Alternatives Considered The study undertook a review of the current and expected conditions in the study area, and with stakeholder and public input synthesized project objectives in order to ensure that the rapid transit solutions identified and evaluated address the underlying needs and issues. Project Objectives 1. Meet, shift and help shape travel demand through better transit service; 2. Shape future land use in keeping with regional and municipal plans, including the growth of Surrey Metro Centre and other urban centres; and 3. Help achieve ambitious mode share and emissions targets. An evaluation framework was developed based on these objectives to assess the rapid transit alternatives. The study employed a Multiple Account Evaluation (MAE) approach, which provides a qualitative and quantitative evaluation across a wide range of factors or accounts to identify the benefits and impacts of each alternative in a structured format. The Surrey Rapid Transit Study MAE framework consists of seven accounts: transportation, financial, environment, urban development, economic development, social/community, and deliverability. Within each account more specific objectives and a set of qualitative and quantitative evaluation criteria and measures were developed. Exhibit E.2 summarizes the accounts, objectives and criteria employed with the evaluation. Three rapid transit technologies were considered (BRT, LRT and RRT), described in Exhibit E.3. A long list of thousands of possible alternatives was screened to a shortlist according to the evaluation framework above. The shortlist was confirmed through public consultation and thirteen alternatives were advanced for more detailed study (see Exhibit E.4). Design concepts and a multiple account evaluation were developed for each alternative and these were brought forward for public consultation. Based on the input received and further technical work, the designs and evaluations were refined and the final results documented in this report. Page viii.
4 All alternatives were evaluated against a Business As Usual (BAU) scenario as a point of reference. The BAU scenario assumes that the study area would continue to be served by buses consistent with TransLink s South of Fraser Area Transit Plan vision, with service increases consistent with past trends and forecast population and employment growth, but without rapid transit investment. A neutral rating means that an alternative would perform no better or worse than business as usual. These assessments have been summarized on a five point scale, represented as follows: Worse BAU Better Exhibit E.2 Evaluation Framework (Accounts and Criteria) Accounts Account-Level Objectives Criteria Considered Transportation Financial Environment Urban Development Economic Development Social and Community Deliverability Rapid transit is fast, frequent, reliable and attractive to all users, and integrated with the regional transit system and with active modes. Rapid transit and the supporting transit network meet current and future travel demand efficiently for multiple destinations, increasing transit mode shares and reducing vehicle kilometres travelled (VKT). Rapid transit and the supporting transit network are costeffective in meeting travel demands and shaping land use in multiple corridors Rapid transit service contributes towards achieving emission reduction targets by positively affecting travel choices. Rapid transit is sensitive to natural resources, protected lands, food-producing lands and watercourses. Rapid transit is supported by land use planning that promotes density and diversity of uses, integration of the station areas and by high quality urban design. Rapid transit supports city shaping by encouraging municipalities to focus appropriate levels of development around stations. Rapid transit supports economic development. Rapid transit is compatible with economic needs, including goods movement. Rapid transit is safe, accessible and secure. Rapid transit and the supporting transit network provide benefits to and do not disproportionately impact disadvantaged groups. The rapid transit service is constructible and operable, and avoids show-stopper constraints. The rapid transit service allows phasing flexibility and is scalable. The rapid transit service is affordable, and supported at all levels of government Transit User Effects, Non-Transit User Effects, Transit Network/ System Access, Reliability, Capacity and Expandability, Integration with Active Modes, Transit Mode Share Capital Cost, Operating Cost, Cost Effectiveness Emissions Reductions, Noise and Vibration, Biodiversity, Water Environment, Effect on Parks and Open Space, Effect on Agricultural Resources Land Use Integration, Land Use Intensification Potential, Property Requirements, Urban Design Construction Effects, Tax Revenue Effects, Goods Movement Operational Safety, Personal Security, Community Connectivity, Low Income Population Served, Heritage and Archaeology Constructability, Potential for Phasing, Time Required to Deliver, Acceptability, Affordability Page ix.


5 Exhibit E.3 Rapid Transit Technologies Considered Technology Typical Characteristics Assumptions in this Study Bus Rapid Transit Light Rail Transit Rail Rapid Transit High-frequency, medium-capacity service; High-quality stop infrastructure, with off-vehicle ticketing facilities and multiple-door, level boarding; Uses rubber-tire, low-floor articulated buses that can run on diesel, compressed natural gas or electricity; Operates in the street in reserved lanes or on street-level dedicated rights-of-way separated from other traffic; Runs on the surface, but can also be underground or elevated; Uses signal priority at intersections and serves moderatelyspaced stations at key destinations to improve journey times; and Can typically move 2,000 to 3,000 people per hour in each direction. High-frequency, high-capacity service; High-quality stop infrastructure, with off-vehicle ticketing facilities and multiple-door, level boarding; Uses driver-operated, electrically-powered rail vehicles; Operates in the street in reserved lanes or on street-level dedicated rights of way separated from other traffic Runs on the surface, but can also be underground or elevated; Has variants that include diesel light rail and tram-train; and Can typically move up to 6,000 to 10,000 people per hour in each direction. High-frequency, high-capacity service; High-quality stop infrastructure with off-vehicle ticketing facilities and multiple-door, level boarding; Comes in a variety of types, for example, the region s SkyTrain systems are automated, driverless systems powered by electricity, while Toronto and New York subways and London Underground systems typically use drivers; Typically operates completely separated from traffic, usually in a tunnel / trench, elevated structure, or fenced off at surface level; and Can typically move 10,000 to 25,000 people per hour in each direction. Low-floor articulated bus using modern, clean diesel propulsion, carries up to 100 people; Driver operated; Frequency in peak: 2 to 5 minutes, carrying up to 3,000 per hour in each direction; Alignment: mostly in segregated median lanes, with sections of side running, operation in mixed traffic, and one new bridge; Signal priority at intersections; and Street-level stations every 800 to 1600 metres, with shelters, seating, ticket vending, security cameras, real time information and wayfinding. Low-floor electrically powered rail, carries up to 240 people in two-car sets; Driver operated; Frequency in peak: 3 to 5 minutes, carrying up to 4,800 per hour in each direction; Alignment: mostly in segregated median lanes, with sections of side running, and one new bridge; Signal priority at intersections; and Street-level stations every 800 to 1600 metres, with shelters, seating, ticket vending, security cameras, real time information and wayfinding. Electrically powered SkyTrain technology, carries up to 650 people in five-car sets; Automated operation, centrally controlled; Frequency in peak: 2.3 or 4.6 minutes, carrying up to 17,000 per hour in each direction; Alignment: elevated above street; and Elevated stations every 800 to 1600 metres, with station building accessed by stairs / elevators / escalators; includes seating, ticket vending, security cameras, real time information and wayfinding. Page x.


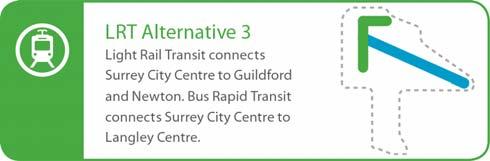
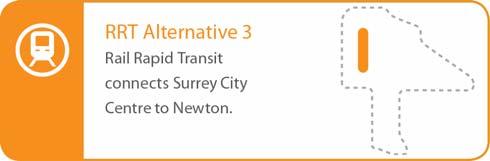
6 Exhibit E.4 Surrey Rapid Transit Study Alternatives Schematic Maps Page xi. Page xi.

7 E3. Evaluation Results The performance of each alternative within each account is summarized in Exhibit E.5 followed by an account by account description of the findings for each account. Exhibit E.5 Multiple Account Evaluation Summary for Phase 2 Alternatives Transportation The Transportation account measures the benefits and impacts to transportation network users. All alternatives would provide transportation benefits, with RRT 1A having the greatest transit user benefits due to fast, transfer-free travel times to Fraser Highway. Best Bus, LRT 4 and RRT 3 do not provide rapid transit on Fraser Highway and generate the least transit user benefits. Alternatives without rapid transit on Fraser Hwy or King George Blvd would not meet long term demand. BRT (combined with local bus service) would provide sufficient capacity on all three corridors, but would be nearing the limits by 2041 on Fraser Highway. Alternatives with LRT or RRT on Fraser Highway would provide expandability on this busy corridor. BRT and LRT alternatives require some reductions in travel lanes which somewhat increase congestion levels and travel times for nontransit users. All alternatives increase transit mode share, but at a regional scale the impact would be small. Financial The Financial account considers capital and operating costs, as well as cost-effectiveness. Capital costs for rapid transit alternatives range from $770 million (BRT 2) to $2.2 billion (RRT 1A), with the Best Bus capital cost at $290 million. With the exception of Best Bus, over the lifecycle, operating costs for all alternatives are small in relation to capital costs. Operating costs range from an Page xii.
8 additional $9 million per year (RRT 3) to $58 million (Best Bus). Generally the alternatives with the greatest extent have the highest operating costs as they require more vehicles and drivers. The BRT and RRT-based alternatives were most cost-effective overall in achieving the project objectives due to greater relative benefits (RRT) or lower costs (BRT). LRT 1 and LRT 4 performed the worst in this account, due to higher costs and minimal benefits, respectively. Environment The Environment account considers a range of criteria including regional vehicle emissions, noise and emissions, and potential for impact on biodiversity, fish bearing watercourses, parks and open space, and agricultural resources. All alternatives reduce air emissions from automobiles, but also increase emissions due to construction and/or increases in bus service. At a regional scale, emissions impacts are small relative to regional totals. Construction of rapid transit alternatives carries some risk of environmental impacts that would require mitigation. All alternatives travel through urban areas and on road rights-of-way; potential impacts on ecological resources are modest. The alternatives passing through the Agricultural Land Reserve and over Nicomekl and Serpentine rivers are viewed as having greater potential for impacts. All rapid transit alternatives produce noise and vibration, with RRT having the most potential impact. Urban Development The urban development account considers the benefits and impacts on local land uses and the urban environment. All rapid transit alternatives generate improvements in urban development, though for RRT alternatives those benefits are balanced by negative urban design impacts. All rapid transit alternatives have the potential to intensify land use around stations with the greater extent alternatives accessing the most development capacity. All alternatives attract similar amounts of development demand (14 to 19 million square feet of high density development through 2041) with most of this development forecast around existing stations in Surrey Centre and expected to occur under the BAU scenario. The BRT and LRT alternatives will improve urban design through widening of sidewalks and/or increases to boulevards. Elevated RRT alternatives have negative visual impacts due to their large guideway structures. All rapid transit alternatives require property to construct; LRT 4 and RRT 3 are shortest and require fewest properties. Economic Development The economic development account addresses the economic benefits generated by construction activity, impact on tax revenues as well as goods movement. All alternatives generate positive impacts associated with construction and tax revenue effects, however for most alternatives these are balanced by negative goods movement impacts. The construction of rapid transit is expected to generate benefits associated with employment and increases in GDP. The capital intensive alternatives have the greatest construction and tax revenue benefits (LRT 1, RRT 1, RRT 1A). There are some impacts to goods movement for the street level alternatives due to localized lane reductions and mid-block turn restrictions; similar mid-block restrictions would apply to the RRT alternatives due to guideway columns and sightlines. Social / Community The social and community account addresses a wide range of social and community benefits and impacts, including operational safety, personal security, community connectivity, service to lowincome households, and heritage and archaeological impacts. All rapid transit alternatives would improve operational safety and perceived security and they all would increase access for lowincome populations. Alternatives with the greatest extent would provide the greatest safety and access benefits. Street level stations and driver operated vehicles are perceived as most secure, and therefore BRT and LRT alternatives rated higher than RRT alternatives on perceived security. All alternatives would remove some minor vehicular crossings, having a negative impact on Page xiii.
9 community connectivity, though they do maintain pedestrian and cyclist crossings and increase pedestrian refuges. No impacts to heritage or archaeological sites have been identified. Deliverability The deliverability account considers potential issues associated with implementing the alternative, including the ease and speed with which it can be constructed, potential for phasing, public acceptability, and affordability. All alternatives are deliverable subject to funding, based on analysis to date. Larger LRT and RRT alternatives are more complex to construct, with greater utility conflicts. All alternatives require a similar length of time to deliver (4 to 7 years). Best Bus and BRT have the most potential for phasing, while single route rail alternatives have the least potential. Market research indicates that the most significant factor in public acceptability is the extent of coverage, with rapid transit alternatives that would serve all three corridors being deemed most acceptable relative to Business as Usual. There is a wide range in capital and lifecycle costs; affordability of alternatives cannot be assessed through this study as the sources and other uses of funds at a regional scale have not been identified. Sensitivity Tests A range of sensitivity tests were undertaken to assess the robustness of the above evaluation results to variations in land use, transportation model assumptions, emissions assumptions and financial inputs. While the specific results from the sensitivity tests varied from the base evaluation, the relative performance of the alternatives remained generally consistent. The tests identified the following risks and opportunities for further consideration in a later phase: BRT on Fraser Hwy would not have the capacity to meet forecast 2041 peak demand on that corridor in the event of : (1) accelerated population and employment growth in the study area over that forecast in the Regional Growth Strategy; and/or (2) lower levels of connecting bus service growth than called for in the South of Fraser Area Transit Plan; Emerging bus propulsion technologies have potential to reduce GHG emissions at low lifecycle costs for alternatives containing BRT. Optimization of connecting local bus service, through development of a detailed transit integration plan, has potential to achieve operating cost savings for all of the alternatives. E4. Key Findings and Conclusions Based on this evaluation and considering the primary project objectives identified for the study area, the following conclusions can be drawn: Capacity to Meet Demand By 2041, rapid transit will be required to serve demand on Fraser Hwy and King George Blvd. Conventional bus service can continue to meet demand on 104 Ave through BRT and local bus service combined provide sufficient capacity to meet forecast demand (2041) on all three corridors. On Fraser Hwy, BRT is forecast to be at capacity in 2041, with uncertain ability to expand further 1. LRT and RRT meet forecast demand on Fraser Hwy (2041) and provide the opportunity for expansion. 1 The use of high capacity bi-articulated buses for BRT has not been evaluated in this phase of the study. Further analysis will take place in a later study phase to identify the specific vehicle requirements for the preferred alternative. Page xiv.
10 Shape Land Use All of the rapid transit alternatives support additional development demand in rapid transit station areas, consistent with the regional growth strategy and local plans. The rapid transit alternatives with the greatest extent provide connectivity between the six largest of the seven urban centres in the study area, and are expected to attract the most station area development. Over the next thirty years 47 million square feet of multifamily and office development is forecast for the entire study area, of which 14.2 million square feet is anticipated to take place around the existing SkyTrain stations in Surrey. The additional station area development attracted by rapid transit ranges from 1 to 5.2 million square feet by Additional land use and demand management measures may increase the share of development drawn to station areas, but these were not evaluated in the study. Shift Trips and Achieve Mode Share and Emissions Targets All alternatives increase transit trips and mode share, and do so in similar amounts when considered at the scale of the region. Within the study area, alternatives with RRT increase transit trips and mode share the most. On King George Boulevard, alternatives with transfer-free service between Surrey Centre and South Surrey attract more new transit trips than those with a transfer at Newton. For all the alternatives, the number of new transit trips is small relative to the number of trips shifted from bus to rapid transit, and to the total number of transit trips in the region. Therefore, at a regional scale, and when considered in isolation, they all have a similar and limited impact on regional and sub-regional mode share and greenhouse gas emissions. None of these supply-side interventions would achieve mode share or emission targets, consistent with findings elsewhere in the region. Demand-side measures, such as road pricing, tolling, higher parking rates or gas prices, may complement rapid transit expansion to further increase transit mode share, but were not evaluated in depth in the study. Exhibit E.6 summarizes selective quantitative measures for the Phase 2 alternatives, relative to the original project objectives. The Business as Usual case is presented for comparison. It also indicates the capital cost for construction and the net present value of costs (capital and operating costs and fare revenue, discounted at 6% to 2010). Page xv.
11 Exhibit E.6 Summary of Selected Measures Measure Capacity to Meet Demand Business As Usual Best Bus BRT 1 BRT 2 LRT 1 LRT 2 LRT 3 LRT 4 LRT 5a LRT 5b RRT 1 RRT 1a RRT 2 RRT Forecast Peak Load (passengers per hour per direction) Assumed Capacity ** (passengers per hour per direction) Fraser Hwy 1,700* 3,000 4,300 4,350 4,300 4,300 4,350 1,700* 4,250 4,350 6,800 6,600 4,300 1,700* KGB 1,700* 3,350 3,900 3,300 3,450 3,450 3,300 3,450 3,900 3,900 1,700* 3,650 5,250 5, Ave 1,150 1,250 2,000 2,000 1,800 1,800 1,800 1,850 2,000 1,800 1,000 1,850 1,950 1,100 Fraser Hwy 1,700 4,000 4,700 4,700 6,500 4,700 4,700 1,700 6,500 6,500 10,200 10,200 4,700 1,700 KGB 1,700 4,000 4,700 4,700 6,500 6,500 6,500 6,500 4,700 4,700 1,700 4,700 18,700 18,700 Transit Trips and Mode Share 104 Ave 1,700 4,000 4,700 4,700 6,500 6,500 6,500 6,500 4,700 6,500 1,700 4,700 4,700 1,700 Surrey Rapid Transit Daily Ridership (2041) New Regional Daily Transit Trips (Weekday Average, ) Reduction in Vehicle Kilometres Travelled (millions km, to 2041) *** , , , , ,000 65, , , , , ,000 81,000-11,500 13,500 11,500 12,000 12,500 12,000 4,000 12,500 13,500 17,000 24,500 17,500 8,000-1,200 1,500 1,200 1,300 1,400 1, ,400 1,500 1,500 2,400 1, Transit Peak Hour Mode Share Air Emissions (Regional / Study Area, %) 16.4 / / / / / / / / / / / / / / 14.2 CO2 Net Reduction, Life Cycle (tonnes) -524, , ,000-38, , , , ,000 66,000-50,000-56,000 54,000 Land Use Station Area Redevelopment Demand (square feet millions, to 2041) **** Costs Capital Costs ($ millions) ,180 1,510 1, ,680 1,930 1,800 2,220 1, Net Present Value of Lifecycle Costs ($ millions) ,630 1,180 1, ,280 1,460 1,260 1,670 1, * Peak Load for Business as Usual (and alternatives with the same level of service as BAU) is forecast to be above capacity and therefore is shown here at capacity. ** The assumed capacity is the level of capacity used for the purposes of evaluation and costing, and the numbers here include supporting bus service and rapid transit. The capacity of LRT is assumed to be 4,800 passengers per hour per direction (pphpd) and can be expanded to 10,000 pphpd or more subject to further analysis. RRT capacity is assumed to be 8,500 pphpd can be expanded to 26,000 pphpd. *** For context, without Surrey Rapid Transit there are projected to be 800 Billion Vehicle Kilometres Travelled in the region over the same 30-year period. **** For context, over the same 30-year period, 47 million square ft of total office and high density multifamily residential development demand is expected in the entire study area. Page xvi.
12 E5. Tradeoffs between Alternatives It is worth highlighting the following tradeoffs and considerations further to those identified relative to the project objectives. Speed, Reliability, and Frequency BRT and LRT provide similar improvements in speed and reliability, particularly on Fraser Hwy. RRT on Fraser Hwy provides the greatest speed and reliability improvements for those travelling on that corridor, associated with grade segregation of the Expo Line SkyTrain extension and avoiding the requirement to transfer at Surrey Central / King George for those travelling to or from the existing SkyTrain system. On King George Boulevard, improvements in speed and reliability depend on whether or not there is a transfer required to reach White Rock. Direct BRT service between Surrey Central and White Rock (included in BRT 1, LRT 5A, LRT 5B and RRT 1A) provides the greatest overall speed improvements over local bus. LRT/BRT combinations with a transfer in Newton (LRT 1 and LRT 2) also have speed improvements over local bus, but overall are slower than the single BRT service over the length of the corridor. All alternatives provide high frequencies of service. For example, on Fraser Hwy during the 2041 peak hour, RRT provides service every 4-5 minutes, LRT every 3 minutes, and BRT every 2 minutes to provide sufficient capacity to meet forecasted demand. These frequencies would be higher than needed if the population and employment growth in the study area was less than the forecast in the RGS. Urban Design BRT and LRT provide the greatest potential to improve urban design. RRT on Fraser Hwy or King George Blvd would introduce an elevated guideway and stations, and have a negative visual impact on the corridor. Timing and Phasing All alternatives can be constructed in phases, with differences based on technology and extent, which would spread out the capital requirements over a longer period of time. Best Bus and BRT alternatives have the greatest potential for phasing, including the ability to begin operating service and generating benefits independent from the construction of the rapid transit guideway. BRT infrastructure can be planned and designed for future conversion to LRT or RRT, at increased costs and with impacts to users during the conversion. Phasing plans have not been developed or evaluated through this study. Affordability There is a large range in capital and lifecycle costs for the alternatives. The capital costs of the alternatives range from $290 million for Best Bus to over $2.2 billion for RRT 1A. An assessment of affordability can only be made by considering regional investment needs relative to available funding. Such an assessment cannot be done within an alternatives analysis focused on the assessment of an individual subregion. Page xvii
13 E6. Next Steps The results of this evaluation will help to inform the selection of a preferred alternative. The selection of an alternative will take place within a regional context, to allow the consideration of funding availability for this project and other regional transportation investment needs. Once a preferred alternative has been identified, Phase 3 will advance the planning and design of that alternative, and carry out further public consultation to aid in design development. The technical scope would include more detailed design of the alignments and intersection layouts, station locations, station area planning and urban design, transit service integration, and environmental study and identification of any mitigation measures. Page xviii.
Executive Summary. Phase 2 Evaluation Report. Introduction
 , Executive Summary Executive Summary Introduction TransLink and the Province of British Columbia sponsored a multi-phase study to evaluate alternatives for rapid transit service in the Broadway corridor
The Engineering Department recommends Council receive this report for information.
 CORPORATE REPORT NO: R161 COUNCIL DATE: July 23, 2018 REGULAR COUNCIL TO: Mayor & Council DATE: July 19, 2018 FROM: General Manager, Engineering FILE: 8740-01 SUBJECT: Surrey Long-Range Rapid Transit Vision
STRATEGIC PRIORITIES AND POLICY COMMITTEE MAY 5, 2016
 STRATEGIC PRIORITIES AND POLICY COMMITTEE MAY 5, 2016 Shift Rapid Transit Initiative Largest infrastructure project in the city s history. Rapid Transit initiative will transform London s public transit
CITY OF LONDON STRATEGIC MULTI-YEAR BUDGET ADDITIONAL INVESTMENTS BUSINESS CASE # 6
 2016 2019 CITY OF LONDON STRATEGIC MULTI-YEAR BUDGET ADDITIONAL INVESTMENTS BUSINESS CASE # 6 STRATEGIC AREA OF FOCUS: SUB-PRIORITY: STRATEGY: INITIATIVE: INITIATIVE LEAD(S): BUILDING A SUSTAINABLE CITY
Form Revised: February 2005 TORONTO TRANSIT COMMISSION REPORT NO. MEETING DATE: August 30, SUBJECT: Scarborough Rt Strategic Plan
 Form Revised: February 2005 TORONTO TRANSIT COMMISSION REPORT NO. MEETING DATE: August 30, 2006 SUBJECT: Scarborough Rt Strategic Plan RECOMMENDATIONS It is recommended that the Commission: 1. Endorse
Executive Summary. Draft Environmental Impact Statement/Environmental Impact Report ES-1
 Executive Summary Introduction The Eastside Transit Corridor Phase 2 Project is a vital public transit infrastructure investment that would provide a transit connection to the existing Metro Gold Line
Green Line LRT: Beltline Segment Update April 19, 2017
 Green Line LRT: Beltline Segment Update April 19, 2017 Quick Facts On April 11, 2017, City Council approved Administration s recommendation for the Green Line to be underground in the Beltline from 2 Street
5. OPPORTUNITIES AND NEXT STEPS
 5. OPPORTUNITIES AND NEXT STEPS When the METRO Green Line LRT begins operating in mid-2014, a strong emphasis will be placed on providing frequent connecting bus service with Green Line trains. Bus hours
Bi-County Transitway/ Bethesda Station Access Demand Analysis
 Bi-County Transitway/ Bethesda Station Access Demand Analysis Prepared for: Washington Metropolitan Area Transit Authority Office of Planning and Project Development May 2005 Prepared by: in conjunction
Jeffrey Busby A/Director, Infrastructure Program Management TransLink Urban Sustainability Accelerator
 TransLink: A multi-modal, integrated transport and operations system Jeffrey Busby A/Director, Infrastructure Program Management TransLink Urban Sustainability Accelerator Is the Grass Greener? Transportation
2.1 TRANSIT VISION 2040 FROM VISION TO ACTION. Expand regional rapid transit networks STRATEGIC DIRECTION
 TRANSIT VISION 2040 FROM VISION TO ACTION TRANSIT VISION 2040 defines a future in which public transit maximizes its contribution to quality of life with benefits that support a vibrant and equitable society,
Recommended Vision for the Downtown Rapid Transit Network
 Recommended Vision for the Downtown Rapid Transit Network April 2008 Presentation Overview Context Transit options Assessment of options Recommended network Building the network 2 1 Rapid Our Vision Reliable
Supports Item No. 1 T&T Committee Agenda October 5, 2010
 Supports Item No. 1 T&T Committee Agenda October 5, 2010 ADMINISTRATIVE REPORT Report Date: September 28, 2010 Contact: Jerry Dobrovolny Contact No.: 604.873.7331 RTS No.: 8301 VanRIMS No.: 08-2000-20
Appendix G: Rapid Transit Technology Backgrounder July 2017
 Appendix G: Rapid Transit Technology Backgrounder This appendix provides additional details regarding Bus Rapid Transit and Light Rail Transit technologies, with examples from other systems, including:
10-Year Vision Update. Vancouver City Council May 2, 2017
 1 10-Year Vision Update Vancouver City Council May 2, 2017 The 10-year Vision is our Regional Blueprint for Multimodal Transportation Investments Welcome 1 million more people and 500,000 more jobs in
Green Line LRT: Beltline Recommendation Frequently Asked Questions
 Green Line LRT: Beltline Recommendation Frequently Asked Questions June 2017 Quick Facts Administration has evaluated several alignment options that would connect the Green Line in the Beltline to Victoria
V03. APTA Multimodal Operations Planning Workshop August Green Line LRT
 V03 APTA Multimodal Operations Planning Workshop August 2016 Green Line LRT 2 Presentation Outline Past Present Future 3 16/03/2016 RouteAhead Update 4 4 16/03/2016 RouteAhead Update 5 5 16/03/2016 6 6
Converting BRT to LRT in the Nation s Capital Ottawa, Canada. John Manconi City of Ottawa Ottawa, Canada
 Converting BRT to LRT in the Nation s Capital Ottawa, Canada John Manconi City of Ottawa Ottawa, Canada 1 The Challenge *Mackenzie King Bridge Ottawa, AM peak period 2 The Challenge Ottawa s population
We Want Your Input! Review the design alternatives and tell us what s important to you in the design of these areas of the approved BRT Network:
 We Want Your Input! Review the design alternatives and tell us what s important to you in the design of these areas of the approved BRT Network: Richmond North of Oxford Street Richmond Row Dundas Street
TORONTO TRANSIT COMMISSION REPORT NO.
 Form Revised: February 2005 TORONTO TRANSIT COMMISSION REPORT NO. MEETING DATE: October 24, 2012 SUBJECT: DOWNTOWN RAPID TRANSIT EXPANSION STUDY (DRTES) PHASE 1 STRATEGIC PLAN ACTION ITEM RECOMMENDATIONS
Attachment 5 Eglinton West LRT Planning and Technical Update
 Eglinton West LRT Planning and Technical Update 1. Introduction In July 2016, City Council approved an Eglinton West LRT with between 8 and 12 stops between Mount Dennis and Renforth Gateway, and up to
4.0 TIER 2 ALTERNATIVES
 4.0 TIER 2 ALTERNATIVES The Tier 2 Alternatives represent the highest performing Tier 1 Alternatives. The purpose of the Tier 2 Screening was to identify the LPA utilizing a more robust list of evaluation
Needs and Community Characteristics
 Needs and Community Characteristics Anticipate Population and Job Growth in the City Strongest density of population and jobs in Ann Arbor are within the Study Area Population expected to grow 8.4% by
GO Transit s deliverable: the 2020 Service Plan
 GO Transit s deliverable: the 2020 Service Plan GO Transit s 2020 Service Plan describes GO s commitment to customers, existing and new, to provide a dramatically expanded interregional transit option
Restoration of Historic Streetcar Services in Downtown Los Angeles
 Restoration of Historic Streetcar Services in Downtown Los Angeles Alternatives Analysis Community Update Meeting August 2, 2011 Introduction Key players Local lead agency: Metro Federal lead agency: Federal
Attachment 5. High Speed Transit Planning Study REPORT SUMMARY. Prepared by: City of Edmonton Transportation Planning Branch. Stantec Consulting Ltd.
 Attachment 5 High Speed Transit Planning Study Prepared by: City of Edmonton Transportation Planning Branch Stantec Consulting Ltd. Transportation Management & Design, Inc. with Lea Consulting Ltd. [135-35130]
Metropolitan Council Budget Overview SFY
 Metropolitan Council Budget Overview SFY 2016-2017 H T t ti C itt House Transportation Committee February 4, 2015 Transit connects us to the places that matter Transportation Needs Grow as the Region Grows
Point A Point B Point C Point D. Fulton County Board of Commissioners and Mayors Meeting December 14, 2017
 Fulton County Board of Commissioners and Mayors Meeting December 14, 2017 Master Plan Overview Phase 1 Community Vision and Existing Transit Conditions Phase 2 Scenario Development Phase 3 Transit Master
Waco Rapid Transit Corridor (RTC) Feasibility Study
 Feasibility Study") Waco Rapid Transit Corridor (RTC) Feasibility Study Chris Evilia, Director of Waco Metropolitan Planning Organization Allen Hunter, General Manager Waco Transit System Jimi Mitchell, Project Manager AECOM
Waco Rapid Transit Corridor (RTC) Feasibility Study Chris Evilia, Director of Waco Metropolitan Planning Organization Allen Hunter, General Manager Waco Transit System Jimi Mitchell, Project Manager AECOM
CEDAR AVENUE TRANSITWAY Implementation Plan Update
 CEDAR AVENUE TRANSITWAY Implementation Plan Update EECUTIVE SUMMARY DECEMBER 2015 Executive Summary In 2013, the Twin Cities metropolitan area s first bus rapid transit (BRT) line, the METRO Red Line,
PEACHTREE CORRIDOR PARTNERSHIP. Current Status & Next Steps
 PEACHTREE CORRIDOR PARTNERSHIP Current Status & Next Steps PEACHTREE CORRIDOR PARTNERSHIP Why Peachtree? Why Now? I. THE CONTEXT High Level View of Phasing Discussion Potential Ridership Segment 3 Ease
Restoration of Historic Streetcar Services in Downtown Los Angeles
 Restoration of Historic Streetcar Services in Downtown Los Angeles Early Scoping Meeting for Alternatives Analysis (AA) May 17, 2011 Introduction Key players Local lead agency: Metro Federal lead agency:
Victoria Regional Rapid Transit Project
 Camosun College Highlands View Royal Saanich Victoria General Hospital Trans Canada Hwy. Island Hwy. Langford C.F.B. E&N Royal Roads University Esquimalt D.N.D. D.N.D. Colwood Victoria Victoria Regional
The City of Toronto s Transportation Strategy July 2007
 The City of Toronto s Transportation Strategy July 2007 Presentation Outline Transportation Statistics Transportation Building Blocks Toronto s Official Plan Transportation and City Building Vision Projects
7 COMPARATIVE EVALUATION OF ALTERNATIVES
 7 COMPARATIVE EVALUATION OF ALTERNATIVES 7.1 INTRODUCTION This chapter presents the comparative analysis of the four Level 2 build alternatives along with a discussion of the relative performance of the
Moving around Metro Vancouver: EXPLORING NEW APPROACHES TO REDUCING CONGESTION
 Moving around Metro Vancouver: EXPLORING NEW APPROACHES TO REDUCING CONGESTION OCTOBER 2017 IT S TIME TO ADDRESS CONGESTION IN METRO VANCOUVER It s Time is a research and public engagement DECONGESTION
Funding Scenario Descriptions & Performance
 Funding Scenario Descriptions & Performance These scenarios were developed based on direction set by the Task Force at previous meetings. They represent approaches for funding to further Task Force discussion
2013/2014 Strategic Priorities Fund Application Overview
 2013/2014 Strategic Priorities Fund Application Overview Bob Paddon, Executive Vice President Strategic Planning and Public Affairs TransLink 3 December 2013 Strategic Priorities Fund Application Context
Three ULTra Case Studies examples of the performance of the system in three different environments
 Three ULTra Case Studies examples of the performance of the system in three different environments airport application: London Heathrow : linking business and staff car parks through the access tunnel
Preliminary Definition of Alternatives. 3.0 Preliminary Definition of Alternatives
 3.0 What preliminary alternatives are being evaluated? The alternatives for the East San Fernando Valley Transit Corridor project that were considered for screening include the No Build Alternative, Transportation
Transit Access to the National Harbor
 Transit Access to the National Harbor December 2014 Table of Contents Executive Summary... 3 Introduction and Project Purpose... 6 Methodology.. 9 Definition of Alternatives..... 9 Similar Project Implementation
Rapid Transit Implementation Working Group #4 February 9, 2017
 Rapid Transit Implementation Working Group #4 February 9, 2017 Agenda 1. Business Case Update 2. Rapid Transit Master Plan Overview 3. Corridor Concepts 4. Public Consultation Event 5. Schedule Outlook
Road Map for Sustainable Transport Strategy for Colombo Metropolitan Region with Cleaner Air, through Experience
 Workshop on Air Quality and Environmentally Sustainable Transport April 28 th 2011 Don S. Jayaweera Road Map for Sustainable Transport Strategy for Colombo Metropolitan Region with Cleaner Air, through
THE WAY WE MOVE LRT FOR EVERYONE
 THE WAY WE MOVE LRT FOR EVERYONE 2 LRT for Everyone LRT FOR EVERYONE Light rail is about more than transit; it s about transforming Edmonton. As the city grows, so do its transportation needs. LRT is an
METRO Orange Line BRT American Boulevard Station Options
 METRO Orange Line BRT American Boulevard Station Options Bloomington City Council Work Session November 18, 2013 Christina Morrison BRT/Small Starts Project Office Coordinating Planning and Design AMERICAN
THE DUBLIN TRANSPORTATION INITIATIVE: HOW INTEGRATED TRANSPORTATION SOLUTIONS CHANGE A CITY
 THE DUBLIN TRANSPORTATION INITIATIVE: HOW INTEGRATED TRANSPORTATION SOLUTIONS CHANGE A CITY Innovations in Regional Transportation Plans Rail~Volution Conference, Miami 2007 Alan Jones Associate November
Seoul. (Area=605, 10mill. 23.5%) Capital Region (Area=11,730, 25mill. 49.4%)
 Capital Region (Area=11,730, 25mill. 49.4%)") Seoul (Area=605, 10mill. 23.5%) Capital Region (Area=11,730, 25mill. 49.4%) . Major changes of recent decades in Korea Korea s Pathways at a glance 1950s 1960s 1970s 1980s 1990s 2000s Economic Development
Seoul (Area=605, 10mill. 23.5%) Capital Region (Area=11,730, 25mill. 49.4%) . Major changes of recent decades in Korea Korea s Pathways at a glance 1950s 1960s 1970s 1980s 1990s 2000s Economic Development
Welcome. The purpose of today s session is to:
 Welcome The purpose of today s session is to: Update you on what we ve heard from the community Share the preferred Rapid Transit network solution Present the draft Rapid Transit Master Plan Representatives
Crenshaw-Prairie Transit Corridor Study Public Meetings
 Crenshaw-Prairie Transit Corridor Study Public Meetings Darby Park: Wednesday, February 20, 2008 6:30 8:00 PM US Bank Community Room: Thursday, February 21, 2008 6:30 8:00 PM Nate Holden Performing Arts
Yonge Relief Network Study (YRNS)
") Yonge Relief Network Study (YRNS) Report for June 25 th Metrolinx Board Meeting Leslie Woo, Chief Planning Officer Anna Pace, Director, Project Planning and Development Summary of Yonge Relief Network
Yonge Relief Network Study (YRNS) Report for June 25 th Metrolinx Board Meeting Leslie Woo, Chief Planning Officer Anna Pace, Director, Project Planning and Development Summary of Yonge Relief Network
Kendall Drive Premium Transit PD&E Study Project Kick-Off Meeting SR 94/Kendall Drive/SW 88 Street Project Development and Environment (PD&E) Study
 Study") Florida Department of Transportation District Six Kendall Drive Premium Transit PD&E Study Project Kick-Off Meeting SR 94/Kendall Drive/SW 88 Street Project Development and Environment (PD&E) Study What
Florida Department of Transportation District Six Kendall Drive Premium Transit PD&E Study Project Kick-Off Meeting SR 94/Kendall Drive/SW 88 Street Project Development and Environment (PD&E) Study What
West Broadway Transit Study. Community Advisory Committee September 17, 2015
 West Broadway Transit Study Community Advisory Committee September 17, 2015 Introductions Community Engagement Summer Outreach Fall Outreach Technical Analysis Process Update Alternatives Review Economic
Strategic Plan
 2005-2015 Strategic Plan SUMMARY OF THE REVISED PLAN IN 2011 A decade focused on developing mass transit in the Outaouais A updated vision of mass transit in the region The STO is embracing the future
ConnectGreaterWashington: Can the Region Grow Differently?
 Washington Metropolitan Area Transit Authority ConnectGreaterWashington: Can the Region Grow Differently? Transportation Planning Board (TPB) Travel Forecasting Subcommittee July 17, 2015 1 Alternatives
Pedestrians, Cars, Buses and Trains? Considerations for Rapid Transit Service at Western University
 Pedestrians, Cars, Buses and Trains? Considerations for Rapid Transit Service at Western University Shift: The City of London s Rapid Transit Proposal Shift: The City of London s Rapid Transit Proposal
Location Concept Plan Amendment Recommendation Approved 2011 Concept Plan
 Valley Line West LRT Concept Plan Recommended Amendments Lewis Farms LRT Terminus Site Location Concept Plan Amendment Recommendation Approved 2011 Concept Plan Lewis Farms LRT terminus site, 87 Avenue/West
FACTSHEET on Bus Rapid Transit System
 FACTSHEET on Bus Rapid Transit System 2017 This paper was prepared by: SOLUTIONS project This project was funded by the Seventh Framework Programme (FP7) of the European Commission www.uemi.net Layout/Design:
Metro Transit Update. Christina Morrison, Senior Planner Metro Transit BRT/Small Starts Project Office. John Dillery, Senior Transit Planner
 Metro Transit Update Christina Morrison, Senior Planner Metro Transit BRT/Small Starts Project Office John Dillery, Senior Transit Planner Metro Transit Service Development May 16, 2013 1 Transit Planning
Public Meeting. June 15, :30 7:30 p.m.
 Public Meeting June 15, 2017 5:30 7:30 p.m. Welcome 2015 Naval Station Norfolk Transit Extension Study 2015 Naval Station Norfolk Transit Extension Study 2017 Norfolk Westside Transit Study HRT and the
US 29 Bus Rapid Transit Planning Board Briefing. February 16, 2017
 US 29 Bus Rapid Transit Planning Board Briefing February 16, 2017 Project Goals Improve the quality of transit service Improve mobility opportunities and choices Enhance quality of life Support master
5 RAPID TRANSIT NETWORK PLAN PRINCIPLES, METROLINX BUSINESS CASE, AND ALTERNATIVE FINANCE AND PROCUREMENT ANALYSIS UPDATE
 5 RAPID TRANSIT NETWORK PLAN PRINCIPLES, METROLINX BUSINESS CASE, AND ALTERNATIVE FINANCE AND PROCUREMENT ANALYSIS UPDATE The Rapid Transit Public/Private Partnership Steering Committee recommends the
FINAL. Sound Transit Long-Range Plan Update. Issue Paper S.1: Tacoma Link Integration with Central Link. Prepared for: Sound Transit
 Sound Transit Long-Range Plan Update Issue Paper S.1: Tacoma Link Integration with Central Link Prepared for: Sound Transit Prepared by: Quade & Douglas, Inc. FINAL March 2005 Foreword This issue paper
Chapter 4. Design and Analysis of Feeder-Line Bus. October 2016
 Chapter 4 Design and Analysis of Feeder-Line Bus October 2016 This chapter should be cited as ERIA (2016), Design and Analysis of Feeder-Line Bus, in Kutani, I. and Y. Sado (eds.), Addressing Energy Efficiency
Calgary Transit and the Calgary Transportation Plan Chris Jordan, M.Sc., P.Eng. Coordinator, Strategic Transit Planning, Calgary Transit
 Calgary Transit and the Calgary Transportation Plan Chris Jordan, M.Sc., P.Eng. Coordinator, Strategic Transit Planning, Calgary Transit 1. Plan It Calgary the new Municipal Development Plan and Calgary
EGLINTON CROSSTOWN LIGHT RAIL TRANSIT (LRT)
") WELCOME TO OUR PUBLIC OPEN HOUSE EGLINTON CROSSTOWN LIGHT RAIL TRANSIT (LRT) Preliminary Planning for a Transit Project Assessment Open House Martin Grove Road to Pearson International Airport September
WELCOME TO OUR PUBLIC OPEN HOUSE EGLINTON CROSSTOWN LIGHT RAIL TRANSIT (LRT) Preliminary Planning for a Transit Project Assessment Open House Martin Grove Road to Pearson International Airport September
Update on Community or Heritage Rail Project (Project Manager Services) The Engineering Department recommends that Council:
 The Engineering Department recommends that Council:") Corporate NO: R279 Report COUNCIL DATE: DECEMBER 18, 2006 REGULAR COUNCIL TO: Mayor & Council DATE: December 15, 2006 FROM: General Manager, Engineering FILE: 8710-20 (Heritage) SUBJECT: Update on Community
Corporate NO: R279 Report COUNCIL DATE: DECEMBER 18, 2006 REGULAR COUNCIL TO: Mayor & Council DATE: December 15, 2006 FROM: General Manager, Engineering FILE: 8710-20 (Heritage) SUBJECT: Update on Community
Leadership NC. November 8, 2018
 v Leadership NC November 8, 2018 Planning for our region s growth The Triangle is one of the fastestgrowing regions in the nation. More than 2 million people are already part of the equation, and the
FREQUENTLY ASKED QUESTIONS
 FREQUENTLY ASKED QUESTIONS 2018 What is the More MARTA Atlanta program? The More MARTA Atlanta program is a collaborative partnership between MARTA and the City of Atlanta to develop and implement a program
Mississauga Transit 2009 Budget
 Mississauga Transit 2009 Budget Budget Committee Presentation December 2, 2008 Revenue Ridership Forecasted 2008 Total Rides Including transfers 11% growth in the last 24 months Transit Service Area Business
CITY of GUELPH Transit Growth Strategy and Plan, Mobility Services Review. ECO Committee
 CITY of GUELPH Transit Growth Strategy and Plan, Mobility Services Review ECO Committee July 19, 2010 1 Study Purpose Vision and growth strategy for Guelph Transit, ensuring broad consultation Operational
Downtown Transit Connector. Making Transit Work for Rhode Island
 Downtown Transit Connector Making Transit Work for Rhode Island 3.17.17 Project Evolution Transit 2020 (Stakeholders identify need for better transit) Providence Core Connector Study (Streetcar project
EUGENE-SPRINGFIELD, OREGON EAST WEST PILOT BRT LANE TRANSIT DISTRICT
 EUGENE-SPRINGFIELD, OREGON EAST WEST PILOT BRT LANE TRANSIT DISTRICT (BRIEF) Table of Contents EUGENE-SPRINGFIELD, OREGON (USA)... 1 COUNTY CONTEXT AND SYSTEM DESCRIPTION... 1 SYSTEM OVERVIEW... 1 PLANNING
Back ground Founded in 1887, and has expanded rapidly Altitude about 2500 meters above MSL Now among the ten largest cities in Sub Saharan Africa
 Back ground Founded in 1887, and has expanded rapidly Altitude about 2500 meters above MSL Now among the ten largest cities in Sub Saharan Africa Annual growth rate is 3.8% By 2020 population growth would
Welcome. Green Line in Your Community
 Welcome Green Line in Your Community Today's session will provide you with information about Administration's recommendation for connecting the Green Line in the Beltline to Victoria Park and Inglewood/Ramsay
What We Heard Report - Metro Line NW LRT
 What We Heard Report - Metro Line NW LRT by Metro Line NW LRT Project Team LRT Projects City of Edmonton April 11, 2018 Project / Initiative Background Name Date Location Metro Line Northwest Light Rail
Executive Summary. Treasure Valley High Capacity Transit Study Priority Corridor Phase 1 Alternatives Analysis October 13, 2009.
 Treasure Valley High Capacity Transit Study Priority Corridor Phase 1 Alternatives Analysis October 13, 2009 Background As the Treasure Valley continues to grow, high-quality transportation connections
TORONTO TRANSIT COMMISSION REPORT NO.
 Form Revised: February 2005 TORONTO TRANSIT COMMISSION REPORT NO. MEETING DATE: May 28, 2009 SUBJECT: DON MILLS STATION ACTION ITEM RECOMMENDATIONS It is recommended that the Commission: 1. Endorse the
Presentation A Blue Slides 1-5.
 Presentation A Blue Slides 1-5. 1 Presentation A Blue Slides 1-5. 2 Presentation A Blue Slides 1-5. 3 Presentation A Blue Slides 1-5. 4 Presentation A Blue Slides 1-5. 5 Transit Service right. service
UTA Transportation Equity Study and Staff Analysis. Board Workshop January 6, 2018
 UTA Transportation Equity Study and Staff Analysis Board Workshop January 6, 2018 1 Executive Summary UTA ranks DART 6 th out of top 20 Transit Agencies in the country for ridership. UTA Study confirms
BROWARD BOULEVARD CORRIDOR TRANSIT STUDY
 BROWARD BOULEVARD CORRIDOR TRANSIT STUDY FM # 42802411201 EXECUTIVE SUMMARY July 2012 GOBROWARD Broward Boulevard Corridor Transit Study FM # 42802411201 Executive Summary Prepared For: Ms. Khalilah Ffrench,
Mississauga Bus Rapid Transit Preliminary Design Project
 Mississauga Bus Rapid Transit Preliminary Design Project PUBLIC INFORMATION CENTRE OCTOBER 2008 WELCOME The Mississauga Bus Rapid Transit (BRT) Project Thank you for attending this Public Information Centre.
Capital Metro Downtown Multimodal Station
 Capital Metro Downtown Multimodal Station Stakeholder Briefing December 11, 2015 Agenda 1 2 3 4 5 Project Summary Downtown Station Concept Evaluation 4 th Street Traffic Analysis 5 th Street Traffic Analysis
Appendix B: Travel Demand Forecasts July 2017
 Appendix B: Travel Demand Forecasts July 2017 Table of Contents 1 Introduction... 2 2 Model Review and Updates... 2 2.1 Overview of Smart Moves Model ( City of London Model )... 2 2.1.1 Network and Zone
Sales and Use Transportation Tax Implementation Plan
 Sales and Use Transportation Tax Implementation Plan Transportation is more than just a way of getting from here to there. Reliable, safe transportation is necessary for commerce, economic development,
PROJECT BACKGROUND 3
 AGENDA 1. Welcome & Introductions 2. Project Background 3. Project Approach & Schedule 4. Draft Long List of Options 5. Evaluation Process 6. Next Steps 2 PROJECT BACKGROUND 3 OUR RAPID TRANSIT NETWORK
Re: EX16.1. Developing Toronto's Transit Network Plan to Attachment 5
 Re: EX16.1 Developing Toronto's Transit Network Plan to 2031 1 Contents 1. Executive Summary... 3 2. Background and Context... 7 Problem Statement... 9 Decision History on Options Development... 10 Options
Transportation 2040: Plan Performance. Transportation Policy Board September 14, 2017
 Transportation 2040: Plan Performance Transportation Policy Board September 14, 2017 Today Background Plan Performance Today s Meeting Background Board and Committee Direction 2016-2017 Transportation
Regional Transportation Investments a Vision for Metro Vancouver APPENDICES
 Regional Transportation Investments a Vision for Metro Vancouver APPENDICES Table of Contents Appendix A: Actions to Invest...A1-A70 Appendix B: Actions to Manage.....B1-B11 Appendix C: Outcomes..C1-C10
Scarborough Transit Planning
 Scarborough Transit Planning April 23, 2016 Transportation Planning Section City Planning Division Overview 1. Developing Toronto s Transit Network Plan 2. Scarborough Transit Planning 1. Minutes of last
Public Meeting. March 21, 2013 Mimosa Elementary School
 Public Meeting March 21, 2013 Mimosa Elementary School Today s Meeting Purpose 2 Where We Are The Process What We ve Heard and Findings Transit Technologies Station Types Break-out Session Where We Are
THE WILSHIRE CORRIDOR: RAIL AND ITS ALTERNATIVES. Prepared By: Jacki Murdock Transportation and Environmental Planner
 THE WILSHIRE CORRIDOR: RAIL AND ITS ALTERNATIVES Prepared By: Jacki Murdock Transportation and Environmental Planner December 13 th, 2012 Overview Characteristics of Wilshire Boulevard Overview of the
Charlotte-Mecklenburg Region Rapid Transit and Land-Use Integration
 Charlotte-Mecklenburg Region Rapid Transit and Land-Use Integration Legislative Committee on Urban Growth and Infrastructure Carolyn Flowers CEO Charlotte Area Transit System March 23, 2010 Charlotte Region
Tempe Streetcar. March 2, 2016
 Tempe Streetcar March 2, 2016 Tempe Profile 40 sq. miles, highest density in state University Town, center of region Imposed growth boundaries (density increase) Mixed use growth/intensifying land use
West Broadway Transit Study. Minnesota APA Conference Charles Carlson, Metro Transit Adele Hall, SRF Consulting September 24, 2015
 West Broadway Transit Study Minnesota APA Conference Charles Carlson, Metro Transit Adele Hall, SRF Consulting September 24, 2015 Study Context: Blue Line Planning 2 Study Context: Arterial BRT Study completed
CA PACITY TRA MWAY. November CODATU XVII High capacity tramway November
 CODA TU XVII HIGH CA PACITY TRA MWAY November 2017 CODATU XVII High capacity tramway November 2017 1 EGIS, A GLOBAL OFFER CODATU XVII High capacity tramway November 2017 2 EGIS & LIGHT RAIL TRANSIT European
Travel Time Savings Memorandum
 04-05-2018 TABLE OF CONTENTS 1 Background 3 Methodology 3 Inputs and Calculation 3 Assumptions 4 Light Rail Transit (LRT) Travel Times 5 Auto Travel Times 5 Bus Travel Times 6 Findings 7 Generalized Cost
Transportation Infrastructure Investment Program moving
 moving CALGARY What is TIIP? Ten Year Transportation Capital Program Last approved by Council in 2005 Defines: Major infrastructure projects Lifecycle programs What is TIIP? Represents current planned
WELCOME TO OUR PUBLIC OPEN HOUSE Eglinton Crosstown Light Rail Transit (LRT)
") WELCOME TO OUR PUBLIC OPEN HOUSE Eglinton Crosstown Light Rail Transit (LRT) Preliminary Planning for a Transit Project Assessment November 23 rd, 24 th, 25 th, 26 th & December 2 nd, 8 th, 10 th 2009
WELCOME TO OUR PUBLIC OPEN HOUSE Eglinton Crosstown Light Rail Transit (LRT) Preliminary Planning for a Transit Project Assessment November 23 rd, 24 th, 25 th, 26 th & December 2 nd, 8 th, 10 th 2009
CANADA LINE a Canadian P3 Success Story
 CANADA LINE a Canadian P3 Success Story Project Context The Canada Line An automated light rail rapid transit system linking downtown Vancouver with both Richmond and Vancouver International Airport Construction
Program Overview. February 2018
 Program Overview February 2018 Nashville is growing 2 and traffic is getting worse 5 Nashville spoke; we listened Transit Improvement Program Frequent Transit Bus AccessRide and Mobility on Demand Neighborhood