INTEGRATED GO RER- SMARTTRACK OPTIONS
|
|
|
- Stephany Sutton
- 6 years ago
- Views:
Transcription

1 APPENDIX 3 INTEGRATED GO RER- SMARTTRACK OPTIONS INITIAL BUSINESS CASE JUNE 2016 Table of Contents Page 1
2 TABLE OF CONTENTS 1.0 Executive Summary Introduction Methodology Options for Integrated GO RER-SmartTrack Deliverability and Operations Strategic Case Financial Case Economic Case Conclusion and Next Steps Appendix Page 2
3 Glossary of Terms Appraisal Benefits Case Analyses (BCA) Business Case Cost Benefit Analysis Economic Case Financial Case Delivery and Operations Case Strategic Case Acronyms BCR NPV PV Analysis of a program, investment or intervention that has not yet been implemented and focuses on estimated or forecasted evidence. Reports produced by Metrolinx between 2008 and 2012 focusing on select economic impacts and financial costs of major proposed Metrolinx transit projects. BCAs have subsequently been replaced by the new Business Case framework. A suite of evidence on the potential strategic, economic, financial, deliverability and operational impacts of a proposed program, intervention or investment to inform decision-making throughout the project lifecycle. Metrolinx Business Cases are an enhancement and replacement of Metrolinx s former Benefits Case Analyses reports. A form of evaluation that focuses on comparing certain economic impacts (generally benefits) to the cost of an investment. Cost Benefit Analysis is used in the Economic section of Metrolinx s Business Case framework and was also used to inform previous Benefits Case Analyses. One component of the Metrolinx Business Case that examines or reviews the impacts of proposed investments or interventions. Economic impacts include transportation user benefits (journey time impacts, road decongestion impacts, safety/accident reductions, etc.), environmental impacts (changes in emissions levels, vibration, etc.), social and community impacts (the distribution of benefits among populations, severance/isolation impacts, etc.), wider economic benefits (agglomeration/productivity impacts, etc.) and public funding impacts (property tax revenues, etc.). The Economic Case generally includes a cost-benefit ratio. One component of the Metrolinx Business Case that examines the lifecycle costs and revenues of proposed investments or interventions. One component of a Metrolinx Business Case that examines the impacts of proposed investments or interventions on operations, the delivery of the proposal, potential risks, procurement and related commercial or management issues. One component of a Metrolinx business case that examines the alignment of proposed programs, investments or interventions with strategic plans and goals. Involves the presentation of transportation planning information, including traffic forecasts, related travel patterns, drivers and interdependencies. Benefit cost ratio Net Present Value Present Value RTP Regional Transportation Plan, The Big Move, 2008 GO RER TTS VKT GO Regional Express Rail Transportation Tomorrow Survey Vehicle Kilometres Travelled Page 3

4 1.0 EXECUTIVE SUMMARY In 2015, the Province of Ontario committed funding of $13.5 billion for extensive rail improvements through the GO Regional Express Rail (RER) program. Metrolinx is currently implementing the program, a change which will bring fast, two-way, all-day GO service to provincially owned rail corridors. Five GO corridors will be upgraded to RER service levels 15 minutes (or better) service in both directions throughout the day. Trains will be electrified which shortens trip times by up to 20%. Implementing GO RER is expected to add 4,500 weekly train trips and increase GO ridership by 140% over the next fifteen years. GO ridership in 2014 was approximately 54 million annual trips. With the implementation of GO RER on five corridors, ridership is forecast to climb 140 percent to 127 million annual trips. This package of GO enhancements is a step-change for rail service in the Greater Toronto and Hamilton Area, transforming it from what is now largely a commuter service to a true regional rail system, comparable to similar systems in world-class cities across the globe. The full program of GO upgrades, including service, infrastructure, costs and benefits, is presented in the GO RER Initial Business Case. All seven GO corridors run through the City of Toronto, stopping at 19 stations, and meeting at Union Station. As is evident in the map below, the GO corridors largely run through Etobicoke and Scarborough, providing downtown access opportunities to neighbourhoods located at a distance from the subway. By bringing fifteen minute two-way service to five of the GO corridors (highlighted in darker green on the map), GO RER will bring more flexible travel options for residents and jobs within the City and to the broader region. Figure 1: GO Service in the City of Toronto The GO RER program, and particularly plans for GO RER within the City of Toronto, sets the context for SmartTrack. SmartTrack proposes utilizing the GO network to provide a more urban transit service than originally contemplated with GO RER. In February 2015, Toronto City Council directed the City Manager to carry out a SmartTrack workplan and requested that Metrolinx include a number of SmartTrack elements in GO RER. SmartTrack includes a number of components including new stations, TTC fares, TTC service integration, frequency improvements on the Kitchener and Stouffville corridors, as well as an LRT along Eglinton Avenue West to the Mississauga Airport Corporate Centre and Pearson Airport. Page 4


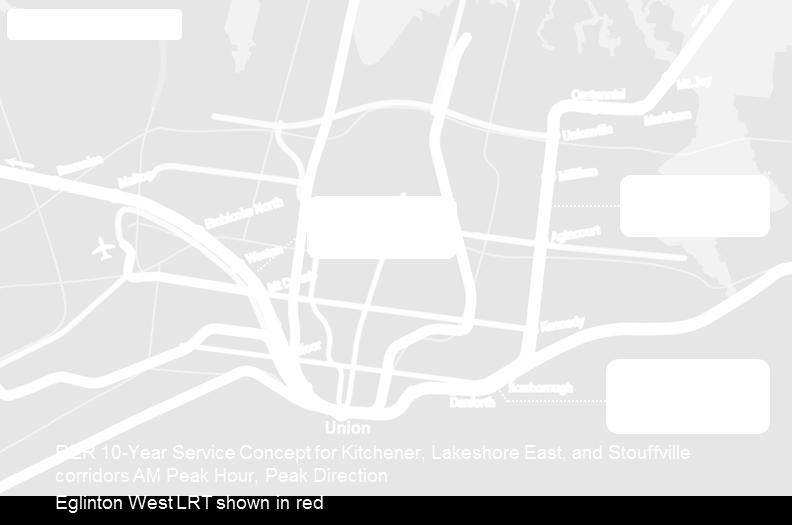
5 The SmartTrack proposal triggered more intensive consideration of the potential for GO expansion within Toronto to improve access for residents and greater connectivity of the transit networks. Metrolinx and the City of Toronto are working closely together to advance options that integrate GO RER and SmartTrack. These options leverage planned GO RER investments to deliver additional new riders and added benefits, particularly in Toronto. Separate RER and SmartTrack concepts were deemed too infrastructure intensive and costly as well as a duplication of service and are not being considered further. In March 2016, City Council endorsed focusing analysis on two integrated RER-SmartTrack options, proposing either four to five new stations or seven to eight new stations. This document presents a plan for integrating GO RER and SmartTrack and provides the business case evidence in support of that plan. Figure 2: Illustration of the Integrated GO RER-SmartTrack Geography The GO RER-SmartTrack Initial Business Case analyzes four options for integrating the SmartTrack proposal with the committed GO RER program on the Kitchener and Stouffville corridors. Option A: Increased frequencies, 5 new stations Option B: Express and local service, 8 new stations Option C: Committed RER frequencies, 7-8 new stations Option D: Committed RER frequencies, 4-5 new stations Each of these options assumes an optimized LRT on Eglinton Avenue West. A separate business case process has been undertaken to assess the Eglinton West LRT. Page 5
6 This GO RER-SmartTrack Initial Business Case builds on and expands the analysis completed for the GO RER Initial Business Case in order to determine the impact of SmartTrack on the RER benefits and costs. The RER Initial Business Case analysis is premised on the current fare structure, including existing GO fare structure for GO RER service, TTC fares, and existing transfer policy. The GTHA Fare Integration Strategy will serve as a vehicle for rationalizing GO and TTC Fares and transfer policy as well as address other fare issues across the region. In the absence of a complete and comprehensive regional fare integration strategy, the analysis in this report assumed the existing fare structure as an input. The City of Toronto has conducted analysis assuming TTC fares which is presented in Appendix C of this document. GO RER is expected to utilize the available and planned track and corridor capacity. In this light, integrated GO RER-SmartTrack options were screened to determine the extent of additional infrastructure that they would require over and above that which is required for GO RER. Through this analysis, it was determined that Options A and B would each require extensive additional track infrastructure, resulting in the need for corridor widening, property acquisition, consequent community impacts, and other deliverability challenges. In light of these findings, Options A and B were screened out and detailed analysis focused on Options C and D. Strategic Case analysis suggests that GO RER will go a long way towards growing the attractiveness of GO rail as a travel option for Torontonians. Over and above RER, both Options C and D achieve the central objectives of integrating GO RER and SmartTrack in terms of improving access to GO within the City of Toronto. Both options increase ridership about nine to ten percent above GO RER. Because Option C includes more new stations than Option D, it goes further in increasing transit accessibility within Toronto but also lengthens travel times for medium and long distance passengers and imposes greater negative travel time impacts in comparison to Option D. In terms of the Financial Case, Options C and D are relatively similar in terms of financial performance and affordability. Option C is slightly more expensive to both build and operate, compared to Option D, but the difference is marginal in the context of the larger GO RER infrastructure costs. It should be noted that capital cost estimates are preliminary and may not reflect the full costs of associated structure works required to deliver the stations or comprehensive fleet costs, depending on ongoing operational analysis. Economic Analysis measures the costs and benefits of a project including benefits such as travel time savings and congestion relief. This lens of analysis monetizes those benefits and then compares them to costs to provide one indication of the extent to which a project is a worthwhile investment. For the GO RER Kitchener and Stouffville corridors benefits such as the dollar value of travel time savings exceed the capital and operating costs by a ratio of approximately 2:1. Economic analysis of the integrated options in the context of the overall analysis suggests that Option C would have a negative impact on the overall GO RER benefit-cost ratio, bringing about a decrease of approximately thirty percent while Option D would have a smaller negative impact, decreasing the GO RER benefit-cost ratio by approximately 18 percent. This suggests that Option D performs better than Option C from an economic perspective. Page 6
7 In summary, based on the full business case analysis, Option D is the best performing option for SmartTrack and GO RER integration. There are a number of next steps required to more fully understand the options. The final number of new stations and their locations are being determined through the outcomes of the new stations analysis. The GTHA Fare Integration Strategy is progressing and learnings from that analysis will need to be incorporated into this work, in particular to understand the impacts of fare integration on ridership. Finally, the construction program to deliver GO RER electrification and service levels is extremely aggressive and it will be important to understand how these options might impact RER delivery. Page 7
8 Table 1: Deliverability Screening Summary Table Option A: Option B: Option C: Option D: Indicator Increased Frequencies, 5 new stations Express and local service, 8 new stations Committed RER Committed RER Frequencies, 4 - Frequencies, 7 5 new stations -8 new stations Total Nominal Capital Costs ($M 2014, costs do not include escalation, financing costs, lifecycle and operating and maintenance) $6,900-7,500 $9,000-10,600 $1,100-1,700 $700 1,000 Deliverability Issues Screened Out - Extent of infrastructure Screened Out - Extent of infrastructure Deliverable with a Deliverable with a minimum of requirements, need for requirements, need for minimum of new corridor expansion, corridor expansion, new infrastructure property acquisition, and property acquisition, and infrastructure community impacts is community impacts is unacceptable unacceptable Table 2: Business Case Summary Table Base Case GO RER, Kitchener and Stouffville Indicator Option C: Committed RER Frequencies, 7-8 new stations Option D: Committed RER Frequencies, 4-5 new stations Fit with Strategic Objectives - Builds on the GO RER program to improve access to GO within Toronto Builds on the GO RER program to improve access to GO within Toronto Ridership (annual) 28 million +2.4M +2.8M Total Nominal Capital Costs ($M 2014, costs do not include escalation, financing costs, lifecycle and operating and maintenance)* $3,600 (does not include RER system costs) +$1,100-1,700 +$700 1,000 Page 8
9 Nominal Annual Operating Costs ($M 2031) Nominal Annual Revenue ($M 2031) Cost Recovery Ratio (2031) $140 +$8.7 +$5.3 $210 +$11.8 +$ % 149% 155% Net Benefits ($M PV) 4,100 ($1,100) ($400) Impact to GO RER Kitchener-Stouffville Benefit Cost Ratio - 31% decrease from 2.0 to % decrease from 2.0 to 1.64 Page 9


10 2.0 INTRODUCTION Metrolinx and the City of Toronto have worked closely together to develop options for integrating GO RER and SmartTrack, conduct analysis of those options through the initial business case, and put forward a direction to proceed. GO RER is a committed $13.5 billion program to expand GO service across the GTHA, including on the Kitchener and Stouffville corridors. SmartTrack proposes upgrading service on the Stouffville and Kitchener Corridors with new stations, TTC fares, TTC service integration, and increased frequency and a rapid transit option on the Eglinton West corridor. The SmartTrack proposal spurred further consideration of options to upgrade and intensify rail service within Toronto and the GO RER-SmartTrack Integration Initial Business Case will develop, present, and analyze these different options for integration. Options have been developed with regard to a number of policy objectives: Serving People choice, experience, social equity Strengthening Places shaping the City, healthy neighbourhoods, public health and environment Supporting Prosperity affordability and supporting growth Figure 3: SmartTrack Geography in the Context of the Transit Network This work will touch on a number of different aspects of GO RER-SmartTrack integration including rail service and infrastructure and new stations. Evaluation of the options will provide indications of their performance from deliverability, strategic, economic, and financial perspectives. The outcome of this work will be a preferred option supported by the evaluation. Page 10
11 Study Objectives Identify promising options for integrated GO RER-SmartTrack options Conduct an alternatives analysis and develop a business case on the integrated options Ensure ongoing delivery of the funded GO RER program Identify a preferred direction for GO RER-SmartTrack integration that provides benefits and is practically feasible Make the case for investment in the preferred option indicated by the study This document will present an overview of the methodology used to develop and analyze options. It will then present a problem statement and go through each integrated GO RER-SmartTrack option. From there, the report will outline business case analysis for the options beginning with a deliverability screen and proceeding to strategic case analysis, economic case analysis, and financial case analysis. Page 11


12 3.0 METHODOLOGY The approach to developing the plan for integrating GO RER and SmartTrack mirrors the approach to developing the full RER program. The work began with the establishing of the study objectives set out in Section 2.0. Based upon these objectives, as well as on a vision and problem statement, the four options were developed. These options were then tested through an analysis of the infrastructure required to build and operate each option. This analysis included developing a sample schedule and, using the station locations, track layouts, and train speeds, mapping out the different train trips and assessing whether the existing tracks were sufficient to accommodate the service or whether and where additional tracks might be required. Based on the results of this analysis, Options A and B were screened because of the extent of new infrastructure, beyond that which is already required for RER. The analysis largely confirmed that GO RER will utilize the majority of capacity on the rail corridors. A full business case was then developed to provide more evidence on how Options C and D perform in relation to the full GO RER program. That business case is presented in this document. Figure 4: Integrated GO RER-SmartTrack Methodology Page 12
13 4.0 OPTIONS FOR INTEGRATED GO RER- SMARTTRACK Options Development The work to identify an option for integrating GO RER and SmartTrack has considered a number of elements: Service frequency on the Stouffville and Kitchener corridors New stations Kitchener and Stouffville through service In developing the options, Metrolinx and the City of Toronto looked at the funded GO RER program as a starting point and worked to incorporate elements of the SmartTrack proposal. The GO RER service concept and infrastructure program was developed through an extensive iterative process of service assessment and capital and operating cost estimates to arrive at an optimal scenario. The SmartTrack proposal identifies an opportunity to further upgrade service on the Kitchener and Stouffville corridors within Toronto, going beyond the committed GO RER program. By highlighting ways that GO RER could better serve the mobility needs of the City of Toronto, the SmartTrack plan initiated a more thorough analysis of the potential to upgrade service and add new stations. This analysis began with the development of different options to integrate GO RER and SmartTrack. These options attempt to balance improving service for Toronto residents with maintaining a high quality of service for longer-distance commuters. Adding new stations can boost ridership by enticing new passengers who either board or alight at a new station location, but it can also deter some existing riders because of the longer travel times associated with additional station stops. Achieving the optimal balance is a critical component of developing the integrated options. Fare and service integration are important components of the SmartTrack proposal but are being explored through separate workstreams. As the GTHA Fare Integration Strategy progresses, outcomes will be incorporated into the analysis of RER-SmartTrack integration options. This analysis is premised on the existing fare structure. Page 13
14 Options Summary This section describes five options for GO RER-SmartTrack integration. Table 3: Integrated GO RER-SmartTrack Options Option Service on the Stouffville and Kitchener corridors New stations Committed GO RER Peak o 6-10 minute service from Unionville Union Station Bramalea* Off-peak o 15 minute service from Unionville Union Station Bramalea Stouffville and Kitchener service terminate at Union Station A. Increased Frequencies doubled from committed GO RER frequencies, 5 new service concept (5 minute peak service, 7.5 stations minute offpeak service) Kitchener and Stouffville service connected B. Express and local service, 8 new stations C. Committed RER frequencies, 7-8 new stations D. Committed RER frequencies, 4-5 new stations 20 minute service for each of express service and local service (10 min combined service); Unionville Union Station Bramalea Kitchener and Stouffville service connected Planned GO RER frequency in the peak Travel time increases for medium and long distance trips, due to new stations Kitchener and Stouffville service connected Planned GO RER frequency in the peak Slight travel time increases for medium and long distance trips Kitchener and Stouffville service connected Existing GO stations 5 new stations on Kitchener, Lakeshore East and Stouffville 8 new stations on Kitchener, Lakeshore East and Stouffville 7-8 new stations 4-5 new stations * Peak headways are derived by summing all of the service planned for each corridor. For example, on the Stouffville corridor, in the peak period and direction, the service concept calls for 4 trips from Unionville to Union Station and 3 trips from Lincolnville to Union Station, resulting in a total of 7 trips in the peak hour, or roughly 8.5 minute service frequency. Committed GO RER Service Concept The GO RER program commits to electrification of the Stouffville corridor from Union Station to the end of the line, at Lincolnville and to electrification of the Kitchener corridor from Union Station to Bramalea. Electrified service is planned to run every 15 minutes, all day, from Unionville Station on the Stouffville corridor to Union Station and from Bramalea Station on the Kitchener corridor to Union Station. Layered on top of this core service are longer distance services to Lincolnville and Kitchener. Service to and from Lincolnville is planned at every 20 minutes in the peak period and peak direction and every 60 minutes, bidirectional, in the offpeak. From Kitchener, 30 minute peak Page 14


15 direction service is planned in the peak period as well as an additional 30 minute peak-direction service from Mt. Pleasant Station. In the offpeak, Mt. Pleasant will be served by 60 minute bidirectional service, continuing the midday service introduced in As well, UP Express will continue to provide bidirectional 15 minute service to between Weston, Bloor, and Union Stations which augments GO service. A. Increased frequencies, 5 new stations Option A focuses on achieving service frequencies significantly over and above what has been planned for GO improvements in both the peak and off-peak. This option would include a limited number of new stations, focusing on those which provide the most benefits. Service summary 5 minute frequency in peak and 7.5 minute frequency in the off-peak (doubling GO RER service levels); Unionville - Union Station - Bramalea 5 new stations o Stations include Gerrard, Unilever, Bathurst-Spadina, Liberty Village, St. Clair West Kitchener and Stouffville through service Figure 5: Option A B. Express and local service, 8 new stations Option B would change parts of the Kitchener, Lakeshore East, and Stouffville corridors into an express and local service pattern. Eight new stations would be added across those three corridors; express trips would bypass new stations, stopping at existing stations and local trips would stop at all stations including new and existing. This type of service split allows longer distance passengers Page 15
; Unionville Union Station Bramalea Express service would stop only at existing GO stations;")
16 to continue to benefit from fast journey times, while also adding a finer-grained service to increase access along the route by adding stations in the City of Toronto. Service summary 20 minute frequency for each of express service and local service (10 min combined service); Unionville Union Station Bramalea Express service would stop only at existing GO stations; local service would stop at existing stations as well as new stations 8 new stations o Stations include Gerrard, Don Yard, Bathurst-Spadina, Liberty Village, St. Clair West, Lawrence, Ellesmere, and Finch Kitchener and Stouffville through service Figure 6: Option B C. Committed RER frequencies, 7-8 new stations Option C would preserve the GO RER service concept as defined in the Initial Business Case and would integrate SmartTrack by adding seven to eight new stations, providing increased access to GO within Toronto. In the peak period, GO RER will already provide between five and ten minutes service frequencies between Unionville and Union Station and ten minute frequencies between Mt. Dennis and Union Station. Because of the added new stations, travel times would be increased by up to 35% for some passengers, with people boarding in Markham and Scarborough experiencing the largest percent changes to their journey times. Service summary Greater access to rapid transit within the City of Toronto Longer travel times on the Stouffville and Kitchener corridor, due to new stations 7-8 new stations: Stations tested include Gerrard, Don Yard, Liberty Village, St. Clair West, Lawrence, Ellesmere, and Finch Page 16


17 Kitchener and Stouffville through service through Union Station Figure 7: Option C D. Committed RER frequencies, 4-5 new stations Option D would preserve the GO RER service concept as defined in the Initial Business Case and would integrate SmartTrack by adding four to five new stations, targeting the stations that appear most promising in terms of ridership and benefits. In the peak period, GO RER will already provide between five and ten minutes service frequencies between Unionville and Union Station and ten minute frequencies between Mt. Dennis and Union Station. This option would also include 4-5 new stations which would slightly increase travel times. Service Summary Greater access to rapid transit within the City of Toronto Slightly longer travel times on the Stouffville and Kitchener corridor, due to new stations GO RER will already provide better than 15 minute service in the peak period and 15 minute service throughout the day 4 new stations, based on outcomes of the Metrolinx New Stations Analysis. Stations tested include Gerrard, Don Yard, Liberty Village, and St. Clair West Kitchener and Stouffville through service Page 17

18 Figure 8: Option D Page 18
19 5.0 DELIVERABILITY AND OPERATIONS The deliverability and operations case speaks to the question of whether the options are achievable and documents the engineering and operational issues and challenges. This analysis assumes a baseline of the tracks, grade separations, and Union Station capacity that is required to operate GO RER service, already a significant expansion over today s infrastructure. Early analysis, including sensitivity testing around train frequencies, suggests that planned GO RER service fully utilizes rail and corridor capacity and that some of the options would require significant infrastructure investments, including a number of new tracks and other infrastructure needs beyond the existing corridor right-of-way and with substantial property requirements and community impacts. As such, two options were screened out through the deliverability and operations case, and two options have been carried forward for full assessment through the other chapters of the business case. SmartTrack provided an important impetus to further test the planned GO RER service concept and infrastructure to determine if any additional service increases would be possible given existing infrastructure. Ultimately, the analysis provides valuable additional understanding of the extent to which rail capacity is utilized by GO RER service levels. 4.1 Deliverability and Operations Analysis Methodology The deliverability and operations analysis was conducted by translating the different proposed service levels in each option into infrastructure needs and then assessing the significance of those infrastructure needs. There are several steps to this translation process. 1. First, a sample time-table is created based on the proposed service level. For the integrated RER-SmartTrack options, it is important to note that these service levels were layered on top of planned RER service. On the Kitchener corridor, for example, this includes diesel express service from Kitchener and diesel all-stop service from Mt. Pleasant, as well as UP Express service. 2. Once a sample time table has been created, it is mapped out onto the track layout, using information about train speeds, station locations, and stopping time at stations. This creates a visual representation of points where, for example, two trains traveling in opposite directions might meet, or where a faster electric train might overtake a slower diesel train. At points where trains meet or cross, a separate track is required for each train to prevent service delay or collision. On corridors with relatively simple bidirectional service, this analysis typically yields requirements for two tracks but on corridors like Kitchener with multiple train technologies and speeds, local and express service, and bidirectional service, more than two tracks are likely required. 3. Track requirements for each option can then be compared with the number of tracks planned for GO RER and with the total right-of-way in each rail corridor. This determines Page 19
20 whether (a) a sufficient number of tracks is already planned as part of GO RER, or (b) there is available width in the corridor right-of-way to add additional tracks, beyond what is planned for GO RER. This process would also be applied to bridges and below-grade sections of track, to determine how intensive and disruptive constructing new infrastructure might be. Further detail on this process is contained in Appendix A. Table 4: Deliverability Screening Summary Option Status A. Increased frequencies, 5 new stations Not Carried Forward B. Express and local service, 8 new stations Not Carried Forward C. Committed RER frequencies, 7-8 new stations Carried Forward D. Committed RER frequencies, 4-5 new stations Carried Forward 4.1 Description of Screening Triggers Screening triggers or fatal flaws are impacts considered to be significant enough to screen the option from further study and without identifiable solutions. This section describes screening triggers which were uncovered in early analysis of the options because of impacts to the Kitchener and Stouffville Corridors. As part of the GO RER program, a fourth track will be constructed on the Kitchener corridor between Bramalea and Union Station which uses the available right-of-way within the corridor. The need to construct additional 5 th or 5 th and 6 th tracks on the southern section of the corridor could likely not be accommodated within the right-of-way and would entail property acquisition affecting approximately 200 to 300 individual properties including commercial, industrial, and residential. It would also likely require rebuilding major infrastructure recently completed in the context of the Georgetown South project including the West Toronto Diamond and the Strachan Grade Separation. Those implications present substantial costs and community impacts and are considered fatal flaws. Options which trigger the need for any additional track on the Kitchener corridor have been screened out. Like the Kitchener corridor, the double-tracking planned within the RER program will use the available right-of-way within the existing Stouffville corridor. The need for 3 rd and 4th tracks on the Stouffville corridor would also likely trigger major property acquisition affecting approximately 600 to 700 individual properties including commercial, industrial, and residential to the extent that options which trigger the need for additional tracks were also screened out due to this fatal flaw. Page 20
21 4.2 Union Station Currently, Union Station accommodates approximately 30 trains in the peak hour. In the context of the GO RER program, Union Station will be expanded to accommodate 45 to 50 trains in the peak hour which is sufficient to support the RER service concept, a massive step change in service. However, service levels beyond the committed GO RER program will require further investment in Union Station expansion, which would be costly. 4.3 Detailed Option Specific Screening The following table summarizes additional track requirements for each of the options. Further information on the operational analysis supporting these findings is provided in Appendix A. Table 5: Track Requirements Summary Number of Tracks Required Stouffville Corridor Lakeshore East Kitchener Corridor Corridor (USRC to Scarborough Junction) Current Number of Tracks (2016) GO RER Option A: Increased (USRC to Airport frequencies, 5 new stations Spur) Option B: Express and local service, 8 new stations Option C: Committed RER frequencies, 7-8 new stations Option D: Committed RER frequencies, 4-5 new stations (USRC to Airport Spur) Additional tracks on the Stouffville corridor: In order to provide local and express service (Option B), two additional tracks are required on the Stouffville corridor, beyond what will be constructed for GO RER. As described in section 4.1, this was determined by mapping out the service and identifying locations where trains would meet or pass each other. Based on an analysis of the service associated with Option B, layered on top of planned GO RER service, there are a number of locations where four trains would be meeting or passing, meaning that four tracks would be required along the corridor from Scarborough Junction to Unionville. Because there is insufficient right-of-way in the existing corridor to construct two additional tracks, this new infrastructure would trigger property acquisition. The extent of this infrastructure, the cost, and the community impact is unacceptable and contributes to the screening of Option B. Page 21
22 4.5 Additional infrastructure on the Lakeshore East corridor (USRC to Scarborough Junction): Based on the analysis of service and a mapping out of the service associated with the RER- SmartTrack integration options over and above planned RER service, both Options A and B would trigger the need for an additional track in the Lakeshore East corridor between the USRC and Scarborough Junction. For Option A the need for the additional track is triggered by the effective doubling of service between Unionville, Union Station and Bramalea that would be operating in this segment. The service pattern results in a much denser train pattern when local and express Lakeshore East trains are taken into account. There are a number of locations along this segment of the corridor where a number of trains meet or cross paths. In the absence of an additional track, trains moving at different speeds might be delayed behind one another to avoid collision while trains travelling in opposite directions might be blocked. For Option B the need for an additional track is triggered by the different stopping patterns of the local and express Kitchener-Stouffville trains and also the express and local Lakeshore East service. Each unique stopping pattern has a different speed profile and without the additional tracks, the local and express service pattern along with the Lakeshore East service pattern would result in trains meeting or being unable to pass. Similar to Option A, in the absence of additional infrastructure, trains moving at different speeds might be delayed behind one another to avoid collision while trains travelling in opposite directions might be blocked. 4.6 Additional tracks on the Kitchener corridor Based on an analysis of the higher frequencies set out in Option A, over and above what is planned for GO RER, this option triggers the need for a 5 th track between the USRC and the Airport Spur. Because the heightened frequencies reduce the amount of time between trains, there is less flexibility to accommodate the many different types of service planned for the Kitchener corridor. In order to ensure that faster train trips are not held up behind slower train trips, the additional track is required. Because of the local and express service set out in Option B, layered on top of the different services identified in the planned RER service concept, this option triggers the need for 5 th and 6 th tracks between the USRC and the Airport Spur. The complexity of what would be five different speed profiles (diesel express service from Kitchener, diesel local service from Mt. Pleasant, UP Express service, and electrified all-stop service from Bramalea) combined with the service traveling in the opposite direction, a 5 th and 6 th track would be required in the corridor. Without these additional tracks, there would be numerous points where trains travelling at different speeds or in different directions would meet. As discussed above, because insufficient space exists within the corridor for these tracks the expansion would require substantial property acquisition, including both a 5 th track and 5 th and 6 th tracks. It would also require major modifications to the recently completed Strachan Grade Separation and the West Toronto Diamond. These impacts are severe and contribute to the screening of Options A, and B from further consideration. Page 22
23 4.7 Sensitivity Testing of Option A Option A proposes a doubling of GO RER electrified service from every 15 minutes to every 7.5 minutes. As outlined in section 4.1, this was tested by developing a sample time-table and mapping it onto the track layout to identify points where trains would meet and thus require additional tracks. For 7.5 minute frequencies, this analysis indicated that an additional track would be required for both the Kitchener and Lakeshore East. After it was determined that 7.5 minute frequencies triggered additional tracks, 10 and then 12 minute frequencies were tested. For each of these tests, it was determined that a 5 th track would be required on the Kitchener corridor to accommodate even 12 minute frequencies, or just one additional train per hour. As discussed above, because the Kitchener corridor accommodates a large number of diverse rail services, each with a unique stopping pattern and speed profile, the capacity of the corridor is fully utilized with the committed GO RER service concept to the extent that even one more train per hour cannot be accommodated. Page 23


24 Figure 9: Infrastructure Requirements for Option A Additional Track on Kitchener Corridor Additional Track on Lakeshore East Corridor Figure 10: Infrastructure Requirements for Option B 2 Additional Tracks on Kitchener Corridor 2 Additional Tracks on Stouffville Corridor Additional Track on Lakeshore East Corridor Page 24
25 4.7 Options Being Carried Forward to Further Evaluation High-level analysis of sample time tables indicates that both Options C and D are workable without additional track requirements. For both of the workable options, the Kitchener corridor requires careful planning. Because GO RER service on the Kitchener corridor will be comprised of a mix of fleet (diesel locomotive, diesel EMU, and electric) types, service (local and express) types, and train speeds, service patterns are complex and delicately balanced. Any changes to that balance, including adding new stations which slows service down, may trigger other counter-balance alterations. Options C and D each include the addition of St. Clair and Liberty Village stations on the Kitchener corridor. In order to accommodate these stops on the local, electrified service, service from Kitchener, planned to run express from Bramalea to Union Station would need to add at least two station stops. With these adjustments, though, Options C and D are feasible. Page 25
26 6.0 STRATEGIC CASE The Strategic Case discusses the extent to which the options under consideration support a larger vision for transportation in the Greater Toronto and Hamilton Area (GTHA), and, given the context of GO RER-SmartTrack integration, of the City of Toronto specifically. This section also includes the problem statement and discussion of how and to what extent the options address the problem statement. It also includes analysis of ridership patterns and markets, travel behaviour, and social equity. The aim of the Strategic Case is to answer the questions: Do the options align with broader policy objectives? How do the options fit into the larger context of GO Regional Express Rail? To what extent do the options address the problem statement and achieve the vision? How do the project options address the problem statement and impact broader travel behaviour? Because Options A and B were screened out from further consideration through the Deliverability and Operations Case, strategic analysis will focus on Options C and D. 6.1 Policy Objectives Metrolinx and City of Toronto policy objectives are compatible and mutually supportive. The Big Move, the regional transportation plan, is explicit in its vision of increasing transit ridership and reducing the distance that people drive each day. Also emphasized in The Big Move, as the first goal, is increasing transportation choices so that people have a wider range of options for getting around. In analyzing the integrated GO RER-SmartTrack options, an important objective for Metrolinx was achieving balance in expanding travel options for Toronto residents while preserving a competitive travel experience for medium and longer distance passengers. The City of Toronto s key transit objectives include: Increase accessibility and choice for residents throughout the City, particularly for lower income residents. Provide additional transit capacity and relieve constrained portions of the network, particularly the Yonge Subway and Bloor-Yonge Station. Increase transit efficiency by balancing load across the network and resiliency (in terms of providing an integrated network of alternative routes). The integrated RER-SmartTrack options would increase overall transit ridership and also reduce the distances travelled by car. These options would also increase transportation choices and accessibility, for both Toronto residents who live or work near a new station as well as for suburban GO passengers who would have new options for stations serving additional destinations. Page 26
27 The City of Toronto s Feeling Congested? framework for project evaluation is also an important lens for Strategic Case analysis. The strategic value of transit investments in Toronto can be viewed and understood through a framework developed through Feeling Congested?, the recent review of Transportation Policies in Toronto's Official Plan. The framework focuses on three principles: Serving People Strengthening Places Supporting Prosperity These three principles are further articulated as eight criteria: Serving People Choice - Develop an integrated network that connects different modes to provide for more travel options Experience - Capacity to ease crowding / congestion; reduce travel times; make travel more reliable, safe and enjoyable Social Equity - Allow everyone good access to work, school and other activities Strengthening Places Shaping the City - Develop an integrated network that connects different modes to provide for more travel options Healthy Neighbourhoods - Changes in the transportation network should strengthen and enhance existing neighbourhoods; promote safe walking and cycling within and between neighbourhoods Public Health & Environment - Support and enhance natural areas; encourage people to reduce how far they drive; mitigate negative impacts Supporting Prosperity Affordability - Improvements to the transportation system should be affordable to build, maintain and operate Supports Growth - Investment in public transportation should support economic development: allow workers to get to jobs more easily; allow goods to get to markets more efficiently 6.2 Vision for Transportation Options The $13.5 billion committed RER program will bring about a transformational shift in travel options throughout the GTHA. Currently, the GO rail network functions largely as a commuter system, bringing people into downtown Toronto in the morning and returning them to their homes in the evening. GO RER is not an incremental change to the current commuter network but a sea-change that will bring electrified, two-way, all-day, 15 minute service to many parts of the region. This upgrade in service will change the way that people consider their travel options rapid transit will now be readily available for mid-day trips, weekend trips, and also non-downtown work trips. Another anticipated positive impact of substantial upgrades to GO service, particularly on the Stouffville corridor, is relief to crowded the Yonge Subway. This effect was borne out in Metrolinx s analysis through the Yonge Relief Network Study. Page 27
28 The existing GO rail network enables suburban commuters to easily work in downtown Toronto and GO RER will also support the growing number of downtown dwellers commute to suburban employment locations. While the existing GO rail network provides service to Toronto residents who live near a GO station and work downtown, with all-day RER service there is potential to improve integration with TTC so that GO rail service can become relevant to a wider swath of Torontonians, as SmartTrack proposes. GO RER s 15 minute service also goes a long way toward making GO service more competitive with frequent TTC service. Whereas existing GO frequencies of up to 30 minutes in the peak period mean that travelers are bound by schedules, 15 minute service approaches the point where travelers turn up at the station without consulting a schedule, making travel considerably more flexible. The GTHA Fare Integration Strategy aims to further contribute to making GO a more relevant transportation choice for Toronto residents by looking at fares and transfer policy and when that work is complete, outcomes will be incorporated into analysis of these options. Overall, the upgrade of the GO network will go a long way toward making GO a more accessible and relevant transportation option for many Torontonians, especially if coupled with fare and service integration, both of which are components of the SmartTrack proposal. All seven GO corridors run through the City of Toronto, stopping at 19 stations, including 8 on the Kitchener and Stouffville corridors, and meeting at Union Station. The GO corridors largely run through Etobicoke and Scarborough, providing downtown access opportunities to the neighbourhoods located at a distance from the subway. This includes the Stouffville and Kitchener corridors which are the focus of SmartTrack. SmartTrack proposes upgrading service on the Stouffville and Kitchener Corridors as a layer over and above the GO RER program, further integrating these rail corridors into the urban rapid transit network and providing enhanced transit accessibility to Toronto residents. To achieve this integration, SmartTrack includes new stations, TTC fares, and increased frequency, as well as an LRT along Eglinton Avenue West and provides an opportunity to improve access to the GO network for Toronto. It is within this context that the RER-SmartTrack integration options were developed. Through the Strategic Case, they will be evaluated based on how they further improve transit accessibility for Torontonians, beyond what RER will already bring about, while still preserving a high quality of service for suburban travelers. This will be assessed through the problem statement, through an analysis of ridership and travel patterns, and through a look at social equity. Analysis in this business was developed assuming the current fare structure, including existing GO fare structure for GO RER, TTC fares, and existing transfer policy. Problem Statement As the City of Toronto has grown, the transit network s capacity during the peak periods has proved insufficient to support the demand. In particular, the need to relieve overcrowding on the Yonge Subway line has grown acute. In addition, the distribution of population and employment within Toronto has shifted with concentrations of lower income city residents increasing in outer areas of the city. These residents have relatively poor transit access to major job concentrations due to long journey times and congestion. Page 28
29 Seven GO corridors currently travel through Toronto, but given train schedules and peak-only service on most lines, opportunity exists to improve GO accessibility for Toronto residents. GO RER will go a long way toward addressing these issues by expanding GO service, transforming it to be faster and more frequent through the day. SmartTrack proposes to go above and beyond GO RER, further increasing the options for moving through the network. SmartTrack is an opportunity to integrate transit services within Toronto, enabling GO corridors to provide new transit capacity for trips to, from, and within the City of Toronto. To this end, SmartTrack proposes to increase use of the Stouffville and Kitchener lines with new stations and improved service frequency, and an integrated fare. This study analyzes different options to integrate SmartTrack with GO RER to continue to serve medium and long distance commuters, as well as meet more of the transportation needs for people wanting to travel to, from, and within the City of Toronto. Problem Statement and Vision Performance Discussion Options C and D each seek to address the problem statement in different ways. Option C adds seven to eight new stations within the City of Toronto, making GO service more accessible to Toronto residents and connecting a larger number of origin and destination points. This option would preserve the GO RER service concept with some minor modifications to Kitchener express service. Of the new stations, 2-3 would be between Bramalea and Union Station and 5-6 would be between Unionville and Union Station. These additional stations would increase net ridership and transit accessibility and choice within Toronto but have an impact on travel times, especially for medium and longer distance passengers. For example, passengers travelling between Milliken Station at Steeles Avenue and Union Station would see their trips lengthened by more than 35%. Overall, in Option C, more passengers lose time on their trips than the passengers who save time via the new stations. Option D adds 4-5 new stations within the City of Toronto. Like Option C, this option would preserve the GO RER service concept with some minor modifications to Kitchener express service. Option D attracts new riders but also imposes some travel time increases for example, approximately 15% for Milliken passengers travelling to Union Station but the increases are slight. Because Option D focuses on adding the stations with the most potential for new ridership, it adds marginal travel time to medium and long distance passengers but also saves time for other passengers. However, because fewer new stations are added, Option D does not go as far as Option C in terms of adding new access points to the GO network, resulting in smaller increases to transit accessibility and travel choice for Toronto residents. Options C and D have different advantages and disadvantages. Option C goes further to increasing travel choice for Toronto residents but at the expense of travel times for medium and longer distance passengers. Option D does not go as far in expanding transit accessibility within Toronto but also better serves medium and longer distance travelers, including those boarding at Toronto stations like Milliken and Agincourt. Page 29

30 Figure 11: Sample Travel Time Comparison of RER with Option C and Option D Experience Evaluating how a transit project improves a traveller's experience is directly related to how many people choose to take transit, given that they will choose to take transit if it offers a better experience than a different mode of travel. Experience can further be understood in terms of change in travel time between origins and destinations, how many destinations a rider can access using the transit network and the ability to mitigate crowding on transit. Ridership growth is an important indication of Experience. GO ridership in 2014 was approximately 54 million annual trips. With the implementation of GO RER on five corridors, ridership is forecast to climb 140 percent to 127 million annual trips. On the Kitchener and Stouffville corridors, current ridership is 9 million annual trips and it is forecast to grow threefold to 27 million annual trips with GO RER. Ridership analysis of the integrated RER-SmartTrack options suggests that they would increase ridership by approximately ten percent over and above what is forecast for GO RER. Options C and D are forecast to attract similar levels new ridership to the system 2.4 to 2.8 million annual new riders beyond GO RER. Both options would provide relief to Bloor-Yonge station and on Line 1. It should be noted that this analysis assumes the existing fare structure; ridership on the integrated RER-SmartTrack options may increase with fare integration. The City of Toronto has conducted ridership modelling of Options C and D using their new transportation model and assuming a TTC fare on the Kitchener and Stouffville corridors between Mt. Dennis station and Milliken station. Even with a TTC fare, City of Toronto modelling provides similar indications as Metrolinx modelling in terms of relative station performance and the relative performance of Options C and D. Results from these forecasts are included in Appendix C. Page 30
31 Table 6: Ridership and Travel Time Summary Options Base Case: Committed GO RER Option C: Committed RER frequencies, 7-8 new stations Option D: Committed RER frequencies, 4-5 new stations Ridership 127 million total 27 million, Kitchener + Stouffville Ridership (Boardings and alightings at new stations incl. new and existing riders, Annual) Ridership (Net new to system, Annual, Incremental to RER) Percent Change (Incremental to RER) Travel Time Savings with RER (million minutes) (Kitchener + Stouffville) Transit Rider Travel Time Savings with Integrated Options (million minutes) 7.1 million +2.4 million +9% million +2.8 million +10% Travel Behaviour Discussion Equally important as knowing the forecast ridership of each option is understanding how the options influence travel behaviour and what factors drive the differences between options. New stations have a number of influences and impacts. They serve additional locations and attract new riders but also impose new capital and operating cost, increase travel times, and potentially contribute to a loss in upstream passengers. Each new station increases travel time by two to three minutes, although electrification works in the opposite direction, reducing travel times by approximately fifteen to twenty percent. For both Options C and D the new stations yield a net increase in GO ridership. o Both options cause a net reduction in vehicle kilometres (i.e., less driving overall) in the GTHA because they take car trips off the road by inducing drivers to switch to transit. o Both options would yield an increase in GO revenue, on the order of $10 to 15 million per year in Page 31
32 o o For both options, the new stations cause a net increase in travel time (negative travel time savings) and would reduce the total travel time savings brought about by RER on the Kitchener and Stouffville corridors. For Option C, this effect erodes approximately thirty percent of the time savings; for Option D, it erodes approximately 10 percent of the time savings. The package of new stations in Option D yield more favourable results than those in Option C for ridership, time savings, and vehicle kilometres travelled metrics. Findings suggest that the new stations attract ridership primarily as destinations not as boarding. o o Proposed new stations near downtown with significant job clusters nearby are more promising than proposed stations in more residential areas. For example, a Liberty Village station is promising largely due to alightings at the station. Liberty Village is an emerging employment hub and a GO station in the area is extremely attractive to people who work there. Option D is more successful than C because its constellation of new stations is more heavily weighted towards those located near downtown with clusters of jobs surrounding, while Option C includes both stations in residential areas and those around downtown. For both Options C and D, the majority of passengers are switching to GO from local transit or GO bus Page 32
33 Figure 12: Chart Showing Previous Travel Modes of New Passengers 5% 30% Local Transit or GO Bus Driving 65% Carpooling (Passenger in a Car) Options C and D attract similar numbers of new passengers, but they are not necessarily the same passengers. o o Option C attracts more new passengers because of a higher number of new stations but it also deters more existing passengers due to longer travel times. Option D attracts new passengers, mostly those alighting at new downtown stations, but the modest number of new stations does not deter many existing passengers. Choice The project's impact on choice can be understood both in terms of how many opportunities there are to transfer to other rapid transit lines that serve destinations that people want to travel to (more opportunity is positive), and how many transfers riders need to make to reach their destinations (fewer transfers is assumed to be good). There are a number of key transit connection points on SmartTrack, including: 1. Union (Downtown); 2. Eglinton-Mount Dennis; 3. Markham Centre (Unionville); and 4. Renforth Gateway (at Mississauga Airport Corporate Centre). All of these points are identified as Mobility Hubs by Metrolinx, and should be planned as important connection points in the future. These hubs act as intermediary points on many transit trips to downtown Toronto and elsewhere in the city, in addition to being important destinations in their own rights. Page 33
34 SmartTrack would connect with a significant number of existing rapid transit lines. Each of the other rapid transit lines currently under study by the City would also connect with SmartTrack. Currently, Union Station serves as the terminus for all of the GO lines. SmartTrack envisages connecting the Stouffville and Kitchener lines and running a continuous service from Bramalea to Unionville, removing the need to transfer between GO trains for many users. Both SmartTrack options include all of the stations with connections to other rapid transit lines. Option C, with its additional stations, provides more connections to local bus routes. The number of connections to major walking and cycling infrastructure is also related to transportation choice. Examples of this type of infrastructure include downtown's PATH system for pedestrians, the Waterfront Trail system or the West Toronto Rail Path. SmartTrack would connect to the PATH at Union Station. The options do not differ significantly in their impacts or ability to connect to any such pedestrian or cycling facilities. On balance, all options perform equally well with respect to Choice. Social Equity The impact of a transit investment can be expressed in terms of a change in access to jobs for residents of Neighbourhood Improvement Areas (NIAs) and number of NIA residents served by rapid transit. SmartTrack would serve a moderate number of disadvantaged residents. Option C, by nature of its additional stations, serves more low income residents. Access to jobs for residents of NIAs would also increase (measured by the change in jobs accessibility for NIA measure, data is forthcoming). On balance, all options perform equally well with respect to Social Equity. Table 7: Social Equity Option C Option D Change in Rapid Transit Coverage (Toronto is approximately 640 km 2 ) +5.2 km km 2 Change in Disadvantaged Residents Served +9,900 +8,000 Page 34

35 Figure 13: GO Corridors with Existing Station Locations and Neighbourhood Improvement Areas Strengthening Places Shaping the City Transit investments can play a very significant role in the residential development of the city. Rapid transit may be constructed to serve areas of high population density in order to relieve congestion and increase capacity of local transit services, or rapid transit can be built in areas planned for higher population density in order to increase transportation accessibility and thus incent residential development in appropriate areas. Existing population represents an established market which makes benefits associated with serving it more certain than those associated with serving growth. However, it is still important in the evaluation of a project's impact on Shaping the City to consider how the project would serve residential growth areas to support and guide their development. SmartTrack serves the key growth areas in the Downtown and Liberty Village. It would also bring a station (Unilever) much closer to the significant growth occurring and planned for the Portlands. The station at Ellesmere in Option C is also close to Scarborough Centre, which has been designated for mixed-use development. By virtue of its additional station at Ellesmere, Option C provides some additional benefit over the base and Option C with regards to Shaping the City. This benefit may be captured in Option D as well pending the findings of the additional stations assessment. Page 35
36 Table 8: Residential Growth Option C Option D Existing Population existing GTHA population +24, ,500 Service to residential growth areas existing GTHA population density 4,600 people/km 2 5,600 people/km 2 area of land designated for population growth 0.7 km km 2 proportion of land designated for 14% 14% population growth Population Growth projected population growth +5,300 +5,000 projected increase in population density +1,000 +1,400 people/km 2 people/km 2 Healthy Neighbourhoods Just as transit investments can be a powerful force in shaping the city, they can also have longterm detrimental impacts on existing, stable neighbourhoods. A modest proportion of the SmartTrack study area is recognized as stable neighbourhoods, to which adding a station could bring unwanted development pressure and change. Option C is in close proximity to 1.0 km 2 of stable neighbourhoods and Option D is 0.7 km 2 (19% and 20% respectively). All options perform equally well with respect to Healthy Neighbourhoods. Public Health & Environment Transit has a very positive impact on public health and the environment due largely to enabling travel by modes other than private automobiles, which contribute significantly to air quality issues and encourage sedentary lifestyles. However, large infrastructure projects like rapid transit may also have detrimental impacts to natural features, which must be avoided or mitigated. SmartTrack would enable a savings of approximately 500,000 km per day. Option C and Option D perform similarly, with the reduction in vehicle kilometers travelled associated with Option D being slightly greater. There are some technical challenges with environmental impacts associated with locating a SmartTrack station at Unilever. However, these affect each of Option C and Option D equally. The Stouffville, Lakeshore East and Kitchener GO corridors pass over a number of river and creek systems presently. None of the options represent significant impacts to any of the systems. All options perform equally well with respect to public health and the environment. Page 36
37 Supporting Prosperity Supports Growth As with residential growth areas, transit investments can play a very significant role in the employment development in the city. Rapid transit may be constructed to serve areas of high employment density, or rapid transit can be built in areas planned for higher population density in order to increase transportation accessibility and thus incent businesses to locate high density employment like offices in appropriate areas. Existing employment density can be used as a proxy for what future employment density will be, however this projection is less certain than for population due to how employment growth tends to occur. Different types of employment develop at certain nodes, depending on how economies grow and change Toronto's Liberty Village is an example of how a dominant sector (technology) has developed very quickly in a relatively small area. This rapid development may not have been predictable 10 or 20 years ago. Strategically, the more important evaluation of a project's impact on supporting growth relates to how the project would serve employment growth areas. For example, the Unilever site has recently emerged as potential significant employment node. Recent proposals have suggested as many as 70,000 jobs could be located on the site. High quality transit options would be required to support such a concentration of employment. SmartTrack serves the key growth areas within the City including Downtown, Liberty Village, and Unilever as well as the Mississauga Airport Corporate Centre and Markham Centre, significant employment nodes with additional growth potential, outside the City. The Ellesmere Station in Option C would also provide a close connection to Scarborough Centre, an area identified by the Official Plan for mixed-use intensification. The Finch, Ellesmere and Lawrence stations are located in close proximity to Employment Areas. Although the areas currently contain low density employment uses, this could change over time, particularly with the introduction of regional transit services. Option C is preferred from the perspective of Supporting Growth. Table 9: Employment Growth Option C Option D Existing Employment existing employment 19,000 12,400 Density existing employment density 3,600 jobs/km 2 3,400 jobs/km 2 Service to Employment Growth Areas Projected employment growth area of land designated for 1.9 km km 2 employment growth proportion of land designated for employment growth 36% 31% projected employment growth 30,600 28,400 projected increase in employment density 5,800 jobs/km 2 7,700 jobs/km 2 Page 37
38 Strategic Analysis Discussion Summary GO RER represents a significant improvement in GO service for the GTHA as a whole and for the City of Toronto. Especially when combined with fare and service integration, the GO RER program will substantially improve access to the GO network for Torontonians and its relevancy as a travel option. Over and above this improvement, there is room to go further, and by adding new stations, both of the integrated RER-SmartTrack options do this. Both Options C and D address the problem statement and further the vision for integrating GO RER and SmartTrack. Option C goes further than Option D in opening up new access points to GO within Toronto and thus performs better with regards to shaping the city and supporting growth. In particular, Option C increases accessibility to the downtown job market from nearby areas lacking rapid transit downtown access, which will promote intensification. The two options also have similar ridership increases, and outcomes with respect to choice, social equity, healthy neighbourhoods, public health and the environment. Option D has a strategic advantage over Option C in that it has less negative impact to medium and long distance commuters and does not deter passengers from those markets from choosing GO by imposing significant additional travel time. Option D does this by focusing on adding the most promising new stations, mostly those near employment clusters. In terms of coming to the optimal balance between local access and regional service, Option D is the strongest performer. Page 38
39 7.0 FINANCIAL CASE The financial case aligns with the Feeling Congested? affordability metric and seeks to understand the investment costs and the ongoing operating costs throughout the whole life of the asset. The financial accounts are summarized in the following tables: Table 10: Financial Information Summary Nominal Dollars Base Case GO RER Kitchener+Stouffville Option C: Committed RER frequencies with slower long-distance service, 7-8 new stations Option D: Committed RER frequencies, 4-5 new stations Capital Costs (Rail only, $M, 2014, costs do not include escalation, financing costs, $3,300 +$ $ lifecycle and operating and maintenance) Nominal Annual Operating Costs ($M 2031) $140 +$8.7 +$5.3 Annual Incremental Revenue to GO ($M, 2031) $210 +$11.8 +$15.1 Cost Recovery Ratio (2031) 150% 149% 155% Capital Cost Caveats: Detailed capital costs are included in an appendix. The capital costing prepared to date is at a high-level and should be understood with a number of caveats: Capital costs broadly align with the New Stations analysis and are presented with appropriate contingency. Costs do not include escalation, financing costs, lifecycle, and operating and maintenance costs. Corridor infrastructure costs are built from numerous component costs including bridge widening, additional electrification, tracks and signals; each element will require further design and costs are subject to change. Property acquisition costs have been estimated for new corridor infrastructure. Further work is required to confirm property requirements and costs for new stations. Cost estimates for Union Station, fleet, and other system costs were developed based on high-level assumptions and may change as further analysis is conducted. Page 39
40 Financial Analysis Discussion Options C and D are relatively similar in terms of financial performance. Option C is slightly more expensive to both build and operate, compared to Option D because it involves a larger number of new stations and consequently incur larger costs to build and maintain. Options C and D have similar ridership and because the operating costs for Option C are higher due to additional stations, it has a lower cost recovery ratio as compared to Option D. Page 40
41 8.0 ECONOMIC CASE The economic case measures, quantifies, and monetises transport impacts (benefits) and seeks to compare those benefits with costs to understand relative performance and value-for-money of each investment option. There are other benefits, like ambiance and comfort, which are not monetized or included in the benefit cost ratio. The following benefits were monetized and incorporated into the analysis: Travel time impacts (savings and delays to both new and existing users) Unperceived vehicle operating cost savings comprised of savings for people who switch from auto to transit Fare revenue Reduction of emissions, collisions, and congestion due to reduced vehicle-kilometres travelled (VKTs) Table 11: Economic Information Summary 2014$ Value Base Case GO RER Kitchener+Stouffville (Compared with Do- Minimum Scenario) Option C: Committed RER frequencies, 7-8 new stations Option D: Committed RER frequencies, 4-5 new stations Total Lifecycle Costs ($M, PV) Incremental Lifecycle Costs ($M, PV) $6,900 (does not include system costs; includes RER Do- Minimum Scenario costs) $4,100 (Incremental to the GO RER Do-Minimum Scenario) $1,000-1,600 (Incremental to GO RER) $ (Incremental to GO RER) Net Benefits (PV) $4,100 ($2,200) ($1,100) Benefit Cost Ratio 2.0 Negative Negative (Incremental Benefits/Incremental Costs) GO RER Kitchener - and Stouffville corridors Combined 2.0 Benefit Cost Ratio Impact to Kitchener- Stouffville RER Benefit Cost Ratio - 31% decrease to % decrease to 1.64 Page 41
42 Table 12: Economic Benefits Breakdown* 2014$ Value, $M Travel Time Impacts (negative result indicates delay) Auto Operating Cost Savings (due to mode shift from auto to transit) Collision Reduction Savings (due to mode shift from auto to transit) Congestion Relief (due to mode shift from auto to transit) Environmental Benefits Base Case GO RER Kitchener+Stouffville (Compared with Do- Minimum Scenario) Option C: Committed RER frequencies, 7-8 new stations Option D: Committed RER frequencies, 4-5 new stations $3,200 ($1,200) ($600) $3,800 $20 $110 $400 under $5M $10 $800 $10 $40 $20 under $5M under $5M Total Benefits $8,200 ($1,100) ($400) * It should be noted that the City of Toronto has also conducted some economic analysis which is presented in Appendix C of this document. Economic Analysis Discussion Overall, Option D is a stronger performer than Option C, when assessed through an economic lens. The primary lens through which economic performance was analyzed is through an assessment of each option s impact to the established GO RER benefit-cost ratio. The GO RER benefit-cost ratio is 3.1, meaning that the benefits of the investment, including travel time savings and auto operating cost savings exceed the life cycle costs (including capital and operating) by a factor of three. For the Kitchener and Stouffville corridors, the combined benefit-cost ratio is 2.0. This was calculated by adding up total benefits for Kitchener and Stouffville and dividing by the sum of the total costs for the two corridors. In order to measure the economic impacts of Options C and D, the change to the combined Kitchener and Stouffville benefit-cost ratio was assessed. Option C has a negative impact and would reduce the RER benefit-cost ratio from 2.0 to Option D has a smaller negative impact and would shift the combined benefit-cost ratio from 2.0 to For both options, the benefit-cost ratio remains above 1:1. Option C has a stronger negative effect than Option D. Page 42

43 Figure 14: Impact of Options C and D to GO RER Kitchener-Stouffville Benefit-Cost Ratios The net benefits for both Options C and D are below zero, meaning that for both options, the disbenefits outweigh the positive benefits. For both of the options, this is due to travel time penalties associated with the addition of new stations. While a small number of passengers benefit substantially from the new stations, a larger number of passengers incur small time penalties at each added station. In aggregate, the time lost to the larger group of passengers outweighs the smaller number of passengers who would save time. Options C and D differ in terms of auto operating cost savings. While both options have a similar number of new riders, Option C attracts more City of Toronto residents making shorter trips and deters passengers making longer trips, leading to a smaller reduction in vehicle kilometres travelled. Option D attracts more passengers making longer trips and alighting at new downtown stations. Because Option D adds fewer new stations, it does not deter as many long distance travelers as Option C, leading to a larger reduction in vehicle kilometres travelled, compared to Option C. Accident reduction savings and congestion relief are both related to reduction in vehicle kilometres travelled and thus have comparable patterns to auto operating cost savings, with Option D performing slightly better than Option C. Page 43
44 9.0 CONCLUSION AND NEXT STEPS Based on the analysis in the business case, Option D is the strongest performing option for integration SmartTrack with GO RER. Option D has an advantage in overall ridership and strikes the optimal balance in terms of advancing local access within Toronto while preserving service quality for longer distance passengers. While both options perform less positively through the lens of economic analysis, Option D has a smaller negative impact to the GO RER Kitchener and Stouffville benefit-cost ratio. Next steps include: The number and locations of new stations are being determined through the new stations analysis, which includes business cases on each potential location. The GTHA Fare Integration Strategy is progressing and is currently conducting analysis on the different integration options, including ridership and revenue assessments. As a clearer direction emerges on fare integration, the impacts on ridership, particularly at City of Toronto GO stations will be incorporated into overall GO RER analysis and into analysis of the integrated options. Work is ongoing to better understand different aspects of Union Station, including a more nuanced understanding of capacity that takes train flows through the entire Union Station Rail Corridor into account. As this work moves forward and is applied to an updated understanding of how GO RER will operate, it will likewise be applied to the integrated RER-SmartTrack options. Page 44
45 10.0 APPENDIX Appendix A: Technical Methodology supporting the Deliverability Screening Operational Feasibility Operational feasibility measures the practicality of an option from different angles, such as infrastructure requirements, crewing and fuel options. At the screening phase, infrastructure requirements are deemed the most significant constraints among other considerations. Options will be advanced for further analysis beyond the screening phase if it satisfied the infrastructure requirements, which is explored in detail in the following section. Infrastructure Requirements Each SmartTrack option has its own infrastructure requirements, such as track and train storage needs. In order to achieve the transportation objectives and deliver within the given timeframe, the key infrastructure constraint is to utilize only the existing and planned infrastructure within the scope of GO RER. Track Requirements To determine track requirements for each option, a preliminary timetable is developed using a list of assumptions that are shared among all options, such as train speed for electrified service and station dwell times. The timetable is then converted to a time-distance plot, which displays each and every train as a line on the plot based on its schedule and routing. See below for a sample time-distance plot. Page 45

46 SmartTrack Option D service Zoom-in #1: An example of two trains travelling in different directions meeting at a location where two tracks will be required Zoom-in #2: An example of a faster express train overtaking a slower local all-stop train A time-distance plot creates a visual assessment of potential conflicts. For example, when two lines intersect, it represents two trains are meeting at that specific location; see Zoom-in #1. Trains can meet regardless of the direction in which they are travelling. Trains travelling in the same direction may intersect when a faster train overtakes a slower train; see Zoom-in #2. Where trainmeet occurs, a minimum of two tracks are required to avoid conflicts. And the more trains meet at a location, the more tracks are required. When there is insufficient track infrastructure to accommodate all the movements, the schedule of one or more trains can be advanced or postponed to shift the train meet location to where there are sufficient tracks. In some cases, converting trains between an express service and local all-stop service provides more flexibility in altering the train-meet locations. As a last resort, a new siding or an additional mainline track will need to be constructed to accommodate all the movements. The choice between constructing a siding or mainline track is dependent on the frequency and Page 46
47 proximity of the train meet locations. In cases where multiple train-meet locations are in relatively close proximity, it may be more efficient to build an additional mainline track than multiple sidings. During the assessment, it was determined that some options achieved the goal of increased travel options for Toronto residents, but that increase came at the expense of triggering new infrastructure at one or more locations that are beyond the scope of GO RER. Storage Requirements Trains need storage when they are out of service, thus the number of train required, or fleet, has a direct impact on storage requirement. Once a timetable is developed for each option, fleet size can be estimated based on the journey time and service frequency. Essentially, the longer the journey time and the higher the service frequency, the more trains are required. While all options involve electrification, which offer journey time savings through train speed improvements, the time saved may not be able to offset additional station stops or higher service frequency in some options. As a result, an expanded fleet can be expected in some options. It was determined that some options achieved the goal of growing ridership through higher service frequency and additional stations, but that growth came at the expense of expanded fleet and additional storage requirements that are beyond the scope of GO RER. Page 47
48 Appendix B Integrated GO RER-SmartTrack Options Incremental Capital Cost Estimates Introduction This document presents capital cost estimates for the integrated GO RER-SmartTrack options. It contains six tables, the first of which presents the portion of committed GO RER capital costs which are attributable to advancing the SmartTrack proposal. The remaining five tables present capital costs, incremental to GO RER, for integrated options A, B, C and D. All costs are in 2014$ and exclude escalation, financing costs, lifecycle and operating and maintenance. The costing prepared to date is at a high-level and should be understood with a number of caveats: Costs for new stations are built on placeholder costs for average GO stations and do not necessarily reflect the individual designs that may be required for different sites. As such, a range of costs has been provided. Corridor infrastructure costs are built from numerous component costs including bridge widening, additional electrification, tracks and signals; each element will require further design and costs are subject to change. Property acquisition costs have been estimated for new corridor infrastructure. Further work is required to confirm property requirements and costs for new stations. Cost estimates for Union Station, fleet, and other system costs were developed based on high-level assumptions and may change as further analysis is conducted. Eglinton rapid transit costs are preliminary and may need to be reassessed with further work. For example, further engineering and design work is required to fully capture utility conflicts and potential utility relocations. Contingency has been allocated in the estimate; however, it may need to be reassessed if there are significant underground utility conflicts. Page 48
49 Table B1: Breakdown of Base GO RER Costs Common to SmartTrack GO RER Costs Common Element ($B) Costs ($B) Corridor Costs Kitchener Segment (Toronto) Lakeshore East Segment (Toronto) Includes a fourth track on the Kitchener corridor from Mt. Dennis to the USRC as well as associated bridge reconstruction and grade separations, and electrification Includes fourth track between Scarborough Junction and the USRC as well as associated bridge reconstruction and grade separations, and electrification Stouffville Segment (Toronto) Stouffville Segment (York Region) Includes double tracking and electrification of the Stouffville corridor from Unionville to Scarborough Junction as well as associated bridge reconstruction and grade separations Other Corridors 3.1 NA Includes Lakeshore West, Milton, Barrie, and Richmond Hill corridors System Costs Union Station Fleet Other Costs Total Two of the twelve Union Station platforms will be used for Kitchener and Stouffville service (~%17) Assumes 13 8-car EMU consists would be required + 20% spare coaches at $0.044B per 8-car consist Of the 221 route miles for RER, 36 miles are common to SmartTrack for a proportion of 16%. Page 49
50 Table B2 Option A: Increased frequency, 5 new stations Element New Stations Corridor Infrastructure: Stouffville Corridor Infrastructure: Kitchener Corridor Infrastructure: Lakeshore E Capital Cost ($B, costs do not include escalation, financing costs, lifecycle and operating and maintenance) Notes Station locations should be considered representative; specific locations will be recommended through the ongoing new stations analysis. New station infrastructure for 5 new stations at Gerrard/Carlaw, Unilever, Bathurst/Spadina, Liberty Village, and St. Clair West. Additional storage tracks required at Unionville to support higher service frequency ($26M) 1 additional track required (5th track) between USRC and the Airport Spur. Additional storage tracks required at Bramalea to support higher service frequency 5th track required on Lakeshore East between USRC and Scarborough Junction Placeholder cost for Union Station upgrades Union Station 0.9 Fleet 0.8 Assumes additional EMU fleet Other System Costs 0.3 Total System costs for dispatching office and additional end of line maintenance/storage facilities. Page 50
51 Table B3 Option B: Local and Express service with 8 new stations Element Capital Cost ($B, costs do not include escalation, financing costs, lifecycle and operating and maintenance) Notes New Stations Station locations should be considered representative; specific locations will be recommended through the ongoing new stations analysis. New station infrastructure for 8 new stations at Finch, Ellesmere, Lawrence, Gerrard/Carlaw, Unilever, Bathurst/Spadina, Liberty Village, and St. Clair West. Corridor Infrastructure: Stouffville Includes 3rd and 4th Track and associated improvements, as well as full property takings up to Unionville for 2 additional tracks. Corridor Infrastructure: Kitchener 3.9 5th and 6th additional tracks on the Kitchener corridor from Strachan Avenue to the Airport spur. Requires major modifications to Strachan Grade Separation and West Toronto Diamond and significant property takings Corridor Infrastructure: Lakeshore E th track along the Lakeshore East corridor between Scarborough Junction and the Union Station Rail Corridor Union Station 0.9 Requires up to two new platforms at Unions Station. Costs provided for Simcoe Station concept - Underground Station with tunnel entrance just to the West side of Union Station. Costs from USRC EP Report based on the completed high level conceptual design Fleet 0.5 Assumes additional EMU fleet Other System Costs 0.4 Total System costs for dispatching office and additional end of line maintenance/storage facilities. Page 51
52 Table B4 Option C: Eliminate long-distance express service with 7 new stations Capital Cost ($B, costs do not include escalation, financing costs, lifecycle and Element operating and maintenance) Notes New Stations Station locations should be considered representative; specific locations will be recommended through the ongoing new stations analysis. New station infrastructure for 7 new stations at Finch, Ellesmere, Lawrence, Gerrard/Carlaw, Unilever, Liberty Village, and St. Clair West. Bathurst-Spadina was not included as analysis indicates that it will not be workable for Kitchener service. Fleet 0.1 Assumes additional EMU fleet Total Table B5 Option D: Full GO RER with 4 new stations Capital Cost ($B, costs do not include escalation, financing costs, lifecycle and Element operating and maintenance) New Stations Total Notes Station locations should be considered representative; specific locations will be recommended through the ongoing new stations analysis. New station infrastructure for 4 new stations at Gerrard/Carlaw, Unilever, Liberty Village, and St. Clair West. Bathurst- Spadina was not included as analysis indicates that it will not be workable for Kitchener service. Page 52
53 Appendix C: Modelling Results Prepared Using the City of Toronto s GTA Model This appendix presents ridership and related information for GO RER on the Kitchener and Stouffville corridors as well as Options C and D. The ridership forecasts were developed using the City of Toronto s GTA model V4.0 for The modelling assumes a TTC fare for GO RER passengers between Milliken on the Stouffville Corridor and Mt. Dennis on the Kitchener Corridor (the SmartTrack geography). In terms of land use, it uses a low population, medium employment scenario with land use effects generated by SmartTrack. Table 1: Business Case Summary Table (TTC Fare) Indicator Base Case - GO RER (Kitchener- Stouffville) Option C with TTC Fare Option D with TTC Fare Ridership (annual) 27.4M +8.5M +9M Nominal Annual Revenue ($M 2011 Equivalent) +$8.8 +$12.6 * 2031 Forecast year ** Land Use: Low population, Medium Employment with SmartTrack Influence *** Revenue calculation only accounts for GO and TTC/SmartTrack Fares Table 2: Ridership and Travel Time Summary (TTC Fare) Options Ridership Net New Riders Transit Rider Travel Time Savings Compared to Base RER (million minutes) GO RER Option C with TTC Fare 27.4 million on Kitchener-Stouffville +26 million* on Kitchener-Stouffville +8.5M 491.6** Option D with TTC Fare million* on Kitchener-Stouffville +9M 517.4** * The Option C ridership captures both TTC paying customers and those using the new stations. This calculation is done by comparing the ridership in the effected corridors before and after Option C. This incorporates any negative effect to long-distance riders. **Compares back to 2031 Base RER Concept Page 53
54 Table 3: Financial Information Summary (TTC Fare) Nominal Dollars (2011$ Value) GO RER Option C with TTC Fare Option D With TTC Fare Annual Incremental revenue to GO ($M 2011)* +$8.8 +$12.6 * Revenue calculation only accounts for GO and TTC/SmartTrack Fares Table 4: Economic Benefits Breakdown (TTC Fare) Option C with TTC Fare Option D With TTC Fare Annual Travel Time Benefit (Compared to GO RER), $M, ** 138** Annual Auto Time Savings (back to GO RER) - due to congestion relief from mode shift 12.8** 26.6** * 2031 Forecast Year * Assumes a Value of Time of $16/hour ** This is an annual travel time benefit. This requires a net-present value calculation to be comparable Page 54
55 Appendix D: Ridership, Benefits & Economic Analysis Methodology Introduction The RER-SmartTrack analysis of alternative options relies upon an estimate of passenger behaviour in response to changes in service. For Options C and D, the primary change to the service is the introduction of new stations on the line. Those stations have both positive and negative effects for transit passengers: Passengers who use the new stations save travel time. The station access time is lower than it would be without the new station, when access would have to be to the next closest station. Passengers who do not use the new stations experience a travel delay, due to the extra time required for the train trip due to the new station, typically 2-3 min. per station. As a result of the travel time savings and delays, some travellers may shift their route or mode of transportation. There will be both gains and losses of RER passengers due to these route and mode shifts. Some passengers are attracted to RER by the new stations and will shift from an all-ttc transit route to an RER trip or a combined RER+TTC trip. Other passengers are diverted from RER due to the longer total travel time and will shift from an RER trip to a bus+subway trip or a driving trip. To account for the impacts of these new stations on passengers, it is helpful to categorize the different types of passengers into five groups, shown in Table 2. Table 2: Segmentation of demand into five groups of passengers, each of whom experiences a new station differently. In the table below downstream means locations closer to Union Station than the new station site. Group A Group B Group C Group D Description Existing & unaffected GO/RER riders (e.g., downstream or express riders) Existing upstream GO/RER riders (affected but do not change behaviour) Shift GO/RER access station (existing but would prefer new station) Attracted to GO/RER (shift route/mode due to easier access/egress) Would ride GO/RER without new station(s)? Would ride GO/RER with new station(s)? Delayed by new station(s)? Accesses/ egresses via new station(s)? Group E Diverted from GO/RER (existing, shift Page 55
56 route/mode due to delay) We can see that combining these groups in different manners helps us understand what happens to overall GO/RER ridership: C + D = Gross riders at the new station(s) D E = Net new riders on the RER/GO system due to the new station(s) B, C, D, E: all affected by addition of new stations, and experience either a positive or negative time impact. The impact is different for each group. Using this categorization, a set of metrics can be defined that are useful for understanding the impact of the new stations. The metrics are outlined in Table 3 and Table 4. Table 3: Metrics for ridership and benefits, and the approximate associated mathematical formula. See following table for a guide to the notation in the formulas. Metric Formula Gross riders Net new riders nn CC + nn DD nn DD nn EE Transit rider time savings due to new stations nn BB tt BB + nn CC tt CC (nn DD tt DD nn EE tt EE ) Transit rider time break even metric (ratio of positive benefits to negative benefit. With this metric, a ratio of 1.0 means the two are balanced and give a net zero benefit.) Vehicle kilometre travelled (VKT) savings due to new stations Net new revenue to Metrolinx/GO due to new stations nn CC tt CC nn DD tt DD nn BB tt BB 1 2 nn EE tt EE nn DD auto DD dd DD nn EE auto EE dd EE nn DD $ DD nn EE $ EE Table 4: Notation used in metric formulas. Notation nn XX Meaning Number of riders in group X (trips) tt XX Change in travel time for group X (weighted min. / trip) aaaaaaaa XX Percentage of riders who would otherwise switch modes and drive for the trip (%) dd XX Average distance driven for group X (km / trip) $ XX Average GO fare for group X ($ / trip) Page 56
57 Generally, the primary drivers of benefits within this framework are: Positive benefit: very high employment or full-time post-secondary institution within 1 km (i.e., high AM peak alighting activity) Positive benefit: a through service stopping at the station after letting most passengers off at Union Station Positive benefit: new boarding riders within 1km of station Negative benefit: high number of upstream passengers with no express service option to bypass the new stations. Negative benefit: high delay at station (e.g., on a diesel locomotive-hauled trip) Negative benefit: presence of an attractive parallel transit service (e.g., TTC subway) Page 57

58 Implementation Typically, Metrolinx generates these types of metrics using a four-stage travel demand model such as the Greater Golden Horseshoe Model. However, Metrolinx staff find that it is quite challenging to obtain this level of geographic accuracy for GO Transit services within a four-stage model, particularly when trying to study a wide swath of different station sites. Doing this kind of work requires accurate station-level and even zone-level forecasts of travel behaviour, on both the access and egress end of the trip. As an alternative, a spreadsheet analysis system was developed to provide estimates of these metrics at each station with a reasonable level of confidence for this type of finer geographic analysis. In a few cases, key numbers were cross-checked using the Greater Golden Horseshoe Model. An overview of the analysis approach is shown in Figure 1. Figure 1: Overview of analysis approach Assumptions A few key assumptions applied within this framework are shown below: RER ridership and annual growth rates: based on ridership data from the GO Rail 2031 Ridership (Regional Express Rail scenario 5) report, February This captures the effects of population/employment growth across the region and the effects of the RER service introduction. Future real estate development and population/employment growth: generally, based on the assumption that population growth due to development at each new station site is similar to the growth at other stations on the line. In two special cases where very major office developments are committed and proceeding close to potential station sites in downtown Toronto, they have been included in the analysis (The Well at Spadina/Front St. W, Globe & Mail Centre at King E/Berkeley). Page 58
TORONTO TRANSIT COMMISSION REPORT NO.
 Form Revised: February 2005 TORONTO TRANSIT COMMISSION REPORT NO. MEETING DATE: October 24, 2012 SUBJECT: DOWNTOWN RAPID TRANSIT EXPANSION STUDY (DRTES) PHASE 1 STRATEGIC PLAN ACTION ITEM RECOMMENDATIONS
Scarborough Transit Planning
 Scarborough Transit Planning April 23, 2016 Transportation Planning Section City Planning Division Overview 1. Developing Toronto s Transit Network Plan 2. Scarborough Transit Planning 1. Minutes of last
Developing Toronto s Transit Network Plan to Public Information Meeting June 21, 2016
 Developing Toronto s Transit Network Plan to 2031 Public Information Meeting June 21, 2016 March 2016 City Council Direction SmartTrack: Approved SmartTrack/GO Regional Express Rail (RER) Integration options
Developing Toronto s Transit Network Plan to 2031
 RE:EX16.1 Developing Toronto s Transit Network Plan to 2031 Executive Committee Meeting June 28, 2016 March 2016 City Council Direction SmartTrack: Approved SmartTrack/GO Regional Express Rail (RER) Integration
Developing Toronto's Transit Network Plan: Phase 1
 EX13.3 STAFF REPORT ACTION REQUIRED Developing Toronto's Transit Network Plan: Phase 1 Date: March 3, 2016 To: From: Wards: Executive Committee City Manager, Deputy City Manager, Cluster B and Chief Planner
CONNECTING THE REGION
 CONNECTING THE REGION GERRY CHAPUT VICE PRESIDENT, RAPID TRANSIT, METROLINX VALUE ANALYSIS CANADA SUMMIT KEYNOTE OCTOBER 16, 2017 Metrolinx was created in 2006 by the Province of Ontario to improve the
GO Transit s deliverable: the 2020 Service Plan
 GO Transit s deliverable: the 2020 Service Plan GO Transit s 2020 Service Plan describes GO s commitment to customers, existing and new, to provide a dramatically expanded interregional transit option
PROJECT BACKGROUND 3
 AGENDA 1. Welcome & Introductions 2. Project Background 3. Project Approach & Schedule 4. Draft Long List of Options 5. Evaluation Process 6. Next Steps 2 PROJECT BACKGROUND 3 OUR RAPID TRANSIT NETWORK
Form Revised: February 2005 TORONTO TRANSIT COMMISSION REPORT NO. MEETING DATE: August 30, SUBJECT: Scarborough Rt Strategic Plan
 Form Revised: February 2005 TORONTO TRANSIT COMMISSION REPORT NO. MEETING DATE: August 30, 2006 SUBJECT: Scarborough Rt Strategic Plan RECOMMENDATIONS It is recommended that the Commission: 1. Endorse
Yonge Relief Network Study (YRNS)
") Yonge Relief Network Study (YRNS) Report for June 25 th Metrolinx Board Meeting Leslie Woo, Chief Planning Officer Anna Pace, Director, Project Planning and Development Summary of Yonge Relief Network
Yonge Relief Network Study (YRNS) Report for June 25 th Metrolinx Board Meeting Leslie Woo, Chief Planning Officer Anna Pace, Director, Project Planning and Development Summary of Yonge Relief Network
Public Information Session June 2, Transportation Planning Section City Planning Division Toronto Transit Commission
 Coordinated Transit Planning in Toronto SmartTrack/GO RER Eglinton West LRT Eglinton East LRT Scarborough Subway Extension Relief Line Waterfront Transit Public Information Session June 2, 2016 Transportation
Mr. Vince Mauceri General Manager Transportation Operations and Technology
 Mr. Vince Mauceri General Manager Transportation Operations and Technology METROLINX OVERVIEW AND MANDATE Established in 2006 to address the significant transportation challenges in the Greater Toronto
STRATEGIC PRIORITIES AND POLICY COMMITTEE MAY 5, 2016
 STRATEGIC PRIORITIES AND POLICY COMMITTEE MAY 5, 2016 Shift Rapid Transit Initiative Largest infrastructure project in the city s history. Rapid Transit initiative will transform London s public transit
APPENDIX 6: Transportation Modelling Considerations City of Toronto, February 2014
 APPENDIX 6: Transportation Modelling Considerations City of Toronto, February 2014 Transportation and Infrastructure The future of the elevated Gardiner Expressway east of Jarvis Street forms part of a
CITY OF LONDON STRATEGIC MULTI-YEAR BUDGET ADDITIONAL INVESTMENTS BUSINESS CASE # 6
 2016 2019 CITY OF LONDON STRATEGIC MULTI-YEAR BUDGET ADDITIONAL INVESTMENTS BUSINESS CASE # 6 STRATEGIC AREA OF FOCUS: SUB-PRIORITY: STRATEGY: INITIATIVE: INITIATIVE LEAD(S): BUILDING A SUSTAINABLE CITY
Presentation A Blue Slides 1-5.
 Presentation A Blue Slides 1-5. 1 Presentation A Blue Slides 1-5. 2 Presentation A Blue Slides 1-5. 3 Presentation A Blue Slides 1-5. 4 Presentation A Blue Slides 1-5. 5 Transit Service right. service
GO RER INITIAL BUSINESS CASE SUMMARY
 GO RER INITIAL BUSINESS CASE SUMMARY 2015 GO RER INITIAL BUSINESS CASE SUMMARY 2015 2 TABLE OF CONTENTS 1. Ready, Set, GO 1.1 Building on success 1 1.2 Fixing the GTHA s transportation problem 2 1.3 RER
CONNECTING THE REGION
 CONNECTING THE REGION MARY PROC, VICE PRESIDENT, CUSTOMER SERVICE DELIVERY, METROLINX NATIONAL RAILWAY DAY NOVEMBER 7, 2017 OUR NEW CEO PHIL VERSTER I am very excited about joining the team of dedicated
Re: EX16.1. Developing Toronto's Transit Network Plan to Attachment 5
 Re: EX16.1 Developing Toronto's Transit Network Plan to 2031 1 Contents 1. Executive Summary... 3 2. Background and Context... 7 Problem Statement... 9 Decision History on Options Development... 10 Options
Green Line LRT: Beltline Segment Update April 19, 2017
 Green Line LRT: Beltline Segment Update April 19, 2017 Quick Facts On April 11, 2017, City Council approved Administration s recommendation for the Green Line to be underground in the Beltline from 2 Street
5 RAPID TRANSIT NETWORK PLAN PRINCIPLES, METROLINX BUSINESS CASE, AND ALTERNATIVE FINANCE AND PROCUREMENT ANALYSIS UPDATE
 5 RAPID TRANSIT NETWORK PLAN PRINCIPLES, METROLINX BUSINESS CASE, AND ALTERNATIVE FINANCE AND PROCUREMENT ANALYSIS UPDATE The Rapid Transit Public/Private Partnership Steering Committee recommends the
The Engineering Department recommends Council receive this report for information.
 CORPORATE REPORT NO: R161 COUNCIL DATE: July 23, 2018 REGULAR COUNCIL TO: Mayor & Council DATE: July 19, 2018 FROM: General Manager, Engineering FILE: 8740-01 SUBJECT: Surrey Long-Range Rapid Transit Vision
RELIEF LINE PRELIMINARY BENEFITS CASE ANALYSIS. November 2012
 RELIEF LINE PRELIMINARY BENEFITS CASE ANALYSIS November 2012 Relief Line Preliminary Benefits Case Analysis Final Report November 2012 CONTENTS EXECUTIVE SUMMARY... 3 PART A PROJECT RATIONALE... 10 CONTEXT
CONNECTING THE REGION
 CONNECTING THE REGION JUDY PFEIFER CHIEF COMMUNICATIONS & PUBLIC AFFAIRS OFFICER LESLIE WOO CHIEF PLANNING OFFICER, PLANNING & POLICY PRESENTED AT AMO INSIGHT BREAKFAST SESSION AUGUST 14, 2017 7:15AM 8:15AM
The City of Toronto s Transportation Strategy July 2007
 The City of Toronto s Transportation Strategy July 2007 Presentation Outline Transportation Statistics Transportation Building Blocks Toronto s Official Plan Transportation and City Building Vision Projects
Executive Summary. Phase 2 Evaluation Report. Introduction
 , Executive Summary Executive Summary Introduction TransLink and the Province of British Columbia sponsored a multi-phase study to evaluate alternatives for rapid transit service in the Broadway corridor
Green Line LRT: Beltline Recommendation Frequently Asked Questions
 Green Line LRT: Beltline Recommendation Frequently Asked Questions June 2017 Quick Facts Administration has evaluated several alignment options that would connect the Green Line in the Beltline to Victoria
CREATING CONNECTIONS IN THE CITY OF KITCHENER
 CREATING CONNECTIONS IN THE CITY OF KITCHENER GORD TROUGHTON, DIRECTOR, CORRIDOR INFRASTRUCTURE ERIN MOROZ, DIRECTOR, COMMUNICATIONS AND COMMUNITY RELATIONS KITCHENER CITY COUNCIL SEPTEMBER 25, 2017 CONGESTION
CREATING CONNECTIONS IN WATERLOO REGION
 CREATING CONNECTIONS IN WATERLOO REGION GORD TROUGHTON, DIRECTOR, CORRIDOR INFRASTRUCTURE CHRIS BURKE, DIRECTOR, SERVICE PLANNING ERIN MOROZ, DIRECTOR, COMMUNICATIONS AND COMMUNITY RELATIONS METROLINX
Yonge-Eglinton. Mobility Hub Profile. September 19, 2012 YONGE- EGLINTON
 September 19, 2012 PEEL YORK HALTON DURHAM HAMILTON TORONTO YONGE- EGLINTON MOBILITY HUBS: places of connectivity between regional and rapid transit services, where different modes of transportation come
TORONTO TRANSIT COMMISSION REPORT NO.
 Form Revised: February 2005 TORONTO TRANSIT COMMISSION REPORT NO. MEETING DATE: May 28, 2009 SUBJECT: DON MILLS STATION ACTION ITEM RECOMMENDATIONS It is recommended that the Commission: 1. Endorse the
Presentation Context. Major Mackenzie & 48 Land Owners Group. Presentation on Behalf of the. Development Services Committee.
 Presentation on Behalf of the Major Mackenzie & 48 Land Owners Group 1 Stouffville Corridor Rail Service Expansion Class Environmental Assessment City of Markham Development Services Committee 10 September
Issues Facing the Panel
 Issues Facing the Panel Choice of technology for Sheppard Avenue (not for every corridor every where for all time!): subway vs. LRT Budget implications I would argue that procurement, construction management
CREATING CONNECTIONS IN THE CITY OF WATERLOO
 CREATING CONNECTIONS IN THE CITY OF WATERLOO GORD TROUGHTON, DIRECTOR, CORRIDOR INFRASTRUCTURE METROLINX ERIN MOROZ, DIRECTOR, COMMUNICATIONS AND COMMUNITY RELATIONS METROLINX METROLINX PRESENTATION TO
TORONTO TRANSIT COMMISSION REPORT NO.
 Revised: March/13 TORONTO TRANSIT COMMISSION REPORT NO. MEETING DATE: March 26, 2014 SUBJECT: COMMUNITY BUS SERVICES ACTION ITEM RECOMMENDATION It is recommended that the Board not approve any routing
TRANSFORMING THE WAY OUR REGION MOVES
 TRANSFORMING THE WAY OUR REGION MOVES Judy Pfeifer, Chief Communications and Public Affairs Officer Gord Troughton, Director, Corridor Infrastructure Chris Burke, Director, Service Planning GRIDLOCK COSTS
Attachment 5 Eglinton West LRT Planning and Technical Update
 Eglinton West LRT Planning and Technical Update 1. Introduction In July 2016, City Council approved an Eglinton West LRT with between 8 and 12 stops between Mount Dennis and Renforth Gateway, and up to
Recommended Vision for the Downtown Rapid Transit Network
 Recommended Vision for the Downtown Rapid Transit Network April 2008 Presentation Overview Context Transit options Assessment of options Recommended network Building the network 2 1 Rapid Our Vision Reliable
Journey to Excellence. Building Markham s Future Together. Development Services Committee. Transit. Update. June 23, 2015
 Development Services Committee June 23, 2015 Building Markham s Future Together Transit Update Presentation: 1. Overview of Metrolinx 2. The Big Move 3. Projects Update 4. Investment Strategy 5. Next Steps
Executive Summary. Draft Environmental Impact Statement/Environmental Impact Report ES-1
 Executive Summary Introduction The Eastside Transit Corridor Phase 2 Project is a vital public transit infrastructure investment that would provide a transit connection to the existing Metro Gold Line
EX29.1 REPORT FOR ACTION. SmartTrack Project Update and Next Steps SUMMARY
 EX29.1 REPORT FOR ACTION SmartTrack Project Update and Next Steps Date: November 17, 2017 To: Executive Committee From: City Manager and Deputy City Manager, Cluster B Wards: All SUMMARY In July 2016,
2.1 TRANSIT VISION 2040 FROM VISION TO ACTION. Expand regional rapid transit networks STRATEGIC DIRECTION
 TRANSIT VISION 2040 FROM VISION TO ACTION TRANSIT VISION 2040 defines a future in which public transit maximizes its contribution to quality of life with benefits that support a vibrant and equitable society,
5 New GO Stations in York Region to Support Regional Express Rail
 Clause 5 in Report No. 14 of Committee of the Whole was adopted by the Council of The Regional Municipality of York at its meeting held on October 20, 2016 with the following additional recommendation:
FINAL. Sound Transit Long-Range Plan Update. Issue Paper S.1: Tacoma Link Integration with Central Link. Prepared for: Sound Transit
 Sound Transit Long-Range Plan Update Issue Paper S.1: Tacoma Link Integration with Central Link Prepared for: Sound Transit Prepared by: Quade & Douglas, Inc. FINAL March 2005 Foreword This issue paper
The Preferred Alternative: a Vision for Growth on the Northeast Corridor
 A Long-Term Vision is Needed The Preferred Alternative: a Vision for Growth on the Northeast Corridor The Federal Railroad Administration (FRA) has released the Tier 1 Final Environmental Impact Statement
RELEASED UNDER THE OFFICIAL INFORMATION ACT 1982
 Subject MINISTERIAL BRIEFING NOTE Rapid Transit in Auckland Date 1 November 2017 Briefing number BRI-1133 Contact(s) for telephone discussion (if required) Name Position Direct line Cell phone 1 st contact
2.4 TRANSIT VISION 2040 FROM VISION TO ACTION. Support the revitalization of urban cores STRATEGIC DIRECTION
 TRANSIT VISION 2040 FROM VISION TO ACTION TRANSIT VISION 2040 defines a future in which public transit maximizes its contribution to quality of life with benefits that support a vibrant and equitable society,
Mississauga Transit 2009 Budget
 Mississauga Transit 2009 Budget Budget Committee Presentation December 2, 2008 Revenue Ridership Forecasted 2008 Total Rides Including transfers 11% growth in the last 24 months Transit Service Area Business
Metrolinx: Transforming the Way We Move - A Network Wide Approach. Greg Percy, Chief Operating Officer November 1, 2016
 Metrolinx: Transforming the Way We Move - A Network Wide Approach Greg Percy, Chief Operating Officer November 1, 2016 2 Greater Toronto & Hamilton Area Total Population in the GTHA Total Population 2001-2041
Mississauga Bus Rapid Transit Preliminary Design Project
 Mississauga Bus Rapid Transit Preliminary Design Project PUBLIC INFORMATION CENTRE OCTOBER 2008 WELCOME The Mississauga Bus Rapid Transit (BRT) Project Thank you for attending this Public Information Centre.
UTA Transportation Equity Study and Staff Analysis. Board Workshop January 6, 2018
 UTA Transportation Equity Study and Staff Analysis Board Workshop January 6, 2018 1 Executive Summary UTA ranks DART 6 th out of top 20 Transit Agencies in the country for ridership. UTA Study confirms
Modernising the Great Western railway
 Report by the Comptroller and Auditor General Department for Transport and Network Rail Modernising the Great Western railway HC 781 SESSION 2016-17 9 NOVEMBER 2016 4 Key facts Modernising the Great Western
The Boston South Station HSIPR Expansion Project Cost-Benefit Analysis. High Speed Intercity Passenger Rail Technical Appendix
 The Boston South Station HSIPR Expansion Project Cost-Benefit Analysis High Speed Intercity Passenger Rail Technical Appendix Prepared by HDR August 5, 2010 The Boston South Station HSIPR Expansion Project
Yonge Relief Network Study: Technical Summary Final July Metrolinx
 Yonge Relief Network Study: Technical Summary Final July 2015 Metrolinx Prepared by: Prepared for: Yonge Relief Network Study: Technical Summary Steer Davies Gleave 1500-330 Bay St Toronto, ON, M5H 2S8
The Regional Transportation Plan PLAN BUILD OPERATE
 WHO IS METROLINX? Metrolinx was created in 2006 by the Province of Ontario as the first Regional Transportation Agency for the Greater Toronto and Hamilton Area (GTHA). The Regional Transportation Plan
Halifax Commuter Rail: A Fresh Concept
 Building Owners & Managers Association (BOMA) Nova Scotia PO Box 1597, Halifax NS B3J 2Y3 902-425-3717 info@bomanovascotia.com bomanovascotia.com Halifax Commuter Rail: A Fresh Concept The Green Interconnected
4 COSTS AND OPERATIONS
 4 COSTS AND OPERATIONS 4.1 INTRODUCTION This chapter summarizes the estimated capital and operations and maintenance (O&M) costs for the Modal and High-Speed Train (HST) Alternatives evaluated in this
A Transit Plan for the Future. Draft Network Plan
 A Transit Plan for the Future Draft Network Plan Project Overview and Status Completed Market Analysis and Service Evaluation. Developed Plan Framework and Guiding Principles. Developed a draft Five Year
Benchmarking, Planning, and Promoting Transit- Oriented Intensification in Rapid Transit Station Areas: Project Key Indicators March 2016
 Benchmarking, Planning, and Promoting Transit- Oriented Intensification in Rapid Transit Station Areas: Project Key Indicators March 2016 This project was produced by MITL with support from the Government
CREATING CONNECTIONS IN RICHMOND HILL
 CREATING CONNECTIONS IN RICHMOND HILL Mohamed Alkoka, Director, Corridor Infrastructure Metrolinx Anthony Irving, Manager, Community Relations Metrolinx May 15, 2017 1 GRIDLOCK COSTS OUR ECONONY Residents
CREATING CONNECTIONS IN THE TOWN OF NEWMARKET
 CREATING CONNECTIONS IN THE TOWN OF NEWMARKET NICK SPENSIERI, DIRECTOR, CORRIDOR INFRASTRUCTURE METROLINX ERIN MOROZ, DIRECTOR, COMMUNICATIONS AND COMMUNITY RELATIONS METROLINX APRIL 10, 2017 GRIDLOCK
TORONTO TRANSIT COMMISSION REPORT NO.
 Revised: March/13 TORONTO TRANSIT COMMISSION REPORT NO. MEETING DATE: SUBJECT: August 19, 2014 OPPORTUNITIES TO IMPROVE TRANSIT SERVICE IN TORONTO ACTION ITEM RECOMMENDATIONS It is recommended that the
3. SIGNALLING 3.1 INTRODUCTION. Present Operation - Facts and Figures
 3. SIGNALLING 3.1 INTRODUCTION Present Operation - Facts and Figures Trains on theyonge/university/spadina (Y/U/S) route of the TTC subway network are presently scheduled at a constant time interval (headway)
METROLINX REGIONAL TRANSIT NETWORK
 METROLINX REGIONAL TRANSIT NETWORK Background Paper to the Draft 2041 Regional Transportation Plan by IBI Group 2017 Draft Report Transportation Planning and Policy Work in Support of the Regional Transportation
Welcome to Open House #5 Scarborough Rapid Transit
 Welcome to Open House #5 Scarborough Rapid Transit Welcome to the Scarborough Rapid Transit (SRT) Conversion and Extension Study, including Kennedy Station improvements. Tonight s event provides details
Executive Summary. Treasure Valley High Capacity Transit Study Priority Corridor Phase 1 Alternatives Analysis October 13, 2009.
 Treasure Valley High Capacity Transit Study Priority Corridor Phase 1 Alternatives Analysis October 13, 2009 Background As the Treasure Valley continues to grow, high-quality transportation connections
EGLINTON CROSSTOWN LIGHT RAIL TRANSIT (LRT) PLEASE SIGN IN
 PLEASE SIGN IN") WELCOME TO OUR PUBLIC OPEN HOUSE EGLINTON CROSSTOWN LIGHT RAIL TRANSIT (LRT) Preliminary Planning for a Transit Project Assessment June 15, 17, 18, 23, 24 and 25, 2009 PLEASE SIGN IN Members of the Project
WELCOME TO OUR PUBLIC OPEN HOUSE EGLINTON CROSSTOWN LIGHT RAIL TRANSIT (LRT) Preliminary Planning for a Transit Project Assessment June 15, 17, 18, 23, 24 and 25, 2009 PLEASE SIGN IN Members of the Project
Sales and Use Transportation Tax Implementation Plan
 Sales and Use Transportation Tax Implementation Plan Transportation is more than just a way of getting from here to there. Reliable, safe transportation is necessary for commerce, economic development,
FREQUENTLY ASKED QUESTIONS
 FREQUENTLY ASKED QUESTIONS 2018 What is the More MARTA Atlanta program? The More MARTA Atlanta program is a collaborative partnership between MARTA and the City of Atlanta to develop and implement a program
Policy Note. Vanpools in the Puget Sound Region The case for expanding vanpool programs to move the most people for the least cost.
 Policy Note Vanpools in the Puget Sound Region The case for expanding vanpool programs to move the most people for the least cost Recommendations 1. Saturate vanpool market before expanding other intercity
Funding Scenario Descriptions & Performance
 Funding Scenario Descriptions & Performance These scenarios were developed based on direction set by the Task Force at previous meetings. They represent approaches for funding to further Task Force discussion
NEW HAVEN HARTFORD SPRINGFIELD RAIL PROGRAM
 NEW HAVEN HARTFORD SPRINGFIELD RAIL PROGRAM Hartford Rail Alternatives Analysis www.nhhsrail.com What Is This Study About? The Connecticut Department of Transportation (CTDOT) conducted an Alternatives
CPG is pleased to report the following accomplishments this quarter:
 MEMORANDUM To: From: Metrolinx Board of Directors Matthew Clark Chief Capital Officer (A), Capital Projects Group Date: February 7, 2019 Re: Capital Projects Group Quarterly Report Recommendation That
Scarborough Subway Extension. Stakeholder Advisory Meeting February 28, 2017
 Scarborough Subway Extension Stakeholder Advisory Meeting February 28, 2017 City Council Direction The Scarborough Subway Extension (SSE) project and budget were approved by City Council in 2013, prior
CEDAR AVENUE TRANSITWAY Implementation Plan Update
 CEDAR AVENUE TRANSITWAY Implementation Plan Update EECUTIVE SUMMARY DECEMBER 2015 Executive Summary In 2013, the Twin Cities metropolitan area s first bus rapid transit (BRT) line, the METRO Red Line,
Welcome. Green Line in Your Community
 Welcome Green Line in Your Community Today's session will provide you with information about Administration's recommendation for connecting the Green Line in the Beltline to Victoria Park and Inglewood/Ramsay
Yonge Subway Extension. driving progress in the GTA» more transit, stronger economy and cleaner environment
 Yonge Subway Extension driving progress in the GTA» more transit, stronger economy and cleaner environment message from the Chairman of the Board The continued success and competitiveness of our region
Metropolitan Council Budget Overview SFY
 Metropolitan Council Budget Overview SFY 2016-2017 H T t ti C itt House Transportation Committee February 4, 2015 Transit connects us to the places that matter Transportation Needs Grow as the Region Grows
Making Tracks to Torontonians 2012
 February 2012 Making Tracks to Torontonians 2012 An analysis of today s transit options for Toronto Transit in Toronto is at a standstill as Toronto city council once again debates transit plans. New options
BIRMINGHAM CONNECTED Anne Shaw Tuesday 20 January 2015
 BIRMINGHAM CONNECTED Anne Shaw Tuesday 20 January 2015 www.birmingham.gov.uk/connected Birmingham Connected Setting the context challenges in Birmingham The need for action The EU the SUMP process Strategy
Eglinton East LRT Project Update and Next Steps
 EX34.1 REPORT FOR ACTION Eglinton East LRT Project Update and Next Steps Date: May 7, 2018 To: Executive Committee From: Interim Deputy City Manager, Cluster B and Chief Planner and Executive Director,
STH 60 Northern Reliever Route Feasibility Study Report
 #233087 v3 STH 60 Northern Reliever Route Feasibility Study Report Washington County Public Works Committee Meeting September 28, 2016 1 STH 60 Northern Reliever Route Feasibility Study Hartford Area Development
EGLINTON CROSSTOWN LIGHT RAIL TRANSIT (LRT)
") WELCOME TO OUR PUBLIC OPEN HOUSE EGLINTON CROSSTOWN LIGHT RAIL TRANSIT (LRT) Preliminary Planning for a Transit Project Assessment Open House Martin Grove Road to Pearson International Airport September
WELCOME TO OUR PUBLIC OPEN HOUSE EGLINTON CROSSTOWN LIGHT RAIL TRANSIT (LRT) Preliminary Planning for a Transit Project Assessment Open House Martin Grove Road to Pearson International Airport September
Energy Technical Memorandum
 Southeast Extension Project Lincoln Station to RidgeGate Parkway Prepared for: Federal Transit Administration Prepared by: Denver Regional Transportation District May 2014 Table of Contents Page No. Chapter
5. OPPORTUNITIES AND NEXT STEPS
 5. OPPORTUNITIES AND NEXT STEPS When the METRO Green Line LRT begins operating in mid-2014, a strong emphasis will be placed on providing frequent connecting bus service with Green Line trains. Bus hours
Three ULTra Case Studies examples of the performance of the system in three different environments
 Three ULTra Case Studies examples of the performance of the system in three different environments airport application: London Heathrow : linking business and staff car parks through the access tunnel
Waterfront Transit Reset Phase 2 Study. Public Information & Consultation Meetings September 18 & 26, 2017
 Waterfront Transit Reset Phase 2 Study Public Information & Consultation Meetings September 18 & 26, 2017 2 Agenda 6:00 Open House 6:30 Agenda Review, Opening Remarks and Introductions 6:40 Study Overview
Needs and Community Characteristics
 Needs and Community Characteristics Anticipate Population and Job Growth in the City Strongest density of population and jobs in Ann Arbor are within the Study Area Population expected to grow 8.4% by
Strategic Plan
 2005-2015 Strategic Plan SUMMARY OF THE REVISED PLAN IN 2011 A decade focused on developing mass transit in the Outaouais A updated vision of mass transit in the region The STO is embracing the future
SCARBOROUGH RAPID TRANSIT ENVIRONMENTAL PROJECT REPORT CHAPTER 2 PROJECT DESCRIPTION. Project Description
 Project Description 2 PROJECT DESCRIPTION This chapter documents the extensive preliminary planning activities undertaken prior to the commencement of this Transit Project Assessment Process. Preliminary
Travel Time Savings Memorandum
 04-05-2018 TABLE OF CONTENTS 1 Background 3 Methodology 3 Inputs and Calculation 3 Assumptions 4 Light Rail Transit (LRT) Travel Times 5 Auto Travel Times 5 Bus Travel Times 6 Findings 7 Generalized Cost
Madison BRT Transit Corridor Study Proposed BRT Operations Plans
 Madison BRT Transit Corridor Study Proposed BRT Operations Plans This paper presents a description of the proposed BRT operations plan for use in the Madison BRT Transit Corridor Study. The objective is
Washington Metropolitan Area Transit Authority
 Executive Summary: Metrobus Network Evaluation and Future Fleet Needs Presented to: Washington Metropolitan Area Transit Authority Submitted by: In Association with P 2 D Joint Venture Introduction Metrobus
Car Sharing at a. with great results.
 Car Sharing at a Denver tweaks its parking system with great results. By Robert Ferrin L aunched earlier this year, Denver s car sharing program is a fee-based service that provides a shared vehicle fleet
Executive Summary October 2013
 Executive Summary October 2013 Table of Contents Introduction... 1 Rider Transit and Regional Connectivity... 1 Plan Overview... 2 Network Overview... 2 Outreach... 3 Rider Performance... 4 Findings...
Pedestrians, Cars, Buses and Trains? Considerations for Rapid Transit Service at Western University
 Pedestrians, Cars, Buses and Trains? Considerations for Rapid Transit Service at Western University Shift: The City of London s Rapid Transit Proposal Shift: The City of London s Rapid Transit Proposal
CREATING CONNECTIONS IN EAST GWILLIMBURY
 CREATING CONNECTIONS IN EAST GWILLIMBURY NICK SPENSIERI, DIRECTOR, CORRIDOR INFRASTRUCTURE METROLINX ERIN MOROZ, DIRECTOR, COMMUNICATIONS AND COMMUNITY RELATIONS METROLINX APRIL 4, 2017 Page 8 of 146 GRIDLOCK
Back ground Founded in 1887, and has expanded rapidly Altitude about 2500 meters above MSL Now among the ten largest cities in Sub Saharan Africa
 Back ground Founded in 1887, and has expanded rapidly Altitude about 2500 meters above MSL Now among the ten largest cities in Sub Saharan Africa Annual growth rate is 3.8% By 2020 population growth would
GTA West Corridor Planning and EA Study Stage 1
 GTA West Corridor Planning and EA Study Stage 1 Draft Development Strategy Presentation to Peel Goods Movement Task Force April 8 2011 Study Areas 2 Unique Approach Unprecedented two-stage EA process:
US 81 Bypass of Chickasha Environmental Assessment Public Meeting
 US 81 Bypass of Chickasha Environmental Assessment Public Meeting March 14, 2013 Introductions ODOT FHWA SAIC Meeting Purpose Present need for bypass Provide responses to 10/04/11 public meeting comments