I-15 Commuter Rail Feasibility Study
|
|
|
- Buck O’Brien’
- 6 years ago
- Views:
Transcription
1 Final Report I-15 Commuter Rail Feasibility Study Prepared for Riverside County Transportation Commission in association with Cambridge Systematics, Inc. Schiermeyer Consulting Services June 29, 2007

2 Interstate 15 Commuter Rail Feasibility Study Final Report Prepared for Riverside County Transportation Commission Prepared by Wilbur Smith Associates In association with Cambridge Systematics Schiermeyer Consulting Services June 29, 2007
3 I-15 Commuter Rail Feasibility Study ES-1 Executive Summary Background In 2005, the Riverside County Transportation Commission (RCTC) completed an evaluation of five potential commuter rail routes within Riverside County. That study, the RCTC Commuter Rail Feasibility Study, recommended that two of those five routes be examined in greater detail as possible candidates for future public investment. Those two routes are 1) an extension of the Perris Valley Line from South Perris at I-215 eastbound through Hemet to San Jacinto, and 2) an extension Perris Valley Line from South Perris at I-215 southbound along the I- 215 corridor to Temecula and Murrieta. In order to perform a follow-up study, Wilbur Smith Associates was retained to evaluate the potential of conventional commuter rail services on two other I-15 corridors. These are: Temecula North: between Temecula and points west (via Corona), including Los Angeles and Orange County work centers; and between Temecula and points east (via La Sierra), including Riverside and San Bernardino Temecula South: between Temecula and San Diego. The consultant also was asked to explore the potential of implementing a commuter rail level of service on the proposed California High-Speed Rail (HSR) system between Temecula and San Diego. Currently, the Bay Area Metropolitan Transportation Commission (MTC) is studying the ridership potential of a statewide High Speed Rail (HSR). The MTC effort is pursuant to the Program Environmental Impact Report / Environmental Impact Statement (EIR/EIS) developed for the California High-Speed Rail Authority (HSRA) in That report assessed the potential capital costs for building the HSR system, inclusive of a Los Angeles-Riverside-San Diego segment. The current ridership estimate assumes 49 daily trains between Los Angeles, Riverside and San Diego, with 108,000 daily passenger trips, including peak commute period trips, within Southern California 1. 1 A region defined here as the jurisdictions of the Southern California Association of Governments (SCAG) and the San Diego Association of Governments (SANDAG).
4 I-15 Commuter Rail Feasibility Study ES-2 Purpose of the Study The purpose of this study is to evaluate the potential of conventional commuter rail services on two corridors, one to the north of Temecula towards Corona along I-15 and the other to the south. Regarding the former, this study looks at various commuter rail alternatives operating between 1) Temecula and Los Angeles, 2) Temecula and Orange County work centers, and 3) Temecula and San Bernardino. Regarding the latter, the study explores the conventional commuter rail potential between Temecula and San Diego. The study s purpose of exploring the use of the HSR system for commuter trips between Temecula and San Diego changed during the course of the study. This was a result of a change in previous HSR assumptions, which currently call for a higher level of service in the Los Angeles-Riverside-San Diego segment. In all, 36 trains are planned for the peak periods. This means there would be 18 in the morning peak period, of which 9 trains would be southbound. Such a high service level obviated the need to explore using of HSR as a commuter option, as clearly it would be one if HSR were implemented as envisioned. Accordingly, the study shifted to explore the intraregional ridership of six peak period limited stop HSR round trips and two mid-day round trips stopping at a conceptual Poway station at SR 56, in addition to the planned HSR stations. Regarding the Poway station, the study s presumption at the outset was that many Temecula area commuters would use the station as a destination. The Wilbur Smith Associates team was supported by Cambridge Systematics and Schiermeyer Consulting Services. A Technical Advisory Committee (TAC) consisting of city staff and transportation and planning agencies, Native American tribal representatives and private developers provided input and feedback on study findings. Service Options The conventional commuter rail service options studied are identified in Figure 1. Temecula North At the outset, the study team considered three potential commuter rail options running north from Temecula. All options assumed 16 weekday trains: six AM peak northbound trains; six PM peak southbound trains; and four mid-day trains, two northbound and two southbound. Specific service cases included:
5 I-15 Commuter Rail Feasibility Study ES-3 Figure 1
6 I-15 Commuter Rail Feasibility Study ES-4 Case 1: half of trains operate between Temecula and Los Angeles, and the other half operate between Temecula and Laguna Niguel; this is known as the Base Case. On the Corona-Temecula extension, new stations would be at Temecula, Bundy Canyon Road, Nichols Road and Temescal Canyon Road. Case 2: all trains operate between Temecula and Laguna Niguel. New stations would be the same as in Case 1. Case 3: all trains operate between Temecula and Los Angeles. New stations would be the same as in Case 1. After subsequent consideration by the TAC and RCTC staff, five more service cases were added. These were: Case 4: half of trains operate between Temecula and Los Angeles, and the other half operate between Temecula and Laguna Niguel. One additional new station is assumed at the Dos Lagos development just south of Corona. Case 5: all trains operate between Temecula and Laguna Niguel. New stations would be the same as in Case 4, with Dos Lagos. Case 6: all trains operate between Temecula and Los Angeles. New stations would be the same as in Case 4, with Dos Lagos. Case 7: All trains operate between Temecula and San Bernardino. New stations would be the same as in Case 1, without Dos Lagos. Case 8: All trains operate between Temecula and San Bernardino. New stations would be the same as in Case 4, with Dos Lagos. Temecula South The team considered just one conventional commuter rail service case running south from Temecula with 16 trains weekdays between Temecula and downtown San Diego, with stops at Escondido, Poway at SR 56, Mira Mesa, Old Town and the San Diego Depot. Assumed were: six AM peak southbound trains, six PM peak northbound trains; and four mid-day trains, two southbound and two northbound. The evaluation of the Poway HSR station also assumed 16 HSR trains stopping there in 2030: six AM peak southbound trains, six PM peak northbound trains; and four mid-day trains, two southbound and two northbound. Train frequencies for the study routes are shown in Table 1.
7 I-15 Commuter Rail Feasibility Study ES-5 Table 1 Train Frequencies on Study Routes Northbound Southbound Temecula North Commuter Rail AM Peak 6 PM Peak 6 Mid-day 2 2 Temecula South Commuter Rail AM Peak 6 PM Peak 6 Mid-day 2 2 Temecula South Limited Stop HSR AM Peak 6 PM Peak 6 Mid-day 2 2 Ridership Forecasts The first step in the analysis was to forecast the Year 2030 ridership for the eight conventional commuter rail service cases running north from Temecula, the one conventional commuter rail service case running south from Temecula, and the HSR limited stop service case with a stop at Poway. The forecasts for the conventional commuter rail options north and south of Temecula and for the limited stop HSR service were done using different methodologies, as explained below. Temecula North The forecast of the first eight cases used the same methodology employed in the 2005 RCTC Commuter Rail Feasibility Study 2. The intent was to develop ridership forecasts that can be compared apples-to-apples with the forecasts of the conventional commuter rail services evaluated in the 2005 study. The forecasting methodology reflects the assumption that people are drawn to commuter rail if they must make longer trips, especially if there are frequent trains available to encourage and support convenient trip-making. In other words, the longer the trip and the more frequent the headways, the more riders find commuter rail an attractive option. 2 The methodology used was developed originally to support the 2004 Commuter Rail Strategic Assessment commissioned by the Orange County Transportation Authority (OCTA) and refined during the subsequent 2007 Metrolink Commuter Rail Strategic Assessment. Commuter rail ridership forecasts in both studies were based on estimates of the commuter market share or mode split which commuter rail reasonably could be expected to achieve, assuming various levels of train frequency, travel distance and congestion on parallel road systems.
8 I-15 Commuter Rail Feasibility Study ES-6 Table 2 shows the peak period and all-day forecasts of 2030 passenger trips generated at the proposed extension stations. The extension trains would generate additional ridership between existing Metrolink stations as a result of the additional frequencies they provide. Table 2 Temecula North Commuter Rail Ridership Forecast in 2030 Temecula North Case Service Stations A.M Peak All-day 1 Split Service (Base Case) All Temecula Trains to Los Angeles ,052 3 All Temecula Trains to Laguna Niguel ,099 4 Split service (Base Case) ,037 5 All Temecula Trains to Los Angeles 5 1,003 1,104 6 All Temecula Trains to Laguna Niguel 5 1,047 1,152 7 All Temecula Trains to San Bernardino 4 1,003 1,104 8 All Temecula Trains to San Bernardino 5 1,059 1,165 Notes: Split service assumes trains originating in Temecula are destined for both Los Angeles and Laguna Niguel. Los Angeles trains carry riders transferring to IEOC Line trains at Corona. Laguna Niguel trains carry riders transferring to 91 Line trains at Corona. San Bernardino trains carry riders transferring to IEOC and 91 Line trains at La Sierra. Cases 4-6 and 8 assume an additional station at Dos Lagos. At this level of specificity, the differences in ridership among the service cases are small to the point of not being statistically significant. Temecula South For a forecast of 2030 weekday passenger trips generated by a conventional commuter rail service operating between Temecula and San Diego, the study team used a statewide ridership and revenue forecasting model developed for the California High-Speed Rail Authority and the Metropolitan Transportation Commission. This statewide model was developed to support evaluation of highspeed rail alternatives in the State of California. It is a fully multimodal model capable of forecasting air, commuter rail and highway alternatives as well as high-speed rail. Table 3 below shows the forecasts of weekday boardings by station in 2030.
9 I-15 Commuter Rail Feasibility Study ES-7 Table 3 Temecula-South Commuter Rail Weekday Boardings in 2030 Temecula at I-15/I Escondido 220 Poway at SR Mira Mesa 210 Old Town 548 San Diego 860 Total 3,090 High-Speed Rail and a Poway Station The team also used the aforementioned HSR model to forecast the ridership of a limited stop HSR service between Temecula and San Diego. Just considering the ridership generated by the 16 limited stop HSR peak and mid-day trains at the study area stations, the forecast in Table 4 shows that the Poway station would have 242 average weekday boardings in The majority of these trips would be made by high-speed rail riders who would be using a different station, if the Poway station did not exist. Thus, there is no significant increase in total riders with the inclusion of the Poway station. This is likely because high-speed rail serves longer distance trips more effectively, so the system does not need to have as many stations to be effective in serving these longer distance trips. Table 4 Temecula-South HSR Weekday Boardings In 2030, with a Poway Station Temecula 1,297 Escondido 411 Poway 242 University City 340 San Diego 1,515 Total 3,805 The forecast found that a Poway station would not be a major destination for Temecula area commuters. Only 127 Temecula boardings would alight weekdays at Poway in It is important to note as well that a Poway station would serve a larger market than just trips to those stations cited in Table 4, as the limited stop trains would also stop at other HSR stations in Southern, Central and Northern California. Accordingly, it appears that a Poway station would generate about 4,000 boardings and alightings, or passenger trips, per weekday in 2030, most of which would have occurred at other stations if the Poway station was not built.
10 I-15 Commuter Rail Feasibility Study ES-8 Capital Costs Temecula North With potential ridership ranges identified by service case in Table 2, the study team began its analysis of more specific alternative routes and conceptual capital costs for the purpose of a comparative evaluation to identify the most cost effective options. These included two alternatives to limit the southward Temecula extension to Lake Elsinore in order to shorten line construction and thus minimize costs. Also the capital cost alternatives explore the potential of connecting to the I-15 right-of-way at different locations. Furthermore, the alternatives oriented to the west assume Base Case operations: with half of trains operating to Los Angeles and the other half operating to Laguna Niguel. Thus, the alternatives discussed below represent a subset of the eight ridership service cases and explore different approaches to travel along the same general corridor, including various station options. Capital costs at a conceptual level were developed for seven separate alternatives for commuter rail operations on Temecula-Corona Corridor. The costs are discussed below. The estimates reflect factors unique to each alternative. The alternatives considered are: Alternative A From the junction with the BNSF Transcon at Porphyry Wye just east of the North Main Corona Metrolink Station, this alternative is 35.3 miles long and runs the length of the corridor to Temecula. From north to south, the route would make use of the right-of-way of the former Atchison Topeka and Santa Fe Railway (Santa Fe) branch line as far as the Alberhill residential development south of Lake Street in Lake Elsinore. It would then use a new right-of-way east of the development to reach Nichols Road, before entering the I-15 right-of-way for its southward run to Temecula. The four new stations for this alternative would be at Temescal Canyon Road just east of the I-15 overcrossing, Nichols Road, Bundy Canyon Road and Temecula/Murrieta. Corona would serve as a transfer station for riders not carried directly to destinations by trains from Temecula. The ridership service case associated with this alternative is Case 1. Alternative B - This alternative is much the same as Alternative A. The major difference is that the rail alignment would enter the I-15 right-ofway at Lake Street, about three miles north on I-15 from Nichols Road. The length of the alignment and the stations would be the same. Alternative C At 15.7 miles, this is a short alternative, with a southern terminus at Lake Street. There would be just two stations one at Temescal Canyon Road and the other at Lake Street; riders from points farther south in the I-15 corridor could board trains at Lake Street.
11 I-15 Commuter Rail Feasibility Study ES-9 Alternative C would also be a less complicated alternative to build, since it would make use of what is left of the original Santa Fe right-of-way. This alternative would have much of the same ridership as Alternative A, except that the trips between the two southern most stations would be lost, as those stations would not be included in this shorter alternative. The ridership for this alternative was derived from Case 1. Alternative C1 This alternative is the same as Alternative C, with the addition of another new station at Dos Lagos. The additional station would result in a small increase in ridership versus to Alternative C. The ridership for this alternative was derived from Case 4. Alternative D This alternative is the same as Alternative A, with the addition of another new station at Dos Lagos. The ridership service case associated with this alternative is Case 4. Alternative E This alternative assumed that all six trains depart Temecula in the morning peak and terminate in San Bernardino, rather than in Los Angeles, Laguna Niguel, or both. Thus, it assumed the reestablishment of the east leg of the Porphyry Wye, connecting the existing BNSF branch line with the Transcon, and the relocation of railcar storage tracks which lie across where the east leg used to be. The alternative runs 35.3 miles. La Sierra would serve as a transfer station for riders not carried directly to destinations by trains from Temecula. The ridership service case associated with this alternative is Case 7. Alternative F This alternative is like Alternative E, with another new station at Dos Lagos. The ridership service case associated with this alternative is Case 8. A summary of the conceptual cost estimates for all seven alternatives appears in Table 5 on the following page. Most unit costs used to calculate total category costs were the same as assumed for the 2005 RCTC Commuter Rail Feasibility Study. Costs for items that were assumed here but were not part of the 2005 analysis were developed separately. Cost Summaries and Short Listing the Alternatives Total conceptual capital cost estimates, including such soft costs as engineering and construction management as well as contingencies, were in a wide range. The high side is represented by Alternative B, which assumed the greater use of the I-15 right-of-way, from Lake Street to I-15/I-215 in Temecula/Murrieta. The low side is represented by Alternative C, with a terminus near Lake Elsinore. The five longer alternatives (A. B, D. E and F) essentially cover the same area. They differ from each other in minor ways. Of the five, Alternative A was selected for further evaluation in this study, as it showed to be potentially the least expensive to implement. Alternative C and Alternative C1 also were
12 I-15 Commuter Rail Feasibility Study ES-10 retained, as these appeared to be the simplest and easiest to construct, while still providing a viable option to potential riders throughout the corridor. Table 5 Temecula Extension Total Conceputal Capital Costs - $ in Millions (includes engineering and contingencies) Alternative and Length from BNSF Transcon (miles) A B C C1 D E F Cost Element (35.3) (35.3) (15.7) (15.7) (35.3) (35.3) (35.3) Track Turnouts At grade, highway rail crossings Structures Drainage Stations Signals Earthwork Right-of-way Specialty tems Estimated Construction Costs EMDCM* (15% of Construction) Subtotal Contingenies (30% of Constr.) Total Estimated Costs** Equipment Total Estimated Capital Costs Alternative A B C C1 D E F Description Corona-Temecula, entering I-15 at Nichols Road at Lake Elsinore Corona-Temecula, entering I-15 at Lake Street at Lake Elsinore Corona-Lake Street at Lake Elsinore Corona-Lake Street at Lake Elsinore with additional station at Dos Lagos Same as A, with additional station at Dos Lagos San Bernardino-Temecula, entering I-15 at Nichols Road at Lake Elsinore Same as E, with additional station at Dos Lagos Notes: * EMDCM = Engineering/Mobilization/Demobilization/Construction Management ** Includes EMDCM and Contingencies Subtotals reflect rounding which may cause some variance Temecula South Alternative G assumes conventional commuter rail operations between Temecula and downtown San Diego. As with the other alternatives, this assumes 16 trains: six AM peak period southbound trains, the reverse in the evening peak, and two mid-day round trips. This alternative is 66 miles long. As this alternative follows the proposed HSR alignment, the study team followed as closely as possible the costing methodology adopted for the Capital and Operations and Maintenance Costs report for the California High-Speed Rail Authority (June 2004). A summary of estimated capital costs for Alternative G appear in Table 6 below in a format which tracks the format used in the earlier HSR capital cost estimate.
13 I-15 Commuter Rail Feasibility Study ES-11 Table 6 Temecula South HSR Total Conceptual Costs - $ in Millions (Includes engineering and contingencies) Alternative G (66 Miles) Cost Element Cost Track 49.5 Earthwork and Related Items 19.2 Structures/Tunnels/Walls Grade Separations 27.5 Building Items (Stations) 44.0 Rail and Utility Relocation 18.1 Right-of-Way (ROW) Environmental Mitigation 27.9 Signals and Communication 61.6 Vehicle Costs 94.8 Support Facility Costs 20.0 Program Implementation Costs (15% of Construction) Contingencies (30% of Construction) Total Construction Costs Construction, ROW, Enviro. Mitigation, Vehicle Costs 1,189.4 Constr., ROW, Enviro, Vehicles, Prg. Impl., Contingencies 1,646.5 High-Speed Rail and a Poway Station The only capital cost assumed for this option is the cost of an additional station at Poway. This is because such a station is not included in the current system plans of the HSRA. As noted, an initial presumption of this study was that many Temecula area commuters would use a Poway station as a destination. The 2004 Capital and Operations and Maintenance Costs report cited a cost for a March Air Force Base (AFB) station at $27 million, plus another $2 million for surface parking. Including contingencies and soft costs for design and implementation, a total cost for the March AFB station would be about $43 million. Ample undeveloped land would facilitate construction of a HSR station there. As undeveloped land appears to exist in the vicinity of I-15 and SR 56, where a Poway station could be located, a similar cost figure would seem a reasonable amount to assume for a Poway station. Although a Poway HSR station could generate about 4,000 boardings and alighting per day in 2030, the ridership forecast showed that the majority of trips generated by a Poway station would be made by HSR riders who would be using a different station, if the Poway station did not exist. Since this station would not
14 I-15 Commuter Rail Feasibility Study ES-12 address any major commuter demand from Temecula, further examination of a Poway HSR station does not appear merited at this time. Evaluation The 2005 commuter rail study utilized nine criteria to evaluate five commuter rail service options. The same evaluation criteria are used for this study, so as to produce an apples-to-apples comparison of the options. Alternatives A, C, C1 and G are evaluated per the nine criteria, which are shown in Table 7 on the following page. In the table, the feasibility of an alternative per a specific criterion is summarily assessed with a Harvey Ball. That is, the fuller the Harvey Ball, the more feasible the performance. For comparison, the evaluation results of the 2005 commuter rail study are shown in Table 8, with Scenarios 3 and 7 being the two that were recommended for further study. Eight of the evaluation criteria were quantitative, that is, a numerical result could be determined for each alternative per each criterion. One was qualitative, meaning that the evaluation of the alternatives per this criterion were subjective, this is, based on the professional judgment of the consulting team. The criteria are described below. For this evaluation, Alternatives A, C and C1 assume extension trains running to both Los Angeles and Laguna Niguel, as was assumed in the ridership Service Case 1 (the Base Case). Daily Passenger Trips in 2030: this is a measure of the ridership generated by the commuter rail services. The purpose of public transit is to attract riders. Therefore, options that generate more riders score better by this measure. Alternative G is clearly superior in this regard. Daily Passenger Trips per Train in 2030: this is a measure of capacity utilization. Options which put more riders on trains score better on this measure than those that put less. Again, Alternative G is clearly superior by this measure.
15 I-15 Commuter Rail Feasibility Study ES-13 Table 7 Screening and Application of Evaluation Criteria-Commuter Service Scenario Corridor /Service Type/ End Point Route Miles* Passenger Trips In 2030 (Daily) Passenger Trips Per Train (Daily) Fare Box Recovery Ratio** Rightof- Way Issues Mobility Improvements- Daily Trip Time Savings Access to Low Income Households (Percent) Operating Costs per Passenger- Mile ($) Capital Costs: Track, Stations & Equipment ($ millions) Capital Costs Per Passenger ($) A Interstate % 456 hours 28.03% $0.54 $569.3 $575,632 /Commuter/ Temecula Frequency-16 Trains Daily C Interstate % 409 hours 28.38% $0.30 $250.1 $286,156 /Commuter/ Lake Elsinore C1 Interstate 15 /Commuter/ % 376 hours 28.20% $0.30 $261.7 $284,148 Lake Elsinore w/ Dos Lagos Station G Interstate , % 146 hours 42.05% $0.34 $1,646.5 $532,834 /Commuter/ San Diego Table Key Feasible Moderately Feasible Less Feasible * Incremental route miles east or south of North Main Corona. ** Similar to a cost-benefit ratio, this criterion measures the percentage of estimated operating costs recoverd through estimated fare box revenues. Source: Wilbur Smith Associates and WRCOG data and calculations.
16 I-15 Commuter Rail Feasibility Study ES-14 Scenario Corridor /Service Type/ End Point Route Miles* Passenger Trips In 2030 (Daily) Passenger Trips Per Train (Daily) Farebox Recovery Ratio** Rightof- Way Issues Mobility Improvements- Daily Trip Time Savings Access to Low Income Households (Percent) Operating Costs per Passenger- Mile ($) Capital Costs: Track, Stations & Equipment ($ millions) Capital Costs Per Passenger ($) 1. Union Pacific Railroad % 176 hours 43.96% $0.68 $299.9 $390,495 /Commuter/ Banning-Beaumont Commuter Frequency-16 Trains Daily Table 8 RCTC Commuter Rail Feasibility Study Screening and Application of Evaluation Criteria-Commuter Service 2. Union Pacific Railroad , % 124 hours 42.96% $0.63 $544.4 $250,414 /Commuter/ Indio 3. Perris Valley Line , % 518 hours 44.32% $0.24 $111.5 $83,333 /Commuter/ San Jacinto 5. Winchester Road , % 486 hours 37.76% $0.25 $203.6 $157,585 /Commuter/ Temecula 7. I , % 932 hours 37.23% $0.12 $249.4 $115,143 /Commuter/ Temecula Table Key Feasible Moderately Feasible Less Feasible * Incremental route miles east or south of South Perris, assuming Metrolink's 91 Line service is extended to South Perris. ** Similar to a cost-benefit ratio, this criterion measures the percentage of estimated, incrememtal operating costs recoverd through estimated, incremental farebox revenues. Source: RLBA, WSA and WRCOG data and calculations.
17 I-15 Commuter Rail Feasibility Study ES-15 Fare Box Recovery Ratio: this is a measure of the proportion of operating costs covered by fare revenue 3. This is a traditional measure of cost effectiveness used by transit services. Just for the options that are part of the Metrolink system (A, C and C1), only the operating costs of running north to North Main Corona are counted for this calculation. The calculation for Alternative G is the traditional fare box recovery calculation: total revenues are divided by total operating costs. Even so, its performance is superior to those of Alternatives A, C and C1, which consider only partial operating costs. The result is due to more riders, who in sum generate more revenue and thus cover more operating costs. Right-of-Way Issue: this is the sole qualitative criterion, meant to capture the degree of difficulty for RCTC to implement passenger rail service in the study corridors or to gain access in existing rights-of-way. All four alternatives face major implementation and access issues. For example, A, C and C1 presuppose acquisition of the former Santa Fe right-of-way between Lake Elsinore and south Corona (inclusive of a portion now covered by a golf course) as well as access to the BNSF. Alternatives A and G assume access to the I-15 right-of-way for rail service. Thus, all alternatives appear equal by this measure. Mobility Improvements Daily Trip Time Savings: this is the measure of time saved by traveling on trains versus driving on area highways, most of which will be plagued with peak period congestion in Travel time is calculated on a daily (weekday) basis. Minutes saved between points are multiplied by the ridership between the same points, generating total daily savings in In this regard, the Temecula North alternatives generate more than twice the hours saved as does the Temecula South alternative. Of the Temecula North options, Alternative A scores the best, a result of carrying more riders farther. Mobility Improvements Access to Low Income Households: this is measured by reference to income levels of residents located in catchment areas within five miles of proposed stations. Here Alternative G, the Temecula South option, scores best. Operating Cost per Passenger-Mile: this criterion captures the estimated operating cost required to carry a passenger one mile. However, for the Temecula North options (Alternatives A, C and C1), operating costs only include the cost of operating north to Corona. On the other hand, passenger-miles for these options are calculated from origin to ultimate destination, which for the most part are west or east of Corona. This is a different calculation than for Alternative G, wherein total operating costs (a much bigger number) are divided by total 3 Operating costs were estimated by multiplying train-miles by the $41.31 per train-mile figure used in the 2005 commuter rail study. The cost figure was developed by Metrolink. Revenues were estimate by multiplying Metrolink-like fares by passenger-miles, just as was done in the 2005 study. This study assumes that operating costs and revenues will grow at the same rate.
18 I-15 Commuter Rail Feasibility Study ES-16 passenger-miles. Just comparing the Temecula North options, Alternatives C and C1 do better. This is because their operating costs are less than half that of Alternative A, while passenger-miles of all three alternative are nearly the same. Capital Costs: these are the absolute costs of implementing the alternatives. For this evaluation, Alternatives C and C1 are superior, a result of shorter line construction. Capital Costs per Passenger: this is total capital costs divided by daily (weekday) one-way passenger trips. Alternatives C and C1 are superior, a result of ridership nearly the same as Alternative A but with less than half the implementation cost. Summary Conventional Commuter Rail Alternatives Alternative A, with service from Temecula north through Corona, has the best trip time savings. It also has the second highest price tag, the highest capital cost per passenger, and the lowest fare box recovery. With a shorter extension from Lake Elsinore north, Alternative C has almost as much ridership and trip time savings, less than half the implementation costs and cost per passenger, and almost twice the fare box recovery compared to Alternative A. Alternative C1, with service from Lake Elsinore and an additional station at Dos Lagos, has a few more passenger trips but scores essentially the same as Alternative C. Alternative G, with commuter rail service from Temecula to San Diego, does the best in terms of passenger trips, passenger trips per train, fare box recovery, access for low income households, and operating costs per passenger-mile. However, its implementation cost is three times that of the next highest, Alternative A. While Alternatives C and C1 score well on a number of criteria, these alternatives on balance are somewhat inferior to the two commuter rail routes recommended for further analysis in the 2005 RCTC Commuter Rail Feasibility Study. Accordingly, unless implementation costs could be reduced, this study recommends that these two alternatives do not progress toward further analysis. Also because of their high implementation costs, Alternatives A and G are not recommended for further analysis at this time. As demographics and population trends change for specific areas, the feasibility of these routes could be reevaluated in the future.
19 I-15 Commuter Rail Feasibility Study ES-17 Public Private Partnership It is worth noting that RCTC has been approached by local developers to explore the potential of public private partnerships concerning new commuter rail services on the I-15 corridor. A concept to lower overall capital costs for Alternatives C and C1 (Lake Elsinore options) would be potential public-private partnerships, where private developers help fund or donate right-of-way and contribute to the overall capital costs. One such concept could reduce implementation costs for Alternative C1 by $113.2 million assuming that developers provide or fund the right-of-way requirements, the stations, and contribute $50 million to rolling stock requirements. This approach would make the service more cost efficient and could increase the viability of the project.
20 I-15 Commuter Rail Feasibility Study Table of Contents Chapter 1: Study Purpose Background Purpose of the Study Methodology Evaluation Agencies and Other Entities Consulted Study Team and Term Chapter 2: Ridership Forecast Temecula-Corona Corridor Commuter Rail Temecula-San Diego Corridor Commuter Rail Temecula-San Diego Corridor High-Speed Rail Chapter 3: Capital and Operating Costs Temecula-Corona Corridor Commuter Rail Temecula-San Diego Corridor Commuter Rail Temecula-San Diego Corridor High-Speed Rail Chapter 4: Evaluation of Commuter Rail Scenarios Evaluation Summary of Commuter Rail Alternatives High-Speed Rail and a Poway Station
21 I-15 Commuter Rail Feasibility Study Appendix Appendix A: Ridership Forecasts 2030 Appendix B: Capital Cost Estimates Appendix C: Maps, Access for Low Income Housing Tables Table 1-1: Train Frequencies on Study Routes Table 2-1: Commuter Rail Work Trip Mode Splits Table 2-2: Passenger Rail Ridership Forecast in Table 2-3: Temecula-San Diego Commuter Rail Weekday Boardings Table 2-4: Temecula-San Diego High-Speed Rail Weekday Boardings w/a Poway Station 2-10 Table 3-1: Temecula Extension Total Conceptual Capital Costs Table 3-2: Alternative C1 Costs Assuming Public Private Partnership Contributions Table 3-3: Temecula-Corona Estimated Annual O&M Costs Table 3-4: Temecula-San Diego Total Conceptual Costs Table 3-5: Temecula-San Diego Estimated Annual O&M Costs Table 4-1: Screening and Application of Evaluation Criteria-Commuter Service Table 4-2: RCTC Commuter Rail Feasibility Study Screening and Application of Evaluation Criteria-Commuter Service Table 4-3: Low Income Household Analysis Table 4-4: Alternative C1 Costs Assuming Public Private Partnership Contributions Figures Figure 1-1: Study Routes Figure 3-1: Alternative A: Temecula Extension Access to I-15 ROW Figure 3-2: Alternative C1: Lake Elsinore Extension Southern Terminus Figure 3-3: Alternative E: Temecula Extension Connection to San Bernardino Figure 3-4: Alternative G: Temecula-San Diego Commuter Rail Route - Northern Figure 3-5: Alternative G: Temecula-San Diego Commuter Rail Route - Southern
22 I-15 Commuter Rail Feasibility Study 1-1 Chapter 1: Study Purpose Background In 2005, the Riverside County Transportation Commission (RCTC) completed an evaluation of five potential commuter rail routes within Riverside County. That study, the RCTC Commuter Rail Feasibility Study, recommended that two of those five routes be examined in greater detail as possible candidates for future public investment. Those two routes are 1) an extension of the Perris Valley Line from South Perris at I-215 eastbound through Hemet to San Jacinto, and 2) an extension Perris Valley Line from South Perris at I-215 southbound along the I- 215 corridor to Temecula and Murrieta. In order to perform a follow-up study, Wilbur Smith Associates was retained to evaluate the potential of conventional commuter rail services on two other I-15 corridors. These are: Temecula North: between Temecula and points west (via Corona), including Los Angeles and Orange County work centers; and between Temecula and points east (via La Sierra), including Riverside and San Bernardino Temecula South: between Temecula and San Diego. The consultant also was asked to explore the potential of implementing a commuter rail level of service on the proposed California High-Speed Rail (HSR) system between Temecula and San Diego. Currently, the Bay Area Metropolitan Transportation Commission (MTC) is studying the ridership potential of a statewide High Speed Rail (HSR). The MTC effort is pursuant to the Program Environmental Impact Report / Environmental Impact Statement (EIR/EIS) developed for the California High-Speed Rail Authority (HSRA) in That report assessed the potential capital costs for building the HSR system, inclusive of a Los Angeles-Riverside-San Diego segment. The current ridership estimate assumes 49 daily trains between Los Angeles, Riverside and San Diego, with 108,000 daily passenger trips, including peak commute period trips, within Southern California 1. 1 A region defined here as the jurisdictions of the Southern California Association of Governments (SCAG) and the San Diego Association of Governments (SANDAG).
23 I-15 Commuter Rail Feasibility Study 1-2 Purpose of the Study The purpose of this study is to evaluate the potential of conventional commuter rail services on two corridors, one to the north of Temecula towards Corona along I-15 and the other to the south. Regarding the former, this study looks at various commuter rail alternatives operating between 1) Temecula and Los Angeles, 2) Temecula and Orange County work centers, and 3) Temecula and San Bernardino. Regarding the latter, the study explores the conventional commuter rail potential between Temecula and San Diego. The conventional commuter rail service options studied are identified on the following page in Figure 1-1. The underlying assumption of a southern conventional commuter rail option from Temecula to San Diego was that the HSR system, which would follow the same route, would not be constructed. In its stead, a conventional service, on the same alignment, would be implemented. The study s purpose of exploring the use of the HSR system for commuter trips between Temecula and San Diego changed during the course of the study. This was a result of a change in previous HSR assumptions, which currently call for a higher level of service in the Los Angeles, Riverside, San Diego segment. In all, 36 trains are planned for the peak periods. This means there would be 18 in the morning peak period, of which 9 trains would be southbound. Such a high service level obviated the need to explore using of HSR as a commuter option, as clearly it would be one if HSR were implemented as envisioned. Accordingly, the study shifted to explore the intraregional ridership of six peak period limited stop HSR round trips and two mid-day round trips stopping at a conceptual Poway station at SR 56, in addition to the planned HSR stations. Regarding the Poway station, the study s presumption at the outset was that many Temecula area commuters would use the station as a destination. The assumed train frequencies on the study routes appears in Table 1-1. Table 1-1 Train Frequencies on Study Routes Northbound Southbound Temecula North Commuter Rail AM Peak 6 PM Peak 6 Mid-day 2 2 Temecula South Commuter Rail AM Peak 6 PM Peak 6 Mid-day 2 2 Temecula South Limited Stop HSR AM Peak 6 PM Peak 6 Mid-day 2 2
24 I-15 Commuter Rail Feasibility Study 1-3 Figure 1-1
25 I-15 Commuter Rail Feasibility Study 1-4 Methodology The evaluation of commuter rail options required the development of forecasts of ridership, revenue and costs, as well as assessment of potential mobility improvements and institutional issues. The planning year for the study is The five commuter rail route options in the 2005 RCTC study were analyzed with these same factors as prime elements. With the same methodologies employed for this current study, the results will be comparable in terms of setting priorities for further consideration of Riverside County commuter rail service. Apart from the evaluation of conventional commuter rail options running north and south from Temecula, this study assumes HSR operations in 2030 between Los Angeles, Riverside and San Diego. In this regard, the study sought only to identify 1) the potential of a Poway / Rancho Bernardo station (at the confluence of I-15 and SR 56) added to the proposed HSR system between Temecula and San Diego, and 2) the cost of a Poway station. A Poway station is not included in the 2004 HSR Program EIS/EIR. A forecast of HSR commuter ridership was performed using the MTC HSR travel demand model, developed for the California HSR Program. The Poway station cost estimate was based on capital cost estimates developed for the 2004 HSR Program EIR/EIS. Evaluation With the above inputs identified for the commuter rail options, the study team proceeded to evaluate the options in terms of the criteria established for the 2005 RCTC commuter rail study. These criteria, cited for each option, are: Weekday one-way passenger trips in 2030 (ridership) Passenger trips per train Fare box recovery (the percentage of operating costs covered by fare revenues) Freight and/or passenger rail right-of-way access issues Weekday trip time savings of traveling by train versus auto Access to low income households Operating costs per passenger-mile (one passenger riding one mile generates one passenger mile) Total capital costs (construction costs plus contingencies, design costs, and rolling stock)
26 I-15 Commuter Rail Feasibility Study 1-5 Capital costs per weekday one-way passenger With these criteria identified, the commuter rail options in this study can be compared with the results of the commuter rail options studied in Agencies and other Entities Consulted A Technical Advisory Committee (TAC) oversaw the progress of the study and offered input in meetings held in Temecula in October of 2006, and in January and June of The study team also briefed staff of the City of Lake Elsinore on the study in March, TAC member agencies include: San Diego Association of Governments (SANDAG) Western Riverside Council of Governments (WRCOG) Riverside Transit Agency (RTA) Southern California Association of Governments (SCAG) Southern California Regional Rail Authority (SCRRA), operator of the Metrolink commuter rail system The City of Corona The City of Escondido The City of Temecula The City of Lake Elsinore Riverside County Transportation Commission (RCTC) SE Corporation The Pechanga Band of Luiseño Indians Study Team and Term The study team consisted of representatives of Wilbur Smith Associates, Cambridge Systematics, Schiermeyer Consulting Services, WRCOG and RCTC. The team members performed the assignment between the fall of 2006 and the summer of 2007.
27 I-15 Commuter Rail Feasibility Study 2-1 Chapter 2: Ridership Forecast The purpose of this chapter is two-fold. One is to explain the different ridership methodologies used in the rail corridors studied Temecula-Corona and Temecula-San Diego. The other is to present the ridership forecasts associated with the services considered for each corridor. All commuter rail forecasts assumed six peak-period trains in the peak direction in the morning and an identical volume and pattern of trains in the reverse direction in the afternoon, along with two mid-day trains in each direction, for a total of 16 weekday trips. Typical ridership includes office workers employed in work centers near destination stations accessible by walking, transit, employer shuttles and station cars. This analysis considered two conventional commuter rail options. One is on the Temecula-Corona Corridor. This option assumes the following: The rebuilding of an existing BNSF spur line from the Porphyry Wye 1.3 miles east of North Main Corona Metrolink station about three miles, where it terminates in a quarry. The former Atchison Topeka and Santa Fe Railway (ATSF) branch line, which extended from the quarry another 15.5 miles to the vicinity of Nichols Road near Lake Elsinore. A new rail route on the I-15 right-of-way between Nichols Road and I-215 in the Temecula/Murrieta area. Stations at Temescal Canyon, Nichols Road, Bundy Canyon Road, and Temecula I-15 / I-215. Sixteen weekday one-way trips from and to Temecula, using conventional Metrolink train sets. A variation of the above was evaluated with an additional station at or near the Dos Lagos development, south of Corona but north of the Temescal Canyon station. The other corridor is between Temecula and San Diego. Typical riders would include office workers heading to work centers in or near downtown San Diego, including the University of California San Diego in University City. This option assumed: A new rail route between 1-15 / I-215 along the I-15 corridor between Temecula and Mira Mesa, generally following the alignment of the proposed HSR system. A new right-of-way through Carroll Canyon between Mira Mesa and the LOSSAN Corridor at Miramar Road.
28 I-15 Commuter Rail Feasibility Study 2-2 Stations at I-15 / 215, Escondido, Poway at SR 56, Mira Mesa (stop for UCSD), Old Town, and the historic San Diego Depot. Sixteen one-way trips each weekday, using conventional Metrolink (and Coaster) commuter train equipment. The analysis also considered the impact on ridership of a Poway / Rancho Bernardo station stop along the proposed California High Speed Rail route between Temecula and San Diego. Temecula-Corona Corridor Commuter Rail Service Cases Tested At the outset, the study team considered three potential commuter rail options running north from Temecula. All options assumed 16 weekday trains: six AM peak northbound trains; six PM peak southbound trains; and four mid-day trains, two northbound and two southbound. Specific service cases included: Case 1: half of trains operate between Temecula and Los Angeles, and the other half operate between Temecula and Laguna Niguel; this is known as the Base Case. On the Corona-Temecula extension, new stations would be at Temecula, Bundy Canyon Road, Nichols Road and Temescal Canyon Road. Case 2: all trains operate between Temecula and Laguna Niguel. New stations would be the same as in Case 1. Case 3: all trains operate between Temecula and Los Angeles. New stations would be the same as in Case 1. After subsequent consideration by the TAC and RCTC staff, five more service cases were added. These were: Case 4: half of trains operate between Temecula and Los Angeles, and the other half operate between Temecula and Laguna Niguel. One additional new station is assumed at the Dos Lagos development just south of Corona. Case 5: all trains operate between Temecula and Laguna Niguel. New stations would be the same as in Case 4, with Dos Lagos. Case 6: all trains operate between Temecula and Los Angeles. New stations would be the same as in Case 4, with Dos Lagos. Case 7: All trains operate between Temecula and San Bernardino. New stations would be the same as in Case 1, without Dos Lagos. Case 8: All trains operate between Temecula and San Bernardino. New stations would be the same as in Case 4, with Dos Lagos.
29 I-15 Commuter Rail Feasibility Study 2-3 Ridership Forecast Methodology The commuter rail ridership forecast was performed using a methodology developed originally to support the 2004 Commuter Rail Strategic Assessment commissioned by the Orange County Transportation Authority (OCTA) and refined during the subsequent Metrolink Commuter Rail Strategic Assessment. Commuter rail ridership forecasts in both studies were based on estimates of the commuter market share or mode split which commuter rail reasonably could be expected to achieve, assuming various levels of train frequency, travel distance and congestion on parallel road systems. The methodology was subsequently used for the 2005 RCTC Commuter Rail Feasibility Study. The forecasting methodology reflects the assumption that people are drawn to commuter rail if they must make longer trips, especially if there are frequent trains available to encourage and support convenient trip-making. In other words, the longer the trip and the more frequent the headways, the more riders find commuter rail an attractive option. Those patterns were observed from the results of Metrolink s 2002 On-board Passenger Survey. Based on that survey, Metrolink predicted the number of commuters likely to use commuter rail between any two stations served by Metrolink, given: 1) a specific number of trains during the morning peak-period and 2) traveling specific distances. Metrolink validated those predictions against the Metrolink survey, making adjustments on a line and station basis as needed. Two additional key inputs are employed in the methodology to forecast potential ridership: Station catchment areas defining the origins and destinations of commuter rail trips were assumed. The number of peak-direction, A.M. peak period trains between stations was assumed. The first input provides the universe of work trips for which commuter rail would be an eligible travel option. The Metrolink On-board Passenger Survey identified Southern California Association of Governments (SCAG) Travel Analysis Zones (TAZs) from which riders were arriving to board trains at each of its stations. The survey suggested as a general rule an origin catchment area with a five-mile radius, although TAZ catchment areas are larger at termini which tend to draw riders from farther distances. Please note that the commuter rail station TAZ catchment areas were determined with an eye toward identifying riders whose commuter rail trips typically are long distance. The way in which the TAZs were drawn may serve to overstate trips between adjacent stations at the end of the lines. Destination catchment areas generally are smaller but can be expanded if superior transit connections exist or if station cars are used. The universe of work trips can be identified by using forecasts of work trips between TAZs in five Southern California counties, including Riverside, maintained by SCAG. Those
30 I-15 Commuter Rail Feasibility Study 2-4 forecasts then can be associated with specified TAZ origin and destination catchment areas to yield the total potential market associated with each station. The second input guides the forecast of the share or mode split of that universe of work trips between stations that commuter rail likely would capture in a given, future year. All commuter rail cases were assumed to include six peak-period and two off-peak round trips each weekday, consistent with the projected level of service associated with the extension of Metrolink service onto the Perris Valley Line between Riverside and South Perris by 2030, as set forth in RCTC s New Starts Application to the Federal Transit Administration, a related but completely separate effort undertaken by other consultants. Commuter rail mode splits, assuming six frequencies during the peak period and trips of varying distances, appear in the Table 2-1 below. The mode splits were derived from Metrolink s experience which has shown that, the longer the trip, the more people ride the train. Table 2-1 Commuter Rail Work Trip Mode Splits (Assuming Six Peak-Period Trains) Mode Split Miles (Percent) Employing the above-described inputs, the methodology predicts a base number of likely passenger work trips. To anticipate total passenger trips and to refine the future forecasts, two other inputs are needed: Future travel time by automobile between stations. The likely contribution of off-peak service to total ridership. The third input results in an upward adjustment of ridership forecasts in cases where congestion on parallel highway systems lengthens auto commutes. This forecasting effort included ridership adjustment factors that had the effect of boosting ridership based on assumed competing but worsening auto travel times. Those factors were then applied to station area work trips to reflect gains in ridership due to higher roadway congestion levels. The last input triggers an adjustment to the calculation of total weekday ridership, reflecting the operation of off-peak trains in addition to peak-period trains. As an example, Metrolink s off-peak trains generate about 10 percent of total weekday ridership. Such a percent was used as a factor in forecasting total peak and offpeak train ridership for all the commuter rail cases.
31 I-15 Commuter Rail Feasibility Study 2-5 This forecast followed the methodology outlined above to identify work trips between aggregations of several TAZs around stations, apply appropriate mode splits based on train frequency and travel distance, and adjust the results to reflect assumed, increased congestion on parallel highways in the future. It also considered the ridership impact of limited, off-peak service, and assumed connecting transit services at all stations. A complete list of all stations assumed in all eight cases appears in the Appendix A. The forecast reflected the calculation of estimated AM peak-period and total weekday commuter rail ridership from Temecula westward to both Los Angeles and Laguna Niguel via the 91 and IEOC Lines in the year 2030 in connection with each of the eight aforementioned commuter rail cases. The ridership forecasts projected in connection with the assumed extensions of commuter rail service south of Corona were incremental to the ridership forecasts associated with potential service enhancements on the 91 and IEOC Lines, which were identified in the Metrolink Commuter Rail Strategic Assessment. So, the forecasts in this study measured the incremental ridership associated with each of the extensions studied, over and above that which will result from the expansion of Metrolink s 91 and IEOC Line services through Corona. With any of the eight cases, there are potentials for transfers. For example, through travel would be possible in all cases to destinations east of Corona La Sierra, Riverside and San Bernardino. However, ridership through Corona to these three destinations was adjusted downward to reflect the necessity of a transfer to/from connecting trains at Corona. Transfer ridership in all cases was treated in the same way. Forecast Results Table 2-2 shows the results of the forecasting effort. The cases show a range in 2030 weekday ridership (one-way passenger trips) of roughly between about 1,000 and 1,170. Cases including an additional station at the Dos Lagos development have slightly more riders. Services with trains going to Laguna Niguel have more riders than trains going to both Laguna Niguel and Los Angeles and trains just going to Los Angeles. Services with trains going to San Bernardino have about the same number of riders as services to Laguna Niguel. All noted, however, the differences between cases are small to the point of not being statistically significant. The extension trains would generate additional ridership between existing Metrolink stations as a result of the additional frequencies they provide.
32 I-15 Commuter Rail Feasibility Study 2-6 Notes: Table 2-2 Passenger Rail Ridership Forecast in 2030 Temecula North Case Service Stations A.M Peak All-day 1 Split Service (Base Case) All Trains to Los Angeles ,052 3 All Trains to Laguna Niguel ,099 4 Split service (Base Case) ,037 5 All Trains to Los Angeles 5 1,003 1,104 6 All Trains to Laguna Niguel 5 1,047 1,152 7 All Trains to San Bernardino 4 1,003 1,104 8 All Trains to San Bernardino 5 1,059 1,165 Split service assumes trains for both Los Angeles and Laguna Niguel. Los Angeles trains carry riders transferring to IEOC Line trains at Corona. Laguna Niguel trains carry riders transferring to 91 Line trains at Corona. San Bernardino trains carry riders transferring to IEOC and 91 Line trains at La Sierra. Cases 4-6 and 8 assume an additional station at Dos Lagos. Appendix A includes origin and destination ridership forecast for all eight cases. The specific service alternatives evaluated in Chapter 4 include the Base Case, shown as Alternative A; a shortened version of the Base Case, with a southern terminus near Lake Elsinore, shown as Alternative C; and another shortened version of the Base Case, similar to Alternative C, including an additional new station at Dos Lagos and shown as Alternative C1. Alternative C has an all-day ridership estimate of 847, and Alternative C1 has an all-day ridership estimate of 921. Temecula-San Diego Corridor Commuter Rail Service Case Tested Only one conventional commuter rail case was tested for service between Temecula and San Diego. Like the other cases, this one assumed six round trip peak period trains, and two round trip mid-day trains. As noted, stations included Temecula/Murrieta at I-15/I215, Escondido, Poway SR 56, Mira Mesa, Old Town and the historic San Diego Depot. In all, the route is 66 miles long. A conventional commuter one-way trip would take approximately 82 minutes from start to finish. This service case for commuter rail was coded within the statewide interregional ridership forecasting model between Temecula and San Diego in place of highspeed rail in this corridor to determine the ridership potential.
33 I-15 Commuter Rail Feasibility Study 2-7 Ridership Forecast Methodology This commuter rail service alternative was tested using a statewide ridership and revenue forecasting model developed for the California High-Speed Rail Authority and the Metropolitan Transportation Commission. This statewide model was developed to support evaluation of high-speed rail alternatives in the State of California. It is a fully multimodal model capable of forecasting air, commuter rail and highway alternatives as well as high-speed rail. The approach to this statewide model explicitly recognizes the unique characteristics of intraregional travel demand and interregional travel demand. As a result, interregional travel models capture behavior important to longer distance travel, such as induced trips, business and commute decisions, recreational travel, attributes of destinations, reliability of travel, party size, and access and egress modal options. Intraregional travel models rely on local highway and transit characteristics and behavior associated with shorter distance trips (such as commuting and shopping). These models are applied to both peak and off-peak conditions for an average weekday. Weekend travel demand and annual ridership estimates are developed using annualization factors developed from observed data on highspeed rail systems around the world. There are four trip purposes for the interregional models (business, commute, recreation, and other) and each trip purpose is modeled separately for two distance classes (trips greater than or less than 100 miles) and by five trip types (trips made by residents of the four largest cities in California versus other trips). The interregional trip frequency models allow estimate induced travel based on improved accessibilities due to highspeed rail options. The interregional models were estimated based on travel survey data collected for these purposes. The interregional models are comprised of four sets of models: trip frequency, destination choice, main mode choice, and access/egress mode choice. The trip frequency model component predicts the number of interregional trips that individuals in a household will make based on the household s characteristics and location. The destination choice model component predicts the destinations of the trips generated in the trip frequency component based on zonal characteristics and travel impedances. The mode choice components predict the modes that the travelers would choose based on the mode service levels and characteristics of the travelers and trips. The mode choice models include a main mode choice, where the primary interregional mode is selected, and access/egress components, where the modes of access and egress for the air and rail trips are selected. The details of these models are documented in the
34 I-15 Commuter Rail Feasibility Study 2-8 Bay Area/California High-Speed Rail Ridership and Revenue Forecasting Study Interregional Model System Development Report 1. There were three types of data compiled for the original model development: travel surveys, networks, and socioeconomic data. Some of the travel surveys were collected specifically for this study, three were available from Metropolitan Planning Organizations (MPOs) around the state (the Southern California Association of Governments, the Metropolitan Transportation Commission, and the Sacramento Area Council of Governments), and there was a Caltrans statewide survey available. The interregional models were based on revealed and stated preference surveys, collected specifically for this study, of air and rail travelers, as well as additional households in the state to capture auto travelers. These new data were collected in fourteen regions in California. These were combined with revealed preference surveys of households across the state collected by Caltrans and interregional travel extracted from the MPO regional travel surveys (San Francisco, Sacramento, and Los Angeles). The San Diego regional travel survey was reviewed for this purpose but did not contain the necessary data for these interregional trips to include it. By combining the various available data sources, the model developers were able to provide more robust data sets for model estimation than was otherwise possible. There are highway, air, rail, and local transit networks to support both the urban area and interregional travel models. The socioeconomic data includes household data in four classifications (household size, income groups, number of workers, and vehicle ownership) and employment data by type. The levels-of-service (LOS) assumptions and future alternatives for the Bay Area/California High-Speed Rail (HSR) Ridership and Revenue Forecasting Study were developed for costs (i.e., operating costs and fare prices), service frequencies, travel and access/egress times, terminal times, and reliability measures for each of the interregional travel modes under consideration auto, air, conventional rail, and high-speed rail. Data comes from a variety of sources. Assumptions about the future background highway and transit networks generally come from existing regional and metropolitan transportation plans. All costs and incomes were reported in year 2005 dollars. The HSR forecasting study also included an extensive new data collection effort of interregional revealed- and stated-preference travel patterns. New data collection comprised 3,172 revealed and stated-preference surveys of California interregional air, auto, and rail passengers, which were used to develop data for access/egress times and costs, and airport terminal times. The details of these LOS assumptions are documented in the Bay Area/California High-Speed Rail Ridership and Revenue 1 Developed by Cambridge Systematics for the Metropolitan Transportation Commission and the California High-Speed Rail Authority, August 2006,
35 I-15 Commuter Rail Feasibility Study 2-9 Forecasting Study Level of Service Assumptions and Forecast Alternatives Report 2. Forecast Results Table 2-4 presents the commuter rail average weekday boardings by station from Temecula to San Diego. The I-15/I-215 station has the highest boardings, probably because of the fact that the Los Angeles region can access this station to travel to San Diego, so it has a very large travel shed to draw from. The downtown San Diego station (Depot) has the next highest boardings, as expected. Overall there are over 3,000 average weekday riders on this commuter rail line. Detailed ridership forecasts are contained in Appendix A. Table 2-3 Temecula-San Diego Commuter Rail Weekday Boardings I-15/I Escondido 220 SR 56/Poway 279 Mira Mesa 210 Old Town 548 Depot 860 Total 3,090 Temecula-San Diego Corridor High-Speed Rail The California High Speed Rail Authority developed a high-speed rail plan that includes train service between Los Angeles and San Diego. This would be a high-speed and frequent service between these two cities, offering a competitive alternative to driving. Travel time between Temecula and San Diego would be 38 minutes. There would be 36 trains per day in the peak period (3 hours in the AM and 3 hours in the PM) for an average frequency of 10 minutes in the peak period. There would be 12 trains per day in the off-peak period (remaining 12 hours in the service period) for an average frequency of 60 minutes in the offpeak period. The purpose of the high-speed rail service case was to determine the ridership impact of including the Poway station. Accordingly, this case was tested with and without the Poway station. The service case without the Poway station was the existing high-speed rail base alternative developed for the California High Speed Rail Authority and the Metropolitan Transportation Commission 3. 2 Developed by Cambridge Systematics for the Metropolitan Transportation Commission and the California High-Speed Rail Authority, August 2006, Board Meeting_Feb07.pdf
36 I-15 Commuter Rail Feasibility Study 2-10 Ridership Case Tested This case assumed that six peak period round trip high-speed trains and two mid-day round trip high-speed trains operating between Los Angeles and San Diego would stop at a Poway station in More than this amount of trains are planned to operate during the peaks and mid-day on this route. This case, therefore, quantifies the impact of adding a Poway station to the high-speed rail system. Ridership Forecast Methodology The ridership forecast methodology for this service case is the same as it was for the commuter rail from Temecula to San Diego, except that high-speed rail was tested as an alternative instead of commuter rail. This methodology is described in the previous section. Forecast Results Table 2-5 presents the Year 2030 high-speed rail boardings for the 16 weekday trains (6 AM peak trains, six PM peak trains and two mid-day trains) that stop at Poway. These boardings represent a small portion of the high-speed rail system, which carries travelers from San Diego to Sacramento, Los Angeles, and San Francisco. In this portion of the system, the high-speed rail was tested with and without the Poway station, to determine the overall impact of this new station. The forecast shows that the Poway station would have 242 average weekday boardings in 2030 for trips to the four other stations in the study area. The majority of these trips would be made by high-speed rail riders who would be using a different station, if the Poway station did not exist. Thus, there is no significant increase in total riders with the inclusion of the Poway station. This is likely because high-speed rail serves longer distance trips more effectively, so the system does not need to have as many stations to be effective in serving these longer distance trips. Detailed ridership forecasts are contained in Appendix A. Table 2-4 Temecula-San Diego High-Speed Rail Weekday Boardings with a Poway Station Temecula 1,297 Escondido 411 Poway 242 University City 340 San Diego 1,515 Total 3,805
37 I-15 Commuter Rail Feasibility Study 2-11 By way of perspective, recent forecasts for the HSRA have shown that HSR stations in the San Diego area would see boardings in a range of 5,000 to 18,000 per day in Stations in the six-county SCAG region would see boardings in a range of 400 to 15,000 per day in The forecast for this study found that a Poway station would not be a major destination for Temecula area commuters. Only 127 Temecula boardings would alight weekdays at Poway in As noted, the figures above are the boardings generated only by the 16 trains that stop at Poway. Total boardings at the other stations, which are planned HSR system stations, would be larger. A Poway station would serve a larger market than just trips to those stations cited above. Indeed, the study team estimates total boardings at Poway in 2030 of 1,990 per weekday. Of these, 225 would be destined for Northern California stations. The remaining would be destined for Southern California stations, including the 242 noted above for study area stations and 1,523 for stations north and west of Temecula. It is reasonable to assume that Poway would see a number of alightings similar to the number of boardings. Accordingly, it appears that a Poway station would generate about 4,000 boardings and alightings, or passenger trips, per weekday in As noted earlier, majority of these trips would be made by high-speed rail riders who would be using a different station, if the Poway station did not exist. Thus, there is no significant increase in total riders with the inclusion of the Poway station.
38 I-15 Commuter Rail Feasibility Study 3-1 Chapter 3: Capital and Operating Costs With potential operating options and ridership ranges identified, this chapter defines more specific conventional commuter rail operating patterns and consequent conceptual capital and operating costs for evaluation. All alternatives assume 16 weekday trains. The chapter also looks at the capital costs for constructing a HSR station at Poway. Temecula-Corona Corridor Commuter Rail Conceptual Capital Costs With potential ridership ranges identified for various service cases in Table 2-2, the study team began its analysis of more specific alternative routes and conceptual capital costs for the purpose of a comparative evaluation to identify the most cost effective options. These included two alternatives to limit the southward Temecula extension to Lake Elsinore in order to shorten line construction and thus minimize costs. Also the capital cost alternatives explore the potential of connecting to the I-15 right-of-way at different locations. Furthermore, the alternatives oriented to the west assume Base Case operations: with half of trains operating to Los Angeles and the other half operating to Laguna Niguel. Thus, the alternatives discussed below represent a subset of the eight ridership service cases and explore different approaches to travel along the same general corridor, including various station options. Capital costs at a conceptual level were developed for seven separate alternatives for commuter rail operations on Temecula-Corona Corridor. The costs are discussed below. The estimates reflect factors unique to each alternative. The alternatives considered are: Alternative A From the junction with the BNSF Transcon at Porphyry Wye just east of the North Main Corona Metrolink Station, this alternative is 35.3 miles long and runs the length of the corridor to Temecula. From north to south, the route would make use of the right-of-way of the former Atchison Topeka and Santa Fe Railway (Santa Fe) branch line as far as the Alberhill residential development south of Lake Street in Lake Elsinore. It would then use a new right-of-way east of the development to reach Nichols Road, before entering the I-15 right-of-way for its southward run to Temecula. The four new stations for this alternative would be at Temescal Canyon Road just east of the I-15 overcrossing, Nichols Road, Bundy Canyon Road and Temecula/Murrieta. This alternative is shown as Figure 3-1, running south from the existing Corona station, which would serve as a transfer station for riders not


39 I-15 Commuter Rail Feasibility Study 3-2 carried directly to destinations by trains from Temecula. The ridership service case associated with this alternative is Case 1. Figure 3-1
40 I-15 Commuter Rail Feasibility Study 3-3 Alternative B - This alternative is much the same as Alternative A. The major difference is that the rail alignment would enter the I-15 right-ofway at Lake Street, about three miles north on I-15 from Nichols Road. The length of the alignment and the stations would be the same. Alternative C At 15.7 miles, this is a short alternative, with a southern terminus at Lake Street. There would be just two stations one at Temescal Canyon Road and the other at Lake Street; riders from points farther south in the I-15 corridor could board trains at Lake Street. Alternative C would also be a less complicated alternative to build, since it would make use of what is left of the original Santa Fe right-of-way. This alternative would have much of the same ridership as Alternative A, except that the trips between the two southern most stations would be lost, as those stations would not be included in this shorter alternative. The ridership for this alternative was derived from Case 1. Alternative C1 This alternative is the same as Alternative C, with the addition of another new station at Dos Lagos, as shown in Figure 3-2. The additional station would result in a small increase in ridership versus Alternative C. The ridership for this alternative was derived from Case 4. Alternative D This alternative is the same as Alternative A, with the addition of another new station at Dos Lagos. The ridership service case associated with this alternative is Case 4. Alternative E This alternative assumed that all six trains depart Temecula in the morning peak and terminate in San Bernardino, rather than in Los Angeles, Laguna Niguel, or both. Thus, it assumed the reestablishment of the east leg of the Porphyry Wye, connecting the existing BNSF branch line with the Transcon, and the relocation of railcar storage tracks which lie across where the east leg used to be. The alternative runs 35.3 miles, as shown in Figure 3-3. The alternative is shown running south from the existing La Sierra station, which would serve as a transfer station for riders not carried directly to destinations by trains from Temecula. The ridership service case associated with this alternative is Case 7. Alternative F This alternative is like Alternative E, with another new station at Dos Lagos. The ridership service case associated with this alternative is Case 8. A summary of the conceptual cost estimates for all seven alternatives appears in Table 3-1. Individual cost element discussions also appear below. Most unit costs are the same as assumed for the 2005 RCTC Commuter Rail Feasibility Study. Detailed estimates for the alternatives appear in Appendix B. Costs are in current year dollars.

41 I-15 Commuter Rail Feasibility Study 3-4 Figure 3-2

42 I-15 Commuter Rail Feasibility Study 3-5 Figure 3-3
43 I-15 Commuter Rail Feasibility Study 3-6 Table 3-1 Temecula Extension Total Conceputal Capital Costs - $ in Millions (includes engineering and contingencies) Alternative and Length from BNSF Transcon (miles) A B C C1 D E F Cost Element (35.3) (35.3) (15.7) (15.7) (35.3) (35.3) (35.3) Track Turnouts At grade, highway rail crossings Structures Drainage Stations Signals Earthwork Right-of-way Specialty tems Estimated Construction Costs EMDCM* (15% of Construction) Subtotal Contingenies (30% of Constr.) Total Estimated Costs** Equipment Total Estimated Capital Costs Alternative A B C C1 D E F Description Corona-Temecula, entering I-15 at Nichols Road at Lake Elsinore Corona-Temecula, entering I-15 at Lake Street at Lake Elsinore Corona-Lake Street at Lake Elsinore Corona-Lake Street at Lake Elsinore with additional station at Dos Lagos Same as A, with additional station at Dos Lagos San Bernardino-Temecula, entering I-15 at Nichols Road at Lake Elsinore Same as E, with additional station at Dos Lagos Notes: * EMDCM = Engineering/Mobilization/Demobilization/Construction Management ** Includes EMDCM and Contingencies Subtotals reflect rounding which may cause some variance New and Upgrade Track Construction New main track is likely to be constructed of 141 pound rail, concrete ties, new rail anchorage, sufficient ballast and other materials to achieve the desired Federal Railroad Administration (FRA) Class track class (likely FRA Class 4, allowing for maximum passenger train speeds of 79 miles per hour).
44 I-15 Commuter Rail Feasibility Study 3-7 Turnouts Turnouts are switches allowing trains to move between parallel tracks or into layover facilities. There are three types of turnouts considered in this analysis: #20 high speed turnouts and #10 lower speed turnouts for mainline operations, and #10 yard turnouts. Mainline switches are electronically controlled by dispatchers in a remote location. Yard turnouts are hand-operated. At-grade Highway-Rail Crossings Capital cost estimates reflect the replacement or new installation of all new ties, freshly surfaced track, and full-depth concrete panels. Structures Major structures include access and egress to and from the I-15 right-of-way for Alternatives A, B, D, E and F. This can be accomplished either by a flyover or a tunnel. Estimates assume 3,400 track feet of major railroad bridge installations in Alternatives A, B, D, E and F and half that in Alternatives C and C1. By far, the largest cost item for the five longer alternatives is for retaining walls. A retaining wall would be required along the Alberhill development, to prevent earthen embankments there from eroding onto the tracks. Retaining walls would also be needed inside the I-15 right-of-way as a safety precaution. Drainage A new drainage system will be required along the route. The estimate for the new system is a flat 10 percent of the track cost. Stations Station cost estimates reflect the cost of construction. The cost of land acquisition is included in right-of-way costs discussed below. Station parking for a minimum of 500 vehicles is included in the standard station cost, with additional required spaces addressed later as a specialty item. Signals Cost estimates are included for a Centralized Traffic Control (CTC) system, allowing a dispatcher in a remote location to control trains. The estimates also include costs for grade crossing protective devices gates and flashing lights.
45 I-15 Commuter Rail Feasibility Study 3-8 Earthwork Major earthwork is assumed for rebuilding the former Santa Fe right-of-way and the alignment east of the Alberhill residential development. Minor earthwork is assumed in the I-15 right-of-way. Right-of-Way The cost estimates assume purchase of land for the new commuter rail alignment, stations, and a layover facility. The cost per acre for purchase of property was confirmed by RCTC. All alternatives assume purchase of portions of the Dos Lagos Golf Club, which was built on top of the former Santa Fe rightof-way. The analysis assumes that the golf club would replace the reclaimed property with the proceeds of the right-of-way acquisition. At the time of this writing, land available for purchase appeared to exist south of the golf club. No cost is assumed for use of the I-15 right-of-way. Alternatives E and F assume the reestablishment of the east leg of the Porphyry Wye and the relocation of storage tracks used by a processing plant adjacent to the BNSF mainline. Specialty Items These consist of two items. One is any parking required beyond the 500 spaces per station. Only Alternatives C and C1 have such a cost, as it assumes 500 additional spaces built at the Lake Street Station, to accommodate riders from points farther south along I-15 driving to the station to board commuter trains. The other item is for layover yard improvements, beyond the property acquisition. Such improvements are the same as assumed for the 2005 RCTC commuter rail study and include: 480-volt standby power (required to maintain train heat and cooling and operate lights and doors without running the train s locomotive) A crew and maintenance building Fencing and security Lighting A lead track long enough to enable changing consists without entering the main track Level storage tracks with locomotive drip pans Roadway vehicle access to all tracks A schematic of the layover facility appeared in the 2005 study. Heavy maintenance of rolling stock would take place at Metrolink facilities either in Los Angeles or San Bernardino. Accordingly no cost for such a facility is included in the cost estimates.
46 I-15 Commuter Rail Feasibility Study 3-9 Equipment As in the 2005 study, the rolling stock assumed is typical Metrolink equipment. Each train set would consist of a locomotive, one cab car, and five bi-level coaches. The previous study assumed the contribution of just one train set for each of the five commuter rail scenarios studied. This was because these services were envisioned to be extensions of either the Riverside Line (to/from Banning and Coachella Valley via Riverside) or the 91 Line (to/from San Jacinto and Temecula via South Perris). This study s underlying assumption was that service on the Temecula Extension would generate totally new trains, additive to whatever is running on the 91 or IEOC Lines in Accordingly, this study assumed that there would be six train sets in all, the number required to support the six peak period round trips and the two mid-day round trips, for all six alternatives 1. This requirement generates a total equipment cost of $94.8 million, with each train set estimated to cost $15.8 million. Total equipment costs in the previous study for each of the five commuter rail scenarios was just $15.8 million, the cost of a single six-car train set, or $79 million less than the equipment requirement assumed in this study. Cost Summaries and Short Listing the Alternatives Total conceptual capital cost estimates, including such soft costs as engineering and construction management as well as contingencies, were in a range of $250.1 million to $610.5 million. The higher figure, for Alternative B, assumed the greater use of the I-15 right-of-way, from Lake Street to I-15/I-215 in Temecula/Murrieta. The lower figure, Alternative C, assumed terminating the rail line at Lake Street. The five longer alternatives (A, B, D, E and F) essentially cover the same area. They differ from each other in minor ways. Of the five, Alternative A was selected for further evaluation in this study, as it showed to be potentially the least expensive to implement. Alternative C and Alternative C1 also were retained, as these appeared to be the simplest and easiest to construct, while still providing a viable option to potential riders throughout the corridor. 1 This equipment would be pooled with Metrolink equipment, so no specific assumption is made here for spares.
47 I-15 Commuter Rail Feasibility Study 3-10 Operating and Maintenance Costs Annual operating costs were estimated in connection with Alternatives A, C and C1. Estimated operating costs were calculated by multiplying estimated trainmiles operated in each alternative by cost per train-mile figure used in the 2005 RCTC commuter rail study (this figure was originally provided by SCRRA). The cost calculation appears in Table 3-3, and assumes Base Case operations, i.e. half of trains run between Temecula and Los Angeles and the other half between Temecula and Laguna Niguel. The operating costs are incremental, as only the costs of running on the Temecula-Corona corridor are counted. This calculation approach is the same used in the 2005 RCTC commuter rail study. Operating and maintenance costs are those costs related to running the service. They include costs for crews, dispatching, fuel, equipment maintenance, right-ofway maintenance, insurance, administration, etc. For this calculation, the total mileage from the North Main Corona Station to the alternative endpoints in Temecula (I-15/I-215) and Lake Elsinore (Lake Street) were used, rather than the route mileage shown in Table 3-1 (counted from the junction of the corridor extension with the BNSF Transcon). The service level comprised six peak period round trips and two mid-day round trips, totaling 16 weekday trains for each alternative. Only weekday train service and 255 weekdays per year were assumed. Alternative A s annual train-miles (36.5 route miles times 16 trains times 255 weekdays) is more than twice that of Alternatives C and C1, as A is more than twice as long as C and C1. The same is true for A s estimated operating and maintenance costs.
48 I-15 Commuter Rail Feasibility Study 3-11 Table 3-3 Temecula-Corona Estimated Annual O&M Costs Alternative A C C1 Endpoint Temecula Lake Elsinore Lake Elsinore Service type Commuter Commuter Commuter Route-miles from N. Main Corona Days operated per week Daily trains (inbound and outbound) Daily train-miles Annual train-miles* 148,920 69,360 69,360 Estimated annual operating cost** $6,151,885 $2,865,262 $2,865,262 Notes: * Annual operating costs are incremental ** 255 operational days used in determining annual train-miles Metrolink operating cost/train-mile of $41.31 used in calculation Temecula-San Diego Corridor Commuter Rail Conceptual Capital Costs This study considers one additional commuter rail service alternative: between Temecula and downtown San Diego. As with the other alternatives, this assumes 16 trains: six AM peak period southbound trains, the reverse in the evening peak, and two mid-day round trips. This alternative is 66 miles long, as shown in Figures 3-4 and 3-5. It is referred to hereafter as Alternative G. As this alternative follows the proposed HSR alignment, the study team followed the costing methodology adopted for the Capital and Operations and Maintenance Costs report for the California High-Speed Rail Authority (June 2004). Certain modifications were required, however. The earlier report calculated costs in segments (namely Segments 2A and 3B in the report), which did not fit precisely the commuter rail route assumed for this study. The combined length of these segments was greater than the 66-mile commuter rail route between Temecula and downtown San Diego. Accordingly, underlying assumptions as to the amount of structures and right-of-way required had to be scaled back. Furthermore, the requirements for track and earthwork


49 I-15 Commuter Rail Feasibility Study 3-12 had to be reduced to reflect the needs of a single track commuter alignment versus a double track HSR alignment. Figure 3-4

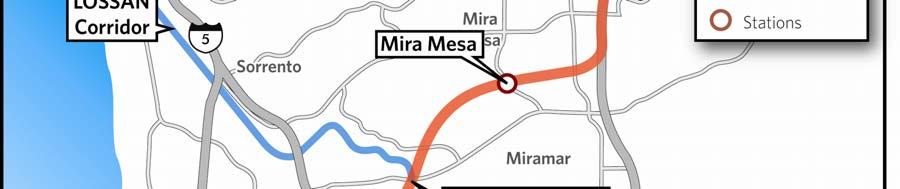
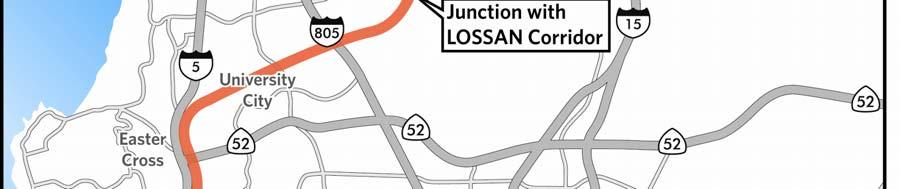

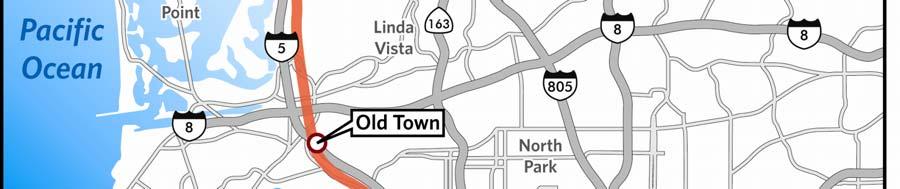
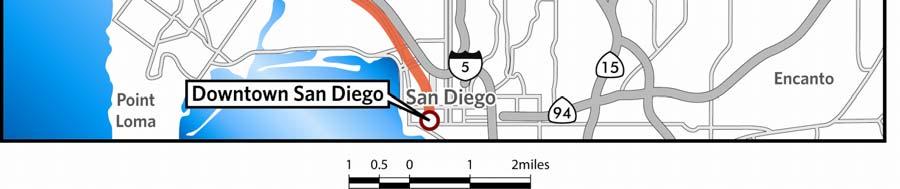
50 I-15 Commuter Rail Feasibility Study 3-13 Figure 3-5
4 COSTS AND OPERATIONS
 4 COSTS AND OPERATIONS 4.1 INTRODUCTION This chapter summarizes the estimated capital and operations and maintenance (O&M) costs for the Modal and High-Speed Train (HST) Alternatives evaluated in this
Executive Summary. Treasure Valley High Capacity Transit Study Priority Corridor Phase 1 Alternatives Analysis October 13, 2009.
 Treasure Valley High Capacity Transit Study Priority Corridor Phase 1 Alternatives Analysis October 13, 2009 Background As the Treasure Valley continues to grow, high-quality transportation connections
6/6/2018. June 7, Item #1 CITIZENS PARTICIPATION
 June 7, 2018 Item #1 CITIZENS PARTICIPATION 1 Item #2 APPROVAL OF MINUTES Item #3 TRAC GOALS, FRAMEWORK & AGENDA REVIEW 2 COMMITTEE GOALS Learn about Southern Nevada s mobility challenges, new developments
DEVELOPMENT OF RIDERSHIP FORECASTS FOR THE SAN BERNARDINO INFRASTRUCTURE IMPROVEMENT STUDY
 APPENDIX 1 DEVELOPMENT OF RIDERSHIP FORECASTS FOR THE SAN BERNARDINO INFRASTRUCTURE IMPROVEMENT STUDY INTRODUCTION: This Appendix presents a general description of the analysis method used in forecasting
Executive Summary. Draft Environmental Impact Statement/Environmental Impact Report ES-1
 Executive Summary Introduction The Eastside Transit Corridor Phase 2 Project is a vital public transit infrastructure investment that would provide a transit connection to the existing Metro Gold Line
Bi-County Transitway/ Bethesda Station Access Demand Analysis
 Bi-County Transitway/ Bethesda Station Access Demand Analysis Prepared for: Washington Metropolitan Area Transit Authority Office of Planning and Project Development May 2005 Prepared by: in conjunction
U.S. System Summary: ARIZONA/SOUTHWEST
 U.S. System Summary: ARIZONA/SOUTHWEST Arizona/Southwest High-Speed Rail System (Source: Texas A&M Transportation Institute) The Arizona/Southwest high-speed rail system described in this summary groups
FINAL. Sound Transit Long-Range Plan Update. Issue Paper S.1: Tacoma Link Integration with Central Link. Prepared for: Sound Transit
 Sound Transit Long-Range Plan Update Issue Paper S.1: Tacoma Link Integration with Central Link Prepared for: Sound Transit Prepared by: Quade & Douglas, Inc. FINAL March 2005 Foreword This issue paper
Parks and Transportation System Development Charge Methodology
 City of Sandy Parks and Transportation System Development Charge Methodology March, 2016 Background In order to implement a City Council goal the City of Sandy engaged FCS Group in January of 2015 to update
Chapter 9 Recommended Locally Preferred Alternative and Alternatives for Evaluation in Draft SEIS/SEIR
 Chapter 9 Recommended Locally Preferred Alternative and Alternatives for Evaluation in Draft SEIS/SEIR 9.0 RECOMMENDED LOCALLY PREFERRED ALTERNATIVE AND ALTERNATIVES FOR EVALUATION IN DRAFT SEIS/SEIR
Michigan/Grand River Avenue Transportation Study TECHNICAL MEMORANDUM #18 PROJECTED CARBON DIOXIDE (CO 2 ) EMISSIONS
 EMISSIONS") TECHNICAL MEMORANDUM #18 PROJECTED CARBON DIOXIDE (CO 2 ) EMISSIONS Michigan / Grand River Avenue TECHNICAL MEMORANDUM #18 From: URS Consultant Team To: CATA Project Staff and Technical Committee Topic:
TECHNICAL MEMORANDUM #18 PROJECTED CARBON DIOXIDE (CO 2 ) EMISSIONS Michigan / Grand River Avenue TECHNICAL MEMORANDUM #18 From: URS Consultant Team To: CATA Project Staff and Technical Committee Topic:
4.0 TIER 2 ALTERNATIVES
 4.0 TIER 2 ALTERNATIVES The Tier 2 Alternatives represent the highest performing Tier 1 Alternatives. The purpose of the Tier 2 Screening was to identify the LPA utilizing a more robust list of evaluation
Pacific Electric Right-of-Way / West Santa Ana Branch Corridor Alternatives Analysis
 Pacific Electric Right-of-Way / West Santa Ana Branch Corridor Alternatives Analysis Transit Coalition September 26, 2012 2 Study Area Pacific Electric Rightof-Way/West Santa Ana Branch (PEROW/ WSAB) extends
STH 60 Northern Reliever Route Feasibility Study Report
 #233087 v3 STH 60 Northern Reliever Route Feasibility Study Report Washington County Public Works Committee Meeting September 28, 2016 1 STH 60 Northern Reliever Route Feasibility Study Hartford Area Development
Office of Transportation Bureau of Traffic Management Downtown Parking Meter District Rate Report
 Office of Transportation Bureau of Traffic Management 1997 Downtown Parking Meter District Rate Report Introduction The City operates approximately 5,600 parking meters in the core area of downtown. 1
CEDAR AVENUE TRANSITWAY Implementation Plan Update
 CEDAR AVENUE TRANSITWAY Implementation Plan Update EECUTIVE SUMMARY DECEMBER 2015 Executive Summary In 2013, the Twin Cities metropolitan area s first bus rapid transit (BRT) line, the METRO Red Line,
5. OPPORTUNITIES AND NEXT STEPS
 5. OPPORTUNITIES AND NEXT STEPS When the METRO Green Line LRT begins operating in mid-2014, a strong emphasis will be placed on providing frequent connecting bus service with Green Line trains. Bus hours
Table Existing Traffic Conditions for Arterial Segments along Construction Access Route. Daily
 5.8 TRAFFIC, ACCESS, AND CIRCULATION This section describes existing traffic conditions in the project area; summarizes applicable regulations; and analyzes the potential traffic, access, and circulation
UTA Transportation Equity Study and Staff Analysis. Board Workshop January 6, 2018
 UTA Transportation Equity Study and Staff Analysis Board Workshop January 6, 2018 1 Executive Summary UTA ranks DART 6 th out of top 20 Transit Agencies in the country for ridership. UTA Study confirms
REPORT CARD FOR CALIFORNIA S INFRASTRUCTURE WHAT YOU SHOULD KNOW ABOUT CALIFORNIA S TRANSIT FACILITIES
 TRANSIT GRADE: C- WHAT YOU SHOULD KNOW ABOUT TRANSIT FACILITIES California needs robust, flexible and reliable transit systems to reduce peak congestion on our highways, provide options for citizens who
Travel Forecasting Methodology
 Travel Forecasting Methodology Introduction This technical memorandum documents the travel demand forecasting methodology used for the SH7 BRT Study. This memorandum includes discussion of the following:
US 81 Bypass of Chickasha Environmental Assessment Public Meeting
 US 81 Bypass of Chickasha Environmental Assessment Public Meeting March 14, 2013 Introductions ODOT FHWA SAIC Meeting Purpose Present need for bypass Provide responses to 10/04/11 public meeting comments
Travel Time Savings Memorandum
 04-05-2018 TABLE OF CONTENTS 1 Background 3 Methodology 3 Inputs and Calculation 3 Assumptions 4 Light Rail Transit (LRT) Travel Times 5 Auto Travel Times 5 Bus Travel Times 6 Findings 7 Generalized Cost
Escondido Marriott Hotel and Mixed-Use Condominium Project TRAFFIC IMPACT ANALYSIS REPORT
 Escondido Marriott Hotel and Mixed-Use Condominium Project TRAFFIC IMPACT ANALYSIS REPORT Prepared for Phelps Program Management 420 Sixth Avenue, Greeley, CO 80632 Prepared by 5050 Avenida Encinas, Suite
TITLE. Planning and Design for Commuter Rail on a Busy Branchline. By Train to Perris, Not Paris
 TITLE Planning and Design for Commuter Rail on a Busy Branchline By Train to Perris, Not Paris The Riverside County Transportation Commission's Perris Valley Line AUTHOR Tyler Bonstead STV Incorporated
Valley Metro Overview. ITE/IMSA Spring Conference March 6, 2014
 Valley Metro Overview ITE/IMSA Spring Conference March 6, 2014 Valley Metro Who Are We? Operate Regional Transit Services Valley Metro and Phoenix are region s primary service providers Light Rail and
TORONTO TRANSIT COMMISSION REPORT NO.
 Form Revised: February 2005 TORONTO TRANSIT COMMISSION REPORT NO. MEETING DATE: October 24, 2012 SUBJECT: DOWNTOWN RAPID TRANSIT EXPANSION STUDY (DRTES) PHASE 1 STRATEGIC PLAN ACTION ITEM RECOMMENDATIONS
Feasibility Study. Community Meeting March, North-South Commuter Rail Feasibility Study
 Feasibility Study Community Meeting March, 2017 1 Agenda 1. Welcome / Introductions 2. Background / Meeting Purpose 3. Progress to Date Options Evaluated Capital/Operating Costs Ridership 4. Financial
Madison BRT Transit Corridor Study Proposed BRT Operations Plans
 Madison BRT Transit Corridor Study Proposed BRT Operations Plans This paper presents a description of the proposed BRT operations plan for use in the Madison BRT Transit Corridor Study. The objective is
CLAREMONT METROLINK STATION STUDY Claremont Town Hall Meeting December 11, 2017
 CLAREMONT METROLINK STATION STUDY Claremont Town Hall Meeting December 11, 2017 1 Welcome Larry Schroeder Claremont Mayor 2 Agenda 1. Introduction of Panelists 2. Background 3. Metro Board Motion - Metrolink
Caltrain Downtown Extension Study Ridership Forecast Summary
 Caltrain Downtown Extension Study Ridership Forecast Summary presented to Transbay Joint Powers Authority presented by Cambridge Systematics date: March 12, 2009 Transportation leadership you can trust.
Needs and Community Characteristics
 Needs and Community Characteristics Anticipate Population and Job Growth in the City Strongest density of population and jobs in Ann Arbor are within the Study Area Population expected to grow 8.4% by
Los Angeles County Metropolitan Transportation Authority. Paid Parking Pilot Program Parking Management
 Los Angeles County Metropolitan Transportation Authority Paid Parking Pilot Program Parking Management Overview Metro currently operates over 22,000 parking spaces at 48 stations. This number will increase
TORONTO TRANSIT COMMISSION REPORT NO.
 Revised: March/13 TORONTO TRANSIT COMMISSION REPORT NO. MEETING DATE: March 26, 2014 SUBJECT: COMMUNITY BUS SERVICES ACTION ITEM RECOMMENDATION It is recommended that the Board not approve any routing
East San Fernando Valley Transit Corridor. TAC Briefing December 4, 2013
 East San Fernando Valley Transit Corridor TAC Briefing December 4, 2013 Overview Measure R Project Long Range Transportation Plan Reserves $170.1 Million 2018 Revenue Operations Date Coordination with
Troost Corridor Transit Study
 Troost Corridor Transit Study May 23, 2007 Kansas City Area Transportation Authority Agenda Welcome Troost Corridor Planning Study Public participation What is MAX? Survey of Troost Riders Proposed Transit
Alternatives Analysis Findings Report
 6.0 This chapter presents estimates of the potential capital, operations and maintenance costs associated with the alternatives carried forward for detailed evaluation. The methodology used to develop
Southern California - CHSRA
 CALIFORNIA HIGH-SPEED RAIL Michael Gillam, Deputy Program Director Southern California - CHSRA CMAA - Construction Management Association of America July 19, 2012 CALIFORNIA S HIGH-SPEED TRAIN SYSTEM Largest
Downtown Lee s Summit Parking Study
 Downtown Lee s Summit Parking Study As part of the Downtown Lee s Summit Master Plan, a downtown parking and traffic study was completed by TranSystems Corporation in November 2003. The parking analysis
Preliminary Definition of Alternatives. 3.0 Preliminary Definition of Alternatives
 3.0 What preliminary alternatives are being evaluated? The alternatives for the East San Fernando Valley Transit Corridor project that were considered for screening include the No Build Alternative, Transportation
TRAVEL DEMAND FORECASTS
 Jiangxi Ji an Sustainable Urban Transport Project (RRP PRC 45022) TRAVEL DEMAND FORECASTS A. Introduction 1. The purpose of the travel demand forecasts is to assess the impact of the project components
TEXAS CITY PARK & RIDE RIDERSHIP ANALYSIS
 TEXAS CITY PARK & RIDE RIDERSHIP ANALYSIS This document reviews the methodologies and tools used to calculate the projected ridership and parking space needs from the proposed Texas City Park & Ride to
West Santa Ana Branch Transit Corridor. Informational Briefing Gateway Cities Service Council April 13, 2017
 West Santa Ana Branch Transit Corridor Informational Briefing Gateway Cities Service Council April 13, 2017 Project Study Area 98 square miles 20 individual cities plus unincorporated LA County 1.2 million
Mobility Corridor Updates. Transit & Active Transportation Projects
 Mobility Corridor Updates Transit & Active Transportation Projects Manjeet Ranu, SEO East San Fernando Valley Transit Corridor Metro Board LPA selection: June 2018 Recently awarded $200 million in Senate
Sepulveda Pass Corridor Systems Planning Study
 Los Angeles County Metropolitan Transportation Authority Sepulveda Pass Corridor Systems Planning Study Streets and Freeways Subcommittee January 17, 2013 1 Sepulveda Pass Study Corridor Extends for 30
EXECUTIVE SUMMARY. The following is an outline of the traffic analysis performed by Hales Engineering for the traffic conditions of this project.
 EXECUTIVE SUMMARY This study addresses the traffic impacts associated with the proposed Shopko redevelopment located in Sugarhouse, Utah. The Shopko redevelopment project is located between 1300 East and
Waco Rapid Transit Corridor (RTC) Feasibility Study
 Feasibility Study") Waco Rapid Transit Corridor (RTC) Feasibility Study Chris Evilia, Director of Waco Metropolitan Planning Organization Allen Hunter, General Manager Waco Transit System Jimi Mitchell, Project Manager AECOM
Waco Rapid Transit Corridor (RTC) Feasibility Study Chris Evilia, Director of Waco Metropolitan Planning Organization Allen Hunter, General Manager Waco Transit System Jimi Mitchell, Project Manager AECOM
Green Line Long-Term Investments
 Enhancements Short-term improvements to keep Austin moving. Investments Long-term projects to support our future. Mobility Hubs MetroRapid MetroRail MetroExpress Connectors Circulators Project Connect
6/11/2018. June 7, Item #1 CITIZENS PARTICIPATION
 June 7, 2018 Item #1 CITIZENS PARTICIPATION 1 Item #2 APPROVAL OF MINUTES Item #3 TRAC GOALS, FRAMEWORK & AGENDA REVIEW 2 COMMITTEE GOALS Learn about Southern Nevada s mobility challenges, new developments
Traffic and Toll Revenue Estimates
 The results of WSA s assessment of traffic and toll revenue characteristics of the proposed LBJ (MLs) are presented in this chapter. As discussed in Chapter 1, Alternatives 2 and 6 were selected as the
Kenosha-Racine-Milwaukee (KRM)
") Kenosha-Racine-Milwaukee (KRM) Commuter Rail #147925 November 6, 2009 1 Guidance of KRM Commuter Rail Studies Intergovernmental Partnership Technical Steering Committee Temporary and Limited Authority
Kenosha-Racine-Milwaukee (KRM) Commuter Rail #147925 November 6, 2009 1 Guidance of KRM Commuter Rail Studies Intergovernmental Partnership Technical Steering Committee Temporary and Limited Authority
King Soopers #116 Thornton, Colorado
 Traffic Impact Study King Soopers #116 Thornton, Colorado Prepared for: Galloway & Company, Inc. T R A F F I C I M P A C T S T U D Y King Soopers #116 Thornton, Colorado Prepared for Galloway & Company
I-20 EAST TRANSIT INITIATIVE Tier 1 and Tier 2 Alternatives Screening Report EXECUTIVE SUMMARY
 EXECUTIVE SUMMARY The purpose of this report is to document the results of the Tier 1 and Tier 2 Screening of alternatives for the I-20 East Transit Initiative. The two-tier screening process presented
ACKNOWLEDGMENTS PROJECT STAFFING
 ACKNOWLEDGMENTS This report was authorized by the Coachella Valley Association of Governments and prepared by Schiermeyer Consulting Services with assistance from Transportation Planning Services. Members
TABLE OF CONTENTS EXECUTIVE SUMMARY...1 INTRODUCTION...3 PROJECTED FUTURE GROWTH...3 ROADWAY IMPROVEMENT PROJECTS...4 POTENTIAL FUNDING SOURCES...
 Transportation Impact Fee Study September 2014 TABLE OF CONTENTS EXECUTIVE SUMMARY...1 INTRODUCTION...3 PROJECTED FUTURE GROWTH...3 ROADWAY IMPROVEMENT PROJECTS......4 POTENTIAL FUNDING SOURCES...7 PROPOSED
Speaker Information Tweet about this presentation #TransitGIS
 Making the Case for Transit: the Transit Competitiveness Index Title William E. Walter, GISP Speaker Information Tweet about this presentation #TransitGIS Understanding Conditions in Each Travel Market
Introduction and Background Study Purpose
 Introduction and Background The Brent Spence Bridge on I-71/75 across the Ohio River is arguably the single most important piece of transportation infrastructure the Ohio-Kentucky-Indiana (OKI) region.
Caltrain Business Plan
 Caltrain Business Plan FEBRUARY 2019 LPMG February 28, 2019 Caltrain Business Plan Project Update 2 3 What is the Caltrain Business Plan? What Why Addresses the future potential of the railroad over the
METRO Orange Line BRT American Boulevard Station Options
 METRO Orange Line BRT American Boulevard Station Options Bloomington City Council Work Session November 18, 2013 Christina Morrison BRT/Small Starts Project Office Coordinating Planning and Design AMERICAN
San Francisco to San Jose Preliminary Alternatives Analysis
 San Francisco to San Jose High-Speed Train Project EIR/EIS San Francisco to San Jose Preliminary Alternatives Analysis April 15, 2010 Page 1 Largest Public Transportation Project in U.S. History 800 miles
The capital cost estimates do not include allowances for: ROW acquisition. Third-party mitigation works. Hazardous materials handling.
 Mode Selection Report 7 Cost Evaluation The cost evaluation criteria used in the evaluation of the transit modes are: Capital cost. operating costs. Fare revenue. Net cost per passenger/passenger-mile.
PRESENTATION Metro s Streets & Freeways Subcommittee
 PRESENTATION Metro s Streets & Freeways Subcommittee Los Angeles County Metro s 2011 Interstate 210 Truck Origin & Destination (O D) Study Presented by: Fred Minagar MINAGAR & ASSOCIATES, INC. October
Alpine Highway to North County Boulevard Connector Study
 Alpine Highway to North County Boulevard Connector Study prepared by Avenue Consultants March 16, 2017 North County Boulevard Connector Study March 16, 2017 Table of Contents 1 Summary of Findings... 1
Town of Londonderry, New Hampshire NH Route 28 Western Segment Traffic Impact Fee Methodology
 Town of Londonderry, New Hampshire NH Route 28 Western Segment Traffic Impact Fee Methodology Prepared by the Londonderry Community Development Department Planning & Economic Development Division Based
BERKELEY DOWNTOWN AREA PLAN PROGRAM ENVIRONMENTAL IMPACT REPORT TRAFFIC IMPACT ANALYSIS
 BERKELEY DOWNTOWN AREA PLAN PROGRAM ENVIRONMENTAL IMPACT REPORT TRAFFIC IMPACT ANALYSIS Prepared for: City of Berkeley Prepared by: REVISED JANUARY 9, 2009 Berkeley Downtown Area Plan Program EIR Traffic
REALIZING THE AIR QUALITY BENEFITS OF PORT INFRASTRUCTURE PROJECTS. A Case Study of the Alameda Corridor
 REALIZING THE AIR QUALITY BENEFITS OF PORT INFRASTRUCTURE PROJECTS A Case Study of the Alameda Corridor April 29, 25 Dr. Margaret Lobnitz, Weston Solutions, Inc. 1 BACKGROUND In mid-198 s, growing concern
BROWARD BOULEVARD CORRIDOR TRANSIT STUDY
 BROWARD BOULEVARD CORRIDOR TRANSIT STUDY FM # 42802411201 EXECUTIVE SUMMARY July 2012 GOBROWARD Broward Boulevard Corridor Transit Study FM # 42802411201 Executive Summary Prepared For: Ms. Khalilah Ffrench,
Unified Corridor Investment Study DRAFT Step 2 Scenario Analysis Report
 Unified Corridor Investment Study DRAFT Step 2 Scenario Analysis Report REVISIONS 1. Table 39: New Public Investments for Operation and Maintenance Costs 2. Appendix A-10: Passenger Rail Service - Operations
Chapter 7: Travel Demand Analysis. Chapter 8. Plan Scenarios. LaSalle Community Center. Image Credit: Town of LaSalle
 Chapter 7: Travel Demand Analysis Chapter 8 Plan Scenarios LaSalle Community Center. Image Credit: Town of LaSalle 164 Chapter 8: Plan Scenarios Moving Ahead for Progress in the 21 st Century Act (MAP
Sepulveda Pass Corridor Systems Planning Study Final Compendium Report. Connecting the San Fernando Valley and the Westside
 Los Angeles County Metropolitan Transportation Authority November 2012 Connecting the San Fernando Valley and the Westside Interstate 405 Sepulveda Pass THIS PAGE INTENTIONALLY LEFT BLANK Sepulveda Pass
Community Meetings June 2018
 Community Meetings June 2018 1 Welcome and Agenda Thank you for joining us! 6:00 pm Open House 6:30 pm Welcome & Presentation 7:00 pm Q&A 7:15 pm Open House Resumes 8:00 pm Meeting Concludes 2 Purpose
Welcome and Agenda. Thank you for joining us! 6:00 pm Open House. 6:30 pm Welcome & Presentation. 7:00 pm Q&A. 7:15 pm Open House Resumes
 1 Welcome and Agenda Thank you for joining us! 6:00 pm Open House 6:30 pm Welcome & Presentation 7:00 pm Q&A 7:15 pm Open House Resumes 8:00 pm Meeting Concludes 2 Purpose of this Meeting Introduce project
Subarea Study. Manning Avenue (CSAH 15) Corridor Management and Safety Improvement Project. Final Version 1. Washington County.
 Corridor Management and Safety Improvement Project. Final Version 1. Washington County.") Subarea Study Manning Avenue (CSAH 15) Corridor Management and Safety Improvement Project Final Version 1 Washington County June 12, 214 SRF No. 138141 Table of Contents Introduction... 1 Forecast Methodology
Subarea Study Manning Avenue (CSAH 15) Corridor Management and Safety Improvement Project Final Version 1 Washington County June 12, 214 SRF No. 138141 Table of Contents Introduction... 1 Forecast Methodology
Figure 2-14: Existing Bus Routing at Irwindale Station
 494 W oothill Blvd 69 N Irwindale Ave 185 Irwindale E 1st St 3 6 feet igure 2-14: Existing Bus Routing at Irwindale 39 Proposed Bus Route 494 W oothill Blvd Proposed Discontinued Bus Route Proposed New
Appendix B: Travel Demand Forecasts July 2017
 Appendix B: Travel Demand Forecasts July 2017 Table of Contents 1 Introduction... 2 2 Model Review and Updates... 2 2.1 Overview of Smart Moves Model ( City of London Model )... 2 2.1.1 Network and Zone
FREQUENTLY ASKED QUESTIONS
 FREQUENTLY ASKED QUESTIONS 2018 What is the More MARTA Atlanta program? The More MARTA Atlanta program is a collaborative partnership between MARTA and the City of Atlanta to develop and implement a program
Successful Passenger Rail in the State of California
 Successful Passenger Rail in the State of California Texas Transportation Forum Austin, Texas Eugene K. Skoropowski, Managing Director Capitol Corridor Joint Powers Authority (CCJPA) Oakland, California
Ohio Passenger Rail Development. Northwest Ohio Passenger Rail Association
 Ohio Passenger Rail Development Northwest Ohio Passenger Rail Association Ohio Rail Development Commission June 11, 2010 Ohio Strategy Establish the Market Grow the Market Capture the Value of the Market
TABLE OF CONTENTS SECTION PAGE. Executive Summary... xii
 TABLE OF CONTENTS SECTION PAGE Executive Summary... xii 1.0 Introduction... 1 1.1 Study Area... 2 1.2 Traffic Impact Analysis Scenarios... 4 1.3 Study Area - City of Orange... 4 2.0 Project Description
The Eastern Connector Study November, 2007 planning for the future
 The Eastern Connector Study November, 2007 planning for the future In late 2006, Albemarle County and the City of Charlottesville jointly initiated the Eastern Connector Corridor Study. The Project Team
The Boston South Station HSIPR Expansion Project Cost-Benefit Analysis. High Speed Intercity Passenger Rail Technical Appendix
 The Boston South Station HSIPR Expansion Project Cost-Benefit Analysis High Speed Intercity Passenger Rail Technical Appendix Prepared by HDR August 5, 2010 The Boston South Station HSIPR Expansion Project
Bedford/Franklin Regional Rail Initiative (BFRRI) Rationale for a Bedford Amtrak Station June 30, 2015
 Rationale for a Bedford Amtrak Station June 30, 2015") Bedford/Franklin Regional Rail Initiative (BFRRI) Rationale for a Bedford Amtrak Station June 30, 2015 SUBJECT: Bedford Amtrak Station Why an Amtrak station in Bedford makes sense. I. BACKGROUND: In January
Bedford/Franklin Regional Rail Initiative (BFRRI) Rationale for a Bedford Amtrak Station June 30, 2015 SUBJECT: Bedford Amtrak Station Why an Amtrak station in Bedford makes sense. I. BACKGROUND: In January
CITY OF LONDON STRATEGIC MULTI-YEAR BUDGET ADDITIONAL INVESTMENTS BUSINESS CASE # 6
 2016 2019 CITY OF LONDON STRATEGIC MULTI-YEAR BUDGET ADDITIONAL INVESTMENTS BUSINESS CASE # 6 STRATEGIC AREA OF FOCUS: SUB-PRIORITY: STRATEGY: INITIATIVE: INITIATIVE LEAD(S): BUILDING A SUSTAINABLE CITY
INDUSTRIAL DEVELOPMENT
 INDUSTRIAL DEVELOPMENT Traffic Impact Study Plainfield, Illinois August 2018 Prepared for: Seefried Industrial Properties, Inc. TABLE OF CONTENTS Executive Summary 2 Introduction 3 Existing Conditions
QUALITY OF LIFE EXECUTIVE SUMMARY REPORT I O N S TAT I O N
 QUALITY OF LIFE EXECUTIVE SUMMARY REPORT UN I O N S TAT I O N T R AV E L by TR A I N Published September 2017 2015 PROGRESS MAP This document reports FasTracks progress through 2015 BACKGROUND RTD The
EXECUTIVE SUMMARY. Introduction
 EXECUTIVE SUMMARY Introduction The purpose of this study is to ensure that the Village, in cooperation and coordination with the Downtown Management Corporation (DMC), is using best practices as they plan
CITY OF ANN ARBOR, MICHIGAN 301 E. Huron St., P.O. Box 8647 Ann Arbor, Michigan
 Date: Wednesday, June 18, 2014 Location: Ann Arbor District Library Attendees: 14 citizen attendees Ann Arbor Station Environmental Review Citizen Working Group Meeting Notes Meeting #3 The third meeting
RE: A Traffic Impact Statement for a proposed development on Quinpool Road
 James J. Copeland, P.Eng. GRIFFIN transportation group inc. 30 Bonny View Drive Fall River, NS B2T 1R2 May 31, 2018 Ellen O Hara, P.Eng. Project Engineer DesignPoint Engineering & Surveying Ltd. 200 Waterfront
Submission to Greater Cambridge City Deal
 What Transport for Cambridge? 2 1 Submission to Greater Cambridge City Deal By Professor Marcial Echenique OBE ScD RIBA RTPI and Jonathan Barker Introduction Cambridge Futures was founded in 1997 as a
Background Information about the Metrobus 29 Lines Study
 Background Information about the Metrobus 29 Lines Study Questions Overview of Existing Service Q. Why is the study being conducted? A. The 29 Lines provide an important connection between Annandale and
APPENDIX B Traffic Analysis
 APPENDIX B Traffic Analysis Rim of the World Unified School District Reconfiguration Prepared for: Rim of the World School District 27315 North Bay Road, Blue Jay, CA 92317 Prepared by: 400 Oceangate,
3.1 Introduction Transportation Elements and Study Area Meeting the Need for the Project
 Chapter 3 Transportation Environment and Consequences 3. Introduction This chapter summarizes the characteristics of the transportation system in the East Link Project vicinity and discusses potential
Public Meeting. City of Chicago Department of Transportation & Department of Housing and Economic Development
 Public Meeting City of Chicago Department of Transportation & Department of Housing and Economic Development Funded by Regional Transportation Authority September 12, 2011 In partnership with Presentation
Appendix H TRAFFIC IMPACT ANALYSIS
 Appendix H TRAFFIC IMPACT ANALYSIS Teichert Boca Quarry Expansion Traffic Impact Analysis Prepared for Teichert Aggregates Prepared by TRANSPORTATION CONSULTANTS, INC. LSC Transportation Consultants, Inc.
Denver Car Share Program 2017 Program Summary
 Denver Car Share Program 2017 Program Summary Prepared for: Prepared by: Project Manager: Malinda Reese, PE Apex Design Reference No. P170271, Task Order #3 January 2018 Table of Contents 1. Introduction...
THE WILSHIRE CORRIDOR: RAIL AND ITS ALTERNATIVES. Prepared By: Jacki Murdock Transportation and Environmental Planner
 THE WILSHIRE CORRIDOR: RAIL AND ITS ALTERNATIVES Prepared By: Jacki Murdock Transportation and Environmental Planner December 13 th, 2012 Overview Characteristics of Wilshire Boulevard Overview of the
Estimation of Average Trip Lengths To and From Century City Center Century City, California
 MEMORANDUM TO: FROM: LSA Associates, Inc. Jonathan Chambers, P.E. DATE: October 6, 2014 RE: Estimation of Average Trip Lengths To and From Century City Center Century City, California Ref: J1076 This memorandum
High Speed Rail Conference
 High Speed Rail Conference Denver, October 23, 2012 FAST START PROJECT FOR PENINSULA HIGH-SPEED RAIL Kern Jacobson InfraConsult LLC Objective Evaluate incremental approach to expedite high-speed rail to
Abstract. Executive Summary. Emily Rogers Jean Wang ORF 467 Final Report-Middlesex County
 Emily Rogers Jean Wang ORF 467 Final Report-Middlesex County Abstract The purpose of this investigation is to model the demand for an ataxi system in Middlesex County. Given transportation statistics for
2. Valley Circle Boulevard/Andora Avenue/Baden Avenue and Lassen Street
 IV.J TRANSPORTATION 1. INTRODUCTION This section presents an overview of the existing traffic and circulation system in and surrounding the project site. This section also discusses the potential impacts