Tram Passenger Survey (TPS) Midland Metro
|
|
|
- Ashlie Hutchinson
- 6 years ago
- Views:
Transcription
1 Tram Passenger Survey (TPS) Midland Metro Rosie Giles Tel: 8 Rosie.Giles@transportfocus.org.uk results March 8 Insight Team, Transport Focus, Fleetbank House, - Salisbury Square, London, ECY 8JX
2 Contents Overview Context to the survey Summary of findings The findings Experience and opinions of the journey Waiting at the stop The tram 9 Negative experiences during the journey Passengers suggested improvements 8 Opinion of trams in local area Further information Appendix : Passenger and journey context Appendix : Further detail on survey background and method Appendix : Questionnaire 8
3 Tram Passenger Survey (TPS) Midland Metro Context to the survey
4 Background to the survey The Tram Passenger Survey (TPS) The TPS provides a consistent, robust measurement of passenger satisfaction with tram services in Britain It also informs our understanding of barriers to (greater) tram use, how to encourage greater use, and how to improve the passenger experience Comparisons can also be made with passenger experiences on buses and trains, as measured by the Bus Passenger Survey (BPS) and National Rail Passenger Survey (NRPS) The TPS covered tram services in Manchester, Birmingham, Blackpool, Nottingham, Sheffield and Glasgow*. Edinburgh Trams was covered in -. The survey method Passengers are approached while making a journey; they answer the survey about that journey specifically The questionnaire is self-completion, with passengers offered a choice of online or paper Interviewers approached passengers on all days of the week between am and pm, between 8 September and 8 December surveys were completed for Midland Metro in autumn For further details of the survey method, see Appendix *Glasgow Subway was included for the first time in. Due to the difference of this Subway network compared to tram networks it is excluded from this report, as well as any All Networks results, and can be found in a separate report.
5 The Midland Metro network in context Midland Metro Manchester The Network line stops miles lines 9 stops miles Passenger Journeys.* million.** million Ticket Purchasing TVMs at stops Conductors on board TVMs at stops Conductors on board Information at stops Frequency Engineering disruptions/other notes Info boards at some stops (TTs, fares) Passenger Info Displays Info boards all stops (TTs, fares) Passenger Info Displays (Not all stops on Bury and Altrincham lines) Mon-Sat: every - mins Sun: mins Mon-Sat: every - mins Sun: - mins Network extension to Grand Central (New Street Station) opened on May and was included in the TPS Network improvement works meant that two tram stops at the Wolverhampton end of the route were closed for the duration of fieldwork in (Wolverhampton St George s and The Royal) Airport line opened late, covered for first time in Exchange Square and link with Victoria opened in December Increasing use of double carriage trams Second City Crossing opened in February enabling quicker journeys across the city A tram collision on the th November affected two shifts which were rescheduled due to no trams running line 8 stops miles.* million TVMs at stops Conductors on board Info boards at stops (TTs, fares) Passenger Info Displays Mon-Sat: every - mins Sun: - mins Blackpool illuminations Sep to Nov Heritage trams operate bank holidays, weekends and summer; not covered in this research No significant issues affected fieldwork Nottingham lines stops miles.* million TVMs at stops Conductors on board Info boards all stops (TTs, fares) Passenger Info Displays Mon-Sat: every - mins Sun: - mins No significant issues affecting fieldwork Sheffield lines 8 stops 8 miles.* million TVMs at stops Conductors on board Info boards at stops (TTs, fares) Passenger Info Displays Mon-Sat: every - mins Sun: - mins No significant issues affecting fieldwork *Source: Department for Transport, Passenger journeys on light rail and trams by system in England, / **Source: Direct from operator
6 Tram Passenger Survey (TPS) Midland Metro Key findings

7 Figures shown are total very or fairly satisfied. Last year s figure is shown in grey

8 Passenger experience: a snapshot Overall journey satisfaction: trend over time Overall journey satisfaction: All networks* Blackpool Metrolink Midland Metro Nottingham Sheffield Midland Metro 9 All Networks* Manchester 89 Nottingham 9 Sheffield 9 *All networks includes different networks each year. and exclude Edinburgh Trams. - exclude Glasgow Subway 8


9 What makes a satisfactory or great journey on Midland Metro? The top factors linked to overall journey satisfaction* What makes a satisfactory journey? What makes a great journey? % % % % % Information throughout journey Personal safety throughout journey Access to the tram stop *Key Driver Analysis looks at fare-paying passengers overall journey satisfaction response and their response to the individual satisfaction measures in the survey (including value for money), which have been grouped into themes based upon a statistical analysis of the responses. The left hand chart shows which themes most differentiate between those not satisfied and satisfied overall making a journey satisfactory. The right hand chart shows which themes most differentiate between those fairly and very satisfied overall making a great journey. The analysis combines data from and surveys to increase robustness. It also excludes satisfaction measures relating to tram staff; due to differences in staff availability across the networks not all TPS questionnaires feature questions about tram staff. In order to run the analysis in a consistent and practical manner all staff measures have been excluded. See appendix for a full explanation of the analysis to identify factors linked to overall journey satisfaction. 9
10 Passenger experience in the Midlands : across the network Satisfaction with key measures: Overall journey Value for Money Punctuality Overall stop All Networks Satisfaction with other measures which make a satisfactory or great journey: Space to sit/ stand on board Comfort of the seats Amount of personal space on board Provision of grab rails Temperature on board Length of time waiting for the tram *Drivers of satisfaction differ by network. The most common drivers across TPS are shown here Statistically significant increase since (All networks) No change (All networks) Statistically significant decrease since (All networks)
11
12 Midland Metro : summary of key findings () 9 per cent of Midland Metro passengers are satisfied with their journey overall. This is slightly lower than last year, but not significantly so (: 9 per cent). Overall satisfaction is higher than the same measure on the Bus Passenger Survey in the West Midlands (8 per cent) Overall satisfaction with the journey is lower amongst males (8 per cent), younger age groups (88 per cent for those aged -) and commuters (88 per cent) For Midland Metro the key factor which makes journeys both satisfactory and great is the on board environment and comfort of the tram. Satisfaction has remained quite consistent with last year but the comfort of the seats continues to be the lowest rated attribute by some way (8 per cent satisfied) The next most important factor which makes a journey on Midland Metro satisfactory is the timeliness of the tram. Satisfaction with both punctuality and the length of time waiting for the tram have increased significantly (punctuality increases from 8 per cent in to 9 per cent; wait time increased from 8 per cent to 9 per cent) The second most important factor which makes a journey great is personal safety during the journey. At the tram stop personal safety is the second lowest rated aspect (8 per cent satisfied); on board satisfaction with personal security is a little higher (8 per cent satisfied) Amongst fare paying passengers, 8 per cent are satisfied with value for money. Similar to overall journey satisfaction, younger passengers and commuters are least satisfied ( per cent amongst those aged - and per cent of commuters)
13 Midland Metro : summary of key findings () When evaluating value for money the most important factor is the cost of the tram versus other modes of transport per cent of passengers experienced a delay in ( per cent in ), and when delays were experienced they lasted minutes on average per cent of passengers spontaneously mentioned an improvement that could have been made to their journey. The most common improvement related to the design, comfort and condition of the tram Other improvements mentioned relate to the seating and capacity on board, as well as the frequency of trams and the route Almost three quarters of passengers (9 per cent) are using Midland Metro to commute to work or education ( per cent for work and per cent for education) The majority of passengers are travelling with a season ticket ( per cent) The profile of passengers travelling on Midland Metro is quite young, with per cent falling into the - age group. This is a little lower than, but not significantly so
14 Tram Passenger Survey (TPS) Midland Metro Experience and opinions of the journey
15 Experience and opinions of the journey: summary Satisfaction with today s journey: Overall journey 8 8 Value for money Punctuality On-vehicle journey time Buses in West Midlands
16 Who are satisfied and not satisfied passengers? Midland Metro Midland Metro Very satisfied passengers are more likely to: Fairly satisfied passengers are more likely to: Not satisfied passengers are more likely to: Journey purpose Be split between commuting and leisure journeys (% and % respectively) Be commuting (8%) Be commuting (8%) Time of travel Be travelling during off-peak weekday times (%) Be travelling at peak times (% peak; % peak morning; % peak afternoon) Be travelling at peak times (8%), particularly on peak morning journeys (%) more than those who are fairly satisfied Frequency of travel Be travelling the least frequently (%) Be travelling less frequently than those who are no satisfied (%) Travel the most frequently (8%) more than very/fairly satisfied Access to private transport Have moderate access to private transport (%) Have the most easy access to private transport (%) Have easy to moderate access to private transport (8%; % easy ) less than fairly satisfied ( easy ) Age and gender Be from a relatively even set of age groups (% -; % -9; % +) with a close gender split (female %; male %) Be between - (%) with a close gender split (female %; male %) Be between - (%) and primarily male (%) Trust in the operator Have high levels of trust (8% rated - on a -point scale) Have medium to high levels of trust (9% rated - on a -point scale) Have low levels of trust (8% rated - on a -point scale) Base: those very satisfied with journey overall () Base: those fairly satisfied with journey overall () Base: those neither/nor, fairly dissatisfied or very dissatisfied with journey overall (9)
17 Overall satisfaction (%) by gender and age Total fairly/very satisfied All passengers Male Female Age to Age to Age Very satisfied Fairly satisfied Neither/nor Fairly dissatisfied Very dissatisfied Q. Overall, taking everything into account from the start to the end of this tram journey, how satisfied were you with your tram journey today? Base: All passengers 9
18 Overall satisfaction (%) by Passenger type Total fairly/very satisfied All passengers Fare-payers Free pass holders Commuting Not commuting Very satisfied Fairly satisfied Neither/nor Fairly dissatisfied Very dissatisfied Q. Overall, taking everything into account from the start to the end of this tram journey, how satisfied were you with your tram journey today? Base: All passengers 9 8
19 Value for money (%) fare-payers only Total fairly/very satisfied All passengers 8 8 Age to 8 9 Age to Commuting 8 8 Not commuting 8 Very satisfied Fairly satisfied Neither/nor Fairly dissatisfied Very dissatisfied Q. How satisfied were you with the value for money of your journey? Base: All fare-paying passengers 9
20 What influenced value for money rating (%) Those satisfied with value for money Those not satisfied with value for money Cost tram versus other transport Cost for distance travelled Comfort/quality for the fare paid Fare compared to everyday items Other reason NOTE: Those not satisfied with value for money includes respondents answering Neither satisfied nor dissatisfied Q. What had the biggest influence on the value for money rating you gave in the previous question? Base: All fare-paying passengers
21 Punctuality and on-vehicle journey time Total fairly/very satisfied Satisfaction with punctuality Satisfaction with onvehicle journey time Q. How satisfied were you with each of the following Punctuality? Base: All passengers Q. How satisfied were you with the amount of time your journey on the tram took? Base: All passengers
22 Tram Passenger Survey (TPS) Midland Metro Waiting at the stop

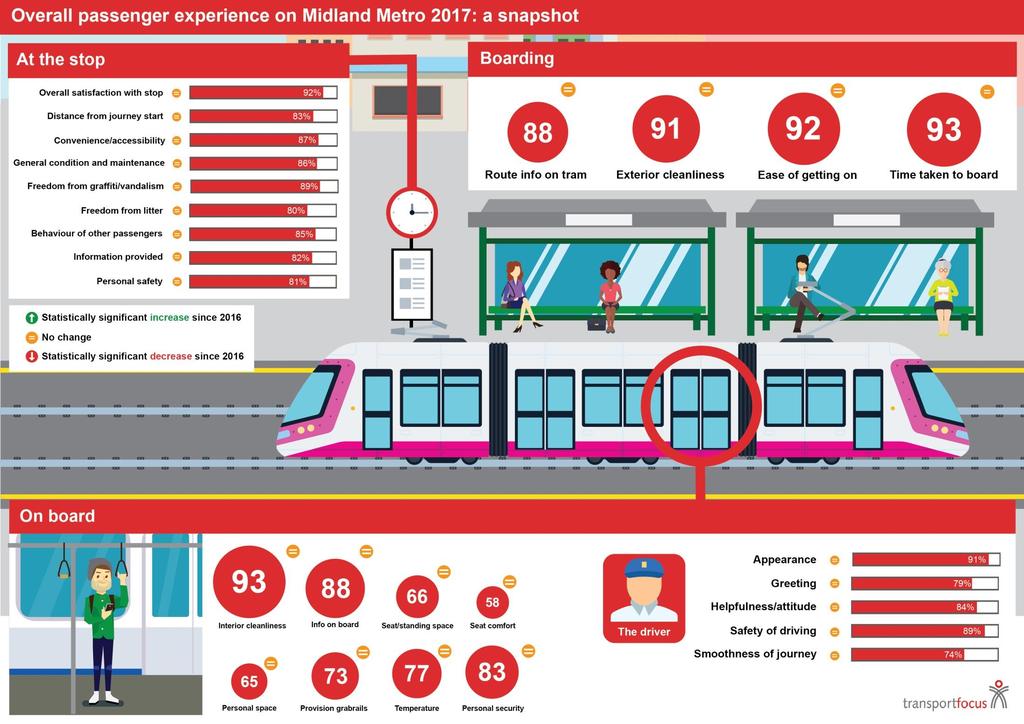
23 Waiting at the stop: summary Overall satisfaction with stop 9 Buses In the West Midlands Waiting times: Satisfaction: expected waiting time Expected wait time 9 mins Buses in the West Midlands 8 mins Distance from journey start Convenience/accessibility Actual reported wait time mins 8 mins General condition and maintenance 8 Checking tram information: Freedom from graffiti/vandalism Freedom from litter 89 8 Passengers who checked tram time 8 9 Behaviour of other passengers Information provided Personal safety N/A* Info sources used before arriving at stop Info sources used at stop Online tram times and paper timetable Electronic display at the stop % Live position updates and online timetable Digital display *Not asked in BPS Among those that didn t check 89% knew the trams ran frequently % knew the buses ran frequently
24 Satisfaction with the tram stop (%) Total fairly/very satisfied Overall satisfaction - tram stop Freedom from graffiti/vandalism Convenience/accessibility General condition/maintenance Behaviour of other passengers Distance from journey start Information provided at the stop Personal safety at stop Freedom from litter Very satisfied Fairly satisfied Neither/nor Fairly dissatisfied Very dissatisfied Q. Overall, how satisfied were you with the tram stop? & Q. Thinking about the tram stop itself, how satisfied were you with the following: Base: All passengers 8
25 Satisfaction with waiting time (%) Total fairly/very satisfied Length of time had to wait Very satisfied Fairly satisfied Neither/nor Fairly dissatisfied Very dissatisfied Total about the same or a little/much less than expected Actual versus expected waiting time Much less A little less About expected A little longer Much longer Don't know Q. How satisfied were you with each of the following? & Q. Thinking about the time you waited for the tram today, was it [ ] than expected? Base: All passengers 8
26 Expected and reported waiting times Under mins mins 8 Expected tram waiting time - mins Average expected waiting time. minutes (:.8 minutes) - mins Over mins Under mins - mins Reported tram waiting time - mins Average reported waiting time. minutes (:.9 minutes) - mins Over mins Q. Approximately how long did you expect to wait for the tram? & Q. Approximately, how long did you wait for your tram Base: All passengers
27 How passengers checked tram times Leaflet/paper timetable Online 8 8 Before Leaving the tram stop Live tram locator/timings 9 Disruption updates via social media Other Electronic display Information posters At the tram stop Online Live tram locator/timings Disruption updates via social media Other Q. Did you check any of the following to find out when the tram was meant to arrive? Base: All passengers
28 Why passengers did not check tram times Knew the trams ran frequently on this route 89 Already knew arrival times 8 Could not find the information Didn't have time 9 Did not matter to me when tram was meant to arrive N/A* N/A* N/A* Did not know when tram was meant to arrive N/A** N/A** Q. If you did not check to find out when the tram was meant to arrive, why was this? Base: All not checking tram arrival information *Not asked before **Not asked in and 8
29 Tram Passenger Survey (TPS) Midland Metro The tram 9
30 The tram: summary Start of journey Buses in the West Midlands On board Buses in the West Midlands The driver Buses in the West Midlands Route info on tram 88 8 Interior cleanliness 9 Appearance 9 8 Exterior cleanliness 9 8 Info on board 88 Greeting 9 Ease getting on 9 89 Seat/standing space 8 Helpfulness/attitude 8 Time taken to board 9 8 Seat comfort 8 Safety of driving 89 8 Personal space Smoothness journey Provision grabrails 8 Temperature Personal security 8 8
31 Satisfaction with start of journey (%) Total fairly/very satisfied Time taken to board Ease of getting on/off tram Exterior cleanliness Route/destinati on information on tram Very satisfied Fairly satisfied Neither/nor Fairly dissatisfied Very dissatisfied Q. Thinking about when the tram arrived, please indicate how satisfied you were with the following: Base: All passengers
32 Satisfaction on the tram (%) Total fairly/very satisfied Interior cleanliness/co ndition Information provided inside the tram Personal security Temperature inside the tram Provision of grab rails Availability of seating or space to stand 9 8 Amount of personal space Comfort of the seats 8 9 Very satisfied Fairly satisfied Neither/nor Fairly dissatisfied Very dissatisfied Q. Thinking about whilst you were on the tram, please indicate how satisfied you were with the following: Base: All passengers 8
33 Satisfaction with tram staff/driver (%) Total fairly/very satisfied Appearance Safety of the driving Helpfulness/attitude Greeting/welcome Smoothness/freedom from jolting Very satisfied Fairly satisfied Neither/nor Fairly dissatisfied Very dissatisfied TPS: Q. Thinking about any tram staff you encountered on your journey, please indicate how satisfied you were with each of the following: Base: All passengers
34 Tram Passenger Survey (TPS) Midland Metro Negative experiences during the journey
35 Negative experiences during the journey: summary Passengers experiencing a delay to their journey Average length of delay (perceived) Most common cause of delay mins Tram failure* *Caution: small base () Passengers with worry or concern about others behaviour on board
36 Experience of delays (%) per cent ( ) of Midland Metro passengers experienced a delay (: per cent). Average length of delay was minutes ( ) * Signal/points failure 9 8 Tram waiting too long at signals Had to use bus replacement 9 Tram waiting too long at stops 8 Congestion/traffic jam 9 Tram failure Poor weather Time it took passengers to board 8 Planned engineering works Other No reason given for delay 8 N/A* Not sure 9 9 * No reason given for delay not asked in. Its addition could have caused the significant drops in the other factors TPS: Q. Why was your journey delayed? Base: All experiencing a delay *Caution: small base
37 Worry or concern at other passengers behaviour (%) All passengers 8 % worried/concerned of other passengers behaviour Male Female Age to Age to 9 Age Types of worrying/concerning behaviour (%) Feet on seats Passengers not moving out of priority seats Loud use of mobiles Passengers not paying fares Rowdy behaviour Passengers playing loud music Passengers under influence of alcohol Abusive or threatening behaviour Graffiti/vandalism Passengers under influence of drugs Smoking * Sample size of concerned passengers too small to report upon Q. Did other passengers behaviour give you cause to worry or make you feel uncomfortable during your journey? Base: All passengers 8 Q. Which of the following were the reasons for [other passengers behaviour causing you concern]? Base: All experiencing worrying/concerning behaviour (Caution small base) *Not asked in
38 Tram Passenger Survey (TPS) Midland Metro Passengers suggested improvements 8

39 Passengers suggested improvements: summary % of Midland passengers in had no suggestions for improvements of the % that did, the most common service areas for improvement were: Tram: Design/comfort/condition Seating and capacity Frequency/routes Tram staff Fares/tickets Passenger behaviour Tram stop Information about routes On-board amenities (Wi-Fi, tea/coffee etc.) Real time info./updates at stop Punctuality Journey times External factors (road works, congestion etc.) Comment about another journey Real time info./updates via online sources Disabled provision / Wheelchair provision etc. Other 8 Q. If something could have been improved on your tram journey today, what would it have been? Base: All suggesting an improvement - 9
40 Selected verbatim comments The chairs are very stiff, softer ones would be better. Loss of signal and internet when going through tunnels, some kind of signal booster or relay within the tunnels would help. Trams could be on time. More trams as they're too full. Rails damaged at Dartmouth/Dudley. Never get a seat -always too full. More frequent trams at rush hour. Not enough car park spaces. The route I take is peak commuting time. There are never any seats and the tram does become overcrowded. It would be great to have more trams running at peak times to alleviate this issue. To have more times for trams between am and 8am, as it is always packed. The drivers should use the intercom more often to update customers when things go wrong. Get customers to pay. More space for bags or laptop bags like on the trains. Wi-Fi (Edinburgh trams have free Wi-Fi on trams - Why don't we?). Sometimes the tram is too early, which means I miss it and get late for work. The tram should stay at stop until it's due to leave. Very expensive. The seats are very hard. People do push to get a seat and as I have a stick, I feel vulnerable. School children could take knapsacks off back instead of knocking me!! Real time tram information on app on mobile. Current Network West Midlands app only has timetabled departures, therefore, unknown of any delays before journey. Seating uncomfortable - too hard sitting minutes. Not enough seats. Tram too short. Passengers having to stand, if not get on at Grand Central.
41 Tram Passenger Survey (TPS) Midland Metro Opinion of trams in the local area
42 Opinion of trams in the local area: summary General opinion of services in area: Connections with other modes Ease of getting to local amenities Reliability Bus services in West Midlands (BPS) 8 Frequency 8 Range of payment options available 8 N/A* Ease of buying tickets 8 N/A* Range of tickets available N/A* *Not asked in BPS Q. And how satisfied are you overall with tram services for the following? Base: 9 Q. How would you rate tram services for the following? Base: 9
43 Satisfaction on the trams generally Total fairly/very satisfied Reliability** (running on time) Frequency (how often they run) Range of payment options available 8 8 N/A* N/A* N/A* Ease of buying ticket Range of tickets available 9 9 N/A* Very satisfied Fairly satisfied Neither/nor Fairly dissatisfied Very dissatisfied Total good/very good Connections with other modes of transport Ease of getting to local amenities Very good Good Neither/nor Poor Very poor Q. And how satisfied are you overall with tram services for the following: & Q: How would you rate your local tram services for the following: Base: All passengers 8 *Not asked before **Statement changed in from Punctuality to Reliability.
44 Proposed extensions and Midland Metro Alliance Awareness of extension proposals (%) Awareness of the further proposed extensions (%) Yes No Not stated Centenary Square Edgbaston Birmingham Eastside East Birmingham - Solihull Wednesbury Brierley Hill 9 Wolverhampton City Centre Awareness of Midland Metro Alliance (%) Yes No 8 Not stated Q. The Midland Metro has recently been extended into Birmingham City Centre. Are you aware of further proposed extensions? Base: All passengers - Q. Which of the following extensions are you aware of? Base: All aware of proposed extensions - Q. Are you aware of the Midland Metro Alliance? Base: All giving an answer -
45 Tram Passenger Survey (TPS) Midland Metro Appendix : the passenger and journey context

46 Midland Metro passengers: summary Overview of passenger demographics - Age -9 + Not stated 8 Disability 9 Yes No Not stated 8 Access to private transport Easy Moderate Limited/none Not stated Passengers postcodes relative to tram network
47 Passenger profile Tram Bus Age Over Not stated N/A N/A N/A N/A Access to private transport Easy 8 8 Moderate 8 Limited/none 9 Not stated Has a disability Yes 8 Ticket type Free pass holders 8 8 Fare-payers
48 Where Midland Metro tram passengers live B and higher 8 WV and higher 8 WV- Any WS 9 8 B- 9 B- 9 8 Any DY B- Any CV Any other 9 Q: What is your postcode? Base: All giving a postcode 8


49 Midland Metro journeys: summary () Frequency using trams in area Passenger journey details + days week Less often Journey purpose - days week 8 First time Commuting 9 - days a week Business Once a fortnight Leisure 9 Once a month 9


50 Midland Metro journeys: summary () Tickets used for today s journey Single/return 9 Fare-payer 8 Ticket type Season Other Free/fare-payers Free pass Mode permitted Tram only Multi-mode Purchased ticket via Ticket format Conductor Paper 9 Tram Operator Photocard Travel Shop Plastic card Other M-ticket
51 Midland Metro journeys: summary () Most used tram stops: journey start Grand Central 9 Bull Street Priestfield 9 Wednesbury Parkway 8 Bilston Central West Bromwich Central Wednesbury, Great Western Street Black Lane Most used tram stops: journey destination Bull Street 9 Grand Central West Bromwich Central Priestfield Bliston Central The Crescent St Paul s Jewellery Quarter Mode used to arrive at starting stop (all stops) On foot Car Bus 9 Train Other Mode used to travel on from destination stop (all stops) On foot Car Bus Train Other
52 Midland Metro journeys: summary () Journey direction Outward Weather on day of journey Return 9 Dry One way only Light rain Heavy rain Sitting/standing Other Had a seat Stood, would have liked seat Stood, happy to stand
53 Journey purpose Travelling to/from work Travelling to/from education Company business Personal business Health visit Shopping trip 9 Visit friends or relatives Leisure trip 8 9 Other Sub-total: Commuter 9 Sub-total: Business Sub-total: Leisure 9 8 Q. What is the main purpose of your tram journey today? Base: All passengers 8
54 Frequency of using Midland Metro or more days a week or days a week Once or twice a week Once a fortnight Once a month Less frequently 9 This is the first time Q. How often do you typically travel by tram? Base: All passengers 8
55 Ticket type and modes of transport permitted Sub-total: Single/return Single Return Sub-total: Season ticket/pass Day pass day/weekend days/ week days/ weeks weeks/ month Quarterly/ months year Free pass/journey Other ticket type Tram only Train and tram Bus and tram Train, bus and tram Q. What type of ticket/pass did you use for this tram journey today? Base: All passengers 8 Q. What modes of transport does your ticket allow you to travel on? Base: All passengers 9
56 Method of buying ticket and ticket format Ticket machine at stop* Conductor that day Travel shop Direct from the tram company Rail/bus company Local shop or post office Direct debit through work/college Direct from National Express* Other 9 9 N/A* 9 8 N/A* N/A* 9 8 N/A* N/A* 9 9 N/A* Paper ticket/pass 8 9 Photocard pass 8 Plastic card Ticket on mobile Other format *Not asked before Q. How did you buy that ticket or pass? Base: All fare-paying passengers Q. In what format was your ticket? Base: All passengers 9
57 Midland Metro stops used by passengers surveyed per cent of passengers were on an outward journey, 9 per cent on a return and per cent on a one-way trip (: per cent, per cent and per cent respectively) 9 per cent had a seat for their whole journey, while per cent said they had to stand but would have liked to have a seat (: per cent and per cent) Boarding* Alighting* Grand Central for New Street 9 N/A* N/A* N/A* Bull Street N/A* N/A* N/A* Priestfield 9 Wednesbury Parkway 8 West Bromwich Central 8 8 Bilston Central Black Lake Bradley Lane Bull Street 9 N/A* N/A* N/A* Grand Central for New Street 8 N/A* N/A* N/A* West Bromwich Central Bilston Central Priestfield The Crescent St. Paul s Jewellery Quarter *Network improvement works meant that Wolverhampton St George s and The Royal were closed for the duration of fieldwork in Q: Were you on your outward or return journey? Q. Did you get a seat on the tram? Q: At which stop did you board/leave this tram? Base: All passengers -
58 How got to and from the tram stop On foot 9 Cycled Car - dropped off/picked up Car - park and ride Car - parked elsewhere Taxi Bus/coach Train Tram Other 9 N/A* N/A* N/A* N/A* 8 8 N/A* N/A* N/A* N/A* 8 Got to tram stop Left tram stop * Not asked before Q: How did you get to/from the tram stop where you boarded/left the tram today? Base: All passengers - 8 8
59 Weather conditions when journey made Dry 8 Light rain Heavy rain Snow Foggy Icy Q. What was the weather like when you made your journey? Base: All passengers - 8 9
60 Reasons for choosing the tram Best way to get where I am going Quicker than other transport 8 More convenient than the car (e.g. parking) 8 8 Cheaper than the car Didn t have the option of travelling by other means Tram more comfortable than other transport Cheaper than other transport 8 9 For the experience of riding the tram N/A** Other **Not asked in Q. What was the main reason you chose to take the tram for this journey? Base: All passengers 9
61 Factors preventing more journeys being made Places reachable 8 9 Level of crowding Tram network improvement works 8 N/A* Cost of using trams Comfort of trams 9 Journey times 8 Reliability of trams 9 8 Concern for personal safety 8 Frequency of trams 9 Understanding the fares Understanding ticket machines *Not asked in. The addition of Tram network improvement works in TPS could have caused the significant drops in other factors Q. Have any of the following frequently stopped you making journeys by tram? (More than one answer permissible) Base: All previously using the tram

62 Tram Passenger Survey (TPS) Appendix Further details on survey background and method
63 Methodology fieldwork Midland Metro (TPS) Fieldwork: 8 September to 8 December (with a gap for half term from October to 9 October) Interviewer shifts: covered all days of the week and ran from am to pm. Each interviewer worked a three-hour shift; four hour shifts were conducted in a few cases. Method: Choice of paper or online self-completion questionnaire Sample size: interviews ( paper and online) In fieldwork took place between September to December Bus (BPS) data for West Midlands (TfWM) area Fieldwork: September to December Interviewer shifts: covered all days of the week and ran from am to pm. Each interviewer worked a three-hour shift Method: Choice of paper or online self-completion questionnaire Sample size: 98 interviews
64 Methodology data analysis Base definitions: All charts are based on those who gave an answer to an individual question. Those who either left the question blank or said don t know have been excluded from the base. For this reason the base sizes for those charts based on All passengers vary slightly between the different charts in this report. Significant changes are shown at the 9% confidence level. / / symbols are used throughout this report to indicate positive or negative significant changes. Weighting: this was based on passenger count information collected by the interviewer during each interviewer shift. The weighting matrix used the following weighting cells: Tram network: (for Manchester Metrolink, Nottingham Express Transit and Sheffield Supertram this was by line) Age: -, -9, + Gender: male, female Time/day travelled: weekday peak, weekday off peak and weekend The full details of the weighting matrix can be found in the TPS technical report. Waiver Transport Focus has taken care to ensure that the information contained in TPS is correct. However, no warranty, express or implied, is given as to its accuracy and Transport Focus does not accept any liability for error or omission. Transport Focus is not responsible for how the information is used, how it is interpreted or what reliance is placed on it. Transport Focus does not guarantee that the information contained in TPS is fit for any particular purpose.
65 Methodology themes that are affecting overall passenger satisfaction charts () The approach to identifying themes that affect overall passenger satisfaction is split into two stages. At the first stage, we took all individual satisfaction measures from the survey (apart from the overall journey satisfaction) and formed them into themes using a statistical technique known as factor analysis, which groups together those satisfaction measures that are responded to similarly within the data. For instance, where high or low scores are given for measure x, there tends to be a similar rating for measures y and z, so the factor or theme becomes A. Through this process we identified ten themes, which are shown below, alongside measures that formed each theme: Theme (factor) Questions On tram environment and comfort Sufficient room for all the passengers to sit/stand The comfort of the seats The amount of personal space you had around you Provision of grab rails to hold on to when standing/moving about the tram The temperature inside the tram Tram stop condition Its general condition/standard of maintenance Its freedom from graffiti/vandalism Its freedom from litter Boarding the tram The ease of getting on to and off of the tram The length of time it took to board the tram Timeliness The length of time you had to wait for the tram The punctuality of the tram Access to the tram stop Its distance from your journey start e.g. home, shops The convenience/accessibility of its location Personal safety throughout journey Behaviour of fellow passengers waiting at the stop Your personal safety whilst at the tram stop Your personal security whilst on the tram Cleanliness and condition of the tram The cleanliness and condition of the outside of the tram The cleanliness and condition of the inside of the tram 8 Smoothness/speed of tram The amount of time the journey took Smoothness/freedom from jolting during the journey 9 Information throughout journey The information provided at the tram stop Route/destination information on the outside of the tram The information provided inside the tram Value for money How satisfied were you with the value for money of your tram journey?

66 Methodology themes that are affecting overall passenger satisfaction charts () For the second stage, these themes were then used to identify how much effect each one has on passengers rating for overall journey satisfaction, by means of a key driver analysis. The square diagrams show the proportional influence that each theme has on satisfaction for that area/operator. They should be read like a pie chart where the slices or portions are relative to each other and together add up to %. So in the example below, the theme of on tram environment and comfort which is shaded red, has the greatest influence on satisfaction, followed by smoothness/speed of tram, while themes such as boarding the tram and information throughout journey have relatively less influence here. This analysis was conducted on fare-paying passengers only, so that the influence of value for money could be included. It also combines data from and surveys to increase robustness. The analysis excludes satisfaction measures relating to tram staff; due to differences in staff availability across the networks not all TPS questionnaires feature questions about tram staff. In order to run the analysis in a consistent and practical manner all staff measures have been excluded. There are noticeable and interesting differences in the impact of different themes between the various tram networks. The process used for Glasgow differs slightly, in that only out of individual satisfaction measures are included in the Glasgow questionnaire. The first stage of the analysis was therefore conducted in isolation from the other networks and produces slightly different themes. A full description is included in the technical report.


67 The Midland Metro route map
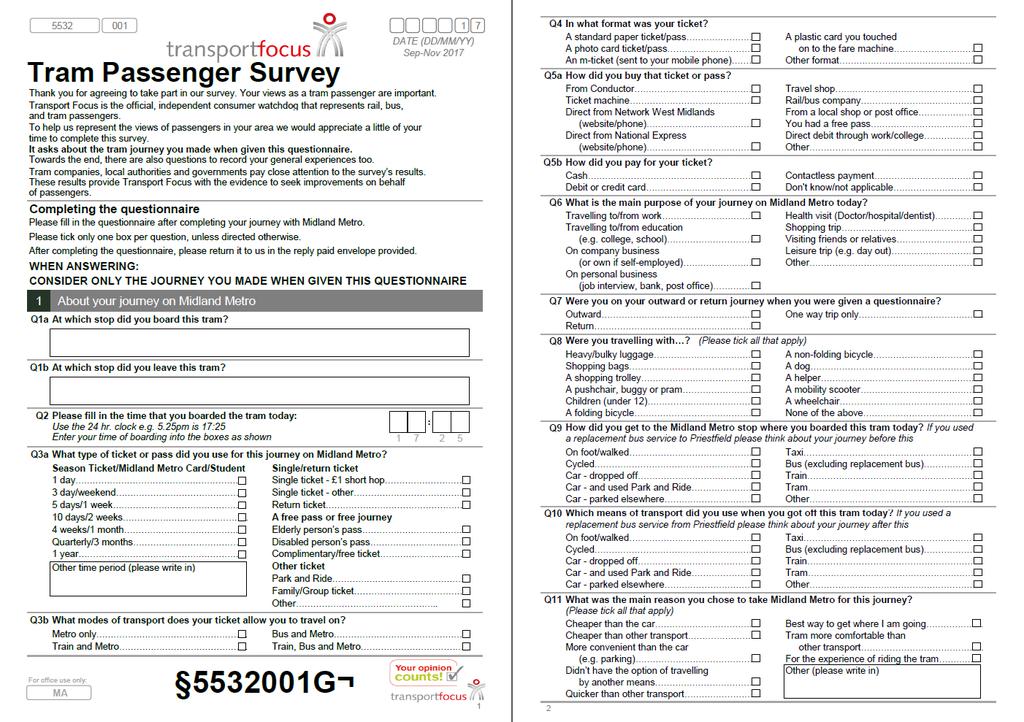
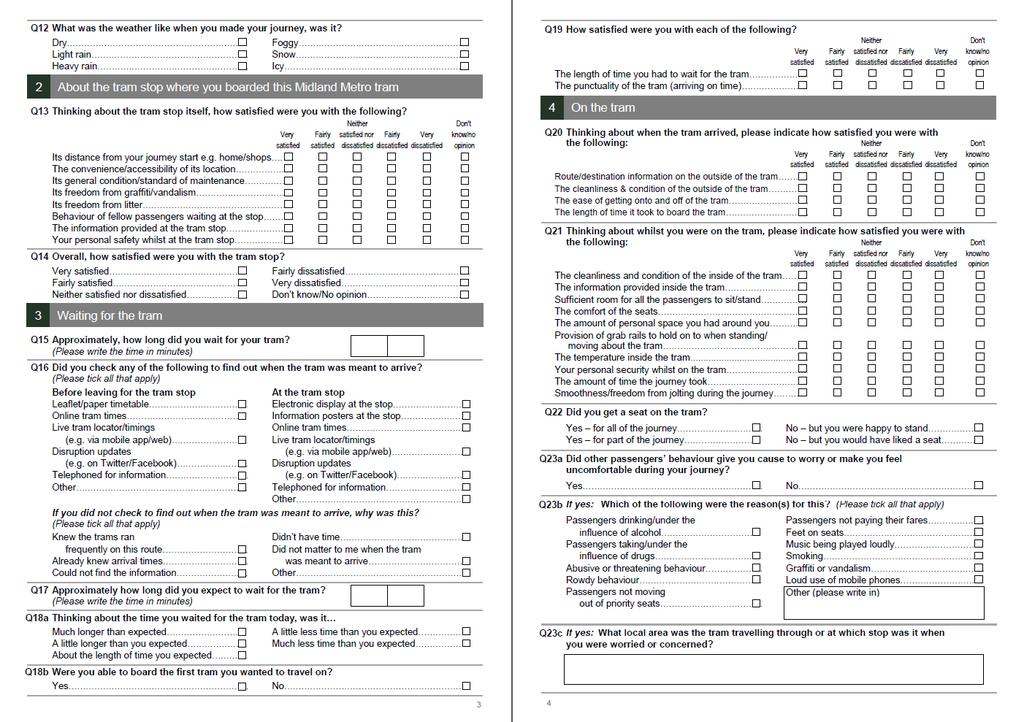
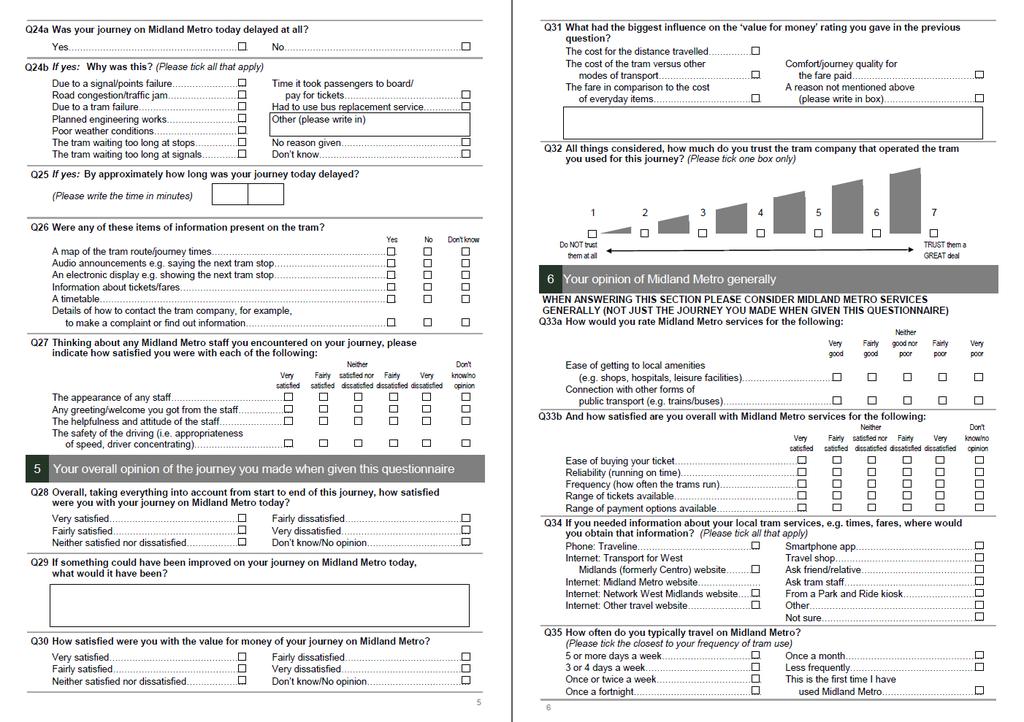
68 Tram Passenger Survey (TPS) Appendix Example of standard questionnaire Individual network questionnaires differed slightly to reflect local geography, presence of conductors and/or ticket machines, ticket types available, etc 8
69 9
70
71
72
73 Tram Passenger Survey (TPS) Midland Metro results Rosie Giles Tel: 8 Rosie.Giles@transportfocus.org.uk Insight Team, Transport Focus, Fleetbank House, - Salisbury Square, London, ECY 8JX March 8
Tram Passenger Survey (TPS) Manchester Metrolink
 Manchester Metrolink") Tram Passenger Survey (TPS) Manchester Metrolink Rosie Giles Tel: 000 0 Email: Rosie.Giles@transportfocus.org.uk Insight Team, Transport Focus, Fleetbank House, - Salisbury Square, London, ECY JX 0 results
Tram Passenger Survey (TPS) Manchester Metrolink Rosie Giles Tel: 000 0 Email: Rosie.Giles@transportfocus.org.uk Insight Team, Transport Focus, Fleetbank House, - Salisbury Square, London, ECY JX 0 results
Tram Passenger Survey (TPS) Sheffield
 Sheffield") Tram Passenger Survey (TPS) Rosie Giles Tel: 8 Email: Rosie.Giles@transportfocus.org.uk 7 results March 8 Insight Team, Transport Focus, Fleetbank House, - Salisbury Square, London, ECY 8JX Contents Overview
Tram Passenger Survey (TPS) Rosie Giles Tel: 8 Email: Rosie.Giles@transportfocus.org.uk 7 results March 8 Insight Team, Transport Focus, Fleetbank House, - Salisbury Square, London, ECY 8JX Contents Overview
Tram Passenger Survey. Autumn 2013 Report
 Tram Passenger Survey Autumn 2013 Report Contents 1 Foreword 3 2 Key findings 4 3 Research objective and methodology 8 4 Journey satisfaction 10 5 Tram usage 36 6 Passenger and journey details 42 7 Appendices
Glasgow Subway Passenger Survey
 Glasgow Subway Passenger Survey Autumn 2017 results April 2018 Contents Overview Context to the survey 3 Summary of 2017 findings 6 The findings Experience and opinions of the journey 14 Waiting at the
Bus Passenger Survey spring Centro authority area, and National Express (NX) routes within Centro
 routes within Centro") spring 01 results for: Centro authority area, and National Express (NX) routes within Centro July 01 Contact: Murray Leader, Research Team, Passenger Focus nd Floor, 1 Drummond Gate, Pimlico, London, SW1V
spring 01 results for: Centro authority area, and National Express (NX) routes within Centro July 01 Contact: Murray Leader, Research Team, Passenger Focus nd Floor, 1 Drummond Gate, Pimlico, London, SW1V
Tram Passenger Survey
 Tram Passenger Survey Autumn 2014 Contents 1 Foreword 3 2 Key findings 4 3 Research objective and methodology 8 4 Journey satisfaction 10 5 Tram usage 36 6 Passenger and journey details 42 7 Appendices
Bus Passenger Survey autumn 2013 results Merseytravel (Merseyside PTE area)
") Bus Passenger Survey autumn Merseytravel (Merseyside PTE area) Contact: Murray Leader, Research Team, Passenger Focus Fleetbank House, 2-6 Salisbury Square, London, EC4Y 8JX Tel: 0300 123 0843 Email: murray.leader@passengerfocus.org.uk
Bus Passenger Survey autumn Merseytravel (Merseyside PTE area) Contact: Murray Leader, Research Team, Passenger Focus Fleetbank House, 2-6 Salisbury Square, London, EC4Y 8JX Tel: 0300 123 0843 Email: murray.leader@passengerfocus.org.uk
Bus Passenger Survey
 Bus Passenger Survey March 2013 Contents 1 Foreword 3 2 Area key findings 4 3 4 Area results Introduction Former metropolitan county authorities Transport authority area groups Local transport authority
Bus Passenger Survey spring 2013 results
 Go-Ahead bus companies in England outside of London Bus Passenger Survey spring 2013 results Contact: Murray Leader, Research Team, Passenger Focus Fleetbank House, 2-6 Salisbury Square, London, EC4Y 8JX
Bus Passenger Survey. Autumn 2015 Report
 Bus Passenger Survey Autumn 2015 Report . Contents 1 Foreword 2 Area results Introduction Key findings Results for former metropolitan county authorities Results for transport authority groups Results
Tram Passenger Survey (TPS) West Midlands (Centro) pilot
 West Midlands (Centro) pilot") Passenger Survey (TPS) West Midlands (Centro) pilot June 201 Contact: Keith Bailey, Research Team, Passenger Focus Fleetbank House, 2- Salisbury Square, London, EC4Y JX Tel: 000 12 022 Email: keith.bailey@passengerfocus.org.uk
Passenger Survey (TPS) West Midlands (Centro) pilot June 201 Contact: Keith Bailey, Research Team, Passenger Focus Fleetbank House, 2- Salisbury Square, London, EC4Y JX Tel: 000 12 022 Email: keith.bailey@passengerfocus.org.uk
Onward travel. Insights from HS2 online panel
 Insights from HS2 online panel 1 Task: What connections with other transport facilities do you need to be available at train stations? (for example, buses, taxis, bicycles or bicycle parking). Please describe
GfK. Growth from Knowledge
 GfK. Growth from Knowledge Passenger Focus Bus Passenger Customer Satisfaction Survey Fieldwork Quality Report Quarter 3 2010 437957 / August 2010 v1 Prepared for: Prepared by: Contacts: Passenger Focus
Service Standard Report
 Public Transport Services Service Standard Report October - December 2014 Contents Sample and Methodology 3 Main Findings Bus 4-5 Main Findings Train 6 Main Findings Tram 4 On-Time Running Bus 8-9 Top
Consumer Attitude Survey
 Consumer Attitude Survey Spring 2018 Consumer Attitude Survey Spring 2018 2 Consumer Attitude Survey Spring 2018 Contents Introduction.. 4 Regional breakdown...... 5 Consumer views General perceptions..
Tyne and Wear Metro: What passengers want from new trains. Full report Chime Insight and Engagement February 2017
 Tyne and Wear Metro: What passengers want from new trains Full report Chime Insight and Engagement February 2017 Methodology Quantitative research 971 face-to-face interviews were conducted with passengers
Customer Charter Audit Quarter
 Customer Charter Audit Quarter 3 2017 Introduction The Bus Éireann Customer Charter Audit is conducted quarterly to establish if the company s performance levels reach the requirements outlined in its
Wolverhampton City Centre Metro Extension
 Wolverhampton City Centre Metro Extension Public Consultation 2013 Please tell us what you think by 31st May 2013 centro.org.uk 1 We would like to hear your views on the proposed Midland Metro extension
Survey on passengers satisfaction with rail services. Analytical report. Flash Eurobarometer 326 The Gallup Organization
 Flash Eurobarometer 326 The Gallup Organization Flash Eurobarometer European Commission Survey on passengers satisfaction with rail services Analytical report Fieldwork: March 2011 Publication: June 2011
Integrating transport (buses)
") Integrating transport (buses) TransWilts CIC / Summer 2015 Linking buses to trains and to other buses Right bus provision at right place & time Integrated fares and information Reducing subsidy yet retaining
Integrating transport (buses) TransWilts CIC / Summer 2015 Linking buses to trains and to other buses Right bus provision at right place & time Integrated fares and information Reducing subsidy yet retaining
CALGARY TRANSIT 2013 CUSTOMER SATISFACTION SURVEY DECEMBER HarGroup. M anagement Consultants
 CALGARY TRANSIT 2013 CUSTOMER SATISFACTION SURVEY DECEMBER 2013 HarGroup M anagement Consultants Table of Contents Executive Summary... i 1.0 INTRODUCTION... 1 1.1 Survey Methodology... 1 1.2 Factors
Travel to Work Survey 2018
 Travel to Work Survey 2018 The four local councils, Bath & North East Somerset Council, Bristol City Council, North Somerset Council, and South Gloucestershire Council carry out this survey annually. The
SPARTA Ridership Satisfaction Study
 SPARTA Ridership Satisfaction Study Presented by the Students of CRP 814 Gowtham Cherukumalli, Sam Keith, Kelsey Lantz, Nabarjun Vashisth, & Nelson Yaksic Vera With Guidance from Dr. Eric A. Morris INTRODUCTION
Service Standard Report
 Public Transport Services Service Standard Report October - December 2012 Contents Sample and Methodology 3 Main Findings Bus 4-5 Main Findings Train 6 Main Findings Tram 4 On-Time Running Bus 8-9 Top
Taxi Mystery Shopping
 Taxi Mystery Shopping Summary Report December 2013 Please direct any queries to david.erickson@roymorgan.com Roy Morgan Research Level 2, 26 Wharf St., QLD 4000 Telephone: (07)3318 7003 Roy Morgan Research
Metro trains for the future: what our passengers have said
 Metro trains for the future: what our passengers have said A: Executive summary 1 Nexus is developing plans to buy a new fleet of Metrocars to replace the current fleet, which are nearing the end of their
Who has trouble reporting prior day events?
 Vol. 10, Issue 1, 2017 Who has trouble reporting prior day events? Tim Triplett 1, Rob Santos 2, Brian Tefft 3 Survey Practice 10.29115/SP-2017-0003 Jan 01, 2017 Tags: missing data, recall data, measurement
Passengers satisfaction with public transport services in Helsinki in 2008
 Passengers satisfaction with public transport services in Helsinki in 2008 SUY Marko Vihervuori B: 6/2009 Publisher HELSINKI CITY TRANSPORT Planning Unit DESCRIPTION Date of publication 14.8.2009 (original
TRAIN, BUS & TRANSIT
 TRAIN, BUS & TRANSIT Input Metra 1 Metra does not want to add parking because of space; maxed out on number of cars per train. Developments on Rt. 59 will affect. 2 Should do studies regarding what the
How BRT can develop the bus mode in Dublin Paddy Doherty, Chief Executive, Dublin Bus
 How BRT can develop the bus mode in Dublin Paddy Doherty, Chief Executive, Dublin Bus Background Dublin Bus operates the public service obligation network in the Greater Dublin Area Also operates some
Public Opinion of Waterloo Region Rapid Transit Proposal May 2011
 Public Opinion of Region Rapid Transit Proposal May 2011 Methodology From May 23 to May 25, 2011, Angus Reid Public Opinion conducted an online survey among a residents of Region on behalf of Machteld
2015 LRT STATION ACTIVITY & PASSENGER FLOW SUMMARY REPORT
 LRT STATION ACTIVITY & PASSENGER FLOW SUMMARY REPORT CAPITAL and METRO LINES Project Team: ETS Transit Data Management Transportation Planning Strategic Monitoring and Analysis April, 2016 LRT STATION
Background Information about the Metrobus 29 Lines Study
 Background Information about the Metrobus 29 Lines Study Questions Overview of Existing Service Q. Why is the study being conducted? A. The 29 Lines provide an important connection between Annandale and
2016 Car Tech Impact Study. January 2016
 2016 Car Tech Impact Study January 2016 Objectives & Methodology Objectives Identify vehicle technologies that are currently being used and that are must haves for future vehicle purchases Determine how
CUSTOMER CHARTER NSW. this IS HoW we roll CUSTOMER CHARTER. transitsystems.com.au
 this IS HoW we roll CUSTOMER CHARTER transitsystems.com.au we help cities stay on the move 03. about Us 1500 PLUS EMPLOYEES IN NSW 800 PLUS VEHICLES At Transit Systems NSW we operate a modern fleet of
Passenger Promise and Rights: National Express Bus
 51 Bordesley Green Birmingham B9 4BZ Passenger Promise and Rights: National Express Bus 1. Introduction This document incorporates both our promise to you and a statement of your rights under the EU Passenger
Usage of solar electricity in the national energy market
 Usage of solar electricity in the national energy market A quantitative study November 2016 Introduction 3 Summary of key findings 5 The decision to install solar electricity 7 Sources of information on
WEST YORKSHIRE BUS STRATEGY 2040
 WEST YORKSHIRE BUS STRATEGY 2040 This document has been developed by West Yorkshire Combined Authority with support from the West Yorkshire District Councils, plus bus operators Arriva, First West Yorkshire
The Streamlined Public Transit Commute.
 The Streamlined Public Transit Commute. Background Statement As the total U.S. population grows and disperses, traffic congestion begins to affect cities where it once was not a major problem. As the second-fastest
This is an easy to read report.
 This is an easy to read report. It is about changing the bus services in Dublin. 1 What is Bus Connects? The National Transport Authority looks after public transport services across Dublin. The Authority
2017 Adjusted Count Report February 12, 2018
 A statewide multi-use trail user study and volunteer data collection program 2017 Adjusted Count Report February 12, 2018 The following report includes the final adjusted infrared (IR) counter data at
Passenger Information The informed traveller
 Passenger Information The informed traveller Investigation In October 2017 we looked at the provision of information to passengers about timetables and fares. We looked in particular at travel over the
TORONTO TRANSIT COMMISSION REPORT NO.
 Revised: March/13 TORONTO TRANSIT COMMISSION REPORT NO. MEETING DATE: March 26, 2014 SUBJECT: COMMUNITY BUS SERVICES ACTION ITEM RECOMMENDATION It is recommended that the Board not approve any routing
Research. Driving Safety Culture Survey 2017
 Research Driving Safety Culture Survey 2017 Contents Introduction... 3 Objectives... 4 Executive Summary... 5 Methodology... 6 Main findings...7 Q1. Please tell us how much of a problem each of the issues
Europeans and responsible driving 2017
 1 Europeans and responsible driving Technical specifications SAMPLE 12,429 individuals aged 15 years and over, including at least 1000 individuals in each of the surveyed countries SURVEY DATE From 11
IMPACT OF THE BUS LOCATION SYSTEM ON BUS USAGE. - Morioka City -
 IMPACT OF THE BUS LOCATION SYSTEM ON BUS USAGE - Morioka City - Yoshitaka Motoda, Professor, Iwate Prefectural University, 152-52 Sugo Takizawa, Iwate, Japan 020-0193 Phone: +81-19-694-2732, Fax: +81-19-694-2701
RAA Member Panel. Older Drivers. Self-regulation by older drivers
 RAA Member Panel Older Drivers In November 2018, RAA conducted a survey of Members aged over 65 years seeking responses regarding the driving behaviour of older drivers. The sample size was 769 individuals
Presented by Eric Englert Puget Sound Energy September 11, 2002
 Results from PSE s First Year of Time of Use Program Presented by Eric Englert Puget Sound Energy September 11, 2002 Puget Sound Energy Overview 973,489 Total Electric Customers 908,949 are AMR Capable
Denver Car Share Program 2017 Program Summary
 Denver Car Share Program 2017 Program Summary Prepared for: Prepared by: Project Manager: Malinda Reese, PE Apex Design Reference No. P170271, Task Order #3 January 2018 Table of Contents 1. Introduction...
2012 Customer Satisfaction Survey Long Island Rail Road
 2012 Customer Satisfaction Survey Long Island Rail Road Overall Context Overall customer satisfaction increased in 2012 recovering from 2011 winter storms and service disruptions from Amtrak repairs/derailment.
Seat Belt Survey. Q1. When travelling in a car, do you wear your seat belt all of the time, most of the time, some of the time, or never?
 N F O C F g r o u p Seat Belt Survey Q1. When travelling in a car, do you wear your seat belt all of the time, most of the time, some of the time, or never? The majority of Canadians (85%) wear their seat
5. OPPORTUNITIES AND NEXT STEPS
 5. OPPORTUNITIES AND NEXT STEPS When the METRO Green Line LRT begins operating in mid-2014, a strong emphasis will be placed on providing frequent connecting bus service with Green Line trains. Bus hours
MAT Paratransit for Persons with Disabilities
 MAT Paratransit for Persons with Disabilities Who is Eligible ADA Paratransit Eligible per Americans with Disabilities Act Persons with disabilities who cannot ride MATBUS Fixed Routes independently There
1 Have you used Sun Trolley (which also includes Riverwalk Trolley)? Yes (Go to Question #2) No (Go to Question #10)
? Yes (Go to Question #2) No (Go to Question #10)") 1 Have you used Sun Trolley (which also includes Riverwalk Trolley)? Yes (Go to Question #2) No (Go to Question #10) 2 How often do you use Sun Trolley? Sporadically as needed Somewhat frequently (up to
1 Have you used Sun Trolley (which also includes Riverwalk Trolley)? Yes (Go to Question #2) No (Go to Question #10) 2 How often do you use Sun Trolley? Sporadically as needed Somewhat frequently (up to
RACQ Mobility Survey - Taxis and Rideshare
 RACQ Mobility Survey - Taxis and Rideshare For Information RACQ Public Policy Department Date 2 December 1 R A C Q M o b i l i t y S u r v e y P a g e 1 Contents 1 Introduction... 3 2 Methods... 3 3 Demographic
Metro-North Report on Metrics and Fare Evasion
 Metro-North Report on Metrics and Fare Evasion Performance Metrics Service Performance Improvement Metrics Service Metric OTP SHORT TRAINS SWITCH/SIGNAL DELAYS Change from 2018 2019 Goal YTD Target YTD
Customer Survey. Motives and Acceptance of Biodiesel among German Consumers
 Customer Survey Motives and Acceptance of Biodiesel among German Consumers A Survey in the Framework of Carbon Labelling Project EIE/06/015/SI2.442654 by Q1 Tankstellenvertrieb GmbH & Co. KG Rheinstrasse
Customers certified in accordance with ADA are eligible to use Spec-Tran.
 CAPITAL AREA TRANSPORTATION AUTHORITY Spec-Tran Guide What is Spec-Tran? Spec-Tran is an Americans with Disabilities Act or ADA-complementary paratransit service for people who are unable to use CATA s
Public Opinion of Air Pollution in Delhi
 Public Opinion of Air Pollution in Delhi METHODOLOGY Sampling and Data Collection Methods This study was conducted among a representative sample of 500 citizens of Delhi aged 15 and older. All interviews
Passenger Promise and Rights: National Express Bus
 51 Bordesley Green Birmingham B9 4BZ Passenger Promise and Rights: National Express Bus 1. Introduction This document incorporates both our promise and duties to you and a statement of your rights under
Impact of the North South Line Project
 Impact of the North South Line Project Dr. Ties Brands Malvika Dixit 27 th November 2018 1 North-South metro line in Amsterdam 2 Time for a Quiz! kahoot.it 3 Travel time from Centraal Station to Station
How to enable Munich s Freedom (from private cars)? Impacts of the first Mobility Station on urban mobility
? Impacts of the first Mobility Station on urban mobility") How to enable Munich s Freedom (from private cars)? Impacts of the first Mobility Station on urban mobility Montserrat Miramontes 1 Hema Sharanya Rayaprolu 1 Maximilian Pfertner 1 Martin Schreiner 2 Gebhard
How to enable Munich s Freedom (from private cars)? Impacts of the first Mobility Station on urban mobility Montserrat Miramontes 1 Hema Sharanya Rayaprolu 1 Maximilian Pfertner 1 Martin Schreiner 2 Gebhard
Innovation in Transport. Mike Waters
 Innovation in Transport Mike Waters West Midlands as the home of mobility Accomodating growth Our population is forecast to grow by 444,000 people by 2035 Housing Deal: 215,000 homes by 2030/31 100m Land
Riding Metrobus 16H from GHBC to Pentagon City (last update Oct )
") Riding Metrobus 16H from GHBC to Pentagon City (last update Oct-17-2018) WMATA s Metrobus 16H is a very convenient, low-cost way for GHBC residents to get to/from Pentagon City for: o o Shopping trips
Riding Metrobus 16H from GHBC to Pentagon City (last update Oct-17-2018) WMATA s Metrobus 16H is a very convenient, low-cost way for GHBC residents to get to/from Pentagon City for: o o Shopping trips
Rural bus services. September 2011
 Rural bus services September 2011 Foreword One in five people in England live in rural areas 1. Recent surveys suggest that those living in the countryside regard better public transport as a top priority
Supertram Rail Replacement Project service information for the period March September 2014 IMPORTANT INFORMATION March 2014
 IMPORTANT INFORMATION March 2014 Supertram Rail Replacement Project service information for the period March 2014 - September 2014 For information on tickets and services: www.supertram.com What is happening
CONSUMER ATTITUDES TOWARD E- BIKES: A REVIEW OF THREE STUDIES IN NORTH AMERICA
 CONSUMER ATTITUDES TOWARD E- BIKES: A REVIEW OF THREE STUDIES IN NORTH AMERICA Christopher Cherry (University of Tennessee), Ziwen Ling (University of Tennessee), John MacArthur (Portland State University),
Getting a Car J. Folta
 Getting a Car Getting a Car J. Folta As the head of a family, I have many decisions to make about how my husband and I spend our money. We need to figure out the way to get the most out of what we make
Car passengers on the UK s roads: An analysis. Imogen Martineau, BA (Hons), MSc
, MSc") Car passengers on the UK s roads: An analysis Imogen Martineau, BA (Hons), MSc June 14th 2005 Introduction At a time when congestion is increasing on the UK s roads and reports about global warming are
Car passengers on the UK s roads: An analysis Imogen Martineau, BA (Hons), MSc June 14th 2005 Introduction At a time when congestion is increasing on the UK s roads and reports about global warming are
Where are we heading? Paths to mobility of tomorrow The 2018 Continental Mobility Study
 Bitte decken Sie die schraffierte Fläche mit einem Bild ab. Please cover the shaded area with a picture. (24,4 x 7,6 cm) Where are we heading? Paths to mobility of tomorrow The 2018 Continental Mobility
From a marketplace for mobility towards Mobility as a Service in Rotterdam (Nl)
") From a marketplace for mobility towards Mobility as a Service in Rotterdam (Nl) Martijn van de Leur - De Verkeersonderneming 27-11-17 1 Content 1. From a Marketplace for Mobility towards MaaS 2. What does
From a marketplace for mobility towards Mobility as a Service in Rotterdam (Nl) Martijn van de Leur - De Verkeersonderneming 27-11-17 1 Content 1. From a Marketplace for Mobility towards MaaS 2. What does
Bus Strategy 2015 Information Pack. 23/07/15 Version
 Bus Strategy 2015 Information Pack 23/07/15 Version 1 Introduction to the Information Pack This Information Pack has been compiled to provide a statistical summary of the Liverpool City Region bus market
FINAL REPORT TO SHEFFIELD BUS PARTNERSHIP OPERATIONS GROUP FROM: WORK PACKAGE 5 PERFORMANCE FRAMEWORK & UPDATE DATE OF MEETING: 19 OCTOBER 2012
 Sheffield Bus Partnership FINAL REPORT TO SHEFFIELD BUS PARTNERSHIP OPERATIONS GROUP FROM: WORK PACKAGE 5 SUBJECT: PERFORMANCE FRAMEWORK & UPDATE DATE OF MEETING: 19 OCTOBER 2012 1. EXECUTIVE SUMMARY Overall
Sound Transit Operations July 2016 Service Performance Report. Ridership
 Ridership Total Boardings by Mode Mode Jul-15 Jul-16 % YTD-15 YTD-16 % ST Express 1,618,779 1,545,852-4.5% 10,803,486 10,774,063-0.3% Sounder 333,000 323,233-2.9% 2,176,914 2,423,058 11.3% Tacoma Link
Credit: Image Source / Rex / Shutterstock. Sustainability Research November 2017
 Credit: Image Source / Rex / Shutterstock Sustainability Research November 2017 Sustainability Research November 2017 AGENDA Methodology Respondent Profile Main Findings Summary Presented by: Heather Macleod,
Post Opening Project Evaluation. M6 Toll
 M6 Toll Five Post Years Opening After Study: Project Summary Evaluation Report Post Opening Project Evaluation M6 Toll Five Years After Study Summary Report October 2009 Document History JOB NUMBER: 5081587/905
Where will. BRT run? BRT will serve 20 stations along the line, connecting to bus routes and serving major destinations. How often will service run?
 Where will 32 65 87 223 Rosedale Transit Center 225 227 264 801 ROSEVILLE 65 Snelling & County Road B BRT run? Snelling & Roselawn FALCON HEIGHTS BRT will serve 20 stations along the line, connecting to
Our Mobility Scooter Policy: A guide to taking mobility scooters on our trains
 Great Western Railway 1 Our Mobility Scooter Policy: A guide to taking mobility scooters on our trains March 2018 Our Mobility Scooter Policy: A guide to taking mobility scooters on our trains 13 If you
BUS SERVICES IN CHAMBERLAYNE ROAD NW10
 INTRODUCTION BUS SERVICES IN CHAMBERLAYNE ROAD NW10 1 LONDON BUSES 1. This note reviews the issues in Chamberlayne Road, Kensal Rise. It covers the range of bus routes in the area, their characteristics
Welcome! Think carpool, then think bigger! Questions? Contact our Vanpool team!
 Welcome! Smart commuters like you are seizing the opportunity to turn costly and often frustrating daily commutes into a better experience. Vanpool helps you save money on gas and maintenance, reduces
Patrons will be allowed access into the venue by the Gate Number denoted on their tickets.
 After years of eager anticipation, the wait for U2 is finally coming to an end. In an effort to answer any possible questions you may have regarding the show and Commonwealth Stadium, we have compiled
Transport Group Perspective Chris Blow Chair of The Guildford Society Transport Group 21st Jan 2015
 Transport Group Perspective Chris Blow Chair of The Guildford Society Transport Group 21st Jan 2015 LET'S REMEMBER THAT THIS IS NOT A STATION REDEVELOPMENT BUT A STATION SITE REDEVELOPMENT. The big question:
An Evaluation of Coin-Operated Breath Testing Machines in South Australian Licensed Premises
 An Evaluation of Coin-Operated Breath Testing Machines in South Australian Licensed Premises L.N. Wundersitz Road Accident Research Unit, The University of Adelaide, 5005, Australia Keywords Alcohol, breath
June 8, Prepared by Urban Systems Ltd.
 June 8, 2017 Prepared by Urban Systems Ltd. Prepared by : 304-1353 Ellis Street, Kelowna, BC V1Y 1Z9 T: 250.762.251704 June 8, 2017 urbansystems.ca File No. 1961.0384.02 1.1 Community Engagement Goals...
Residential Survey Phase 2 Results
 1 Residential Survey Phase 2 Results Prepared for: United Energy December 2017 Contacts: Karyn Wong: kwong@woolcott.com.au Liz Sparham: lsparham@woolcott.com.au United Energy Residential Survey Results
Marketing Research Update Paratransit/Trolley Customer Surveys
 Marketing Research Update Paratransit/Trolley Customer Surveys April 2015 RTA s Mission Statement: Provide safe, reliable, clean and courteous public transportation. Vital Few Objective: Increase ridership.
2014 Bay Area Council Survey Report of Selected Results: Energy and Communications
 2014 Bay Area Council Survey Report of Selected Results: Energy and Communications Online Panel survey of 1,018 Bay Area Residents April 8-15, 2014 EMC Research, Inc. How do you feel things are going in
April 10, Mr. Artis Smith Merced County Association of Governments 369 W. 18 th Street Merced, CA 95340
 April 10, 2019 Mr. Artis Smith Merced County Association of Governments 369 W. 18 th Street Merced, CA 95340 RE: YARTS Monthly Report March 1-31, 2019 Dear Mr. Smith, In accordance with the contract agreement
Public Transport Proposals including: Subsidised Bus Services, Concessionary Travel and Community Transport Draft Passenger Transport Strategy 2016
 Central Bedfordshire Council www.centralbedfordshire.gov.uk Public Transport Proposals including: Subsidised Bus Services, Concessionary Travel and Community Transport Draft Passenger Transport Strategy
ScoreCard November 2013 [Oct 13 Data] Ridership
![ScoreCard November 2013 [Oct 13 Data] Ridership](/thumbs/95/126521028.jpg "ScoreCard November 2013 [Oct 13 Data] Ridership") ScoreCard November 213 [Oct 13 Data] Ridership Average Weekday Ridership Sep 213: 1.37M Down.2 % from Sep 212 System Maintenance A key measure of system maintenance is the travel time impact of slowdowns
ScoreCard November 213 [Oct 13 Data] Ridership Average Weekday Ridership Sep 213: 1.37M Down.2 % from Sep 212 System Maintenance A key measure of system maintenance is the travel time impact of slowdowns
TRAFFIC SURVEY REPORT HARVINGTON PT1 (CREST HILL)
") TRAFFIC SURVEY REPORT HARVINGTON PT1 ( HILL) October 20-24th 2014 Conducted voluntarily by the residents of Harvington Village. This report has been prepared in light of the planning application W14/01788/OU
TRAFFIC SURVEY REPORT HARVINGTON PT1 ( HILL) October 20-24th 2014 Conducted voluntarily by the residents of Harvington Village. This report has been prepared in light of the planning application W14/01788/OU
2017 FLEET BAROMETER. Belgium
 1 2017 FLEET BAROMETER Belgium 2 Table of content I CHARACTERISTICS OF THE FLEET p.17 II FINANCING p.35 III TELEMATICS p.47 IV PERSPECTIVES IN TERMS OF MOBILITY p.52 V INFORMATION SOURCES p.63 Perimeter
North Florida Transportation Survey
 North Florida Transportation Survey 2008 A Survey of Residents of Clay, Duval, Nassau, and St. Johns Counties Prepared by: Jim Flagg, Vice President 1329 Kingsley Avenue, Suite A Orange Park, Florida 32073
ScoreCard Jun 2014 [May 14 Data] Ridership
![ScoreCard Jun 2014 [May 14 Data] Ridership](/thumbs/93/113666940.jpg "ScoreCard Jun 2014 [May 14 Data] Ridership") + ScoreCard Jun 214 [May 14 Data] Ridership Average Weekday Ridership May 14: 1.36M Up 2.% from May 213 Year-to-Year Change: May 13 to Present -.6% -1.% -2.3% -1.7%.4% 4.9% -.2% -.3% -3.8%.8%.7% 3.1% 2.%
+ ScoreCard Jun 214 [May 14 Data] Ridership Average Weekday Ridership May 14: 1.36M Up 2.% from May 213 Year-to-Year Change: May 13 to Present -.6% -1.% -2.3% -1.7%.4% 4.9% -.2% -.3% -3.8%.8%.7% 3.1% 2.%
Weaving a local web. Evaluating the effectiveness of Let s Carpool to encourage carpooling to work. Prepared for Greater Wellington Regional Council
 Weaving a local web Evaluating the effectiveness of Let s Carpool to encourage carpooling to work Prepared for Greater Wellington Regional Council Authors: Dr Wokje Abrahamse Dr Michael Keall New Zealand
Reducing the barriers to bus use
 Reducing the barriers to bus use AGCC, First Group and NESTRANS MAY 2015 Produced by Aberdeen & Grampian Chamber of Commerce Research Unit 1 Table of Contents Executive Summary... 1 Introduction... 3 Background
2015 LRT PASSENGER COUNT. CAPITAL and METRO LINES
 2015 LRT PASSENGER COUNT CAPITAL and METRO LINES Project Team: ETS Transit Data Management Transportation Planning Strategic Monitoring and Analysis April, 2016 2015 LRT PASSENGER COUNT Edmonton Transit
MOBILITY SCOOTER SAFETY GUIDE
 Information Guides SEPTEMBER 2016 MOBILITY SCOOTER SAFETY GUIDE INTRODUCTION Mobility scooters and powered wheelchairs can provide more freedom and independence to many disabled and older people. They
Mysuru PBS Presentation on Prepared by: Directorate of Urban Land Transport
 Mysuru PBS Presentation on 04.11.2017 Prepared by: Directorate of Urban Land Transport Introduction to Mysuru Public Bicycle Sharing System Mysuru Public Bicycle Sharing System Bicycle based transportation
GODURHAM PROGRESS REPORT
 GODURHAM PROGRESS REPORT OVERVIEW OPERATIONS & PERFORMANCE With the service enhancements, total revenue hours increased In 2016, GoDurham connected 5.9 million passengers to jobs, education and health