Scalable Methods for Monitoring Limited Access Roadways Using Crowd-Sourced Probe Data
|
|
|
- Erik Boyd
- 6 years ago
- Views:
Transcription

1 Purdue University Purdue e-pubs Lyles School of Civil Engineering Faculty Publications Lyles School of Civil Engineering 16 Scalable Methods for Monitoring Limited Access Roadways Using Crowd-Sourced Probe Data Howell Li Purdue University Stephen M. Remias Purdue University Aaron Taylor INRIX Darcy M. Bullock Purdue University, Follow this and additional works at: Part of the Civil Engineering Commons Li, Howell; Remias, Stephen M.; Taylor, Aaron; and Bullock, Darcy M., "Scalable Methods for Monitoring Limited Access Roadways Using Crowd-Sourced Probe Data" (16). Lyles School of Civil Engineering Faculty Publications. Paper This document has been made available through Purdue e-pubs, a service of the Purdue University Libraries. Please contact epubs@purdue.edu for additional information.
2 Scalable Methods for Monitoring Limited Access Roadways using Crowd-Sourced Probe Data by Howell Li Purdue University Stephen M. Remias Purdue University Aaron Taylor INRIX Corresponding author: Darcy M. Bullock Purdue University 55 Stadium Mall Drive West Lafayette, IN 4796 Phone (765) Word Count: 3,893 words + 1 * 25 words/(figure-table) = 6,393 words November 3, 15
3 ABSTRACT Commercial crowd-sourced probe vehicle data has been gaining traction in recent years as a ubiquitous and scalable resource for identifying traffic congestion on limited access roadways. It is routinely used in realtime by navigation software that displays color coded maps. However, outside of public agency traffic management centers, there are no factual big picture reports on traffic conditions. The media tries to fill this gap, but they either provide descriptions of construction locations, or highly subjective opinions. This paper proposes and illustrates a big picture characterization of regional and national traffic conditions using archived and real-time data. Average speeds of vehicles on segments of roadway can be retrieved in near real-time at one-minute intervals to produce performance metrics that measure cumulative miles of congestion per route, per entire Metropolitan Statistical Area (MSA), and on coast-to-coast Interstates using speed profile analysis. Moreover, both real-time and historic archival performance measures can be used for after-action analysis of major traffic events. In this study, the traffic congestion for four MSAs and two Interstates during the week of June 28 to July 6 was used as a case study to illustrate the concepts. The study found most congestion in the Chicago, Los Angeles, and New York City metropolitan areas occurred during the PM rush on July 2 before the holiday weekend, with at least % of all limited access roadways in each area falling below 4 mph between the hours of 4:3 PM and 5:45 PM local time. On a coast-to-coast level, Interstate 8 showed the heaviest congestion eastbound at 5:15 PM EDT with 14 combined miles of congestion across 11 states. Data reduction and aggregation methods using 15- minute medians outlined in this study allow future systems to implement regional congestion graphs, speed profile charts, and temporal congestion graphs for operational and practical uses. This information can be leveraged by local, regional, and state transportation agencies as well as for media dissemination and outreach to inform the public. Keywords: traffic, crowd-sourced, data, national, congestion, performance, speed, mobility, dashboards. 2
4 INTRODUCTION Performance measurement of high speed, low access highway facilities has often only been possible with the installation of physical infrastructure that measures speeds and manual processing to reduce the data into useful information. Historically, technologies like inductive loops, side-fire radar, license plate readers, and Bluetooth identification matching were used to perform these speed tests (1). While the sample rate was high for small areas of roadway, this was not a scalable approach to assess roadways in very large or aged networks or at the state or national level. Recently, crowd sourced probe data has established a presence with the increase in hand held technology penetration and ubiquity of GPS applications for roadway navigation. The users of these applications provide meaningful speed information in real-time across the country. These data have become very popular on the state level to assess roadway mobility for individual departments of transportation (2-7), at the corridor level for assessing a route that travels through multiple states (8, 9), and at the metropolitan level to compare the mobility performance of different cities (1). From a national perspective, these data allow for the scalability of in-depth performance measures typically implemented at the smaller local or municipal levels, or at the state level. The current national performance measures using these data (11, 12) are informative, but have stimulated an interest in real-time description of the network. The objective of this research is to develop and enhance national tools that can be used in real-time for the assessment of current national mobility trends. These objectives align with the national goals and milestones put forth by the FHWA in MAP-21 (13). METHODOLOGY SPEED SAMPLING OF ROUTES AND NETWORKS Crowd sourced probe data samples average speeds of GPS-enabled vehicles and devices at one-minute intervals on roughly half-mile to two-mile segments of roadway throughout the world. These disaggregate segments can be grouped together by route and direction contiguously to give a sense of performance of a road at a particular time or to analyze historic trends. Figure 1a shows a single half-mile segment on I-95 New Jersey Turnpike in the southbound direction in the New York City Metropolitan Statistical (14). The entire length of the New Jersey Turnpike southbound through the MSA is depicted in Figure 1b, with callout i indicating the location of the half-mile segment from Figure 1a. The map in Figure 1c shows all limited access routes in the MSA with route from Figure 1b highlighted in red. The map in Figure 1d shows the location of the MSA region at a national level. The lower 48 states contains over 127, miles of limited 3
5 access roadway segments as defined by this system, of which 16,224 miles of roadway from 22,434 segments are used for this study. DATA REDUCTION AND AGGREGATION Due to the scale of the data size nationally and with stochastic variations in the minute-by-minute speeds, a reduction process is taken to aggregate speeds of individual segments into 15-minute median bins. For the eight-day analysis period in this study, over 262 million one-minute segment speed records are recorded on a 3.5 gigahertz, dual-processor server with 128 gigabytes of memory running SQL Server. The data is reduced to 17 million records when aggregated per 15 minutes, with the process taking 4.5 hours of total computation time. The resulting fetch time for the aggregated dataset is 99 seconds per query compared to 28 minutes per query for the one-minute dataset. To demonstrate an example of the reduction process, Figure 2 illustrates a sample dataset before and after reduction. Figure 2a graphs a series of one-minute speeds for the segment of the New Jersey Turnpike defined in Figure 1a on July 2, 15 over two hours in the afternoon. The dotted horizontal line at 4 mph indicates the congestion threshold used for this study. For the majority of limited-access roads analyzed, the speed limits are no less than 4 mph and this threshold is used objectively as a measure for congestion in this study. From the graph, the speeds exhibit some noise throughout the period minute-byminute (callout i), fluctuating at and below the threshold for serval minutes between 1:45 PM and 2: PM. After the data is aggregated into 15-minute bins (Figure 2b) using the medians, the noise is reduced while still retaining the overall downward trend in that period with the segment s speed falling below the threshold at 1:45 PM. JULY 4 TH CONGESTION AT-A-GLANCE For one of the more heavily-travelled holidays in the summer driving season, it is useful for a traffic agency, as well as from a user perspective, to monitor the peak travel patterns on limited access facilities. As an overview, the maps in Figure 3 show at-a-glance the performance of all roads in four MSAs at noon (Figure 3a) and 5: PM EDT (Figure 3b) using donut graphs. Figure 3b shows the dramatic shift to congested performance at rush hour for all four areas. The maps in Figure 4 provide a more zoomed-in view of each of the four MSAs from Figure 3b, showing geographically the most congested routes by color. This view is widely accessible from major internet mapping services in real time but often not as a historical playback feature. 4
6 WEEKEND PM RUSH Figure 5 is a series of speed profile graphs that show the top 1 most congested routes in four metropolitan areas at 5: PM on Thursday, July 2 in each local time zone. Any route segment operating below 4 mph is considered congested for all areas. For each route, the number of miles of congestion is displayed in four speed categories under 4 mph: 1) light congestion from 3 to 39 mph, 2) moderate congestion from to 29 mph, 3) heavy congestion from 1 to 19 mph, and 4) extreme congestion below 1 mph. For metropolitan Indianapolis (Figure 5a), relatively low congestion existed on the roadways with only 9 routes in the area exhibiting a total of just under 3 miles operating below 4 mph. This accounts for just 5% of all limited access facilities in the Indianapolis MSA. The outer loop of I-465 was the most congested with 7 miles of congestion and no segments heavily or extremely congested. The only route in the area that had any segment operating below 1 mph was a one mile segment of the inner loop of I-465. By comparison, the Chicago metropolitan area (Figure 5b) exhibited much more congestion with its top 1 routes totaling 141 miles operating below 4 mph. The I-294 Tri-State Tollway southbound had 13 miles operating in heavy congestion and is the most congested in the area, with a total of 24 miles operating below 4 mph. Six out of the top 1 routes had one or more segments in extreme congestion, shown in purple. The Los Angeles and New York City metropolitan areas, both with more miles of limited access roadway, saw much greater congestion at 5: PM. In Los Angeles, the top 1 routes accounted for over 241 miles operating below 4 mph. The most congested route was the I-45 San Diego Freeway, having 4 and 35 miles of congestion for northbound and southbound directions, respectively (Figure 5c, callout i; Figure 5c, callout ii). The congested northbound and southbound segments account for 55% and 48% of the entire length of the freeway, respectively. More significantly, there were miles of roadway in the top 1 of Los Angeles that operated below 1 mph. The slowest-moving segments included over 7 miles on I- 45 northbound direction and 5 miles on I-1 Santa Monica Freeway in the eastbound direction. For the New York City metropolitan area (Figure 5d), there were 233 miles of congestion in the top 1 most congested routes, with the Garden State Parkway in the southbound direction being more congested than the rest. The I-495 Long Island Expressway in the eastbound direction had the most number of miles operating below 1 mph, at 6 miles. Over 54% of the route was congested at 5: PM. The congestion for many of these routes may perhaps be attributed to users driving away from the central business districts for the holiday. THE WEEK PRIOR To put the July 2 congestion in context of the week prior to the holiday, the total miles of congestion on all routes in the Chicago, Los Angeles, and New York metropolitan areas are analyzed over an 8 day period in Figure 6. The peak period in Chicago on July 2 at 4:3 PM local time (Figure 6a, callout i) had significantly 5
7 more miles of congestion than any other day of that week, with 343 miles of limited access roads operating below 4 mph. This is equivalent to 26% of the Chicago area limited access network. By comparison, the second-most congested day of that week was Monday, with 246 miles of congestion at 4:45 PM, which was 28% less than Thursday s peak period. It is also interesting to note that the peak total congested miles in the AM period dwindled as the week progressed: Monday with 228 miles, Tuesday with 133 miles, Wednesday with 15 miles, and Thursday with 67 miles; this phenomena perhaps reflects the increasing number of extended-weekend takers as the holiday approached. Figure 6b shows the same 8-day window for the Los Angeles area. At its peak, the network had 669 congested roadway miles in the afternoon of July 2 at 4:45 PM local time. This is the equivalent to 41% of the Los Angeles area limited access network. In comparison, the second-most congested day in the same week was on Tuesday (Figure 6b, callout ii), with 586 miles of congestion during its peak at 5:3 PM local time. The holiday rush on July 2 had only 12% more congested miles than the second-most congested day in the same week. The AM peaks also did not exhibit the same decreasing trend throughout the week as it had occurred in Chicago. Shown in Figure 6c, the New York City area had 554 miles of congestion in the network (21% of the area) at 4:45 PM local time on July 2. The second-most congested period in the week was the day prior on July 2 at 5:45 PM with 513 miles at its peak. Comparing with the other two metropolitan areas, New York City had a less dramatic increase during the Thursday s PM rush. One other observation is that New York s midday periods from Monday through Thursday of that week had more miles of congestion sustained during the midday (1: AM to 3: PM local time), with at least miles of roadway operating in heavy or extreme congestion for all four days in that period (dark red-shaded areas in Figure 6). In comparison, Los Angeles fell below 7 miles of heavy or extreme congestion during the midday on Monday and Chicago fell below 1 mile on both Monday and Tuesday. Friday July 3 in all three metropolitan areas saw virtually no congestion on the roads before 9: AM local time. The typical PM peak periods shifted to earlier in the day for all three areas: Chicago peaks at 2:15 PM with 111 miles, Los Angeles peaks at 1:15 PM with 281 miles, and New York City peaks at 1:15 PM with 28 miles. July 4 saw very little congestion for all three areas, although interestingly some congestion was captured during the afternoon to late evening hours (Figure 6b, callout iii; Figure 6c, callout iv), possibly due to fireworks displays in each area. Sunday July 5 saw greater afternoon and evening congestion in all three cities: Chicago with 153 miles at its peak at 4: PM, Los Angeles with 117 miles at its peak at 3:15 PM, and New York City with 4 miles at its peak at 4:15 PM. Both Los Angeles and New York City had fewer congested miles on Sunday, July 5, than the same day in the prior week. The previous Sunday (June 28) peaked with 188 miles at 2:45 PM in Los Angeles and 226 miles also at 2:45 6
8 PM in New York City. Chicago was the exception with 17 miles of congestion at 3:45 PM on June 28, which is 46 fewer miles than July 5 at its peak. ROUTE DRILL-DOWN Graphs displaying miles of congestion over 5 days of the July 4 holiday weekend are illustrated in Figure 7 for the I-45 San Diego Freeway (the 45) and the I-495 Long Island Expressway (the LIE) in both directions. The two routes are compared because of their similar lengths (72 miles in each direction) and number of miles congested over the weekend. The time of the snapshot taken from Figure 5 is indicated by the dotted lines in Figure 7. Callout i in Figure 7a shows that at 5: PM on July 2, the congestion was already past its peak on the 45 northbound, which peaked at 4:15 PM with 44 miles. In the same figure, callout ii shows a substantial amount of congestion in the late evening hours of July 4, possibly due to fireworks viewing, which accounted for 21 miles of congestion at 11:15 PM local time. Callout iii shows a some amount of northbound congestion Sunday afternoon with 1 miles at 1:15 PM and 1:45 PM operating below 4 mph, while callout iv shows more typical AM and PM peaking characteristics for Monday, July 6. For the 45 southbound, fewer miles of roadway were extremely congested, or operating less than 1 mph, compared to the northbound direction in the afternoon of July 2. At most three miles were extremely congested in the southbound direction versus 8 miles in the northbound direction. However Figure 7b, callout vi shows more total miles congested during midday on Friday compared with the northbound direction; on July 3 there were 25 miles congested in the southbound at its peak at 1: PM compared to only 8 miles at 11:3 AM in the northbound. The LIE on the other hand shows a much greater directional disparity between the eastbound and westbound directions over the weekend than on the 45, most likely due to the inbound and outbound nature of the route, with New York City at its far western end and the beaches in Nassau and Suffolk Counties on Long Island at its far eastern end. In Figure 7c, callout vii, the number of miles congested had not yet reached its peak at 5: PM in the eastbound direction on July 2. The eastbound route peaks fifteen minutes later at 5:15 PM with 4 miles of congestion. Meanwhile, in the westbound direction during the same time period, much fewer miles were congested around 5: PM. At the height of the congestion on the westbound LIE, 12 miles operated below 4 mph at 5:15 PM. The eastbound LIE exhibited peak congestion earlier in the day on Friday than on Thursday (Figure 7c, callout viii), with miles at its height at 1: PM. There was essentially no congestion on the LIE westbound from late Thursday through noon on Sunday July 5, with three or fewer miles operating under 4 mph. However, from noon through 8: PM on Sunday, the LIE westbound exhibited multiple peak periods with travelers returning to the city (Figure 7d, callout ix). The route saw 6 miles of congestion at 7
9 2:45 PM, 14 miles at 4:45 PM, 18 miles at 6:3 PM, 22 miles at 7:15 PM, and 18 miles again at 8:45 PM. During the same afternoon, the eastbound direction had relatively little congestion, peaking at 7 miles between 1: PM and 1:3 PM. The following Monday also saw atypical weekday activity on the LIE, with generally fewer miles and less severe peaks of congestion for both eastbound and westbound. Interestingly in the westbound direction, some of the more congested periods occurred early in the morning similar to the Thursday before the holiday. There were 1 and 12 miles of congestion recorded at 6:3 AM and 7:45 AM, respectively for the westbound direction on Monday (Figure 7c, callout x), but was not comparable to Sunday evening. This may be due to some of the travelers taking extended vacation through the beginning of the week. In comparison, the 45 in Los Angeles exhibited more typical AM and PM peaking patterns on Monday. COAST-TO-COAST INTERSTATES The methods used to identify congestion on routes in metropolitan areas can be applied nationally for coastto-coast Interstates. Figure 8 illustrates the number of miles of roadway operating below 4 mph in a map with each state shaded by congestion severity. Both I-8 and I-1 at 5: PM Eastern Daylight Time on July 2 are shown for all states. In Figure 8a, the bulk of the congestion is located in California with 3% (42 miles) of the total congestion on I-8 nationally in both directions. Indiana, Pennsylvania, New Jersey, and Illinois share much of the remaining congestion with 16% (23 miles), 14% (21 miles), 12% (17 miles), and 11% (15 miles), respectively. Figure 8b shows I-1 during the same period with California on top with 41% (83 miles) of the total congestion, followed by Texas (26%, 53 miles) and Louisiana (21%, 44 miles). Figure 9 illustrates an example of a state-level drill-down of congestion by county on I-8 in Pennsylvania for 5: PM on July 2. As depicted by the darkly-shaded area, Clarion County had the most congestion with 11 miles operating below 4 mph. The information depicted in Figure 8 can be viewed over time in a stacked-area graph in Figure 1. The congested miles of each state on each of the routes is represented by color. Figure 1a, callout i shows the same PM rush on Thursday on I-8 eastbound with California having the most miles congested from noon through midnight Pacific Daylight Time. Figure 1b, callout ii shows most of the I-8 westbound congestion dominated by Pennsylvania and New Jersey from morning through midnight Eastern Daylight Time on Thursday. Figure 1a, callout iii and Figure 1b, callout iv shows a similar congestion pattern on I-8 eastbound for California, and I-8 westbound for Pennsylvania and New Jersey on Friday. Figure 1a, callout v and Figure 1b callout vi shows somewhat of a reversal of the Thursday and Friday trend with Pennsylvania being congested in the eastbound direction and California being congested in the westbound direction. Additionally, Ohio adds to some of the congestion eastbound while Utah, Nebraska, and most 8
10 significantly Indiana adding to the congestion westbound. The congestion on I-8 eastbound reached 14 miles at its peak at 5:15 PM EDT coast-to-coast. Figure 1c and Figure 1d illustrates the same 5-day period for I-1 through all states for the eastbound and westbound, respectively. Figure 1c, callout vii and Figure 1d, callout viii shows California, Texas, and Louisiana accounting for the majority of the congestion Thursday afternoon and evening. Figure 1c, callout ix shows I-1 eastbound through Louisiana significantly congested Friday afternoon, while during the same period Texas was congested in the other direction (Figure 1d, callout x). On Sunday, the bulk of the congestion going eastbound was also in Texas with 37 miles at 5:15 PM EDT. In the westbound direction, Alabama tops the list with 26 miles congested at 4:15 PM EDT. In contrast, Monday afternoon and evening had less congestion coast-to-coast than Sunday in three out of the four routes. CONCLUSIONS AND FUTURE WORK Fifteen-minute aggregated crowd-sourced probe data was used to analyze traffic congestion during the week of June 28 to July 6 over the Independence Day holiday. The study found peak congestion occurred in the afternoon of July 2 at four Metropolitan Statistical Areas (MSAs): 3 miles (5%) of limited access roads in the Indianapolis area at 5:45 PM EDT; 343 miles (26%) of limited access roads in the Chicago area at 4:3 PM CDT; 669 miles (41%) of limited access roads in the Los Angeles area at 5:3 PM PDT; 554 miles (21%) of limited access roads in the New York area at 4:45 PM EDT; Nationally, two coast-to-coast routes were analyzed during the July 4 holiday weekend. California accounted for 42 miles (3%) of the total congestion on I-8 and 83 miles (41%) of the total congest on I- 1 nationally during the PM rush on July 2. The congestion on I-8 reached a peak in the eastbound direction at 5:15 PM EDT on July 6 with 14 miles of congestion combined across all states. One-week scalability in these data analytics have been demonstrated on over 16, miles of roadway across the United States. With greater computing power, it is feasible to leverage robust software application implementations to enable wide-area, informative roadway performance visualizations during normal or extraordinary travel periods. Future developments of these systems would enable transportation agencies to leverage real time and historic traffic data to make better data-driven operational decisions, as well as providing a source of information for users who are planning trips on busy holidays through widespread media dissemination. 9
11 ACKNOWLEDGEMENT The data source used for this paper was provided by INRIX. This work was supported in part by the Joint Transportation Research Program administered by the Indiana Department of Transportation and Purdue University. The contents of this paper reflect the views of the authors, who are responsible for the facts and the accuracy of the data presented herein, and do not necessarily reflect the official views or policies of the sponsoring organizations. These contents do not constitute a standard, specification, or regulation. 1
12 REFERENCES 1. Wasson, J. S., Sturdevant, J. R., and Bullock, D. M. "Real-Time Travel Time Estimates Using Media 334 Access Control Address Matching." ITE Journal, 78(6), -23, Brennan Jr., T.M., S.M. Remias, D.K. Horton, and D.M. Bullock, Probe Vehicle Based Statewide Mobility Performance Measures for Decision Makers, Transportation Research Record No. 2338, pp. 78-9, 14, DOI / Remias S, Brennan T, Grimmer G, Cox E, Horton D, Bullock D. 11 Indiana Interstate Mobility Report - Full Version. West Lafayette, Indiana: Purdue University, Indiana Mobility Reports; 12. Report No.: ISBN: Remias S, Brennan T, Day C, Summers H, Cox E, Horton D, Bullock D. 12 Indiana Mobility Report - Full Version. West Lafayette, Indiana: Purdue University, Indiana Mobility Reports; 13. Report No.: ISBN: Maryland Department of Transportation, 12 Maryland State Highway Mobility Report, July California Department of Transportation, Mobility Performance Report 9, February Washington State Department of Transportation, The 12 Congestion Report, August Remias, S.M., T.M. Brennan, C.M. Day, H.T. Summers, D.K. Horton, E.D. Cox, and D.M. Bullock, Spatially Referenced Probe Data Performance Measures for Infrastructure Investment Decision Makers, Transportation Research Record No.24, pp , 14, DOI: / Haghani, A., M. Hamdi, K.F. Sadabadi, I-95 Corridor coalition vehicle probe project: validation of Inrix data July-September 8-Final Report, I-95 Corridor Coalition. January INRIX. INRIX Traffic Scorecard. < Lomax, T., D. Shrank, B. Eiselee. 12 Annual Urban Mobility Report. College Station, Texas; The Texas A&M University System, Texas A& M Transportation Institute, Lomax, T., D. Shrank, B. Eiselee. 11 Urban Mobility Report Powered by INRIX Traffic Data. College Station, Texas; The Texas A&M University System, Texas A& M Transportation Institute, FHWA, MAP-21 Moving Ahead for Progress in the 21st Century Act, July "Metropolitan and Micropolitan Statistical Areas," U.S. Census Bureau. February
13 FIGURES AND TABLES Figures Figure 1. Scalability of Probe Data Figure minute aggregate speed data for segment of I-95 in Figure 1a Figure 3. Speed Summary for major metropolitan areas on July 2, 15 at 5: PM local time. 15 Figure 4. Spatial representation of traffic speeds on July 2, 15 at 5: PM local time Figure 5. Top congested routes in four metro areas, July 2, Figure 6. Routes in Los Angeles and New York over Independence Day, Figure 7. Comparing week prior to Independence Day weekend for three metropolitan areas, Figure 8. Map highlighting miles of congestion per state at 5:PM Eastern Daylight Time.... Figure 9. Map highlighting miles of congestion per county in Pennsylvania on I-8 in both directions at 5:PM Eastern Daylight Time Figure 1. Congestion on I-8 over Independence Day weekend in all through states


")
 127, miles)")
14 i a) Segment Level (n = 1, length =.5 miles) b) Corridor Level (n = 64, length = 53.8 miles) c) Metro Level (n = 475, length = 2,583 d) National Level (n ~17,, length ~ miles) 127, miles) Figure 1. Scalability of Probe Data 13
15 Speed Speed Li, Remias, Taylor, Bullock i 1: PM 1:3 PM 2: PM 2:3 PM a) One-minute data : PM 1:3 PM 2: PM 2:3 PM b) 15-minute aggregates. Figure 2. One-minute and 15-minute aggregate speed data for segment of I-95 in Figure 1a. 14
16 Chicago Local Time 8 AM 12 PM 3 PM 5 P New York Chicago Local Time 8 AM 12 PM 3 PM 5 PM 7 PM Chicago New York Indianapolis Chicago New York Indianapolis New York Los Angeles New York Indianapolis Indianapolis Los Angeles Los Angeles Indianapolis Los Angeles No Data <1 MPH 1-19 Los MPH Angeles-29 MPH 3-39 MPH 4-49 MPH 5-59 MPH 6+ MPH a) 12: PM EDT. Chicago New York Indianapolis Los Angeles No Data <1 MPH 1-19 MPH -29 MPH 3-39 MPH 4-49 MPH 5-59 MPH 6+ MPH a) 5: PM EDT. Figure 3. Speed overview for major metropolitan areas on July 2,

 New York City Figure 4.")

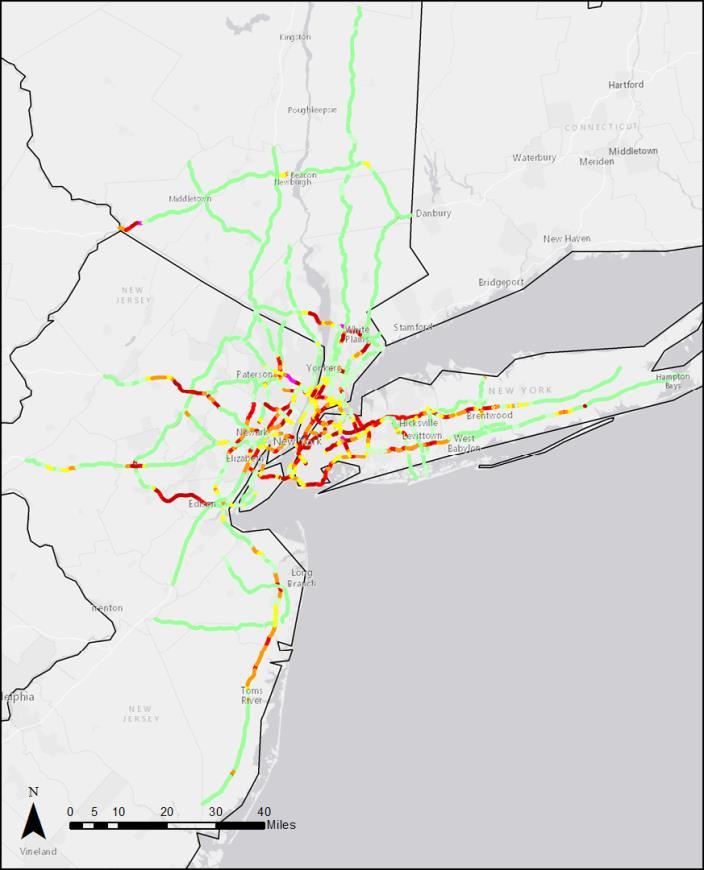
17 a) Indianapolis metropolitan area. b) Chicago metropolitan area. c) Los Angeles metropolitan area. d) New York City metropolitan area. Figure 4. Spatial representation of traffic speeds on July 2, 15 at 5: PM local time 16
18 I-465 OL US 31 NB I-65 SB I-465 Inner Loop US 31 SB I-69 NB I-465 Outer Loop US 31 NB I-65 SB I-465 Inner Loop US 31 SB I-69 NB Keystone Avenue NB Keystone Avenue SB I-7 WB I-7 EB Miles of Roadway Below 4 mph Miles of Roadway Below 4 mph (a) Indianapolis metropolitan area at 5:PM Eastern Daylight Time. 39 to 3 mph 29 to mph 19 to 1 mph < 1mph I-294 (Tri-State Tollway) SB I-8, I-8/294, I-8/94 EB I-29 (Eisenhower Expressway) EB I-294 (Tri-State Tollway) NB I-29 (Eisenhower Expressway) WB I-9 (Jane Addams Mem. Twy) WB I-55 (Will County) NB I-55 (Stevenson Expressway) SB I-94 (Edens Expressway) EB I-355 (Veterans Mem. Twy SB I-465 OL US 31 NB I-65 SB I-465 Inner Loop US 31 SB I-69 NB Miles of Roadway Below 4 mph Miles of Roadway Below 4 mph I-45 (San Diego Freeway) NB I-45 (San Diego Freeway) SB CA-6 (Pomona Freeway) EB I-5 (Santa Ana Freeway) NB I-21 (Foothill Freeway) EB I-65 I-1 (San SB Bernardino Freeway) EB I-5 (Golden State Freeway) NB I-15 (Glenn Anderson Freeway) EB I-1 (Santa Monica Freeway) EB CA-57 (Orange Freeway) NB I-465 OL US 31 NB I-465 Inner Loop US 31 SB I-69 NB (b) Chicago metropolitan area at 5:PM Central Daylight Time. (c) Los Angeles metropolitan area at 5:PM Pacific Daylight Time. (d) New York City metropolitan area at 5:PM Eastern Daylight Time. 39 to 3 mph 29 to mph 19 to 1 mph < 1mph Miles of Roadway Below 4 mph Miles of Roadway Below 4 mph Garden State Parkway SB I-495 (Long Island Expressway) EB I-278 (NY) WB I-278 (NY) EB I-95 (NJ Turnpike) SB I-65 SB I-87 NB I-287 (NJ) SB Belt Parkway WB Southern State Parkway EB Southern State Parkway WB I-465 OL US 31 NB I-465 Inner Loop US 31 SB I-69 NB ii 39 to 3 mph 29 to mph 19 to 1 mph < 1mph Miles of Roadway Below 4 mph Miles of Roadway Below 4 mph to 3 mph 29 to mph 19 to 1 mph < 1mph i iii Figure 5. Top congested routes in four metro areas, July 2,
19 Miles of congestion Miles of congestion Miles of congestion Li, Remias, Taylor, Bullock Sun 6/28 Mon 6/29 Tue 6/3 Wed 7/1 Thu 7/2 Fri 7/3 Sat 7/4 Sun 7/ i 1 : 12: : 12: : 12: : 12: : 12: : 12: : 12: : 12: (a) Chicago metropolitan area Sun 6/28 Mon 6/29 Tue 6/3 Wed 7/1 Thu 7/2 Fri 7/3 Sat 7/4 Sun 7/5 ii iii : 12: : 12: : 12: : 12: : 12: : 12: : 12: : 12: (b) Los Angeles metropolitan area. 8 7 Sun 6/28 Mon 6/29 Tue 6/3 Wed 7/1 Thu 7/2 Fri 7/3 Sat 7/4 Sun 7/ iv : 12: : 12: : 12: : 12: : 12: : 12: : 12: : 12: (c) New York City metropolitan area. Figure 6. Comparing week prior to Independence Day weekend for three metropolitan areas, 15 (local time). 18
20 Miles of congestion Miles of congestion Miles of congestion Miles of congestion Li, Remias, Taylor, Bullock I-465 OL Thursday 7/2 4 Friday 7/3 Saturday 7/4 Sunday 7/5 Monday 7/6 US 31 NB 35 i 39 to 3 mph I-65 SB 3 29 to mph I-465 Inner 25 Loop 19 to 1 mph US 31 SB < 1mph 15 I-69 NB iv Keystone Avenue 1 NB ii Keystone Avenue 5 SB iii : 6: 12: 18: : 6: 12: 18: : 6: 12: 18: : 6: 12: 18: : 6: 12: 18: 45 I-465 OL Thursday 7/2 4 US 31 NB 35 I-65 SB v 3 I-465 Inner Loop 25 US 31 SB I-69 NB 15 Keystone Avenue 1 NB Keystone Avenue 5 SB (a) I-45 San Diego Freeway NB, Pacific Daylight Time Friday 7/3 Saturday 7/4 Sunday 7/5 Monday 7/6 vi 39 to 3 mph 29 to mph 19 to 1 mph < 1mph : 6: 12: 18: : 6: 12: 18: : 6: 12: 18: : 6: 12: 18: : 6: 12: 18: 45 I-465 OL Thursday 7/2 US 4 31 NB 35I-65 SB vii 3 I-465 Inner Loop 25 US 31 SB I-69 NB 15 Keystone Avenue NB 1 Keystone Avenue SB 5 (b) I-45 San Diego Freeway SB, Pacific Daylight Time. viii Friday 7/3 Saturday 7/4 Sunday 7/5 Monday 7/6 39 to 3 mph 29 to mph 19 to 1 mph < 1mph : 6: 12: 18: : 6: 12: 18: : 6: 12: 18: : 6: 12: 18: : 6: 12: 18: 45 I-465 OL Thursday 7/2 US 4 31 NB 35I-65 SB 3 I-465 Inner Loop 25 US 31 SB I-69 NB 15 Keystone Avenue NB 1 Keystone Avenue SB 5 (c) I-495 Long Island Expressway EB, Eastern Daylight Time. Friday 7/3 Saturday 7/4 Sunday 7/5 Monday 7/6 39 to 3 mph 29 to mph 19 to 1 mph < 1mph : 6: 12: 18: : 6: 12: 18: : 6: 12: 18: : 6: 12: 18: : 6: 12: 18: (d) I-495 Long Island Expressway WB, Eastern Daylight Time. Figure 7. Routes in Los Angeles and New York over Independence Day, 15. ix x 19

21 IN 23 mi (a) I-8 both directions. (b) I-1 both directions. Figure 8. Map highlighting miles of congestion per state at 5:PM Eastern Daylight Time.

22 Montour Mercer mi mi Union Clarion Jefferson mi 11.2 mi 3.2 mi Columbia 2.2 mi Carbon mi Figure 9. Map highlighting miles of congestion per county in Pennsylvania on I-8 in both directions at 5:PM Eastern Daylight Time. 21
23 Miles Miles of of congestion Miles Miles of congestion of Miles Miles of congestion of Miles Miles of of congestion Li, Remias, Taylor, Bullock i 6 4 iii v 4 EDT : 6: 12: 18: : 6: 12: 18: : 6: 12: 18: : 6: 12: 18: : 6: 12: 18: PDT 21: 3: 9: 15: 21: 3: 9: 15: 21: 3: 9: 15: 21: 3: 9: 15: 21: 3: 9: 15: Thursday 7/2 Friday 7/3 Saturday 7/4 Sunday 7/5 Monday 7/6 California Illinois Indiana Ohio Pennsylvania All other states (a) I-8 eastbound vi ii iv 4 EDT : 6: 12: 18: : 6: 12: 18: : 6: 12: 18: : 6: 12: 18: : 6: 12: 18: PDT 21: 3: 9: 15: 21: 3: 9: 15: 21: 3: 9: 15: 21: 3: 9: 15: 21: 3: 9: 15: Thursday 7/2 Friday 7/3 Saturday 7/4 Sunday 7/5 Monday 7/6 California Utah Nebraska Illinois Indiana Ohio Pennsylvania New Jersey All other states (b) I-8 westbound. Thursday 7/2 Friday 7/3 Saturday 7/4 Sunday 7/5 Monday 7/ vii ix xi 4 EDT : 6: 12: 18: : 6: 12: 18: : 6: 12: 18: : 6: 12: 18: : 6: 12: 18: PDT 21: 3: 9: 15: 21: 3: 9: 15: 21: 3: 9: 15: 21: 3: 9: 15: 21: 3: 9: 15: California Arizona New Mexico Texas Louisiana Mississippi Alabama Florida (c) I-1 eastbound viii xii 6 4 x 4 EDT : 6: 12: 18: : 6: 12: 18: : 6: 12: 18: : 6: 12: 18: : 6: 12: 18: PDT 21: 3: 9: 15: 21: 3: 9: 15: 21: 3: 9: 15: 21: 3: 9: 15: 21: 3: 9: 15: Thursday 7/2 Friday 7/3 Saturday 7/4 Sunday 7/5 Monday 7/6 California Arizona New Mexico Texas Louisiana Mississippi Alabama Florida (d) I-1 westbound. Figure 1. Congestion on I-8 over Independence Day weekend in all through states. 22
Appendix SAN San Diego, California 2003 Annual Report on Freeway Mobility and Reliability
 (http://mobility.tamu.edu/mmp) Office of Operations, Federal Highway Administration Appendix SAN San Diego, California 2003 Annual Report on Freeway Mobility and Reliability This report is a supplement
I-95 Corridor Coalition. I-95 Corridor Coalition Vehicle Probe Project: Validation of INRIX Data Monthly Report Virginia
 I-95 Corridor Coalition I-95 Corridor Coalition Vehicle Probe Project: Validation of INRIX Data Monthly Report Virginia June 2009 I-95 CORRIDOR COALITION VEHICLE PROBE PROJECT: VALIDATION OF INRIX DATA
Sample Validation of Vehicle Probe Data Using Bluetooth Traffic Monitoring Technology
 Sample Validation of Vehicle Probe Data Using Bluetooth Traffic Monitoring Technology Data taken from the Northern Section of I-49 (Capitol Beltway) on June 17, 28 The I-9 Corridor Coalition is a partnership
I-95 Corridor Coalition. I-95 Corridor Coalition Vehicle Probe Project: Validation of INRIX Data Monthly Report Virginia
 I-95 Corridor Coalition I-95 Corridor Coalition Vehicle Probe Project: Validation of INRIX Data Monthly Report Virginia February 2010 I-95 CORRIDOR COALITION VEHICLE PROBE PROJECT: VALIDATION OF INRIX
February 2012 Caltrain Annual Passenger Counts Key Findings
 February 2012 Caltrain Annual Passenger Counts Key Findings Key Findings February 2012 Caltrain Annual Passenger Counts The 2012 annual Caltrain passenger counts, which were conducted in February 2012,
Expansion Projects Description
 Expansion Projects Description The Turnpike expansion program was authorized by the Florida Legislature in 1990 to meet the State s backlog of needed highway facilities. The Legislature set environmental
Technical Memorandum Analysis Procedures and Mobility Performance Measures 100 Most Congested Texas Road Sections What s New for 2015
 Technical Memorandum Analysis Procedures and Mobility Performance Measures 100 Most Congested Texas Road Sections Prepared by Texas A&M Transportation Institute August 2015 This memo documents the analysis
Project Title: Using Truck GPS Data for Freight Performance Analysis in the Twin Cities Metro Area Prepared by: Chen-Fu Liao (PI) Task Due: 7/31/2013
 Task Due: 7/31/2013") Project Title: Using Truck GPS Data for Freight Performance Analysis in the Twin Cities Metro Area Prepared by: Chen-Fu Liao (PI) Task Due: 7/31/2013 TASK #3 PROCESS TRUCK GPS DATA AND DERIVE PERFORMANCE
Project Title: Using Truck GPS Data for Freight Performance Analysis in the Twin Cities Metro Area Prepared by: Chen-Fu Liao (PI) Task Due: 7/31/2013 TASK #3 PROCESS TRUCK GPS DATA AND DERIVE PERFORMANCE
TRAFFIC VOLUME TRENDS
 Page 1 U. S. Department Transportation Federal Highway Administration Office Highway Policy Information TRAFFIC VOLUME TRENDS September Travel on all roads and streets changed by +2.5 (5.8 billion vehicle
National Household Travel Survey Add-On Use in the Des Moines, Iowa, Metropolitan Area
 National Household Travel Survey Add-On Use in the Des Moines, Iowa, Metropolitan Area Presentation to the Transportation Research Board s National Household Travel Survey Conference: Data for Understanding
MILLERSVILLE PARK TRAFFIC IMPACT ANALYSIS ANNE ARUNDEL COUNTY, MARYLAND
 MILLERSVILLE PARK TRAFFIC IMPACT ANALYSIS ANNE ARUNDEL COUNTY, MARYLAND Prepared for: Department of Public Works Anne Arundel County Prepared by: URS Corporation 4 North Park Drive, Suite 3 Hunt Valley,
Meter Insights for Downtown Store
 Meter Insights for Downtown Store Commodity: Analysis Period: Prepared for: Report Date: Electricity 1 December 2013-31 December 2014 Arlington Mills 12 February 2015 Electricity use over the analysis
I-95 Corridor Coalition. I-95 Corridor Coalition Vehicle Probe Project: Validation of INRIX Data Monthly Report North Carolina
 I-95 Corridor Coalition I-95 Corridor Coalition Vehicle Probe Project: Validation of INRIX Data Monthly Report North Carolina June 2010 I-95 CORRIDOR COALITION VEHICLE PROBE PROJECT: VALIDATION OF INRIX
MEMO VIA . Ms. Amy Roth DPS Director, City of Three Rivers. To:
 MEMO To: Ms. Amy Roth DPS Director, City of Three Rivers VIA EMAIL From: Michael J. Labadie, PE Julie M. Kroll, PE, PTOE Brandon Hayes, PE, P.Eng. Fleis & VandenBrink Date: January 5, 2017 Re: Proposed
DOT HS October 2011
 TRAFFIC SAFETY FACTS 2009 Data DOT HS 811 389 October 2011 Motorcycles Definitions often vary across publications with respect to individuals on motorcycles. For this document, the following terms will
I-95 Corridor Coalition
 I-95 Corridor Coalition I-95 Corridor Coalition Vehicle Probe Project: Validation of INRIX Data Report for New Hampshire (#1) I-89 and I-93 October 2016 I-95 CORRIDOR COALITION VEHICLE PROBE PROJECT VALIDATION
BROWARD BOULEVARD CORRIDOR TRANSIT STUDY
 BROWARD BOULEVARD CORRIDOR TRANSIT STUDY FM # 42802411201 EXECUTIVE SUMMARY July 2012 GOBROWARD Broward Boulevard Corridor Transit Study FM # 42802411201 Executive Summary Prepared For: Ms. Khalilah Ffrench,
TRAFFIC SIMULATION IN REGIONAL MODELING: APPLICATION TO THE INTERSTATEE INFRASTRUCTURE NEAR THE TOLEDO SEA PORT
 MICHIGAN OHIO UNIVERSITY TRANSPORTATION CENTER Alternate energy and system mobility to stimulate economic development. Report No: MIOH UTC TS41p1-2 2012-Final TRAFFIC SIMULATION IN REGIONAL MODELING: APPLICATION
Table of Contents INTRODUCTION... 3 PROJECT STUDY AREA Figure 1 Vicinity Map Study Area... 4 EXISTING CONDITIONS... 5 TRAFFIC OPERATIONS...
 Crosshaven Drive Corridor Study City of Vestavia Hills, Alabama Table of Contents INTRODUCTION... 3 PROJECT STUDY AREA... 3 Figure 1 Vicinity Map Study Area... 4 EXISTING CONDITIONS... 5 TRAFFIC OPERATIONS...
Table of Contents. Attachment 1 Caltrain Service History Attachment 2 Tables and Graphs Caltrain Annual Passenger Counts 1 of 12 Final
 February 2013 Caltrain Annual Passenger Counts Key Finding gs Table of Contents Methodology and Background... 2 Recent Service Changes... 2 Weekday Ridership... 2 Stations... 4 Baby Bullet Stations...
Provisional Review of Fatal Collisions. January to December 31 st 2017
 Provisional Review of Fatal Collisions January to December 31 st 17 2 nd January 18 Review of 17 fatal collision statistics as of 31st December 17 Overview This report summarises the main trends in road
I-95 Corridor Coalition Vehicle Probe Project: HERE, INRIX and TOMTOM Data Validation. Report for North Carolina (#08) I-240, I-40 and I-26
 I-240, I-40 and I-26") I-95 Corridor Coalition Vehicle Probe Project: HERE, INRIX and TOMTOM Data Validation Report for North Carolina (#08) I-240, I-40 and I-26 Prepared by: Masoud Hamedi, Sanaz Aliari University of Maryland,
I-95 Corridor Coalition Vehicle Probe Project: HERE, INRIX and TOMTOM Data Validation Report for North Carolina (#08) I-240, I-40 and I-26 Prepared by: Masoud Hamedi, Sanaz Aliari University of Maryland,
Energy, Economic. Environmental Indicators
 Energy, Economic and AUGUST, 2018 All U.S. States & Select Extra Graphs Contents Purpose / Acknowledgements Context and Data Sources Graphs: USA RGGI States (Regional Greenhouse Gas Initiative participating
Spatial and Temporal Analysis of Real-World Empirical Fuel Use and Emissions
 Spatial and Temporal Analysis of Real-World Empirical Fuel Use and Emissions Extended Abstract 27-A-285-AWMA H. Christopher Frey, Kaishan Zhang Department of Civil, Construction and Environmental Engineering,
WIM #39 MN 43, MP 45.2 WINONA, MN APRIL 2010 MONTHLY REPORT
 WIM #39 MN 43, MP 45.2 WINONA, MN APRIL 2010 MONTHLY REPORT In order to understand the vehicle classes and groupings the Mn/DOT Vehicle Classification Scheme and the Vehicle Class Groupings for Forecasting
Southern Windsor County 2016 Traffic Count Program Summary April 2017
 Southern Windsor County 2016 Traffic Count Program Summary April 2017 The Southern Windsor County Regional Planning Commission (the RPC ) has been monitoring traffic at 19 locations throughout the southern
EXECUTIVE SUMMARY. The following is an outline of the traffic analysis performed by Hales Engineering for the traffic conditions of this project.
 EXECUTIVE SUMMARY This study addresses the traffic impacts associated with the proposed Shopko redevelopment located in Sugarhouse, Utah. The Shopko redevelopment project is located between 1300 East and
Honda Accord theft losses an update
 Highway Loss Data Institute Bulletin Vol. 34, No. 20 : September 2017 Honda Accord theft losses an update Executive Summary Thefts of tires and rims have become a significant problem for some vehicles.
Travel Time Savings Memorandum
 04-05-2018 TABLE OF CONTENTS 1 Background 3 Methodology 3 Inputs and Calculation 3 Assumptions 4 Light Rail Transit (LRT) Travel Times 5 Auto Travel Times 5 Bus Travel Times 6 Findings 7 Generalized Cost
February 2011 Caltrain Annual Passenger Counts Key Findings
 February 2011 Caltrain Annual Passenger Counts Key Findings Key Findings February 2011 Caltrain Annual Passenger Counts The 2011 annual Caltrain passenger counts, which were conducted in February 2011,
Traffic Safety Facts. Alcohol Data. Alcohol-Related Crashes and Fatalities
 Traffic Safety Facts 2005 Data Alcohol There were 16,885 alcohol-related fatalities in 2005 39 percent of the total traffic fatalities for the year. Alcohol-Related Crashes and Fatalities DOT HS 810 616
Metropolitan Freeway System 2007 Congestion Report
 Metropolitan Freeway System 2007 Congestion Report Minnesota Department of Transportation Office of Traffic, Safety and Operations Freeway Operations Section Regional Transportation Management Center March
Evaluation of Renton Ramp Meters on I-405
 Evaluation of Renton Ramp Meters on I-405 From the SE 8 th St. Interchange in Bellevue to the SR 167 Interchange in Renton January 2000 By Hien Trinh Edited by Jason Gibbens Northwest Region Traffic Systems
THE CORNERSTONE APARTMENTS TRAFFIC IMPACT STUDY R&M PROJECT NO
 THE CORNERSTONE APARTMENTS SITUATED AT N/E/C OF STAUDERMAN AVENUE AND FOREST AVENUE VILLAGE OF LYNBROOK NASSAU COUNTY, NEW YORK TRAFFIC IMPACT STUDY R&M PROJECT NO. 2018-089 September 2018 50 Elm Street,
WHITE PAPER. Preventing Collisions and Reducing Fleet Costs While Using the Zendrive Dashboard
 WHITE PAPER Preventing Collisions and Reducing Fleet Costs While Using the Zendrive Dashboard August 2017 Introduction The term accident, even in a collision sense, often has the connotation of being an
State Safety Oversight Program
 State Safety Oversight Program Maps and Charts September 2015 Table of Contents States and Rail Fixed Guideway Public Transportation Systems (RFGPTS)... 3 RFGPTS by State and Mode... 4 RFGPTS Unlinked
REPORT CARD FOR CALIFORNIA S INFRASTRUCTURE WHAT YOU SHOULD KNOW ABOUT CALIFORNIA S TRANSIT FACILITIES
 TRANSIT GRADE: C- WHAT YOU SHOULD KNOW ABOUT TRANSIT FACILITIES California needs robust, flexible and reliable transit systems to reduce peak congestion on our highways, provide options for citizens who
ITSMR Research Note. Motorcyclists and Impaired Driving ABSTRACT INTRODUCTION KEY FINDINGS. September 2013
 September 2013 KEY FINDINGS F&PI CRASHES INVOLVING IMPAIRED MOTORCYCLISTS 27% of the fatal MC crashes over the five year period, 2008-2012, were alcohol-related. 48% of the alcohol-related F&PI MC crashes
Missouri Seat Belt Usage Survey for 2017
 Missouri Seat Belt Usage Survey for 2017 Conducted for the Highway Safety & Traffic Division of the Missouri Department of Transportation by The Missouri Safety Center University of Central Missouri Final
U.S. Highway Attributes Relevant to Lane Tracking Raina Shah Christopher Nowakowski Paul Green
 Technical Report UMTRI-98-34 August, 1998 U.S. Highway Attributes Relevant to Lane Tracking Raina Shah Christopher Nowakowski Paul Green 1. Report No. UMTRI-98-34 Technical Report Documentation Page 2.
DOT HS July 2012
 TRAFFIC SAFETY FACTS 2010 Data DOT HS 811 639 July 2012 Motorcycles In 2010, 4,502 motorcyclists were killed a slight increase from the 4,469 motorcyclists killed in 2009. There were 82,000 motorcyclists
Michigan. Traffic. Profile
 June 2014 Revised 5/11/15 Michigan 2013 Traffic Crash Profile Reporting Criteria Please pay particular attention to the wording when interpreting the three levels of data gathered for this report. Crash
TRAFFIC VOLUME TRENDS July 2002
 TRAFFIC VOLUME TRENDS July 2002 Travel on all roads and streets changed by +2.3 percent for July 2002 as compared to July 2001. Estimated Vehicle-Miles of Travel by Region - July 2002 - (in Billions) West
Freight Performance Measures Using Truck GPS Data and the Application of National Performance Measure Research Data Set (NPMRDS)
") Freight Performance Measures Using Truck GPS Data and the Application of National Performance Measure Research Data Set (NPMRDS) Chen-Fu Liao Department of Civil, Environmental, and Geo- Engineering University
Freight Performance Measures Using Truck GPS Data and the Application of National Performance Measure Research Data Set (NPMRDS) Chen-Fu Liao Department of Civil, Environmental, and Geo- Engineering University
Michigan. Traffic. Profile
 June 2014 Revised 5/11/15 Michigan 2013 Traffic Crash Profile Reporting Criteria Please pay particular attention to the wording when interpreting the three levels of data gathered for this report. Crash
Key Findings. February 2009 Caltrain Annual Passenger Counts
 Key Findings February 2009 Caltrain Annual Passenger Counts The 2009 annual Caltrain passenger counts, which were conducted starting in late-january and were complete by mid-february, followed the same
Reduction of vehicle noise at lower speeds due to a porous open-graded asphalt pavement
 Reduction of vehicle noise at lower speeds due to a porous open-graded asphalt pavement Paul Donavan 1 1 Illingworth & Rodkin, Inc., USA ABSTRACT Vehicle noise measurements were made on an arterial roadway
WIM #41 CSAH 14, MP 14.9 CROOKSTON, MINNESOTA APRIL 2014 MONTHLY REPORT
 WIM #41 CSAH 14, MP 14.9 CROOKSTON, MINNESOTA APRIL 2014 MONTHLY REPORT In order to understand the vehicle classes and groupings, the MnDOT Vehicle Classification Scheme and the Vehicle Classification
To: File From: Adrian Soo, P. Eng. Markham, ON File: Date: August 18, 2015
 Memo To: From: Adrian Soo, P. Eng. Markham, ON : 165620021 Date: Reference: E.C. Row Expressway, Dominion Boulevard Interchange, Dougall Avenue Interchange, and Howard 1. Review of Interchange Geometry
Monthly Biodiesel Production Report
 Monthly Biodiesel Production Report With data for June 2017 August 2017 Independent Statistics & Analysis www.eia.gov U.S. Department of Energy Washington, DC 20585 This report was prepared by the U.S.
Traffic Engineering Study
 Traffic Engineering Study Bellaire Boulevard Prepared For: International Management District Technical Services, Inc. Texas Registered Engineering Firm F-3580 November 2009 Executive Summary has been requested
I-95 Corridor Coalition Vehicle Probe Project: HERE, INRIX and TOMTOM Data Validation
 I-95 Corridor Coalition Vehicle Probe Project: HERE, INRIX and TOMTOM Data Validation Report for Georgia (#03) I-75 Prepared by: Masoud Hamedi, Sanaz Aliari, Sara Zahedian University of Maryland, College
The major roadways in the study area are State Route 166 and State Route 33, which are shown on Figure 1-1 and described below:
 3.5 TRAFFIC AND CIRCULATION 3.5.1 Existing Conditions 3.5.1.1 Street Network DRAFT ENVIRONMENTAL IMPACT REPORT The major roadways in the study area are State Route 166 and State Route 33, which are shown
Traffic Accident Statistics
 2000 Missouri State Highway System Traffic Accident Statistics Missouri State Highway System Traffic Accident Statistics Table of Contents Subject Chapter 1: Statewide Traffic Accident Statistics, Introduction
New Jersey Turnpike Authority Interchange 6 to 9 Widening Program
 New Jersey Turnpike Authority Interchange 6 to 9 Widening Program Tuesday, September 18, 2007 Public Hearings: Time: 5:00 PM - 8:00 PM Wednesday, September 19, 2007 Senior Center 3 Municipal Drive Bordentown,
Project Title: Using Truck GPS Data for Freight Performance Analysis in the Twin Cities Metro Area Prepared by: Chen-Fu Liao (PI) Task Due: 9/30/2013
 Task Due: 9/30/2013") MnDOT Contract No. 998 Work Order No.47 213 Project Title: Using Truck GPS Data for Freight Performance Analysis in the Twin Cities Metro Area Prepared by: Chen-Fu Liao (PI) Task Due: 9/3/213 TASK #4:
MnDOT Contract No. 998 Work Order No.47 213 Project Title: Using Truck GPS Data for Freight Performance Analysis in the Twin Cities Metro Area Prepared by: Chen-Fu Liao (PI) Task Due: 9/3/213 TASK #4:
Signal System Timing and Phasing Program SAMPLE. Figure 1: General Location Map. Second St.
 I. Overview Consultant A was retained by the Ohio Department of Transportation to conduct traffic signal timing analyses on approximately one mile of roadway on between the Main Street and the Fourth Street
TIMBERVINE TRANSPORTATION IMPACT STUDY FORT COLLINS, COLORADO JANUARY Prepared for:
 TIMBERVINE TRANSPORTATION IMPACT STUDY FORT COLLINS, COLORADO JANUARY 2014 Prepared for: Hartford Companies 1218 W. Ash Street Suite A Windsor, Co 80550 Prepared by: DELICH ASSOCIATES 2272 Glen Haven Drive
Background Information about the Metrobus 29 Lines Study
 Background Information about the Metrobus 29 Lines Study Questions Overview of Existing Service Q. Why is the study being conducted? A. The 29 Lines provide an important connection between Annandale and
V. DEVELOPMENT OF CONCEPTS
 Martin Luther King, Jr. Drive Extension FINAL Feasibility Study Page 9 V. DEVELOPMENT OF CONCEPTS Throughout the study process several alternative alignments were developed and eliminated. Initial discussion
1999 Missouri State Highway System. Missouri Department of Transportation - Transportation Management Systems
 1999 Missouri State Highway System Traffic Accident Statistics - Transportation Management Systems Missouri State Highway System Traffic Accident Statistics Table of Contents Subject Chapter 1: Statewide
Metropolitan Freeway System 2013 Congestion Report
 Metropolitan Freeway System 2013 Congestion Report Metro District Office of Operations and Maintenance Regional Transportation Management Center May 2014 Table of Contents PURPOSE AND NEED... 1 INTRODUCTION...
Clean Harbors Canada, Inc.
 Clean Harbors Canada, Inc. Proposed Lambton Landfill Expansion Environmental Assessment Terms of Reference Transportation Assessment St. Clair Township, Ontario September 2009 itrans Consulting Inc. 260
PROJECT: Wilkinson Road Corridor Improvement Traffic Management Planning Project SUBJECT: Traffic Analysis
 TECHNICAL MEMORANDUM DATE: September 10, 2014 PROJECT 5861.03 NO: PROJECT: Wilkinson Road Corridor Improvement Traffic Management Planning Project SUBJECT: Traffic Analysis TO: Steve Holroyd - District
Trip Generation & Parking Occupancy Data Collection: Grocery Stores Student Chapter of Institute of Transportation Engineers at UCLA Spring 2014
 Trip Generation & Parking Occupancy Data Collection: Grocery Stores Student Chapter of Institute of Transportation Engineers at UCLA Spring 2014 Page 1 Introduction The UCLA Institute of Transportation
Road Tolls and Road Pricing Innovative Methods to Charge for the Use of Road Systems
 Road Tolls and Road Pricing Innovative Methods to Charge for the Use of Road Systems by Daphnée Benayoun & René P. Cousin The Louis Berger Group, Inc. Introduction Major challenges facing now the road
Start Time. LOCATION: Scotts Valley Dr QC JOB #: SPECIFIC LOCATION: 0 ft from Tabor St. DIRECTION: EB/WB CITY/STATE: Scotts Valley, CA
 Tube Counts Type of report: Tube Count - Volume Data LOCATION: Scotts Valley Dr QC JOB #: 245667 SPECIFIC LOCATION: ft from Tabor St DIRECTION: EB/WB CITY/STATE: Scotts Valley, CA DATE: Mar 2 24 - Mar
APPENDIX C1 TRAFFIC ANALYSIS DESIGN YEAR TRAFFIC ANALYSIS
 APPENDIX C1 TRAFFIC ANALYSIS DESIGN YEAR TRAFFIC ANALYSIS DESIGN YEAR TRAFFIC ANALYSIS February 2018 Highway & Bridge Project PIN 6754.12 Route 13 Connector Road Chemung County February 2018 Appendix
TRAFFIC SAFETY FACTS Fatal Motor Vehicle Crashes: Overview. Research Note. DOT HS October 2017
 TRAFFIC SAFETY FACTS Research Note DOT HS 812 456 October 2017 2016 Fatal Motor Vehicle Crashes: Overview There were 37,461 people killed in crashes on U.S. roadways during 2016, an increase from 35,485
WIM #40 US 52, MP S. ST. PAUL, MN APRIL 2010 MONTHLY REPORT
 WIM #40 US 52, MP 126.8 S. ST. PAUL, MN APRIL 2010 MONTHLY REPORT In order to understand the vehicle classes and groupings the Mn/DOT Vehicle Classification Scheme and the Vehicle Class Groupings for Forecasting
CTfastrak Expansion. Stakeholder Meeting #4 Manchester Town Hall June 3, 2016
 CTfastrak Expansion Stakeholder Meeting #4 Manchester Town Hall June 3, 2016 Today s Agenda Phase I Update 2016 Service Plan Implementation Schedule & Cost Update Phase II Services Timeline Market Analysis
Summary findings. 1 Missouri has a greater population than any State ranked 1-9 in core group labor force participation.
 Labor in Missouri MSCDC Economic Report Series No. 9903 December 2000 By Professor John O. Ward, Chairman, UMKC Department of Economics Kurt V. Krueger, Department of Economics Graduate Student Michael
TRAFFIC SIGNAL DESIGN REPORT KING OF PRUSSIA ROAD & RAIDER ROAD RADNOR TOWNSHIP PENNSYLVANIA
 TRAFFIC SIGNAL DESIGN REPORT KING OF PRUSSIA ROAD & RAIDER ROAD RADNOR TOWNSHIP PENNSYLVANIA PREPARED FOR: UNIVERSITY OF PENNSYLVANIA HEALTH SYSTEM 34 CIVIC CENTER BOULEVARD PHILADELPHIA, PA 1987 (61)
Louisville / Jefferson County Hazardous Material Commodity Flow Analysis
 Western Kentucky University TopSCHOLAR Public Health Faculty Publications Public Health 8-2012 Louisville / Jefferson County Hazardous Material Commodity Flow Analysis Dr. Vijay Golla Western Kentucky
Study Area and Location District PSA Ward ANC Phase Description C Planned Suitland Parkway Westbound at Stanton Road Southeast
 Speed Limit and Safety Nexus Studies for Automated Enforcement Locations in the District of Columbia Suitland Parkway at Stanton Road SE Study Area and Location District PSA Ward ANC Phase Description
Costco Gasoline Fuel Station Transportation Characteristics
 Exhibit A MEMORANDUM Date: May 23, 2013 Project #: I-10 To: Jennifer Murillo, Costco Wholesale Terry Odle, Mulvanny G2 Architecture From: Sonia Hennum, PTOE Project: Subject: Signal Hill Costco Gasoline
5. OPPORTUNITIES AND NEXT STEPS
 5. OPPORTUNITIES AND NEXT STEPS When the METRO Green Line LRT begins operating in mid-2014, a strong emphasis will be placed on providing frequent connecting bus service with Green Line trains. Bus hours
Project Scoping Report Appendix B Project Web Site. APPENDIX B Project Web Site
 Project Scoping Report Appendix B Project Web Site APPENDIX B Project Web Site WESTSIDE EXTENSION TRANSIT CORRIDOR STUDY February 4, 2008 News and Info of 1 http://metro.net/projects_programs/westside/news_info.htm#topofpage
RELATIVE COSTS OF DRIVING ELECTRIC AND GASOLINE VEHICLES
 SWT-2018-1 JANUARY 2018 RELATIVE COSTS OF DRIVING ELECTRIC AND GASOLINE VEHICLES IN THE INDIVIDUAL U.S. STATES MICHAEL SIVAK BRANDON SCHOETTLE SUSTAINABLE WORLDWIDE TRANSPORTATION RELATIVE COSTS OF DRIVING
Madison BRT Transit Corridor Study Proposed BRT Operations Plans
 Madison BRT Transit Corridor Study Proposed BRT Operations Plans This paper presents a description of the proposed BRT operations plan for use in the Madison BRT Transit Corridor Study. The objective is
Table 8-1: Service Frequencies for All Short-List Alternatives by Day of Week and Time of Day Frequency Day of Week Time of Day Time Period
 8. Operating Plans The following Section presents the operating plans for the Short-List Alternatives. The modern streetcar operating plans are presented for Alternatives 2 and 3, followed by bus rapid
Abstract. Executive Summary. Emily Rogers Jean Wang ORF 467 Final Report-Middlesex County
 Emily Rogers Jean Wang ORF 467 Final Report-Middlesex County Abstract The purpose of this investigation is to model the demand for an ataxi system in Middlesex County. Given transportation statistics for
FHWA/IN/JTRP-2000/23. Final Report. Sedat Gulen John Nagle John Weaver Victor Gallivan
 FHWA/IN/JTRP-2000/23 Final Report DETERMINATION OF PRACTICAL ESALS PER TRUCK VALUES ON INDIANA ROADS Sedat Gulen John Nagle John Weaver Victor Gallivan December 2000 Final Report FHWA/IN/JTRP-2000/23 DETERMINATION
2016 Congestion Report
 2016 Congestion Report Metropolitan Freeway System May 2017 2016 Congestion Report 1 Table of Contents Purpose and Need...3 Introduction...3 Methodology...4 2016 Results...5 Explanation of Percentage Miles
2017 Adjusted Count Report February 12, 2018
 A statewide multi-use trail user study and volunteer data collection program 2017 Adjusted Count Report February 12, 2018 The following report includes the final adjusted infrared (IR) counter data at
WIM #31 US 2, MP 8.0 EAST GRAND FORKS, MN JANUARY 2015 MONTHLY REPORT
 WIM #31 US 2, MP 8.0 EAST GRAND FORKS, MN JANUARY 2015 MONTHLY REPORT WIM #31 EAST GRAND FORKS MONTHLY REPORT - JANUARY 2015 WIM Site Location WIM #31 is located on US 2 at mile post 8.0, southeast of
Alpine Highway to North County Boulevard Connector Study
 Alpine Highway to North County Boulevard Connector Study prepared by Avenue Consultants March 16, 2017 North County Boulevard Connector Study March 16, 2017 Table of Contents 1 Summary of Findings... 1
Change in Vehicle Occupancy Used in Mobility Monitoring Efforts
 Change in Vehicle Occupancy Used in Mobility Monitoring Efforts By Phil Lasley, PhD, AICP, PMP Assistant Research Scientist Mobility Analysis Program Texas A&M Transportation Institute August 2017 Summary
Performance Measure Summary - New York-Newark NY-NJ-CT. Performance Measures and Definition of Terms
 Performance Measure Summary - New York-Newark NY-NJ-CT There are several inventory and performance measures listed in the pages of this Urban Area Report for the years from 1982 to 2014. There is no single
M6 TOLL TRAFFIC MONITORING STUDY
 ` M6 TOLL TRAFFIC MONITORING STUDY Traffic Impact Study Report POST OPENING PROJECT EVALUATION M6 TOLL TRAFFIC IMPACT STUDY REPORT JOB NUMBER: 4416515.1525.600 DOCUMENT REF: M6 Toll Traffic Impact Study
NEWS RELEASE November 8, 2017
 NEWS RELEASE November 8, 2017 Contact: Marsha Roa Public Information Manager 909.839.7055 mroa@diamondbarca.gov GRAND AVENUE INTERCHANGE AT SR-57 (ORANGE) AND SR-60 (POMONA) MULTIPLE ROADWAY, RAMP AND
Countdown to the Closure Extended 53-Hour Closure of I-405 Freeway Between U.S. 101 and I-10 Planned in Mid-July for Mulholland Bridge Demolition
 Countdown to the Closure Extended 3-Hour Closure of I-40 Freeway Between U.S. 0 and I-0 Planned in Mid-July for Mulholland Bridge Demolition Work Los Angeles, Calif. Plan Ahead, Avoid The Area, Or Stay
Statement before the New Hampshire House Transportation Committee. Research on primary-enforcement safety belt use laws
 Statement before the New Hampshire House Transportation Committee Research on primary-enforcement safety belt use laws Jessica B. Cicchino, Ph.D. Insurance Institute for Highway Safety The Insurance Institute
COMMERCIAL DRIVER BEHAVIORAL ANALYSIS USING REAL-TIME MIRROR CHECK MONITORING TOOLS
 COMMERCIAL DRIVER BEHAVIORAL ANALYSIS USING REAL-TIME MIRROR CHECK MONITORING TOOLS Margaret McNamara Purdue University 55 Stadium Mall Drive, West Lafayette, IN 4796 Tel: 765-496-7314 Email: mcnamar@purdue.edu
Measuring Accessibility. Andrew Owen Director, Accessibility Observatory May 17, 2017
 Measuring Accessibility Andrew Owen Director, Accessibility Observatory May 17, 2017 1. Overview 2. Methodology 3. Reporting Accessibility 4. Policy Implications 1. Overview What is Accessibility? Accessibility
TABLE OF CONTENTS SECTION PAGE. Executive Summary... xii
 TABLE OF CONTENTS SECTION PAGE Executive Summary... xii 1.0 Introduction... 1 1.1 Study Area... 2 1.2 Traffic Impact Analysis Scenarios... 4 1.3 Study Area - City of Orange... 4 2.0 Project Description
Transportation Electrification: Reducing Emissions, Driving Innovation. August 2017
 Transportation Electrification: Reducing Emissions, Driving Innovation August 2017 CA raising the bar in environmental policy and action Senate Bill 350 (DeLeon, 2015) established broad and ambitious clean
Truck Axle Weight Distributions
 Truck Axle Weight Distributions Implementation Report IR-16-02 Prepared for Texas Department of Transportation Maintenance Division Prepared by Texas A&M Transportation Institute Cesar Quiroga Jing Li
2010 Migration Patterns traffic flow by state/province
 Interstate and Cross-Border 2010 Migration Patterns traffic flow by state/province Based on 74,541 Interstate Household Goods Moves from January 1, 2010 through December 31, 2010 UNITED STATES ALABAMA
2009 Migration Patterns traffic flow by state/province
 Interstate and Cross-Border 2009 Migration Patterns traffic flow by state/province Based on 71,474 Interstate Household Goods Moves from January 1, 2009 through December 31, 2009 UNITED STATES ALABAMA