Making the Transition to Light-duty Electric-drive Vehicles in the U.S.: Costs in Perspective to Joan Ogden, Lew Fulton, Dan Sperling
|
|
|
- Gwen Henderson
- 6 years ago
- Views:
Transcription
1 Making the Transition to Light-duty Electric-drive Vehicles in the U.S.: Costs in Perspective to 2035 Joan Ogden, Lew Fulton, Dan Sperling Revised December 13, 2016 Abstract This paper estimates the investment and subsidy costs that may be needed to bring light-duty battery and fuel cell electric-drive vehicles into the U.S. market in large numbers by 2035, along with the investment costs and subsidies for associated electricity and hydrogen refueling infrastructure. We estimate that during this 20-year transition period, the investments (additional purchase costs) for the vehicles and the first costs of installing refueling stations and charging infrastructure could total $300 to $600 billion dollars. Purchase cost increments for vehicles typically make up 70-80% of these costs. Using a breakeven cost analysis and taking into account fuel savings, we estimate that subsidy levels for vehicles may be 10-20% less than these first cost increments. The separate subsidies required for fuel infrastructure are estimated to be a very small percentage of their investment costs, particularly if hydrogen refueling infrastructure becomes commercially viable after an initial period of introduction in early adopter (or lighthouse ) cities, as we assume in our scenario. Several sensitivity analysis cases do not change the general conclusions regarding the magnitudes of investments and subsidies. These investments and subsidies are found to be a relatively small share of total projected U.S. consumer spending on new vehicles and fuels over the next 20 years, and could be paid for with small percentage fees on new vehicle sales and a few cent increase in fuel taxes. Executive Summary A revolution in vehicle technologies and fuels will be needed to achieve deep cuts in greenhouse gas (GHG) emissions. To realize a 2 degree scenario by 2050, studies by the International Energy Agency (IEA) and the U.S. National Academies of Sciences, Engineering and Medicine suggest that the world s light duty fleet will be a diverse mix of highly efficient internal combustion engine hybrids, plug-in electrics and hydrogen fuel cell vehicles, running on low carbon fuels. Making this radical transition will involve surmounting many barriers, including the investment costs of bringing new types of vehicles and their fuel infrastructures into the market, and reaching competitiveness with incumbent vehicle and fuel technologies. But how large are these barriers? How much would it cost to make a widespread transition to new technology vehicles (such as electric battery or fuel cell) and their required energy types (electricity, hydrogen)? How might these costs compare to ongoing expenditures on petroleum-powered internal combustion engine vehicles (ICEVs) and fuels? In this study we estimate the overall investments needed to bring electric and hydrogen light-duty vehicles and fuels down the cost curve to become cost competitive with incumbent technologies. 1
2 We also estimate the subsidies needed to bring about those investments. We use a simplified scenario of the market penetration and sales rates of three types of electric drive vehicles (EDVs). These are battery electric vehicle (BEV), plug-in hybrid electric vehicle (PHEV) and fuel cell vehicle (FCV) out to 2035 as a basis for our investment cost and subsidy scenario, with a range of sensitivity cases. We take into account the incremental first costs of these vehicles over base gasoline models (of improving fuel economy), as well as the direct investment costs into electric and hydrogen refueling systems needed to fuel these vehicles. Our subsidy estimates are based on a breakeven cost analysis for consumers (in terms of incremental vehicle purchase costs v. fuel savings over time) and for investors into refueling infrastructure (in terms of the breakeven cost of net revenues from selling energy relative to paying for the capital investment and operating costs of equipment 1 ). Our main findings are as follows: We estimate that during a transition to EDVs in the U.S., the investments (additional purchase costs) for the vehicles and the new capital investments in chargers and refueling station infrastructure could total several hundred billion dollars, spent over the next 20 years. Our specific range across scenarios is from $300 to $600 billion, or about $12 to $24 billion per year, with the amount rising over time, reaching about $55 billion in Purchase cost increments for vehicles typically make up 70-80% of these costs across the scenarios. Using a breakeven cost analysis, we estimate that the needed subsidy levels to achieve a breakeven cost condition for vehicles may amount to 10-20% less than these first cost increments, and can decline rapidly after a societal breakeven point is achieved (around ). In comparison, the subsidies required for fuel infrastructure may be a very small percentage of the investment costs, with those for hydrogen refueling stations needed only until each station becomes profitable, and none required for electric home recharging infrastructure. Hydrogen fuel cell vehicle rollout is regional in nature, as infrastructure and vehicle introduction must be coordinated in space and time. We assume hydrogen is introduced strategically in a series of early adopter regions, an approach that is expected to be more cost-effective, with lower subsidy requirements, than introducing hydrogen simultaneously throughout the United States. As shown in figure ES-1, we look at a range of scenarios including a base case (with a given rate of battery and hydrogen delivery cost reduction associated with the sales ramp up where EDVs make up about 70% of new light duty vehicle sales and 30% of the on-road fleet by 2035), and a range of sensitivity cases, including: 1. A slow market adoption case where EDVs are introduced 50% as fast as the base case, 2. A high ICEV efficiency case where internal combustion engines achieve very high efficiency, making it harder for EDVs to compete on the basis of fuel savings; 3. An optimistic EDV cost case where EDV technology advances faster than in the base case and costs fall more rapidly (based on optimistic case results from the National Academies 2013 study as shown in Appendix A), and 1 We assume that the stations have a lifetime of 15 years and the station owner pays 12% real interest on the investment. 2 Costs are given in 2015 dollars and are not discounted. 2
3 4. A high oil price case where we assume oil prices are higher than in our Base Case - these are based on EIA s 2015 AEO High Oil Price case instead of their Reference Case A low oil price case where we assume oil prices are lower than in our Base Case - these are based on EIA s 2015 AEO Low Oil Price case instead of their Reference Case. 6. A case where the untaxed gasoline price is compared to untaxed alternative fuels. 7. A high battery cost case, where battery costs are from the NRC A low carbon electricity and hydrogen supply case, where renewable technologies are introduced and account for 33% of new supply after Are these estimated investment and subsidy costs large? Yes, from the perspective of vehicle and fuel buyers and taxpayers. But when these estimated transitional investment and subsidy costs are compared to the base cost that all U.S. consumers spend on new vehicles and fuels for light-duty vehicles (~$1 trillion per year, or $20 trillion to 2035), the cost is modest, even small. Indeed, the 3 The reference case 2035 crude oil price is $120/bbl ($2015); the 2035 low oil price case is $72/bbl; the 2035 high oil price case is $220/bbl. Source: US EIA AEO 2016, Figure 3. 3
4 benefits could far outweigh the costs in the long term, as in our scenarios the value of fuel savings becomes greater than incremental vehicle costs after about Although we used the 2013 NRC study as a basis for most vehicle component costs, we have updated the battery costs to reflect more recent estimates (Nyquist and Nilsson 2015). Breakeven occurs 2 to 5 years later, and investment (and subsidy) costs are $ Billion higher if the NRC battery cost numbers are used. This highlights the importance of reducing battery costs. Finally, we explore policy strategies for spreading the transition cost among consumers, taxpayers, and industry. We explore a feebate strategy to pay the incremental cost of EDVs with fees on conventional vehicles, finding fees averaging below $750 per vehicle for vehicles purchased over the next 20 years, and peaking at about $ 1400 per vehicle in 2030, are sufficient to pay for the vehicle transition. To track subsidy costs (taking into account fuel savings and lowering the fees/rebates accordingly), average fees for non-edvs would begin at about $300 and rise to about $1000 per vehicle by 2030 in the base case, then decline to under $200 in 2035 before being phased out. If varied by CO2 emission level, some high emitting vehicles might have a much higher fee, with low CO2 vehicles having a much lower fee. On the fuel side, we explore a fuel tax to pay for the costs of the hydrogen refueling station build-up until it becomes commercial, and find that a tax in the range of one cent per gallon of gasoline equivalent (that could be levied across all fuels including hydrogen and electricity) is sufficient to pay subsidy costs in the base case. This analysis is partial; it does not include the transition costs associated with trucks or non-road modes; it also is simplified in assuming that vehicle subsidies need only to cover incremental first costs taking into account fuel savings. It is not a consumer choice analysis and does not include any analysis of non-market attributes (such as vehicle range or performance) and how these affect vehicle demand. Currently the U.S. and many state governments offer subsidies for EDVs reaching as high as $10,000 for some models (such as fuel cell vehicles purchased in California), but much lower in other cases (such as just a few thousand dollars for plug-in hybrids). These are probably well below the incremental costs of typical EDVs today, so our scenarios may involve higher rates of subsidy for some years than is currently in place. On the other hand, current subsidies may not be sufficient to reach the sales levels included in our base case through Costs for transitioning electricity and hydrogen supply to low carbon primary sources are explored in a low carbon supply scenario to The Sustainable Transportation Energy Pathways (STEPS) program at the Institute of Transportation Studies, UC Davis (ITS-Davis) continues to work on this topic and will produce additional reports that address further details of a transition to EDVs in the coming decades. 4

5 Introduction As presented in a number of recent studies, there is broad agreement that in order to achieve a lower carbon transport future, multiple fuels will need to be pursued, along with new vehicle technologies including battery electric and plug-in hybrid vehicles, hydrogen fuel cell vehicles, and low-carbon biofuels (Ogden and Anderson 2011, Yang et al. 2013, IEA ETP 2012, EIA Low CO2 Transport 2011, NRC 2013). A 2012 study by the International Energy Agency (IEA) is typical of recent results, indicating that by 2050, about two-thirds of global new light duty vehicle sales would need to be electric drive vehicles (EDVs) defined here as pure battery electric vehicles (BEVs), plugin hybrid electrics (PHEVs) and hydrogen fuel cell vehicles (FCVs) with the remainder being very efficient internal combustion engine vehicles (ICEVs) fueled with liquid biofuels (Figure 1). The 4DS case (below on the left) refers to a transport sector scenario consistent with a global average temperature rise of 4 o C. The improve case (below right) is a transport scenario consistent with a rise of 2 o C. 4 That study also estimated that the costs of introducing the new types of vehicles and fuels around the world (their incremental costs), might be on the order of $20 trillion through 2050, but with associated fuel savings that are expected to be of a greater magnitude. And these costs and savings are set in the context of nearly $500 trillion projected to be spent on new infrastructure, vehicles and all fuels across the world s entire transportation system in that time frame. Figure 1. IEA ETP 2012, Global Portfolio of Technologies for Passenger Light-duty Vehicles by Scenario 4 The 4DS for transport represents a trajectory that unfolds with existing and upcoming policies. OECD countries continue to tighten fuel economy standards up to 2025 for both passenger LDVs and road-freight vehicles. PHEV and BEV market penetration is slow, similar to what happened with HEVs initially. The Improve case focuses on technology improvements that lower GHG emissions; it implies tightening fuel economy standards through 2030 on new cars. Electric vehicles start displacing the ICE from the mid-2020s, joined by FCEVs in the 2030s. When coupled with mode shifts, it is consistent with transport sector that contributes to the 2 o C target. 5
 analyzed a diverse set of low carbon scenarios for the light duty sector, including cases where electric drive makes up 80% of new light duty vehicle sales in 2050.")
6 Another recent study for the U.S. (NRC 2013) analyzed a diverse set of low carbon scenarios for the light duty sector, including cases where electric drive makes up 80% of new light duty vehicle sales in A figure from one NRC hydrogen intensive case is shown below. The overall electric drive sales are about 8 million in 2030 and 13 million in 2035, comparable to our scenario as shown in Figures 2 and 3. The National Academies 2013 study also estimated the impacts of various policies and subsidies on consumer adoption of alternative fueled vehicles, and estimated the investments needed for vehicle subsidies and new infrastructure to support these vehicles. The discounted cumulative cost of infrastructure development from 2010 to 2050 was estimated to be $ billion depending on the scenario, typically about $1,000-2,000 per vehicle for electric or hydrogen vehicles. The discounted cumulative subsidy for vehicles was estimated to be $ billion. Overall, counting consumer s fuel savings plus societal benefits such as greenhouse gas emissions reductions and greater independence from oil, there was a strong positive net benefit in most cases examined. Figure 1b. Vehicle sales for a National Academies scenario modeling the adoption of plug-in electric vehicles, hydrogen fuel cell vehicles and biofuels (NRC 2013). 6
7 Transition Scenarios Despite relative successes in some markets where policy support and incentives are strong, EDVs have faced major challenges in displacing ICEVs. The key questions remain how might transitions to EDVs and low carbon energy carriers (electricity, hydrogen) take place over the next few decades and what would these transitions cost? This paper examines these transition costs for light-duty EDVs (including battery-electric vehicles, plug-in hybrid electric vehicles, and hydrogen fuel cell electric vehicles) to 2035 and costs of building refueling infrastructure for these vehicles. We estimate when these EDVs might become competitive with incumbent petroleum fueled vehicles, and when provision of fuels might become commercially viable without subsidies. Transition costs and subsidy costs are compared with other monetary flows in the transportation energy system. To explore transition issues, we have developed the STEPS Transition Model, a simplified EXCELbased scenario model for EDV adoption in the U.S. that is broadly consistent with results from more complex energy/economic optimization (IEA 2012) and consumer choice models (NRC 2013). This model allows us to transparently explore a broad range of different scenarios and input assumptions, and estimate the magnitude of the investments and subsidies required. The STEPS Base Case and several alternative scenarios are used as a basis for estimating transition costs for launching various types of new light duty vehicles and fuels, e.g. bringing them to lifecycle cost competitiveness with incumbent gasoline ICEV technologies. We consider EDV sales scenarios to 2035 that could put the U.S. on a path to deep greenhouse gas (GHG) emission cuts by 2050, consistent with a 2 degree scenario. Approach to Estimating the Investment and Subsidy Costs of New Transportation Technologies (see Appendix A for details). This analysis estimates the investment and subsidy costs of new technologies during a 20-year transition, but what do we mean by this? We focus primarily on two types of investments: new refueling infrastructure (namely electric recharging and hydrogen refueling stations) and new vehicle types (electric, plug-in hybrid and fuel cell vehicles). Our investment costs for the former are considered from the point of view of companies building these stations what must they pay to install this equipment? We take into account all station capital, but no operating costs of this equipment. (This assumes that the fuel supplier pays to operate the station once it is built. In our station cash flow simulations, we find that the sales of hydrogen approximately pay for the operating costs after the first year or so, assuming a growing market. So capital costs are taken as the main measure of how much investment might be at risk for station developers.) For the latter (the investment costs of vehicles), we consider this from the consumer perspective those who buy vehicles. And we include only the incremental purchase costs of these vehicles, since the electric or fuel cell vehicles are bought instead of a base conventional vehicle (for which we assume the average price of new LDVs). Together these total station capital costs and incremental vehicle purchase costs account for all the investments in this study, between 2015 and (For details, please see Appendices A and B). As for subsidies, we consider these to be the portion of the investment costs that would need to be paid by society (probably governments/taxpayers) to encourage the transition, until the private 7
8 sector is willing to make these investments on their own. For stations, we assume that all costs for building hydrogen stations are paid by governments until hydrogen costs drop to where this fuel is competitive and sales are high enough that the private sector can make a normal return on investment. For vehicle purchase, subsidies are assumed to equal the difference between the retail price equivalent of new vehicles and the base vehicle price until the year when fleet-wide fuel savings from operating these vehicles is equal to these vehicle incremental costs. There are still investment costs after this point (i.e. still vehicle incremental costs) but they are outweighed by fuel savings. (The underlying concept is that society as a whole breaks even economically once the incremental cost of buying EDVs in year N is offset by fuel cost savings that year from the on-road EDV fleet. This is a cash flow approach and was used in various studies including NRC 2008 and McKinney et al ) The breakeven year would be about the same if we consider the extra vehicle cost versus the lifetime fuel savings for an individual vehicle. Our model does not explicitly include consumer choice factors like driving range, recharge/refueling time and availability, or trunk space that could increase the required subsidy, or electric drive performance or greenness, which might reduce it. (Please see Appendix A for a full discussion of modeling methods.) The STEPS base case scenario for new electric vehicle sales and stock build-up for these vehicles to 2035 is shown in Figures 2 and 3. As discussed above, it is consistent with the U.S. scenario used in a recent National Academies report (NRC 2013) and with the U.S. aspects of the 2-degree scenario in the International Energy Agency s Energy Technology Perspective report (IEA ETP 2012). This STEPS base case scenario is far from a business as usual scenario; achieving it would require strong policies, such as on-going regulations and price incentives for vehicles and subsidies to encourage the development of refueling infrastructure. Some of these conditions are in place in some form in the U.S., such as the national incentives for plug-in and fuel cell vehicles. Some support for the initial construction of a hydrogen infrastructure is beginning in California. Our scenario implicitly assumes that these support systems would continue and expand as vehicle sales increase, and like the scenarios from other studies mentioned above, we assume a sales increase that is rapid but plausible. We used light duty vehicle cost and performance assumptions based on the National Academies report (NRC 2013), with the exception of battery costs which are from Nyquist and Nilsson (2015). Assumed average light duty vehicle costs and fuel economies are shown in Figures 5-7 and other values are shown in Table 1. It is important to note that gasoline ICEV light duty vehicle efficiency is assumed to increase significantly over time, reaching an on-road fleet average of 40 miles per gallon by 2035 (based on a mix of cars and light trucks). To accomplish this, the cost of gasoline ICEVs increases over time. In Figure 2, the combined stock of electric, plug-in hybrid, and fuel cell vehicles is posited to reach 14% of the light duty on-road fleet by 2030, or about 42 million vehicles; by 2035 the combined stock more than doubles to 93 million vehicles or 31% of the light duty fleet, consistent with a path leading to 50% electric drive by Annual sales of new vehicles must reach higher shares sooner in order to achieve these stock levels since the stock takes time to turn over. Our scenario assumes that 21% of annual new vehicle sales in the U.S. (3.5 million vehicles per year) are electric drive by 8
9 2025, 48% (8 million vehicles per year) by 2030, and 71% (12 million vehicles per year) by We further assume that PHEVs and pure battery BEVs each reach sales of 3 million by FCVs enter the market about 5 years later than PHEVs and BEVs and by 2030 have annual sales of about 2 million. By 2035, we assume that PHEVs, BEVs and FCVs each have sales of 4 million per year. The remainder of light duty vehicles are assumed to be gasoline powered ICEVs. 6 To achieve this sales level, even with incentives and infrastructure support, these technologies will eventually have to succeed in becoming competitive in the market, for example reaching a breakeven point on the total cost of ownership, taking into account vehicle purchase cost, fuel cost, and other operating costs. How might this happen? The range of policies used to incentivize vehicles will need to help bring down the costs of these vehicles and fuels and ultimately help overcome cost barriers via increasing scale economies, learning-related cost reductions, and removal of other barriers such as sparse fuel availability. 7 This is one of many possible futures, but provides an ambitious yet plausible roll-out scenario for battery electric vehicles, plug-in hybrid-electric vehicles and fuel cell electric vehicles in the U.S. If a transition to EDVs is slower and takes longer than our main scenario, it would spread out the time when transition costs would need to be raised and invested, but would also likely lower the annual costs compared to our scenario. 5 Percentages of sales are based on the US Department of Energy, Energy Information Agency (EIA) light duty vehicle (LDV) sales projection of 16.8 million in 2030 (EIA AEO 2015). 6 Following the National Academies 2013 study, we assume that light duty vehicles encompass both passenger cars and light duty trucks. The fraction of light truck sales is assumed to decline from 50% in 2010 to 36% in Light duty vehicle fuel economies and incremental costs shown in Figures 5-7 are averaged over cars and light trucks. 7 This is discussed in NRC Current barriers to consumer adoption of ZEVs include: First cost of vehicles Technical barriers (especially battery vehicle range and recharge time) Fuel infrastructure availability (especially for hydrogen fuel cells) Risk aversion to an unfamiliar new technology Availability of different styles and models Policies to reduce these barriers have been explored in the National Academies 2013 report on light duty vehicle transitions. Offsetting the early cost penalty of the vehicles and fuels, primarily the incremental costs compared to conventional gasoline fuelled vehicles, will likely need to play an important role. In fact incentive policies already do play a role. In the US in 2012, the federal subsidy for BEVs was $7500 per vehicle, and up to $5,000 for plug-in hybrids. Several states offer additional subsidies. States and cities also provide special benefits for PEVs such as free parking or access to high-occupancy vehicle lanes. These policies all help to some degree. Building the market over the next years, this will in turn help drive down costs via increased scale economies and technology learning, e.g. via optimization in production systems. 9
10 Table 1. Summary of Base Case Scenario Assumptions for Light Duty Vehicle Fleet Notes New Vehicle Sales (million/y) ICEVs BEVs PHEVs H2 FCVs Vehicle Retail Price Equivalent ($/vehicle) (for large scale mass production) ICEV 29,700 30,200 31,000 32,000 32,400 NRC 2013 BEV 100 mi 49,000 42,300 39,800 37,500 36,000 NRC 2013 range 51,000 37,100 34,400 33,200 33,100 Nyquist & Nilsson 2015 PHEV 40,300 38,400 37,400 36,900 36,400 NRC ,700 36,400 35,700 35,700 35,700 Nyquist & Nilsson 2015 H2 FCV 37,500 36,100 34,600 34,300 NRC 2013 Selected Vehicle Component Costs NRC 2013 Battery pack NRC 2013 ($/kwh) Nyquist & Nilsson 2015 Fuel Cell $45/kW $40/kW $37/kW $33/kW $31/kW NRC 2013 System ($/kw) H2 Storage ($/kg) $625/kg $565/kg NRC 2013, 5.6 kg >300 mi range On-road Light Duty Fleet Averaged Fuel Economy (mile per gge) NRC 2013 ICEV BEV PHEV % electric VMT H2 FCV Infrastructure Capital Cost ($ per vehicle served) Home Charger per PEV Public Charger per 100 PEVs; DC fast charger costs $20,000 installed H2 Station 10,000 (truck delivery, 100 kg/d) 4,000 (truck delivery, 250 kg/d) 3,000 (truck delivery, 500 kg/d) 3,000 (truck delivery, 500 kg/d) 3,000 (onsite SMR 1,000 kg/d) Appendix B Fuel Cost $/gge (U.S. Average) Gasoline EIA AEO 2015; ref case Electricity cent/kwh Time of Use Rates + charger cost amortized over 15 years Hydrogen Appendix B 8 All costs are given in constant $2015 dollars. 10

11 Figure 2: Scenario for sales of new technology light-duty vehicles in the U.S. (1,000s vehicles per year) Figure 3: Resulting stock build-up of new technology light-duty vehicles in the U.S. (thousands) To gain further insight into how fast new electric vehicle technologies might be adopted in the light duty sector it is interesting to look at historical data for early commercial sales data for BEVs and PHEVs (both of which were introduced commercially in the U.S. in late 2010). Sales are currently 11
12 about 110,000 per year. There are no actual sales figures yet for FCVs. However, policy goals can provide aspirational numbers for FCV adoption. A recent evaluation of progress under the California Zero Emission Vehicle (ZEV) regulation suggests that 43,600 FCVs might be on California roads by 2022 (CARB 2016), with a goal of 1.5 million ZEVs (both FCVs and battery EVs) by A recently released memorandum of understanding among eight U.S. states including California sets a goal of 3.3 million ZEVs by Figure 4. Comparison of electric drive vehicle annual sales data in the U.S. The adoption rate is similar in the first few years of introduction for PHEVs and BEVs. FCVs are being introduced internationally by several automakers in : the first few hundred FCVs arrived in the U.S. in Costs of transition The transition to EDVs will involve a number of direct and indirect cost impacts. EDVs will be more expensive than comparable gasoline ICEVs, and energy costs will be mixed, with electricity tending to be cheaper than gasoline per vehicle mile, and hydrogen more expensive at least in the early years of the transition. Additional costs will be incurred to provide the local energy infrastructure for electricity charging and hydrogen fueling. These are the costs we analyze in this report. We do not address indirect impacts such as differences in vehicle non-fuel operation costs. Nor do we analyze social costs such as impacts of air pollution on health or damages from climate change. Further, we do not account for utility costs to consumers that could influence purchase decisions, such as the inconvenience of limited fuel availability and long recharging time. These are better addressed in a consumer choice model. 12
13 More specifically, in this report we analyze the incremental first-cost of vehicles and the cost of developing and installing refueling infrastructure for hydrogen (complete production/distribution system) and electricity (home and public recharging system). In particular, we investigate how much investment might be required in infrastructure and vehicle subsidies to reach cost-competitiveness with incumbent gasoline ICEV technologies. The technologies in question include a few critical components that will have a major impact on overall transition costs. These include: For battery-electric vehicles, the costs of batteries (affected by the battery capacity per vehicle which is in turn determined by the desired vehicle driving range). There is also the purchase cost of electricity compared to the base diesel fuel as well as the cost of developing a charging infrastructure, and in the longer term, the cost of generating electricity from low carbon sources (although the cost of transition to low carbon electricity is not explicitly addressed in this paper). For plug-in hybrid vehicles, the battery costs and purchased electricity, as well as the cost of engine hybridization. For fuel cell vehicles, the cost of the fuel cell stack and the balance of system, the cost of onboard hydrogen storage tanks, the cost of developing hydrogen infrastructure to deliver hydrogen to vehicles. The choice of hydrogen pathway can impact the fuel cost. We show an example of a low carbon, renewable intensive hydrogen supply. However we do not fully address feedstock issues and the long-run transition to very low carbon feedstocks. All of these components and related technologies add costs compared to gasoline vehicles (though they also may reduce some costs, such as removal of the internal combustion engine and transmission for electric vehicles). Some costs per vehicle may be high in the near term given low production volumes and the newness of the technologies. But many of these costs can be expected to decline over time, as shown above in Table 1 and discussed in the next section. (Also see Appendix A for more details.) The question becomes: just how much total investment (vehicle incremental first cost and refueling infrastructure installed cost) and related subsidies will be required to offset vehicle/fuel costs as sales of EDVs rise over time? The answer will depend on several factors; an important one will be the relative purchase cost of these vehicles compared to gasoline vehicles. Another is how much and how fast these cost differences will decline over time. This in turn will depend on the rate at which new technology costs decline due to increasing scale economies and learning effects, as the sales and market size of these vehicles increases, and key technologies such as batteries and fuel cell systems become cheaper. Cost Estimates for Electric-drive Vehicles Various estimates have appeared for the projected cost of EDVs (Bandivadekar et al. 2008, NRC NRC 2010, Plotkin and Singh 2010, IPCC 2011, Burke et al. 2011, EPRI 2010, NRC 2013). Most of these studies projected that future mass-produced electric drive (battery or fuel cell) cars will be moderately more expensive than an advanced gasoline car. For example, in a 2008 National 13
14 Academies study of hydrogen transitions, mass-produced, mature technology FCVs were estimated to have a retail price equivalent (RPE) 9 $3,600 to $6,000 higher than a comparable gasoline ICEV (NRC 2008). Similar numbers were estimated by MIT, UC Davis, the National Renewable Energy Laboratory, Argonne National Laboratory, and the Electric Power Research Institute. In 2013 a National Academies report provided updated estimates for learned out retail price equivalents for future mass-produced light duty vehicles. This report pushed vehicle drivetrain and envelope efficiency for all types of vehicles, in part by downsizing and light-weighting the vehicle. Their reference gasoline car achieves an on-road fuel economy of about 50 mpg by 2030 and 75 mpg by 2050, a more aggressive efficiency rise than past studies. Figure 7 shows the on-road fleet averaged fuel economy for cars and light trucks. The cost of gasoline vehicles is projected to increase over time due to efficiency improvement measures, and by 2045, both fuel cell and battery vehicles are projected to have lower retail prices than these advanced gasoline vehicles. 10 While estimates of the future retail price equivalent (RPE) of mass-produced BEVs and FCVs may approach those of advanced gasoline vehicles, initial models will not be produced in such high volumes. As a result, vehicle RPEs will be higher due to higher manufacturing costs (related to the size and scale of manufacturing facilities, greater manufacturing efficiency, and reduced supplier costs), and the amortization of fixed engineering, research and development costs, which are spread over a smaller number of vehicles. As described in Appendix A, a learning function was used to estimate the changes in the cost of key components such as fuel cells, batteries, and electronic systems used in these vehicles over time and as cumulative production increases. Vehicle retail equivalent prices per car are shown in Figures 5 and 6 below, which informed the rollout scenario in Figure 2 above. Following the analysis in (NRC 2013), the cost for ICEVs increases over time as efficiency measures are implemented, while the prices of PHEVs, BEVs, and FCVs decrease with technical progress, learning by doing and scale economies of mass production (see following section). Cost reductions are related to improvements in vehicle technologies, such as batteries and fuel cell systems. For example the cost of massproduced batteries drops by about half between 2015 and 2025, from about $410/kWh to $200/kWh (with an additional reduction to $150/kWh between 2025 and 2030). This is consistent with the detailed analysis and projections developed in NRC 2013, except for battery costs which are taken form Nyquist and Nilsson (2015). 11 (See Appendix A.) 9 The RPE difference is typical for years beyond 2025, when the NRC study assumed fuel vehicles were mass produced at the level of millions per year. The RPE is not the same as actual vehicle prices in the showroom. The difference between the cost and price reflects the automakers profit or loss on a given product. Automakers frequently pursue a strategy called forward-pricing when introducing new technologies (e.g. gasoline hybrids) in order to build product awareness, grow the volume of sales and benefit from the learning. This implies a period of losses with the expectation that eventually the product will become profitable. 10 The National Academies did various scenarios. For their base case, cost parity among EVs, FCVs and ICEVs cars happens in about In the optimistic case, parity happens sooner, in about The National Academies also analyzed light trucks where parity occurs slightly later than for cars. 11 In our analysis we use the U.S. sales of electric drive vehicles to estimate how learning and manufacturing scale-up reduce the vehicle cost over time. This is a conservative assumption in the sense that electric drive technologies are being introduced in many countries around the world, and learning by doing might happen faster than suggested by the U.S. vehicle sales alone. 14
15 Incorporating factors for manufacturing scale, R&D progress and learning, we estimated a cost trajectory for EVs, PHEVs and FCVs given assumed market penetration rates (Figures 2, 5, 6). Figure 5 shows the projected learned out, mass produced retail price equivalent for three electric vehicle technologies, BEVs, PHEVs, and hydrogen FCVs between 2010 and 2035, as compared to a highly efficient gasoline ICEV (NRC 2013). In Figure 6 we estimate the RPE of each type of vehicle over time, accounting for initial low volumes of EDVs in our scenario (Figure 2). Vehicle RPEs fall rapidly as more vehicles are produced, with FCV technology adoption following the plug-in electrics by about 5 years. The vehicle cost assumptions in these figures are drawn from the 2013 NRC study, except for battery costs which are from Nyquist and Nilsson (2015) reflecting more recent battery cost estimates. Figure 5. Estimates for learned out mass produced retail price equivalent (RPE) for Battery EVs (EVs), plug-in hybrids (PHEVs) and hydrogen fuel cells (FCVs) compared to an efficient gasoline ICEV (NRC 2013). The battery EV is assumed to have a 100 mile range. The PHEV has a battery corresponding to a 30 mile all electric range. 15
16 Figure 6. Vehicle retail price equivalents taking into account production volumes show in Figures 2 and 3. Vehicle component costs are based on NRC 2013 except for battery costs from Nyquist and Nilsson (2015). We account for the scale of mass production (scale factor of -0.25) and "learning by doing" (10% progress ratio) considering the cumulative production (see Appendix A for details) 12 The assumed on-road fleet averaged fuel economy of the various types of vehicles is shown in Figure 7. These are based on fuel economies in the NRC 2013 mid-range case. Because FCVs, PHEVs and EVs are much more efficient than ICEVs, they result in long term fuel savings. 12 The retail equivalent price estimates in Figure 6 are higher than commercial prices for today s BEVs and PHEVs. Thus, this figure reflects that some manufacturers may be subsidizing plug-in vehicles internally to reach the typical retail prices of commercial models sold in
17 Figure 7. Adapted from the National Academies 2013 Transition report Efficiency Case, (Figure 5.16, NRC 2013). These are on-road, light duty fleet averaged numbers. Infrastructure Costs for Electric and Hydrogen Vehicles Another important factor is the cost of building new infrastructure to enable the use of EDVs. For plug-in electric vehicles (PEVs, comprised of PHEVs and BEVs) we assume that each vehicle has a dedicated home charger, (costing $2,500 in 2015 and dropping to $1,600 in 2035) and that a network of public fast chargers (costing $20,000 each) is built to facilitate travel (with 1 public charger per 100 PEVs). The total cost for all chargers is estimated to be $1,800-2,700 per PEV, not counting any costs in the electricity distribution and production system. Hydrogen fuel-cell vehicles pose a more challenging set of infrastructure questions because the introduction of vehicles and build-up of infrastructure must be coordinated geographically and over time. As hydrogen FCVs have begun commercial introduction worldwide, there have been several detailed analyses of how a hydrogen infrastructure rollout might proceed. In particular, various studies have examined what would be required for fuel providers to have a viable business case to develop early hydrogen infrastructure in a given region (Ogden and Nicholas 2011, Eckerle and Garderet 2012, Brown and Samuelson 2013). The type of hydrogen supply influences the capital investments needed for infrastructure. It now appears that early hydrogen infrastructure in the first few lighthouse cities will probably adapt commercial hydrogen delivery technologies used in the 17
18 industrial gas business, such as truck delivery of compressed hydrogen gas or liquid hydrogen as well as onsite reformers and electrolyzers (Melaina and Penev 2013, McKinney et al. 2015). The first hydrogen stations will be sited in early adopter cluster areas within each lighthouse city or region, concentrating infrastructure near the earliest FCV adopters to provide better consumer accessibility at lower cost (Ogden and Nicholas 2011). Figures 8-10 shows a possible scenario for a regional rollout of FCVs over time. Figure 8. Scenario for regional FCV sales and on-road fleet vs. years (year 1 = start of commercialization). (See Appendix B for more details). Number of FCVs 400, , , , , , ,000 Number of FCVs in fleet and FCV sales (vehicles/yr): Regional Scenario FCV sales/year Total FCVs in fleet 50, Year of Transition 18
19 Figure 9. Scenario for total number of regional hydrogen stations, average size of new stations built and network capacity factor (= hydrogen dispensed/station network capacity). The station network serves the FCV rollout in Figure 8. The network capacity factor is low for the first few years, as stations are built ahead of vehicle deployment. Initially stations are small to provide coverage for early adopters. The network factor is plotted on the right hand y-axis; other variables on the left hand y-axis. Station Number or Station Capacity (kg/day) Station Network Characteristics Network Capacity Factor Average New Station Capacity Year of Transition Number of Stations Network Capacity Factor Figure 10. Estimate of the investments needed to support hydrogen infrastructure development in an early lighthouse (right hand y-axis) and the hydrogen cost (left hand y-axis). By the time 50, ,000 FCVs have been introduced in a particular city or local region 13 we estimate that stations would have been built. Cumulative hydrogen infrastructure capital investments for industrial gas-based supply with truck delivery or onsite production would be 13 In Southern California, 100,000 FCVs would be about 1% of the regional light duty fleet. 19
20 $3,000-4,000 per FCV served and hydrogen costs at the pump would be in the range $6-8/kg, competitive with gasoline ICEVs on a fuel cost per mile basis (Ogden, Yang, Nicholas and Fulton 2014). Reaching competitiveness might require $ million of capital investment for early stations in each city, before the local fuel network was commercially launched in the sense that the next station built would be an economically attractive investment. (Figures 9, 10). If the first few lighthouse cities are successful, investors might gain enough confidence to open new lighthouse cities, building a more extensive hydrogen infrastructure from the beginning, anticipating a rapidly rising market share of FCVs that would make infrastructure economically attractive within only a few years. In other words, the private sector might take over development of U.S. hydrogen infrastructure once it was successful in a few cities. In Appendix B, we describe the details of a U.S. national scenario for introducing hydrogen in a series of 60 U.S. lighthouse cities. Summing up the vehicles introduced in each city gives an overall FCV rollout consistent with Figures 2 and 3. (As sensitivity studies, we also considered cases with a slower FCV market adoption rate, and one with a low carbon hydrogen supply.) We find that the national FCV scenario in Figure 2 and 3 requires that FCVs be introduced locally into perhaps 25 large U.S. cities by 2025 (60 cities by 2030), and that FCVs must rapidly capture up to 10% of the national new car market (up to 20% regional market share in lighthouse cities) by 2030, at a rate similar to the fastest growing PEV markets today. To reach a national average hydrogen cost of $7/kg requires an infrastructure investment of about $6-9 Billion. For details see Table 2 and Appendix B. Figure 11. U.S. National Average Hydrogen Cost in $ per kg H2 and cumulative capital investment in hydrogen stations ($ Million). As a sensitivity case, we also examined the costs of introducing renewable hydrogen supply after about The estimated hydrogen cost is $1-1.5/kg higher in this case because of the added costs of electrolyzers. 20
21 Cost of Transportation Fuels In Figure 12 we show the assumed cost of gasoline, electricity and hydrogen over time in dollars per gallon gasoline equivalent. We use the latest U.S. Department of Energy EIA projections for gasoline (EIA AEO 2015). 14 In this paper, we assume that gasoline is taxed, but electricity and hydrogen are not, which is current policy in the United States. There are arguments for comparing all fuels on an untaxed basis, so we also analyzed cases with untaxed gasoline, which are presented as a sensitivity study below. The levelized cost of chargers is added to an assumed electricity price of 10 cents/kwh to estimate a total cost of charging electricity. The electricity price is based on recent time of use rates offered in California for electricity used to charge electric vehicles (rate schedules from PG&E 2016; SCE 2016). Assuming a cost of $1,800-2,700 per vehicle for chargers, we find that the total electricity cost is about cents/kwh. We estimate a U.S. averaged cost for hydrogen based on the analysis in Appendix B. All fuel costs are expressed in $ per gallon gasoline equivalent. Figure 12. Assumed fuel costs in $/gallon gasoline equivalent. In Figure 13, we show the fuel cost per mile over time. It is interesting to note that the cent per mile cost of electricity for plug-in vehicles is always less than that for gasoline, because of the high efficiency of PEVs. Hydrogen FCVs have a higher fuel cost per mile than gasoline ICEVs in the early years, when H2 costs are quite high, even given their higher efficiency. But by about 2024, the cent per mile cost for H2 FCVs is less than for the gasoline reference vehicle. 14 Our base case uses the EIA s reference case (shown in Figure 12), which projects a taxed gasoline price rising from $2.4 to $3.0 per gallon between , gradually trending up to $3.7/gallon in We also consider sensitivity cases using the EIA s High Oil Price scenario, where gasoline prices rise to $4.7 per gallon in 2025 and $5.8 per gallon in 2035 and the EIA s Low Oil Price Scenario where gasoline prices fall to $1.97 per gallon in 2025 and rise to $2.24 per gallon in The gasoline price includes $0.52/gallon of Federal and state taxes, but electricity and hydrogen are not taxed. 21
22 Figure 13. Transportation fuel cost per mile for Gasoline Reference vehicle, PHEVs, EVs and FCVs. Investment and Breakeven Cost Analysis A key question is how long would it take for EDVs to become competitive with a reference gasoline vehicle. We describe this as the breakeven year. We analyze the lifetime cost of operation for three types of EDVs, PHEVs, BEVs and FCVs as compared to a gasoline reference vehicle, considering incremental costs (i.e. cost differences) (between gasoline and EDVs) in dollars per year for both the purchase costs of vehicles and fuel costs over time. Purchase costs of advanced vehicles are typically higher than gasoline vehicles while fuel costs (particularly electricity costs of PEVs) are typically lower owing to their higher efficiency. The break even year is reached when the annual incremental cost of new EDVs is equal to the annual fuel savings from the on-road EDV fleet for that year. In an aggregate sense the fuel savings of on-road EDVs offset higher first cost of EDVs sold that year. (Our methodology is described in Appendix A.) (Figure 14 shows an example for H2 FCVs.) 15 The cost of vehicles declines as the volume of sales increases (from scale economies, and through learning from cumulative production) for each type of vehicle (Figure 6), and for the electric drive scenario as a whole including both plug-in and fuel cell vehicles (Figure 15). 16 Similarly we assume the cost of providing new fuels declines as the infrastructure is extended and scaled up (Appendix B). 15 While our EDV scenario has major investment costs, it also brings major benefits in fuel cost savings, as well as societal benefits of GHG reduction, better air quality and reduced oil insecurity. While we do account for fuel savings in this paper, we do not attempt to account for the value of these other societal benefits, though we note that counting the GHG, air quality and energy security benefits would increase the estimated benefits substantially and likely help achieve cost parity (from a societal standpoint), possibly much sooner (NRC 2013; Sun, Ogden and Delucchi 2010). But for this exercise limit calculations to actual monetary expenditures. We do not employ a consumer choice model to estimate future markets. 16 The incremental vehicle cost (RPE) of the EDV is calculated by comparing it to a reference gasoline vehicle, which also evolves over time. Referring to Figure 6, we see that the incremental cost difference decreases over time with EDV learning and production scale-up. 22
23 Figure 14. Buydown Costs for hydrogen fuel cell vehicles in the U.S. compared to gasoline reference vehicle. Initially the incremental costs of the vehicles are higher for FCVs, but over time the fuel savings outweigh the extra vehicle costs. (Costs shown are undiscounted.) In this example, the breakeven year for a H2 FCV rollout is 2032, about 17 years after market introduction. Similar curves hold for battery electric and plug-in hybrid electric vehicles. In Figure 15, we estimate the annual aggregate benefits of fuel savings versus the extra costs of vehicles for all three EDV types. Although extra vehicle costs outweigh fuel savings early on, fuel savings eventually dominate, more than compensating for the extra vehicle cost. Once vehicle costs start to break even with fuel cost savings, the aggregate savings begin to grow rapidly. By about 2028, the overall scenario breaks even (annual benefits outweigh costs), and by 2035 the annual net benefit is about $30 billion per year because fuel savings far outweigh the added incremental first cost of new EDVs. 23
24 Figure 15. Electric Drive Vehicle Costs and Fuel Savings in snapshot years. Incremental vehicle costs are balanced by fuel savings by about The number at the top of each bar is the net benefit (defined as fuel savings incremental vehicle costs) in $billions per year. The hydrogen infrastructure costs are based on the cluster strategy estimate (Appendix B). TOTAL ADDITIONAL INVESTMENT REQUIRED How much will it cost to implement our EDV scenario? In this section, we discuss two kinds of costs, investments and subsidies. Investments refer to 1) the incremental capital investment by consumers in buying a new EDV instead of gasoline vehicle and 2) the capital investment in building new stations or chargers. Subsidies refer only to the investments required to bring the vehicle and fuel technologies to the point of cost competitiveness with incumbent gasoline ICEV technology. Taking incremental vehicle costs and capital costs for fuels infrastructure together, we estimate this total investment cost to be anywhere from about $300 to $600 billion dollars for vehicle cost buydown and refueling infrastructure build-up, spent over the next 20 years. Most of the investment cost is for covering the incremental cost of advanced vehicles. 24
25 For hydrogen fuel cells, hydrogen infrastructure subsidy costs summed to 2035 are about 10% of the total infrastructure investment ($8 Billion out of a total of $99 Billion) (Table 2). For the U.S. as a whole, we estimate that about $8 billion investment would be needed in a series of lighthouse cities to bring the U.S. average cost of hydrogen to $7/kg, a fuel cost roughly competitive with gasoline on a cent per mile basis. The breakeven point for vehicles occurs a few years later. In Figure 16 and Table 2 we present annual investment costs from 2010 to 2035 for incremental vehicle costs and for infrastructure building. This grows as the numbers of vehicles and amount of refueling infrastructure grows, although for vehicles the assumed investment costs per unit decline over time. Summing between 2010 and 2035 we find a total capital investment of $143 B for home and public chargers ($2,000/PEV), $99 B for hydrogen stations ($4,500/FCV), $70 B for incremental cost of FCVs ($3,000/FCV), $155 B for the incremental cost of PHEVs ($4400/PHEV) and $113 B for BEVs ($3200/BEV), totaling about $600 B, an average of about $24 B per year for 25 years ( ). Vehicle incremental costs make up the majority of the cost, especially early on. While the projected transition costs for vehicle and fuel infrastructure rise over time, there should also be a transition toward more and more of this investment being fully profitable, with an eventually declining need for governments/taxpayers to foot the bill. As vehicles approach a breakeven cost point (and concurrently other attributes such as range improve), these vehicles will become more market competitive without subsidies. Similarly, when investing in refueling infrastructure returns an immediate profit to the providers, the investments shown in Figure 16 will become routine. These investments will become commercial, the way much higher annual investments for new vehicle production and fuel provision are today. In Figure 17 we posit how the investment projection might translate into a subsidy projection. We assume a policy where vehicle cost subsidies and infrastructure (electric charger and hydrogen station) subsidies are offered on all incremental costs until the technologies become economically competitive and we use vehicle/fuel cost to estimate this competitive point. The vehicle cost subsidy is equal to the incremental retail price equivalent compared to a gasoline reference vehicle and is offered until the breakeven year for each vehicle technology is reached (about 2026 for battery EVs, 2032 for PHEVs and 2034 for FCVs). We assume that no public subsidy is needed directly for home chargers. 17 However, we assume that public chargers are subsidized until the breakeven years are reached for PHEVs and BEVs. Hydrogen station capital costs are subsidized in each lighthouse city until the cost of H2 reaches $7/kg, a cost at which hydrogen is expected to be competitive with gasoline on a cent per mile basis (which occurs in the timeframe depending on the city see Appendix B). Once breakeven is reached, vehicle and infrastructure subsidies are then ramped down over a 3-year sunset period. Subsidies are completely phased out by With home charging, we calculate that the cent per mile cost fuel cost for a PEV is always less than for the reference gasoline car, so no subsidy is needed for in home chargers. For a home charger costing $ , serving 1 plug-in vehicle, we estimate a levelized cost about 6-9 cents/kwh which is added to the assumed residential electricity rate of 10 cents/kwh. At cents/kwh, the PEV s cent mile cost is always less than the fuel cost per mile for a gasoline reference vehicle. 25
26 Table 2. Investments and Subsidies to Support Electric Drive Vehicles to Breakeven year and to 2035 based on the scenario in Figure 2. Our approach for estimating H2 infrastructure design and cost is detailed in Appendix B. The EDV investment per vehicle is assumed to equal the incremental Retail Price Equivalent (RPE) of the EDV compared to a reference gasoline vehicle (see Figure 6). Investment Total H 2 FCVs PHEVs Battery EVs To Fuel Cost Breakeven Equivalence w/gasoline (Cent per Mile Basis) CUMULATIVE COSTS 2010 to Breakeven By $8 B H2 infrastructure capital cost to reach U.S. ave.h2 cost= $7/kg Breakeven: million FCVs Electricity generally competitive on cent per mile basis Breakeven: million PHEVs Electricity generally competitive on cent per mile basis Breakeven: million BEVs INVESTMENTS Vehicles (Incr) Infrastructure SUBSIDIES Vehicles (Incr) Infrastructure CUMULATIVE COSTS 2010 to 2035 $62 B $82 B (all H2 sta. cap.) $60 B $8.3 B (H2 sta. capital until H2 cost reaches $7/kg) 2035: 23 million FCVs $117 B $51 B (home and public chargers) $113 B $5.0 B (public chargers only) 2035: 35 million PHEVs $58 B $18 B (home and public chargers) $61 B $1.7 B (public chargers only) 2035: 35 million BEVs INVESTMENTS Vehicles (Incr.) Infrastructure SUBSIDIES Vehicles (Incr.) Infrastructure $71 B $99 B (all H2 sta. cap.) $63 B $8.3 B (H2 sta. capital until H2 cost reaches $7/kg) $155 B $72 B (home and public chargers) $117 B $6 B (public chargers only) $113 B $71 B (home and public chargers) $63 B $2 B (public chargers only) 26
27 Figure 16. Annual U.S. investments in electric drive vehicles and infrastructure. The vehicle cost is equal to the incremental retail price equivalent compared to a gasoline reference vehicle. The infrastructure cost is equal to the capital cost for PEV chargers and hydrogen refueling stations. Figure 17. Potential annual U.S. subsidies for electric drive vehicles and infrastructure. Subsidies are the investments required to bring fuels and vehicles to cost competitiveness. Comparing Figures 16 and 17 we see that given our assumptions, the required subsidies (to bring EDVs and their infrastructure to cost competitiveness with incumbent gasoline ICEV technology) are much less than the investments, especially for fuels. After each electric drive technology achieves breakeven, subsidies go quickly to zero (Figure 17). Actual needed investments continue to grow 27
28 rapidly after breakeven (Figure 16), but these go to economically competitive vehicles and infrastructure that no longer need public support. Two types of breakeven account for the differences between subsidies and investments. First is fuel cost breakeven the point when the EDV fuel (electricity or hydrogen) becomes competitive with gasoline on a cent per mile basis. For our assumptions, electricity is competitive with gasoline from the beginning, even when the cost of a home charger is figured in, so we don t subsidize home chargers, although public chargers are subsidized until about Hydrogen infrastructure is built up in a series of regional lighthouse city rollouts, and the capital cost of building early stations is subsidized in each city until the local hydrogen becomes cost competitive with gasoline. This happens by about in a succession of lighthouse cities. The infrastructure subsidy is much lower than the investment (by roughly a factor of 10). Second is vehicle breakeven the point at which the incremental costs of new vehicle sales are offset by fuel savings in that year. Beyond this year the economy gains more from EDV fuel savings than it loses from purchase of more expensive EDVs. This happens in 2025 for BEVs, and in 2032 for PHEVs and 2034 for FCVs. Beyond this point, we sunset the vehicle first cost subsidy for each vehicle type over a three year period. By 2035, the vehicle subsidy is significantly reduced and will be gone after In Table 2, we sum the required investments and subsidies from 2010 to the breakeven year for each technology and from 2010 to Summing between 2010 and 2035 we find a cumulative subsidy cost of $8 B for public chargers, $8 B for hydrogen stations, $63 B for the incremental cost of FCVs, $117 B for the incremental cost of PHEVs and $58 B for BEVs, totaling about $255 B, an average of about $10 B per year for 25 years ( ). Subsidies to support vehicle incremental costs make up the vast majority of the cost, with infrastructure accounting for only about 7% of the total. There is little vehicle subsidy needed past the breakeven year, and little infrastructure subsidy past Our projected cumulative subsidies through 2035 are roughly half the projected cumulative investment requirements, if we assume a rapid drawdown once a breakeven point is reached for each type of vehicle and infrastructure. This lowers the societal burden of the transition considerably. Sensitivity Analysis Our results are sensitive to the many assumptions that go into the investment calculation. In Figure 18 we show how the cumulative investment and subsidy estimates to 2035 vary for our base case and seven sensitivity cases: 1. Our base case (Figure 2). Vehicle costs are based on the NRC 2013 study, except battery costs have been updated to reflect recent cost reductions, using estimates from Nyquist and Nilsson A slow market adoption case where EDVs are introduced 50% as fast as the base case, 28
29 3. A high ICEV efficiency case where internal combustion engines achieve very high efficiency, making it harder for EDVs to compete on the basis of fuel savings; 4. An optimistic EDV cost case where EDV technology advances faster than in the base case and costs fall more rapidly (based on optimistic case results from the National Academies 2013 study as shown in Appendix A), 5. A high oil price case where we assume oil prices are higher than in our Base Case - these are based on EIA s 2015 AEO High Oil Price case instead of their Reference Case. 6. A low oil price case where we assume oil prices are lower than in our Base Case - these are based on EIA s 2015 AEO Low Oil Price case instead of their Reference Case. 7. A high battery cost case, where battery costs are from the NRC A low carbon electricity and hydrogen supply case, where renewable technologies are introduced after about For each of these eight cases, the investments and subsidies from 2010 to 2035 are shown. The range of transition investments over the 25 years is around $ billion with most of the cost due to the extra cost of vehicle purchase. The slow market adoption case breaks even at roughly half the cost of the base case, largely because only about half as many vehicles and stations are introduced by 2035 while vehicle and fuel costs still decline enough to achieve the same breakeven points. The High ICEV efficiency case doesn t reach breakeven by 2035, except for battery electric vehicles, because fuel savings from EDVs are lower, when the ICEV vehicle is very fuel efficient (in fact the fuel savings don t outweigh the added vehicle costs to 2035). Our case with optimistic vehicle cost numbers vehicle technology evolves more rapidly, costs of components such as batteries and fuel cells drop more rapidly, and required investments are lower to the breakeven point (2023) and to For our High battery cost case breakeven occurs several years later. The high oil price case breaks around 2024, and required investments are lower. If the EIA s low oil price estimates are used in this analysis, none of the vehicles breakeven by 2035, except for the BEV which breaks even in In this paper, we compared taxed gasoline versus untaxed alternative fuels, which is current US policy. However, if we compared to untaxed gasoline instead, breakeven was delayed by 1-4 years and subsidy costs increased by $10-50 Billion (see Figure 18b). Finally, introducing low carbon electricity and hydrogen after 2020, adds to fuel costs per mile, and delays breakeven by a few years. The overall carbon emissions are reduced however, beyond 2025 compared to the base case. For each case, we also show an estimate of the public subsidy needed to bring fuel supplies and vehicles to cost competitiveness. The range of transition subsidies over the next 20 years is around $ billion with over 90% of the cost due to the extra cost of vehicle purchase. As discussed above, the required subsidies are typically much lower than the investment costs (25-50% lower), because fuel suppliers and consumers realize economic gains and we assume that subsidy policies are ramped down past the breakeven year. These results are particularly striking for infrastructure investments vs. subsidies. The cumulative infrastructure subsidy needed is typically less than 10% of the total infrastructure investment. This reflects that infrastructure investments will lead to cost competitive fuel supply sooner than vehicle investments. 29
30 Figure 18a. Cumulative Investments (left hand bar) and Subsidies (right hand bar) for Eight Electric Drive Vehicle Rollout Scenarios from 2010 to We assume gasoline is taxed, and electricity and hydrogen are untaxed. Cases with high ICEV efficiency or Low Oil Prices don t breakeven until after The other cases breakeven between 2024 and
31 Figure 18b. Cumulative Investments (left hand bar) and Subsidies (right hand bar) for Eight Electric Drive Vehicle Rollout Scenarios from 2010 to We assume gasoline, electricity and hydrogen are untaxed. Cases with high ICEV efficiency or Low Oil Prices don t breakeven until after The other cases breakeven between 2027 and Implications for Greenhouse Gas Emissions We evaluated the potential greenhouse gas reduction for our different scenarios, and the cost of avoiding CO2. Our EDV cases were compared to a reference case where light duty gasoline vehicle efficiency increased over time, but no electric drive vehicles were introduced. While the overall GHG reduction to 2035 is substantial, much of this is occurs due to efficiency in a baseline world, without the electric drive world. Not surprisingly, the additional CO2 reduction in our Base Case with the electric drive vehicles is modest, because the number of EDVs on-road in 2035 is still less than 1/3 of the total fleet, and it takes time to bring down the carbon intensity of electricity and hydrogen. Figure 19 shows the CO2 emissions over time from a fleet of increasingly 31
 Also shown are the emissions that would have resulted if no EDVs had been introduced.")
32 efficient gasoline vehicles, plus electric vehicles and hydrogen vehicles. (The rapid drop in gasoline use after 2020 is because an assumed rapid efficiency increase in gasoline ICEVs at that time.) Also shown are the emissions that would have resulted if no EDVs had been introduced. GHG emissions fall by about 40% between 2015 and 2035, with about 2/3 of the decrease due to increased gasoline vehicle efficiency and only 1/3 due to EDVs. Our base case incorporates some decarbonization of electricity and hydrogen, and the higher efficiency of EDVs as well as the lower carbon intensity of electricity and hydrogen fuels contribute to their portion of GHG reductions. Figure 19. Estimated greenhouse gas emissions for our base case. Most of the emissions come from gasoline usage with less than 10% of the total due to electric and hydrogen vehicles in How much does it cost to reduce CO2 by introducing electric drive vehicles? This is a somewhat complicated question in the context of the current analysis, since we track vehicle sales to 2035 but these vehicles may operate to 2050 and beyond. We took the following approach: As shown in Figure 20, we estimate the avoided cost for 3 cases as the cumulative net direct economic benefit to society from implementing EDV vehicles and fuels (Figure 17) divided by the cumulative amount of CO2 avoided over this period. The annual net benefit is defined as the incremental cost of EDV vehicles in a given year minus the fuel cost savings from the fleet of EDVs in that year. (Net benefits 32
33 and CO2 emissions are summed from 2010 to each year up to This is the same as the CUM TOTAL line plotted in Figure 14.) Initially, the avoided cost of CO2 is very high ($60,000/tCO2), as there is little CO2 saved, and high costs for early vehicles and fuels. This is illustrated in Figure 20, which shows the high initial values for (vehicle costs minus fuel savings). However, as the cost of EDV vehicles and fuels decrease over time, the value of the avoided CO2 cost falls rapidly, reaching about $100/tCO2 by depending on the case (Figure 21). These declining costs over occur at the same time that CO2 savings rises, so the weighted average cost of CO2 reduction is far below the nominal average over the 20 year period. For many of our sensitivity cases (including the base case) $/tco2 goes negative before 2035, indicating that there is a positive average net benefit (negative cost) in saving CO2 after that time. The cost of CO2 falls faster in cases where the vehicle pathway breaks even early (for example, the high oil price case), and higher costs are seen for longer times to breakeven (such as the low oil price case). 33
34 Figure 20. Cumulative net benefit (incremental EDV cost fuel savings) and cumulative CO2 saved over time. Dividing the cumulative net benefit by the cumulative CO2 saved, gives a running time average avoided cost for CO2 $/tco2 (Figure 21). Base Case: Cum. (Increm EDV Cost-Fuel Savings) (million $) Cumulative CO2 Saved (million tonne) Cum Increm Veh-Fuel (million $) Cum CO2 saved (million t) Figure 21. The average cost of CO2 emissions is estimated our base case and high and low oil price cases. The cost of CO2 drops over time, and becomes negative after about depending on the case. 34
35 Billion dollars U.S. Transition Costs for Electric Drive Vehicles Revised December 2016 Cost for transport in the broader context In order to better understand the burden placed on society by a possible investment cost of $ billion (subsidy cost $ billion) over 20 years for EDVs and fuels, it is useful to compare this to the total cost of all new light duty vehicles, and the cost of fuel for the entire stock of LDVs in the U.S. over the same period. The Energy Information Administration in its Annual Energy Outlook (EIA 2015) publishes projections of the needed data the numbers of new LDVs, the fuel used by all LDVs, and the average prices of these during The resulting total cost of vehicles and fuels over this time frame is shown in Figure 16. The average annual expenditure for vehicles and fuels was about $800 billion in 2011, and is expected to rise slowly to about $1 trillion in The total cost over the whole time frame is about $19 trillion (an average of about $960 billion per year over 20 years). Figure 22: EIA Projections of new vehicle and fuel costs in the U.S., Source: EIA AEO 2015, except LDV prices from PH&EV Center for 2014, projected to increase 1%/yr real $1,200 $1,000 $800 $600 Fuels for all LDVs on the road $400 $200 New light-duty vehicle purchases $ Thus the investment costs of $ billion for EDVs and their fuels to 2035 are about 1.5 to 3% of this $19 trillion total, with the estimated subsidy costs about 1-2%. On an annual basis, the Base Case investment costs range from about $5 billion to $55 billion per year with subsidies ranging from $5 billion to $20 billion per year, in a vehicles/fuels market with nearly $1 trillion spent annually. Discussion policy considerations The relative size of the funds spent annually on vehicles and fuels compared to the projected costs of a transition to new vehicle technologies and new fuels presented above raises the question: if we could spread the costs of a transition across the broader economy, what policies might we use to do this? Different approaches are possible, including various regulatory and market instruments, which would have very different distributional effects and varying levels of economic efficiency. In general, 35
36 the greater use of market instruments, the more economically efficient the policy. But advanced vehicle and fuel sales are riven with many market failures and market conditions that inhibit the effect of market-based policies. Here we briefly examine three possible policies that could be directed toward paying the subsidy costs of our transition scenarios. 1. VEHICLE PURCHASE FEEBATES Feebates (fees and rebates on the purchase of new vehicles, based on attributes of the specific models) are typically externally imposed by a government, and explicitly set fees and rebates on the price of new vehicles based on one or more criteria. For example it would be possible to structure a feebate system whereby all EDVs receive a particular rebate and all conventional vehicles have a fee set so that total revenues match the total expenditures made on EDV rebates (and if it did not align, it would be up to the government to make up the difference). However most existing feebate systems (e.g. in European countries such as France) use a specific criteria such as CO2 emissions per kilometer, and number of different vehicle categories with different fee or rebate levels. It would be possible to construct a feebate where the emissions of EDVs are either treated as zero or could be based on their well-to-wheel emissions (though this is complex since these vary with use location and time), and then be added into categories along with conventional vehicles. In France, EDVs receive a rebate of EUR 5,000, which is at the high end of rebates, although other efficient vehicles such as hybrids also receive a rebate (D'Haultfœuille et al, 2014). In any case if the desire was to raise, for example, $10 billion per year to provide rebates for EDVs and a similar amount for other fuel efficient vehicles, and these were a combined 1/3 of vehicles sold, then this $20 billion would need to come from the sales of the other 2/3rds of LDVs sold. It should also be noted that there are a number of different ways a feebate could be structured across vehicle classes, such as an in-class feebate that differentiates the more efficient (and/or electric drive) vehicles within each size or market class from other choices within that class. That would help ensure there are some cost-effective choices for all consumers regardless of the type of vehicle they purchase. A more specific example based on our foregoing analysis in this paper is presented in Table 2. Here we show the sales of EDVs in our Base Case scenario, and the rebate per vehicle for selected years, if ALL the incremental vehicle purchase costs were paid through the fees on non-edv purchases. Thus (roughly speaking) these fees and rebates would be needed until the average first cost of EDVs are equal or less than the average for conventional vehicles. (We acknowledge that this ignores the importance of other attributes that affect the purchase choice, and that the use of feebates has many market response aspects that we are glossing over here). Here we calculate the combination of average rebate for EDVs and average fee for non-edvs that result in eliminating our base case EDV incremental cost in each year to 2035, using total light-duty vehicle projected sales by the EIA (AEO 2015). As shown, given our estimates of EDV costs in 2015, the required rebate to cover this cost per EDV unit is very high, but the sales are low enough that the overall costs would be around $5 Billion and the fee per non-edv would be about $300 per car (note that this could be structured so that more efficient vehicles have a fee well below $300 and guzzlers have a fee considerably higher). By 2030, the average incremental cost of EDVs, and thus the fee + rebate per vehicle, drops to about $2500, but EDV sales have increased dramatically and non-edv sales have dropped in turn, resulting 36
37 in a needed EDV rebate of over $1300 and non-edv fee of close to $1200, or about 4% of the average non-edv purchase price. By 2035 the non-edv fee required tops out at just under $1500 per vehicle. Table 3. Feebate schedule to cover incremental costs of vehicles ( vehicle investments ) in the Base Case. Total LDV sales (from EIA, mil) Combined rebate+fee per EDV vehicle Total Subsidies (rebates) ($mil) Sales of EDVs (thou) Rebate per EDV ($) Total fees ($mil) Sales of non-edvs (mil) Fee per non-edv ($) % of avg new car price of $30k , ,476 5, % , ,160 6, % , ,100 10, % , ,302 10, , % , % Table 3 and Figure 22 show the results for the investment-based scenario. In the Subsidy case the numbers would be the same through about However given the break-even points reached, by 2030 the fee per non-edv drops to $975 (instead of the $1184 shown in the table for 2030). By 2035, the fee per non-edv drops from $1373 to about $136, and could be phased completely out by Figured on an investment basis, the annual fee per non-edv averages about $746 per year between 2015 and On a subsidy basis, the annual fee per non-edv averages about $611. Figure 22. Feebate system to support adoption of electric drive vehicles. 37
38 This scenario reflects an important challenge: bringing down the per-vehicle costs of EDVs fast enough that their rising sales do not bankrupt the program or require fees per non-edv that are more than societally or politically acceptable. This is where our subsidy cost differences from the investment costs become very important: when only using feebates to pay the subsidy cost (figure 17 above), the feebate can be totally eliminated by 2036 and the fees on non-edvs are lower in 2035 (about $136 per non-edv instead of $1373 in the investment-based calculation). This seems the more reasonable scenario for a feebate, which is intended to encourage consumers to purchase EDVs by eliminating overall cost barriers and make vehicles more attractive, not necessarily cover all incremental purchase costs for ever. 2. FUEL/CARBON TAXES On the fuel side, one way to subsidize the introduction of new refueling infrastructure would be the application of a new tax on fuels, such as a carbon tax. The only difference between a fuel ad valorem tax and a carbon tax is that the carbon tax would have a different rate across fuels, depending on their CO2 emissions. But since over 95% of U.S. LDV fuel is gasoline, this wouldn t matter much, at least in the near term. As mentioned, the increasing fuel cost reductions in our Base Case after 2025 suggest that a) a tax could be applied that does not raise the average cost of fuel, but reduces the amount that it would otherwise drop, and b) that some kind of revenue generating system is likely to be needed anyway since the lower costs of fuels (and different types of fuels) are likely to lead to significantly lower fuel tax revenues for governments without a change in the tax system. Based on our calculations for the number of vehicles, their efficiency and distance travelled, we have estimates for current and future fuel use shown in Table 4 and Figure 21. Given fuel economy standards and other factors, the EIA (and we) project this to decline in the future. With our Base Case fuel infrastructure cost in 2035 of around $32 billion per year, we estimate that a $0.36/gallon gasoline-equivalent tax on all motor fuel (and electricity and hydrogen) would be needed to pay for this. Taxes in early years would be much lower, so could be ramped up over time as refueling infrastructure costs rise. This is a conservative estimate as it pays the entire infrastructure cost, and neglects the profitability of this refueling infrastructure that will likely be achieved in many regions, that would allow the tax to drop relative to this maximum $0.36 number (or be used for other purposes). If we only needed to subsidize fuel infrastructure until it became profitable (our subsidy case), this would dramatically cut the fuel tax needed. On this basis, home chargers would not need subsidies at all, and subsidies for public chargers could be phased out when PEVs reached breakeven around If we further assumed that the oil industry (or some other fuel supplier) took over building H2 stations once they became profitable (which happens by 2030) the annual infrastructure subsidy required in 2030 would be about $1B/y (mostly for PEV public chargers) and would be completely phased out by In this scenario, if we used LDV fuel of 100 billion gge in 2030 and taxed this essentially to pay for chargers that would cost about $0.01/gge. The tax on H2 would be $0.01/kg (out of maybe $7/kg). The added tax for electricity used to charge PEVs would be about
39 cents/kwh (out of 10 cents/kwh), and the tax on gasoline would be $0.01/gallon. By 2035 all these taxes could be phased out. Table 4. Fuel Tax Scenarios to Cover the Cost of Refueling Infrastructure Infrastructure Investment for PEV chargers and H2 stations $mil/y (infra. subsidy $mil/y)) 278 (26) 2003 (339) (1899) ,525 (1200) ,580 (510) Number of LDVs on road (million) Number of EDV LDVs on road (million) Gasoline Use (millions gal./y) All LDV fuel use (million gge/y) Gasoline tax required to cover all PEV + FCV infrastructur e capital costs ($/gal) (Gasoline tax to cover infra subsidy) Fuel tax required to cover all PEV + FCV infrastructur e capital costs ($/gge) (Fuel tax to cover infra subsidy) % increase in gasoline price (compared to EIA AEO 2015 reference gasoline price case) % , , (0.0002) (0.0002) (0.001%) % , , (0.002) (0.002) (0.01%) , , (0.014) (0.014) 1.9% (0.4%) % (0.3%) , , (0.01) 0.184(0.01) ,000 97, (0.006) 0.33 (0.005) 9.9% (0.2%) COMBINATION OF FEEBATES AND GASOLINE TAX A combination approach could use fees on conventional (non-edv) cars to subsidize new EDV purchases, and a gasoline tax to support EDV fuel infrastructure development. In our subsidy scenario that ramps down once breakeven points are hit, both policies would be ramped down during a 3-year sunset period and completely phased out by A feebate system based on imposing annual non-edv vehicle registration fees to support new EDV purchases would require less than $100 per year for non-edv drivers. If a gasoline tax were imposed to support EDV infrastructure development (PEV chargers and H2 stations), this would be less than $0.30 cents per gallon even under conservative assumptions about infrastructure profitability. Basing the gasoline tax solely on the infrastructure investments needed to make EDV fuel prices competitive, reduces the amount of tax required to less than 2 cents/gge especially after
40 Figure 23. Gasoline Taxes required to cover fuel infrastructure investments and subsidies from Table 3. As a final note, if those sums were collected just from a fuel tax (i.e. to cover all vehicle and fuel expenditures), it would add close to $1.00 per gallon (taking into account market responses to such a high tax) by 2035 in the Base Case, and around $0.60 per gallon in the subsidy case, far higher than if just the fuel infrastructure cost were covered. 3. SUBSIDIES FROM GENERAL TAX REVENUES Yet another way to generate the funding to pay for an EDV/fuel infrastructure rollout would be putting this in the general (e.g. national) budget. While likely to be politically challenging, paying all transition costs in the Base Case (Figure 15) would represent around $55 billion annually by 2035, or 1% of the 2013 U.S. budget (and thus probably well below 1% of the 2035 budget). In the subsidy scenario it would peak at about $40 billion in 2032, so likely less than 0.6% of the budget in that year. Overall, the policy examples used here to raise the needed revenues to pay for investment or subsidy costs show that this could be achieved at, for the most part, modest fee or tax levels; however, one source of concern is how the fee levels need to rise over time, and can reach fairly high levels in the late 2020s/early 2030s. This may need to be addressed through some sort of smoothing of fees, to spread them over time in a way that reduces the peak levels. 40
41 Conclusions This paper has created a STEPS Transition Model Base Case and several alternative scenarios for achieving a transition to large volume production of EDVs by 2035 in the U.S. Estimations were made of the transition investment costs of these scenarios, taking into account the vehicle cost increment and fuel infrastructure capital costs and the associated subsidy costs of achieving these scenarios. We also estimated breakeven points where EDVs and fuels become competitive with incumbent technologies. This is a partial analysis; it does not include the transition to very low carbon heavy-duty vehicles, nor does it include other potential low-carbon fuels besides electricity and hydrogen, such as biofuels. We also do not address a transition to low carbon primary sources for electricity and hydrogen. None-the-less, the analysis provides a sense of the potential transitional costs that society (and/or stakeholders within society) would need to pay in order to achieve a competitive industry for EDVs, and contrasts these costs with expenditures that are routinely made by Americans every year for new cars and fuel these cars run on petroleum primarily. Our main findings are: (a) EDVs break even economically with incumbent gasoline vehicles in the time frame for a range of scenarios with varying assumptions about technology, vehicle adoption rate and fuel costs. (b) Breakeven occurs when the annual incremental cost of new EDVs is balanced by fuel savings, which become large after about (c) Cumulative Transition investment costs for light-duty EDVs and fuels (summed between 2010 and 2035) are estimated to be in the range of $300 to $600 Billion. (d) Cumulative Transition subsidy costs (e.g. investments needed to breakeven) for light-duty EDVs and fuels are estimated to be in the range of $ Billion. (e) The majority of transition costs are for vehicle incremental costs. Required subsidies are 10-20% lower than investments for vehicles, and required subsidies are 80-90% lower than investments for fuel infrastructure. Thus the differences are large and are worthy of additional investigation. (f) In any case, net transition costs over the next 20 year period of several hundred billion dollars would be quite small in comparison to the $19 trillion expected to be paid overall for new light-duty vehicles and for fuels for all LDVs in this time frame. Investment costs for EDVs and their fuels to 2035 are about 1.5 to 3% of this $19 trillion total, with the estimated subsidy costs about 1-2%. On an annual basis, the Base Case investment costs range from about $5 billion to $55 billion with subsidies ranging from $5 billion to $20 billion, in a vehicles/fuels market with nearly $1 trillion spent annually. We find that a range of policies is available that could serve to leverage the needed funding, including fuel and vehicle taxes along with rebates for EDVs. These would be quite small through The required investments become large after 2030, if we assume that all incremental costs of the transition are paid by these mechanisms rather than by consumers or fuel providers. This would assume public support while consumers reap increasingly large fuel cost savings and fuel suppliers make increasing profit. If we phase out subsidies once fuel supply and vehicle ownership become 41
42 economically competitive, the transition costs are reduced by roughly 40%. The required public support of infrastructure is cut by roughly a factor of As an example, we analyzed a combination policy approach that imposes fees on conventional (non- EDV) cars to subsidize new EDV purchases, and a gasoline tax to support EDV fuel infrastructure development. We find that imposing a fee on sales of non-edv vehicles to support new EDV purchases would require less than $1,500 per non-edv at the peak (and under $1000 peak in the subsidy-only case). If a gasoline tax were imposed to pay for EDV infrastructure investments (PEV chargers and H2 stations), this would be less than 40 cents per gallon even under conservative assumptions about infrastructure profitability. Basing the gasoline tax solely on the infrastructure subsidies needed to make EDV fuel prices competitive reduces the amount of tax required to less than 2 cents/gge especially after Given the spikey nature of the fees on vehicles and fuels in these scenarios, a policy approach that smooths the rates out over the 20 year period may be helpful. Logical extensions of this analysis would include adding heavy-duty vehicles and fuels, using a more detailed analysis of consumer choice and the level of subsidies that consumers would require to buy vehicles in the quantities assumed in this analysis, and using a more explicit consideration for scale and learning effects that occur outside the U.S. that could speed the reduction in costs, and thus lower overall transition costs. 42
43 REFERENCES Bandivadekar, A., Bodek, K., Cheah, I., Evans, C. Groode, T., Heywood, J. Kasseris, E., Kromer, M. and Weiss, M., On the Road in 2035: Reducing Transportation s Petroleum Consumption and GHG Emissions. MIT Laboratory for Energy and the Environment, 2008 Burke, Andrew, Hengbing Zhao and Marshall Miller, Chapter 4, Comparing Fuel Economies and Costs of Advanced and Conventional Vehicles, in Ogden J.M. and Anderson, L., Sustainable Transportation Energy Pathways, Institute of Transportation Studies. University of California, Davis, Regents of the University of California, Davis campus. Available under a Creative Commons BY-NC- ND, 3.0 license, August California Air Resources Board, Annual Evaluation of Fuel Cell Electric Vehicle Deployment and Hydrogen Fuel Station Network Deployment June accessed July 24, California Fuel Cell Partnership: Hydrogen Fuel Cell Vehicle and Station Deployment Plan, Action Plan (February 2009), Hydrogen Fuel Cell Vehicle and Station Deployment Plan, Progress and Next Steps, April California Fuel Cell Partnership "A California Road Map: Bringing Hydrogen Fuel Cell Vehicles to the Golden State," describing the infrastructure necessary to successfully launch commercial FCEVs. California, Governor s Interagency Working Group on Zero-emission Vehicles Governor Edmund G. Brown Jr., February 2013, 2013 ZEV Action Plan: A roadmap toward 1.5 million zero-emission vehicles on California roadways by 2025, D'Haultfœuille, Xavier, et al, The Environmental Effect of Green Taxation: The Case of the French Bonus/Malus, The Economic Journal, Volume 124, Issue 578, pages F444 F480, August 2014 Tyson Eckerle and Remy Garderet, Incentivizing Hydrogen Infrastructure Investment: An analysis of the use of Cash Flow Support To Incentivize Early Stage Hydrogen Station Investment, Energy Independence Now, June 19, Electric Drive Transportation Association, accessed June 8, EPRI, 2009: Program on Technology Innovation: Industrial Electrotechnology Development Opportunities. Electric Power Research Institute, Palo Alto,. Discussion of the Benefits and Impacts of Plug-In Hybrid and Battery Electric Vehicles, Electric Power Research Institute, Massachusetts Institute of Technology Energy Initiative: The Electrification of the Transportation System: Issues and Opportunities. 43
44 EUCAR (European Council for Automotive Research and Development), CONCAWE, and ECJRC (European Commission Joint Research Centre), Well-to-Wheels Analysis of Future Automotive Fuels and Powertrains in the European Context, Well-to-Wheels Report, Version 2c, March Green Car Congress. Linde starts small-series production for hydrogen fueling stations; agreement with Iwatani for delivery of 28 units, July 14, Greene, D. L.,. Leiby,, P. N. James, B., Perez, J., Melendez, M.,. Milbrandt, A., Unnasch, S., Hooks, M., Analysis of the Transition to Hydrogen Fuel Cell Vehicles and the Potential Hydrogen Energy Infrastructure Requirements, ORNL/TM-2008/30. Oak Ridge National Laboratory, March Greene, D., Leiby, P., and Bowman, D., Integrated Analysis of Market Transformation Scenarios with HyTrans, ORNL/TM-2007/094. Oak Ridge National Laboratory, June 2007 International Energy Agency, 2009e: Transport, energy, and CO2 - Moving Towards Sustainability. Report ISBN , International Energy Agency, OECD/IEA Paris, 400pp International Energy Agency 2012, Energy Technology Perspectives International Partnership for a Hydrogen Economy, 2011 Hydrogen and Fuel Cell Global Policies Update, November International Partnership for a Hydrogen Economy. Final Report IPHE Workshop Hydrogen A Competitive Energy Storage Medium for Large Scale Integration of Renewable Electricity, Seville, November 2012 Fuel Cells Today, The Fuel Cell Industry Review 2012 was published in October and reported that fuel cell shipments exceeded 100 MW in 2011 and expected to reach 176MW in Fuel Cells The Business Case for Fuel Cells 2012, Fuel Cells Xuping Li and Joan Ogden, Understanding the Design and Economics of Distributed Tri-generation Systems for Home and Neighborhood Refueling, Part II: Neighborhood Refueling Case Studies,. Journal of Power Sources 197 (2012) Xuping Li, Joan Ogden, and Christopher Yang, Analysis of the Design and Economics of Molten Carbonate Fuel Cell Tri-generation Systems Providing Heat and Power for Commercial Buildings and H2 for FC Vehicles, Journal of Power Sources (2013), pp DOI information: /j.jpowsour Los Angeles Times, story.html McKinney, Jim, et al Joint Agency Staff Report on Assembly Bill 8: Assessment of Time and Cost Needed to Attain 100 Hydrogen Refueling Stations in California. California Energy Commission. Publication Number: CEC
45 Melaina, M.W.; Heath, G.; Sandor, D.; Steward, D.; Vimmerstedt, L.; Warner, E.; Webster, K.W. (March 2013). Alternative Fuel Infrastructure Expansion: Costs, Resources, Production Capacity, and Retail Availability for Low-Carbon Scenarios. Transportation Energy Futures Series. Prepared for the U.S. Department of Energy by National Renewable Energy Laboratory, Golden, CO. DOE/GO pp. Melaina, M., M. Penev Hydrogen Station Cost Estimates, Comparing Hydrogen Station Cost Calculator Results with other Recent Estimates. National Renewable Energy Laboratory, Golden, CO, Technical Report. NREL/TP National Research Council, National Academy of Engineering, Committee on Alternatives and Strategies for Future Hydrogen Production and Use, The Hydrogen Economy: Opportunities, Costs, Barriers, and R&D Needs (Washington, DC: National Academies Press, 2004) National Academies, 2008: Transitions to Alternative Transportation Technologies: A Focus on Hydrogen, ISBN-13: The National Academic Press, Washington, 142pp. National Research Council, Committee on Assessment of Resource Needs for Fuel Cell and Hydrogen Technologies, Transitions to Alternative Transportation Technologies: A Focus on Plug-in Hybrids, Washington, DC: National Academies Press, National Research Council. Transitions to Alternative Vehicles and Fuels. Washington, DC: The National Academies Press, NESCAUM, 2014 Multi- State ZEV Action Plan, Nguyen, T., J. Ward, K. Johnson, Well-to-Wheels Greenhouse Gas Emissions and Petroleum Use for Mid-Size Light-Duty Vehicles, Program Record (Offices of Bioenergy Technologies, Fuel Cell Technologies & Vehicle Technologies, U.S. Department of Energy, Record #: (revision #1), May 10, Nicholas, M., Handy, S., and Sperling, D. Using Geographic Information Systems to Evaluate Siting and Networks of Hydrogen Stations, Transportation Research Record 1880, 2004, Nicholas, M. A. and Ogden, J. M. Detailed Analysis of Urban Station Siting for California Hydrogen Highway Network, Transportation Research Record , M. Nicholas, The Importance of Interregional Refueling Availability to the Purchase Decision, UCD- ITS-WP (Institute of Transportation Studies, University of California, Davis, Måns Nilsson, Björn Nykvist Governing the electric vehicle transition Near term interventions to support a green energy economy, Applied Energy xxx (2016) xxx xxx, article in press. Måns Nilsson, Björn Nykvist, Rapidly falling costs of battery packs for electric vehicles, Nature Climate Change, PUBLISHED ONLINE: 23 MARCH 2015 DOI: /NCLIMATE2564, Ogden J.M. and L. Anderson, Sustainable Transportation Energy Pathways, Institute of Transportation Studies. University of California, Davis, Regents of the University of California, Davis campus. Available under a Creative Commons BY-NC-ND, 3.0 license, August Ogden, J. and Nicholas, M. "Analysis of a Cluster Strategy for Introducing Hydrogen Vehicles in Southern California", Energy Policy, 39,
46 J. Ogden and C. Yang, Build-up of a hydrogen infrastructure in the U.S., Chapter 15, in The Hydrogen Economy: Opportunities and Challenges, edited by Dr Michael Ball and Dr Martin Wietschel, Cambridge University Press, 2009, pp Ogden, Joan M., Christopher Yang, Michael A. Nicholas, Lewis Fulton (2014) NextSTEPS White Paper: The Hydrogen Transition. Institute of Transportation Studies, University of California, Davis, Research Report UCD-ITS-RR-14-11, Plotkin, S and Singh M. Multi-Path Transportation Futures Study: Vehicle Characterization and Scenario Analyses, Argonne National Laboratory Report ANL/ESD/09-5, July 22, Plotkin, S.; Stephens, T.; McManus, W. (March 2013). Vehicle Technology Deployment Pathways: An Examination of Timing and Investment Constraints. Transportation Energy Futures Report Series. Prepared for the U.S. Department of Energy by Argonne National Laboratory, Argonne, IL. DOE/GO pp. S. Satyapal, U.S. Update, Hydrogen and Fuel Cells Program, U.S. Department of Energy, presented at the International Partnership for a Hydrogen Economy Steering Committee Meeting, November 20th, 2013, Fukuoka, Japan. Stephens, T. (March 2013). Non-Cost Barriers to Consumer Adoption of New Light-Duty Vehicle Technologies. Transportation Energy Futures Series. Prepared for the U.S. Department of Energy by Argonne National Laboratory, Argonne, IL. DOE/GO pp. United Nations, Intergovernmental Panel on Climate Change, Special Report on Renewable Energy, May Sims, R., P. Mercado, W. Krewitt, G. Bhuyan, D. Flynn, H. Holttinen, G. Jannuzzi, S. Khennas, Y. Liu, M. O Malley, L. J. Nilsson, J. Ogden, K. Ogimoto, H. Outhred, Ø. Ulleberg, F. van Hulle, 2011: Chapter 8 Integration of Renewable Energy into Present and Future Energy Systems. In IPCC Special Report on Renewable Energy Sources and Climate Change Mitigation [O. Edenhofer, R. Pichs-Madruga, Y. Sokona, K. Seyboth, P. Matschoss, S. Kadner, T. Zwickel, P. Eickemeier, G. Hansen, S. Schlömer, C. von Stechow (eds)], Cambridge University Press, Cambridge, United Kingdom and New York, NY, USA U.S. Department of Energy, Hydrogen and Fuel Cells Program Pathways to Commercial Success: Technologies and Products Supported by the Fuel Cell Technologies Program, Department of Energy, September Available online at U.S. Department of Energy, Hydrogen and Fuel Cells Program, Annual Progress Report FY12, U.S. Department of Energy, Energy Information Administration, Annual Energy Outlook, Walker, Ian, European-wide Field Trials for Micro-CHP: Progress Toward Commercialization, presentation at 10 th International Hydrogen and Fuel Cell Expo, Tokyo, Japan, Feb 26-28, Yang C. and Ogden, J. Determining the Lowest-cost Hydrogen Delivery Mode, International Journal of Hydrogen Energy
47 Yang, C. and J. Ogden. Renewable and Low Carbon Hydrogen for California Modeling The Long Term Evolution of Fuel Infrastructure Using a Quasi-Spatial TIMES Model. International Journal of Hydrogen Energy. 38 (11) p APPENDIX A: Transition Costs for Electric-drive Vehicles Electric-drive vehicles (EDVs) face various barriers to their adoption, including higher vehicle first cost and higher fuel costs, as well as other factors related to vehicle performance (range, size, refuel time) and infrastructure (fuel availability). The economic costs of overcoming these barriers (e.g. bringing the vehicle to parity with a reference vehicle ) are often termed transition costs. In this appendix, we briefly review several methods that have been used to estimate transition costs for widespread adoption of alternative fuels and vehicles. The transition cost is often defined as the incremental cost over time (compared with a specified business as usual case) to bring the EDV to cost competitiveness. The EDV is compared to a reference vehicle, typically a gasoline fueled ICEV, using petroleum-derived fuels. Both the cost and performance of the EDV and the Reference vehicle are described over time For reference gasoline internal combustion engine vehicles (ICEVs), the vehicle cost and performance are typically based on projections for technical improvements over time and sometimes on policy requirements (for example CAFÉ standards). (Note that gasoline ICEVs are still improving, so the reference vehicle can become more efficient over time.) A number of authors have estimated the learned-out costs for EDVs once the technologies are mature and they are mass-produced 18. Vehicle costs are typically reported as retail price equivalents (RPE) which is not the same as actual vehicle prices in the showroom. The difference between the cost and price reflects the automakers profit or loss on a given product. Automakers frequently pursue a strategy called forward-pricing when introducing new technologies (e.g. gasoline hybrids) in order to build product awareness, grow the volume of sales and benefit from the learning. This implies a period of losses with the expectation that eventually the product will become profitable. The RPE is estimated by multiplying the manufacturing cost by a factor (typically ). The National Academies 2013 study used a factor of 1.4 Estimating EDV costs during an early market is more difficult, as technologies are less mature and vehicles are produced in relatively small quantities. For new EDV entrants to the market (e.g. battery 18 Various estimates have appeared for the projected cost of hydrogen fuel cell vehicles compared to other electric-drive vehicles (Bandivadekar et al. 2008, NRC NRC 2010, Plotkin and Singh 2010, IPCC 2011, Burke et al. 2011, EPRI 2010, NRC 2013). Most of these studies projected that future mass-produced fuel cell cars will be moderately more expensive than an advanced gasoline car. For example, in a 2008 National Academies study of hydrogen transitions mass-produced, mature technology FCVs were estimated to have a retail price equivalent (RPE) between $3,600 to $6,000 higher than a comparable gasoline ICEV (NRC 2008). Similar numbers were estimated by MIT, UC Davis, the National Renewable Energy Laboratory, Argonne National Laboratory, and the Electric Power Research Institute. 47
48 EVs or fuel cell vehicles), drawing on a 2013 study by the National Academies, the key mechanisms affecting the costs of new vehicle technologies during the early stages of a transition are (1) learning by doing, (2) scale economies and (3) technical progress. Learning by doing is represented by declining costs as a function of cumulative production, Q, relative to an initial reference level, Q 0. Learning by doing describes the reduction in cost with increasing cumulative production. LR = 1 - PR Where LR is the learning rate and PR is the progress ratio. The learning rate is the % reduction in cost for a doubling of cumulative production while the progress ratio is the % of cost remaining for a doubling of cumulative production. Let P(Q 0) represent the Incremental Retail Price Equivalent (RPE) of the EDV at cumulative production Q 0, then the RPE at cumulative production level Q > Q 0 is given by P(Q) = P(Q 0) (Q/Q 0) For a progress ratio PR of 90% the cost falls by 10% (aka the learning rate) for each doubling of cumulative production. The exponent = ln(pr)/ln(2) = for a PR of 90%. As the cumulative production Q grows very large relative to Q 0, the price P would eventually approach zero. To avoid this problem, we impose a minimum cost floor so that P(Q) is never less than an exogenously set learned-out RPE. Scale economies are represented by a scale elasticity, c, which is the exponent of the ratio of production volume in a given period, q, to the ideal production volume, q*, at which full-scale economies are realized. The RPE at a given scale of production, P(q), is equal to the ideal RPE, P(q*), times the ratio q/q* raised to the exponent c. Values of the scale elasticity, c, are often in the vicinity of 0.25, implying that a doubling of manufacturing scale reduces costs by about 15 percent. Once q >= q*, q is set = q* so that the scale elasticity factor will never be smaller than 1.0. P(q) = P(q *) Max [(q/q *) c, 1] Technological progress is determined by user-specified prices, energy efficiencies, and other attributes, which are key exogenous inputs to the model. The technologically achievable price at time t, P t, is defined as the RPE that could be achieved at full-scale and fully learned production. The user must specify the technologically achievable prices, energy efficiencies, and other vehicle attributes as a function of time. See Table A.1. Using the above framework, the RPE of an advanced technology vehicle at any given time is the product of the technologically achievable price, P t, multiplied by factors that represent technological progress, learning by doing, and scale economy functions. 48
49 Not all the components of an EDV will have a comparable state of development. We assume that the vehicle glider is learned out, but the manufacturing cost of other components like batteries, fuel cells and hydrogen storage are less mature and will scale with cumulative production and production plant size. We estimate the glider RPE as the RPE of the 2010 gasoline ref vehicle minus the estimated RPE of its gasoline drive train and fuel storage components. The manufacturing costs of the ref 2010 gasoline vehicle engine, transmission and fuel tank are assumed to total $4000. Taking out the engine, transmission and fuel tank subtracts 1.4 x $4000 from the RPE of the 2010 reference gasoline vehicle. Glider RPE = P 2010 REF VEH 1.4 x (drive train + fuel tank manuf. Cost) REF VEH Glider RPE = P 2010 REF VEH 1.4 x $4000 We also assume that the manufacturing costs never go below the learned out value. The RPE of the EDV P EDV (Q,q,t) is found from the following function P EDV (Q,q,t) = Glider RPE + (P t EDV Glider RPE) Max [(Q/Q 0), 1] Max [(q/q *) c, 1] P EDV (Q,q,t) = P 2010 REF VEH 1.4 x $ (P t EDV P 2010 REF VEH x $4000 ) Max [(Q/Q 0), 1] Max [(q/q *) c, 1] Where: The subscript EDV refers to an electric drive vehicle The subscript REF VEH refers to a reference vehicle (in this case a 2010 gasoline ICEV) P (Q,q,t) is the RPE of the vehicle at some time t, cumulative production Q and mass production level q Pt is the learned out incremental RPE of the vehicle at time t (Pt EDV - P 2010 REF VEH) = incremental RPE of the EDV compared to the 2010 Ref vehicle (multiply NRC 2013 report tables A.1 by 1.4 to obtain this value). Q is cumulative production of the EDV at time t Qo is cumulative production of the EDV at some ref level 0 (chosen to be 500,000 units) a = scaling factor (For example, for a progress ratio PR of 90% the cost falls by 10% (the learning rate) for each doubling of cumulative production. The exponent a = ln(pr)/ln(2) = for a PR of 90%.) q = production plant scale at time t qo= production plant scale at some ref level 0 (chosen to be 500,000 units per year) c = scale economy of mass production at the factory, typically In 2013 a National Academies report provided updated estimates for learned out retail price equivalents for future mass-produced light duty vehicles (Figure 4). This report pushed vehicle drivetrain and envelope efficiency for all types of vehicles, in part by downsizing and light-weighting the vehicle. Their reference gasoline car achieves a fuel economy of about 50 mpg by 2030 and 75 mpg by 2050, a more aggressive efficiency rise than past studies. The cost of gasoline vehicles is projected to increase over time due to these efficiency improvement measures, and by 2045, both fuel cell and battery vehicles are projected to have lower retail prices than these advanced gasoline vehicles. 49
50 Table A.1 (NRC 2013) shows the projected learned out incremental manufacturing cost for light duty cars, light trucks, and a composite fleet average vehicle. To get the incremental RPE, each entry in Table A.1 is multiplied by a factor of 1.4. The RPE of the vehicle is found by adding the RPE for the 2010 reference gasoline vehicle to the incremental cost in Table A.1. The RPE for the 2010 reference gasoline vehicle is $26,341 for cars and $32,413 for light trucks. For example, P t= total vehicle RPE in year t = $26, incremental cost from Table A.1 for cars. Mid-range and Optimistic Cost estimates are shown. We use the mid-range values in our analysis. Table A.1. Incremental manufacturing cost for different types of cars and light trucks as a function of year. Light-Duty Car - Total Incremental Cost vs 2010 baseline vehicle These are learned out costs assuming large scale mass production Mid-Range ICE HEV CNG ICE CNG HEV PHEV BEV FCV 2010 $0 $4,020 $1,552 $5,323 $7,815 15,979 $8, $435 $3,510 $1,921 $4,723 $7,233 13,014 $6, $986 $2,989 $2,290 $4,122 $4,928 4,975 $5, $1,652 $3,017 $2,842 $4,139 $4,635 3,099 $4, $2,433 $3,280 $3,395 $4,156 $4,804 2,816 $3, $2,675 $3,357 $3,589 $4,273 $4,734 2,724 $3, $2,960 $3,638 $3,783 $4,389 $4,952 2,765 $3, $3,288 $3,949 $4,072 $4,689 $5,216 2,852 $3, $3,659 $4,347 $4,361 $4,988 $5,479 2,985 $3,281 Optimistic 2010 $0 $4,020 $1,552 $5,323 $7,815 15,979 $8, $376 $3,006 $1,846 $4,457 $5,675 8,722 $6, $867 $2,485 $2,140 $3,590 $4,497 4,344 $4, $1,473 $2,590 $2,604 $3,577 $4,153 2,335 $3, $2,195 $2,765 $3,067 $3,564 $4,087 1,839 $2, $2,432 $2,973 $3,249 $3,747 $4,233 1,803 $1, $2,713 $3,267 $3,430 $3,930 $4,383 1,818 $1, $3,036 $3,577 $3,722 $4,228 $4,603 1,911 $1, $3,403 $3,960 $4,013 $4,527 $4,884 2,050 $1,961 50
51 Light-Duty Truck - Total Incremental Cost vs 2010 baseline vehicle These are learned out costs assuming large scale mass production Mid- Range ICE HEV CNG ICE CNG HEV PHEV BEV FCV 2010 $0 $4,935 $1,160 $5,957 $10,512 $22,945 $11, $460 $4,228 $9,664 $18,934 $9, $1,059 $3,516 $2,086 $4,445 $6,285 $7,370 $7, $1,798 $3,446 $5,726 $4,650 $6, $2,676 $3,711 $3,493 $4,472 $5,868 $4,314 $5, $2,978 $3,834 $5,777 $4,132 $5, $3,332 $4,171 $4,047 $4,840 $6,026 $4,136 $4, $3,738 $4,540 $6,329 $4,195 $4, $4,196 $5,022 $4,821 $5,609 $6,688 $4,309 $4,641 Optimistic 2010 $0 $4,935 $1,160 $5,957 $10,512 $22,945 $11, $400 $3,601 $7,433 $12,679 $8, $939 $2,890 $1,947 $3,802 $5,715 $6,484 $5, $1,618 $2,942 $5,110 $3,599 $4, $2,436 $3,160 $3,198 $3,875 $4,996 $2,960 $3, $2,734 $3,408 $5,158 $2,863 $2, $3,085 $3,770 $3,735 $4,385 $5,377 $2,830 $2, $3,487 $4,142 $5,655 $2,900 $2, $3,941 $4,611 $4,508 $5,152 $5,990 $3,024 $2,826 Following the treatment in the 2013 National Academies report, we assume that the each vehicle technology is offered in both cars and light trucks, and that the fraction of (light trucks sales)/(all light duty sales) is 50% in 2010, gradually decreasing to 36% by 2030 and remaining at this level to From this we develop a composite average light duty vehicle cost for sales in each year. 51
52 Composite Light Duty Vehicle - Total Incremental Cost vs 2010 baseline vehicle These are learned out costs assuming large scale mass production Mid- Range ICE HEV CNG ICE CNG HEV PHEV BEV FCV 2010 $0 $4,478 $1,356 $5,640 $9,164 $19,462 $10, $446 $3,833 $1,056 $2,597 $8,327 $15,678 $8, $1,015 $3,200 $2,208 $4,251 $5,471 $5,933 $6, $1,707 $3,180 $1,762 $2,566 $5,050 $3,688 $5, $2,521 $3,435 $3,430 $4,270 $5,187 $3,355 $4, $2,784 $3,529 $2,297 $2,735 $5,110 $3,231 $4, $3,094 $3,830 $3,878 $4,551 $5,339 $3,259 $3, $3,450 $4,162 $2,606 $3,001 $5,617 $3,336 $3, $3,852 $4,590 $4,527 $5,212 $5,914 $3,462 $3,771 Optimistic 2010 $0 $4,478 $1,356 $5,640 $9,164 $19,462 $10, $386 $3,274 $1,015 $2,451 $6,466 $10,503 $7, $896 $2,647 $2,063 $3,675 $4,985 $5,200 $4, $1,528 $2,724 $1,614 $2,218 $4,517 $2,815 $3, $2,282 $2,907 $3,114 $3,676 $4,414 $2,242 $2, $2,541 $3,130 $2,079 $2,398 $4,566 $2,185 $2, $2,847 $3,448 $3,540 $4,094 $4,741 $2,182 $2, $3,199 $3,780 $2,382 $2,706 $4,982 $2,267 $2, $3,597 $4,195 $4,191 $4,752 $5,282 $2,401 $2,272 In our calculations to find the early market RPE of the vehicle, the following parameters are used: We assume a progress ratio of 90% (each doubling of cumulative production leads to a 10% reduction in price), so that = Q 0 = 500,000. For estimating the effects of manufacturing scale, we assume q 0 = 500,000 vehicles/year and c = Adjustment for Lower Battery Cost Since the NRC analysis in 2013, the costs of batteries have decreased more rapidly than anticipated (Nyquist and Nilsson 2015). To reflect this, we have done an alternative case with different assumptions about battery costs for cars. We kept the other vehicle parameters from the NRC 2013 study (see Table F.28 from the NRC study below), but reduced assumed battery costs to match those from Nyquist and Nilsson (see Table A.2). 52
53 Table A.2 Assumed Automotive Battery Manufacturing Costs ($/kwh) for Two Studies: NRC (2013) and Nyquist and Nilsson (2015). We replaced the battery costs in Table F.28 (NRC 2013) with those from Nyquist and Nilsson (2015). year NRC 2013 Nyquist and Nilsson 2015 Base Case Battery Cost $/kwh Optimistic Case Battery Cost $/kwh Base Case Battery Cost $/kwh Optimistic Case Battery Cost $/kwh 53
54 Table A.3 Composite Light Duty Vehicle Adjusted for Lower Battery Costs Composite Light Duty Vehicle - Total Incremental Cost vs 2010 baseline vehicle: ADJUSTED FOR LOWER BATTERY COSTS These are learned out costs assuming large scale mass production Mid- Range ICE HEV CNG ICE CNG HEV PHEV BEV FCV 2010 $0 $4,478 $1,356 $5,640 $9,164 $20,065 $10, $446 $3,833 $1,056 $2,597 $8,327 $13,286 $8, $1,015 $3,200 $2,208 $4,251 $5,471 $5,676 $6, $1,707 $3,180 $1,762 $2,566 $5,050 $4,301 $5, $2,521 $3,435 $3,430 $4,270 $5,187 $3,860 $4, $2,784 $3,529 $2,297 $2,735 $5,110 $3,657 $4, $3,094 $3,830 $3,878 $4,551 $5,339 $3,574 $3, $3,450 $4,162 $2,606 $3,001 $5,617 $3,617 $3, $3,852 $4,590 $4,527 $5,212 $5,914 $3,589 $3,771 Optimistic 2010 $0 $4,478 $1,356 $5,640 $9,164 $19,462 $10, $386 $3,274 $1,015 $2,451 $6,466 $10,503 $7, $896 $2,647 $2,063 $3,675 $4,985 $5,200 $4, $1,528 $2,724 $1,614 $2,218 $4,517 $2,815 $3, $2,282 $2,907 $3,114 $3,676 $4,414 $2,242 $2, $2,541 $3,130 $2,079 $2,398 $4,566 $2,185 $2, $2,847 $3,448 $3,540 $4,094 $4,741 $2,182 $2, $3,199 $3,780 $2,382 $2,706 $4,982 $2,267 $2, $3,597 $4,195 $4,191 $4,752 $5,282 $2,401 $2,272 Using Vehicle Transition Cost Models to Estimate the Vehicle Retail Price Equivalent over Time. Given projected sales of EDVs over time so we can find q (the annual production) and Q (the cumulative production) over time allows us to calculate the vehicle costs as a function of time. Market growth curves for EDVs can be based on a hypothetical response to societal goal or policy (for example growth of EV population to satisfy the ZEV regulation), by analogy from historical results for adoption of vehicle innovations (for example, market share for Hybrid electric vehicles like the Prius over time) or from results from a consumer choice model. Given the uncertainties, most studies look at a range of market growth scenarios. COMPARING EDVS AND REFERENCE VEHICLES DURING A TRANSITION In comparing EDVs and Reference Vehicles different metrics can be used. These include lifecycle cost, cash flow or consumer utility. Transition analysts sometime define a breakeven year where the EDV becomes comparable to the reference vehicle according to the metric of choice. Extra costs can be counted up from market introduction to the breakeven year as an indication of investments 54
55 that might be needed to bring the EDV to cost competitiveness. These investment costs can be broken down by stakeholder (e.g. automaker, fuel supplier, etc.) ESTIMATING THE INFRASTRUCTURE NEEDS FOR DIFFEFENT ALTERNATIVE FUELS. Depending on the fuel, different types of infrastructure development would be needed. For plug-in electrics (PEVs) such as battery EVs and PHEVs, we assume home chargers (1 per PEV) are used plus a network of public chargers (1 per 200 PEVs). For hydrogen, we construct a regional infrastructure based on the analysis in Ogden and Nicholas 2011 and Ogden and Yang LIFECYCLE COST EQUIVALENCE In comparing EDVs and Reference Vehicles the Lifecycle Cost of Transport is sometimes used as a metric. In our modeling we keep the LCC model very simple, considering only vehicle first cost, fuel costs and non-fuel O&M costs. (In a consumer choice or other utility-based model, many other factors come into play such as how consumers value range, fuel availability, vehicle size, vehicle choices, environmental values, etc.) The lifecycle cost (LCC) of owning and operating an EDV can be compared to that for a reference gasoline vehicle at a given year. When the lifecycle cost of the EDVs is equal to that of Reference vehicles, we have reached breakeven. The LCC has several components: the vehicle purchase cost, the fuel cost, and non-fuel O&M costs. LCC = C p + C f,d + C nf,d where C p is the total cost of vehicle purchase, C f,d is the discounted lifetime fuel cost, and C nf,d is the discounted lifetime non-fuel cost. The non-fuel O&M costs are often assumed to be the same for different types of vehicles, so we focus on the differences in vehicle first cost and fuel costs. The LCC can be readily modified to include additional costs such as a carbon tax (which is added to the fuel cost). A societal lifecycle cost (SLCC) can also include damage costs from externalities like air pollution, climate change, noise, and energy security (Sun, Delucchi, Ogden 2010). One metric for determining when the EDV is comparable to a reference vehicle is to compare the LCC for the two vehicles over time. The lifecycle cost difference LCC t is: LCC t = LCC EDV,t LCC Gasoline Ref,t = C p,edv + C f,d,edv - [C p,ref + C f,d,ref] In very early markets, we expect the LCC will be strongly positive as the EDV costs significantly more to purchase while EDV fuel costs may be higher or lower. But over time the vehicle purchase cost difference becomes lower, as EDVs are mass produced, and the alternative fuel infrastructure scales up. When LCC reaches zero, we have reached break even. At this point, owning and operating the EDV over its lifetime will cost the same as owning and operating the gasoline reference vehicle. So at this point, when considering only private costs, society should be indifferent 55
56 to which vehicle is on the road. (Note that this is not necessarily the same as the consumer being indifferent he or she still might not buy the vehicle. But society as a whole is indifferent.) Getting to the breakeven point can take a number of years. One method for estimating the transition cost is to add up the investments necessary to bring the EDV to competitiveness. The transition cost can be calculated as the summation of the difference in purchase costs and discounted fuel costs between the alternative and reference vehicles multiplied by the number of EDVs sold in a given year (N EDV,t), summed over all years, t, from when an EDV is introduced to the breakeven year (BEY). BEY LCC t = (((C p,afv C p,ref ) + (C f,d,afv C f,d,ref )) N AFV ) t BEY t Summing the fuel costs in this way allocates all the future differential costs of fuel to the year the EDV is purchased. CASH FLOW APPROACH The Cash Flow approach is an alternative to the LCC approach above. A Cash Flow approach estimates the incremental first cost of EDVs vs. reference vehicles over time. It also uses a stock turnover model to find the total number of EDVs on the road in any given year, accounting for vintages, new vehicles purchased and old vehicles retired. We can then estimate the total EDV fleet s fuel consumption and compare this to the fuel bill if we d stayed with gasoline ref vehicles instead. The cash flow accounts for the extra new vehicle first costs and the EDV fleet s yearly fuel savings. The annual cash flow in year t (ACF t) is the sum of two terms, (1) the difference in purchase cost between the reference and alternative vehicle multiplied by the number of EDVs sold that year (N EDVsales,t), i.e. the incremental costs for buying EDVs in a given year, and (2) the difference in fuel costs between the reference and EDV multiplied by the total number of EDVs in the fleet that year (N EDVfleet,t), i.e. the total incremental cost of purchasing alternative fuels for the EDV fleet. ACF t = [C p,ref,t C p,edv,t] N EDVsales,t + [C f,ref,t C f,edv,t] N EDVfleet,t Given that EDV purchase costs are higher than the reference vehicle while fuel costs should be lower, break even from this cash flow perspective is when this annual cash flow is equal to zero, i.e. when the extra expenditure of buying new EDVs is counterbalanced by the annual fuel savings from the on-road EDV fleet. (Note that this is a different breakeven year than when considering it from a lifecycle perspective). The transition cost to get to this point is BEY ACF t = (((C p,ref C p,afv ) N AFV,t,sales + (C f,t,ref C f,t,afv )) N AFV,t,Fleet ) t BEY t summed over time from t =year of EDV introduction to the cash flow breakeven year (BEY). 56
57 The sum of the first term is the subsidy needed to incentivize the vehicle buyer or manufacturer between market intro and breakeven. BEY ((C p,ref C p,afv ) N AFV,t,sales ) t summed over time from t =year of EDV introduction to the breakeven year. The required transition subsidies to infrastructure builders can be estimated by analyzing how much infrastructure is needed to reach overall pathway breakeven (e.g. count up all or some part of the infrastructure cost from market intro to breakeven year). Alternatively, one could look at fuel cost separately and say the fuel provider breaks-even when he can sell the fuel at an equivalent cost as gasoline on a cost per mile basis. In this example, cash flow calculation discounting is not used. The overall concept is that society as a whole breaks even once the incremental cost of buying the EDVs in year N is offset by fuel cost savings that year from the on-road EDV fleet. HOW ARE THESE APPROACHES DIFFERENT FROM CONSUMER CHOICE MODELS? Note than both the LCC and the Cash Flow approaches are fundamentally different from a consumer choice approach. The LCC and Cash Flow approaches look only at the direct economic cost of introducing EDVs. Consumer choice and other utility models take into account consumers utility (not necessarily equal to the lowest cost solution based on vehicle and fuel costs). Consumer choice models often build in factors that influence the utility a vehicle will provide to a consumer, including consumer preferences for fuel availability, range, trunk space, vehicle size and other vehicle characteristics, as well as vehicle first costs and fuel costs. The choice probability (and assumed market share) will depend on the utility and costs associated with each vehicle type. Consumers might want to be paid back for extra vehicle first cost within 3-5 years, but this not the same as the cost to the economy. The efficient car may pay back its additional first cost in 3 years, but it will still go on delivering fuel saving cost benefits for years Models of consumer decision-making may not count these lifetime fuel savings, but LCC or Cash flow models do. In our study, we use consumer choice models as a guide to construct alternative market adoption curves over time, but use LCC or Cash flow models to estimate the cost to the economy and the investments of different stakeholders. Description of the transition cost modeling approach used in this paper 1) Develop Scenarios for EDV Adoption. Scenarios can be based on historical data for analogous vehicles (use a similar curve to the market penetration of HEVs), extrapolation of early EDV sales, consumer choice models, or even policy goals. The new vehicle sales can be translated into an estimate of the on-road vehicle stock using a stock turnover model. The vehicle miles traveled by EDVs are also tracked. 2) Apply Equation for Technically Achievable Price to find the EDV first cost during the early transition as a function of learning, scale and calendar year. 3) Assume fuel economy vs. time for EDVs based on vehicle simulations 57
58 4) Assume fuel cost over time consistent with EDV penetration (for H 2 from NRC study, for gasoline and electricity from EIA AEO). Use individual pathway studies to find infrastructure costs. 5) Find breakeven year via LCC or Cash Flow models breakeven year will differ depending on which approach you use. Breakeven using the lifecycle cost approach is the year in which the expected lifecycle costs for a new EDV are equivalent to the expected lifecycle costs for a reference gasoline vehicle. Breakeven using the cash flow approach is the year in which the EDV fleet fuel savings relative to the reference vehicle is equivalent to the incremental purchase cost for new EDV sales relative to the reference vehicle. 6) Find vehicle subsidy needed to reach breakeven year 7) Find infrastructure investment needed to break even year 8) Also calculate build out cost beyond breakeven (to 2030 and 2050) 9) Add estimates of other societal benefits (air pollution, GHG, energy security, noise). 58
59 EXAMPLES OF TRANSITION COST CALCULATIONS We use a cash flow model to estimate the costs of different types of vehicles over time, as well as breakeven years and buydown costs. This is also used to calculate investments and subsidies required during the transition. Our results are sensitive to the many assumptions that go into the investment calculation. In this section we show detailed result for our base case and seven sensitivity cases: 1. Our base case (Figure 2), Battery costs have been updated to reflect recent cost reductions, using battery cost estimates from Nyquist and Nilsson A slow market adoption case where EDVs are introduced 50% as fast as the base case, 3. A high ICEV efficiency case where internal combustion engines achieve very high efficiency, making it harder for EDVs to compete on the basis of fuel savings; 4. An optimistic EDV cost case where EDV technology advances faster than in the base case and costs fall more rapidly (based on optimistic case results from the National Academies 2013 study as shown in Appendix A), and 5. A high oil price case where we assume oil prices are higher than in our Base Case - these are based on EIA s 2015 AEO High Oil Price case instead of their Reference Case. 6. A low oil price case where we assume oil prices are lower than in our Base Case - these are based on EIA s 2015 AEO Low Oil Price case instead of their Reference Case. 7. A high battery cost case, where battery costs are from the NRC A low carbon electricity and hydrogen supply case, where renewable technologies are introduced early. The cases above were analyzed assuming taxed gasoline prices from the 2015 EIA Annual Energy Outlook, but no taxes on hydrogen and electricity. We also did a sensitivity case where untaxed gasoline prices were used (we subtracted Federal and state taxes of $0.52/gallon from the taxed gasoline prices in the AEO). The results with untaxed gasoline cases are shown in Figure A-1b. 59
60 Summary Graph of Sensitivity Studies Figure A.1. Cumulative Investments (right hand bar) and Subsidies (left hand bar) for Eight Electric Drive Vehicle Rollout Scenarios from 2010 to Cases with high ICEV efficiency and low oil price don t breakeven until after 2035 (except for BEVs which breakeven in 2031). The other cases breakeven between 2023 and
61 Figure A.1.b. Cumulative Investments (right hand bar) and Subsidies (left hand bar) for Eight Electric Drive Vehicle Rollout Scenarios from 2010 to We assume gasoline, electricity and hydrogen are untaxed. Cases with high ICEV efficiency or Low Oil Prices don t breakeven until after The other cases breakeven between 2027 and
62 BASE CASE 62

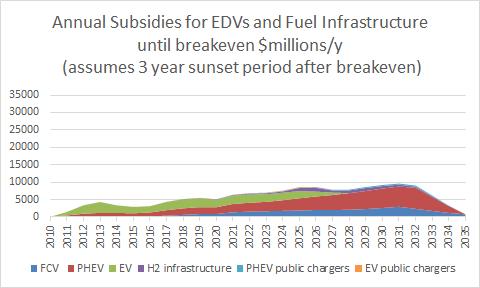
63 SLOW CASE 63
64 OPTIMISTIC VEHICLE CASE HIGH EFFICIENCY ICE VEHICLE CASE 64

65 HIGH OIL PRICE CASE 65
66 LOW OIL PRICE CASE 66
67 67

68 HIGH BATTERY COST CASE 68

69 LOW CARBON ELECTRICITY AND H2 CASE 69
70 References Appendix A: Bandivadekar, A., Bodek, K., Cheah, I., Evans, C. Groode, T., Heywood, J. Kasseris, E. Kromer, M. and Weiss, M., On the Road in 2035: Reducing Transportation s Petroleum Consumption and GHG Emissions. MIT Laboratory for Energy and the Environment, Burke, A., Zhao, H. and Miller, M., Chapter 4, Comparing Fuel Economies and Costs of Advanced and Conventional Vehicles, in Ogden J.M. and Anderson, L., Sustainable Transportation Energy Pathways, Institute of Transportation Studies. University of California, Davis, Regents of the University of California, Davis campus. Available under a Creative Commons BY-NC-ND, 3.0 license, August California Air Resources Board, Annual Evaluation of Fuel Cell Electric Vehicle Deployment and Hydrogen Fuel Station Network Deployment June accessed July 24, California Air Resources Board, 2015 Annual Evaluation of Fuel Cell Electric Vehicle Deployment and Hydrogen Fuel Station Network Deployment July California Air Resources Board, 2016 Annual Evaluation of Fuel Cell Electric Vehicle Deployment and Hydrogen Fuel Station Network Deployment July EPRI, 2009: Program on Technology Innovation: Industrial Electrotechnology Development Opportunities. Electric Power Research Institute, Palo Alto, CA. Discussion of the Benefits and Impacts of Plug-In Hybrid and Battery Electric Vehicles, Electric Power Research Institute, Massachusetts Institute of Technology Energy Initiative: The Electrification of the Transportation System: Issues and Opportunities. IPCC, Intergovernmental Panel on Climate Change, Special Report on Renewable Energy, May Sims, R., P. Mercado, W. Krewitt, G. Bhuyan, D. Flynn, H. Holttinen, G. Jannuzzi, S. Khennas, Y. Liu, M. O Malley, L. J. Nilsson, J. Ogden, K. Ogimoto, H. Outhred, Ø. Ulleberg, F. van Hulle, 2011: Chapter 8 Integration of Renewable Energy into Present and Future Energy Systems. In IPCC Special Report on Renewable Energy Sources and Climate Change Mitigation [O. Edenhofer, R. Pichs-Madruga, Y. Sokona, K. Seyboth, P. Matschoss, S. Kadner, T. Zwickel, P. Eickemeier, G. Hansen, S. Schlömer, C. von Stechow (eds)], Cambridge University Press, Cambridge, United Kingdom and New York, NY, USA National Research Council, Transitions to Alternative Transportation Technologies: A Focus on Hydrogen, ISBN-13: Washington, DC: National Academies Press, National Research Council, Committee on Assessment of Resource Needs for Fuel Cell and Hydrogen Technologies, Transitions to Alternative Transportation Technologies: A Focus on Plug-in Hybrids, Washington, DC: National Academies Press, National Research Council. Transitions to Alternative Vehicles and Fuels. Washington, DC: National Academies Press, Plotkin, S. and Singh, M. Multi-Path Transportation Futures Study: Vehicle Characterization and Scenario Analyses, Argonne National Laboratory Report ANL/ESD/09-5, July 22,
71 USDOE EIA AEO Yang, Christopher and Joan Ogden. Renewable and Low Carbon Hydrogen for California Modeling The Long Term Evolution of Fuel Infrastructure Using a Quasi-Spatial TIMES Model. International Journal of Hydrogen Energy. 38 (11) p

72 APPENDIX B: NATIONAL ROLLOUT SCENARIOS FOR HYDROGEN FUEL CELL VEHICLES IN THE U.S. We develop several scenarios for a national hydrogen fuel cell vehicle rollout in a series of lighthouse cities (LHCs) based on 1) scenarios from the 2008 NRC Hydrogen Transitions report (NRC 2008), and 2) scenarios based on use of near-term commercial technology using hydrogen truck delivery and onsite steam methane reformers (Ogden and Nicholas 2011). ROLLOUT ANALYSIS BASED ON THE NRC 2008 HYDROGEN TRANSITION STUDY The results from the 2008 NRC report have been described in (NRC 2008, Ogden and Yang 2009). Hydrogen FCVs are introduced in series of lighthouse cities according to the schedule in Figure B.1. An optimal city-level hydrogen supply for that number of vehicles is estimated, choosing the lowest cost hydrogen supply from a variety of options. The total delivered hydrogen cost is found for each city in turn, and a national average hydrogen cost is estimated. When the national average hydrogen cost reaches the same fuel cost per mile as a competing gasoline car we say that the fuel supply is competitive. This happens when the H2 cost is about $7/kg, competing with gasoline at about $4/gallon. This happens 5 years after FCV introduction in city after city (Figure B.2). If we assume public support until the national average fuel supply cost reaches $7/kg, this amounts to an investment about $1 Billion for perhaps 500 stations, spent over 5 years. Figure B.1 Hydrogen Rollout Scenario in NRC This is roughly consistent with FCV curves in Figures 2 and 3 of this paper, assuming that the first year of FCV introduction is moved from 2012 to
73 Figure B.2. Delivered hydrogen cost in U.S. Cities for phased introduction of hydrogen cars (NRC 2008, Ogden and Yang 2009). Figure B.3. National Average Delivered hydrogen cost in U.S. for rollout scenario in Figure B.1 (Ogden and Yang 2009). 73
74 Figure B.4. Estimate of investment in stations to reach national average H2 cost of $7/kg. This takes about 5 years and requires about $1 Billion of investment in stations. (Note that we have moved the start year in this graph from 2012 as used in the 2008 NRC H2 Transition report to 2015). Another way to estimate the needed infrastructure investment is based in the lifetime cost of transportation. Lifetime cost competitiveness includes buying down the cost of the FCV vehicles as well as reducing the hydrogen fuel cost by scaling up regional infrastructures. The lifetime cost of owning and operating the FCV is the same as that for a gasoline ICEV competitor. If we assume that hydrogen infrastructure build-out must be supported until the lifetime cost for FCVs competes with a gasoline car, breakeven takes several more years, and results in an overall infrastructure capital investment cost of perhaps $8 Billion (about 4000 stations) spent over 13 years (NRC 2008). EARLY ROLLOUT SCENARIOS BASED ON A REGIONAL CLUSTER STRATEGY Since the 2008 NRC study, as hydrogen FCVs have begun commercial introduction worldwide, there have been more detailed analyses of how a hydrogen infrastructure rollout might proceed and better estimates of the capital and operating costs of hydrogen stations. The type of hydrogen supply influences the capital investments needed for infrastructure. The 2008 NRC report used an optimized hydrogen fuel supply chain incorporating advanced technologies, but it now appears that early hydrogen infrastructure will probably build on commercial hydrogen delivery technologies used in the industrial gas business, such as truck delivery of compressed hydrogen gas or liquid hydrogen. Early stations will be sited in early adopter cluster areas within a city or region, concentrating infrastructure near the earliest FCV adopters to provide better accessibility at lower 74
75 cost (Ogden and Nicholas 2011). By the time 50, ,000 FCVs have been introduced in a particular city or local region 19 we estimate that stations would have been built. Hydrogen infrastructure capital investments for industrial gas-based supply would be perhaps $ per FCV served and hydrogen costs at the pump would be in the range $6-8/kg, competitive with gasoline on a fuel cost per mile basis (Ogden, Yang, Nicholas and Fulton 2014). Reaching competitiveness in each lighthouse city might require $ million of support for early stations in each city, before the local fuel network was commercially launched in the sense that the next station built would be an economically attractive investment for private sector investors. If the first few lighthouse cities are successful, investors might gain enough confidence to open new lighthouse cities building a more extensive hydrogen infrastructure from the beginning, anticipating a rapidly rising market share of FCVs that would make infrastructure economically attractive within only a few years. In other words, our conjecture is that the private sector might take over development of U.S. hydrogen infrastructure once it was successful in a few cities. How many cities would have to be subsidized to encourage private investment? We have developed cases where FCVs are introduced in 5 U.S. lighthouse cities, followed by rapid rollouts in 55 additional cities by We develop several U.S. national scenarios based on cluster strategy rollouts in successive lighthouse cities. In the first group of lighthouse cities called early lighthouse cities the rollout progresses relatively slowly. In Later Lighthouse Cities the rollout is assumed to be more rapid. Our assumed vehicle rollout in an early lighthouse city is shown in Figure B.5, reaching 60,000 vehicles on the road by year 8 and 150,000 by year 10. The station network in each city is designed to provide coverage (e.g. adequate number of stations for fuel accessibility for early adopters), and then capacity (adequate hydrogen supply for growing numbers of vehicles). We assume that compressed gas truck delivery is used initially in each lighthouse city, with supply switching to onsite natural gas reforming once the regional hydrogen FCV population reaches 50, ,000 (typically in the 8 th or 9 th year after the introduction of FCVs). Figure B.6 shows the assumed number of stations and their capacity over time (Tables B.1 and B.2 have details on the types of stations and their costs), and Figure B.7 shows the estimated hydrogen cost 20 and cumulative capital investment in stations over time. 19 In Southern California, 100,000 FCVs would be about 1% of the regional light duty fleet. 20 The regional levelized hydrogen cost ($kg) in each year is calculated based on the annualized capital cost for the stations built to date, plus annual fixed and variable operating costs for all the stations in that year, all divided by the number of kilograms of hydrogen dispensed in that year. The cumulative capital cost is the sum of the capital expenditures on stations starting at market introduction. 75
76 Table B.1. Scenario for rollout of FCVs and hydrogen stations in an early lighthouse city. Year # FCVs in fleet H2demand kg/d #NEW STATIONS INSTALLED PER YEAR BY STATION SIZE (kg/d) AND TYPE Station Size Compressed Gas Truck Delivery 100 kg/d kg/d kg/d kg/d Onsite Steam Reformer 1000 kg/d TOTAL STATION CAPACITY (kg/d) NETWORK CAPACITY FACTOR TOTAL NUMBER OF STATIONS CUMULATIVE CAPITAL INVESTMENT IN STATIONS ($ millions) LEVELIZED COST OF HYDROGEN ($/kg) Network Average for entire rollout Next Station Built (at 70% capacity factor)
77 Table B.2. Hydrogen Station Cost Assumptions: 700 bar dispensing. (Compressed Gas Truck costs based on industry input; Onsite SMR and electrolyzer costs from (Ogden and Nicholas 2011). Time frame Capital Cost Annual O&M cost $/yr COMPRESSED GAS TRUCK DELIVERY Phase 1 (years 1-2) 100 kg/d 250 kg/d Phase 2 (years 3-4) 170 kg/d 250 kg/d Phase 3 (year 5+) 170 kg/d 250 kg/d 500 kg/d $1 million $1.5 million $0.9 million $1.4 million $0.5 million $0.9 million $1.5-2 million $100 K (fixed O&M) + 1 kwh/kgh 2 x kg H 2/yr x $/kwh (compression electricity cost) + H 2 price $/kg x kg H 2/y (H 2 cost delivered by truck) Same as above Same as above ONSITE STEAM METHANE REFORMER Phase 3 (year 5+) 1000 kg/d $4.38 million 7% capital costs + $216,000 rent (fixed O&M) MBTU/kg x NG price($/mbtu) x kg H 2/yr (natural gas feedstock cost) kwh/kg x kg H 2/yr x $/kwh (compression electricity cost) ONSITE ELECTROLYZER Phase 2 (years 3-4) 170 kg/d 250 kg/d 500 kg/d $2.7 million $3.7 $4.7 10% capital costs + $80,000 rent (fixed O&M) 9% capital costs + $120,000 rent (fixed O&M) 8% capital costs + $144,000 rent (fixed O&M) Phase 3 (year 5+) 500 kg/d 1000 kg/d $3.1 million $5.1 million (53.4 kwh/kg kwh/kg) x $/kwh (variable O&M) (electrolysis + compression) x (elec. price) 8% capital costs + $144,000 rent (fixed O&M) 7% capital costs + $216,000 rent (fixed O&M) (53.4 kwh/kg kwh/kg) x $/kwh (variable O&M) (electrolysis + compression) x (elec. price) 77
78 Number of FCVs 400, , , , , , ,000 Number of FCVs in fleet and FCV sales (vehicles/yr): Regional Scenario FCV sales/year Total FCVs in fleet 50, Year of Transition Figure B.5 Early Light House City Scenario for regional FCV sales and on-road fleet vs. years (year 1 = start of commercialization). Station Number or Station Capacity (kg/day) Station Network Characteristics Network Capacity Factor Average New Station Capacity Year of Transition Number of Stations Network Capacity Factor Figure B.6. Early Lighthouse City Scenario for total number of regional hydrogen stations, average size of new stations built and network capacity factor (= hydrogen dispensed/station network capacity). The station network serves the FCV rollout in Figure B.5. The network capacity factor is low for the first few years, as stations are built ahead of vehicle deployment. Initially stations are small to provide coverage for early adopters. The network factor is plotted on the right hand y-axis; other variables on the left hand y-axis. 78
79 Figure B.7. Estimate of the investments needed to support hydrogen infrastructure development in an early lighthouse (right hand y-axis) and the hydrogen cost (left hand y-axis). For Later Lighthouse cities, we assume that the ramp up begins at year 5 of Figures B-5-B.7, essentially skipping the first few years of the rollout where only tens of stations and 100s of FCVs were in place. This assumes there is enough confidence in the market to move ahead quickly to scale in new cities starting out with thousands of FCVs per year. Table B.3. Scenario for rollout of FCVs and hydrogen stations in a later lighthouse city. Year # FCVs in fleet (1000s) H2demand kg/d #NEW STATIONS INSTALLED PER YEAR BY STATION SIZE (kg/d) AND TYPE Station Size Compressed Gas Truck Delivery 500 kg/d Onsite Steam Reformer 1000 kg/d TOTAL STATION CAPACITY (kg/d) NETWORK CAPACITY FACTOR TOTAL NUMBER OF STATIONS CUMULATIVE CAPITAL INVESTMENT IN STATIONS ($ millions) LEVELIZED COST OF HYDROGEN ($/kg) Network Average
80 We now develop a national scenario made up of staged introduction of FCVs in a series of early LHCs and Later LHCs. To reach overall U.S. sales of 2 million FCVs per year by 2030, we postulate that 60 lighthouse cities adopt hydrogen by 2030, beginning with Southern California. Each city goes through a similar infrastructure scale-up process, starting with truck delivery and progressing to onsite reformation of natural gas. We perform the infrastructure cost analysis for a representative early lighthouse city and a representative later lighthouse city. The overall national U.S. investment is estimated as a sum of this staged development. Once hydrogen has been successfully introduced in the first 5 lighthouse cities, we assume an additional 5 LHCs start in 2020 and proceed more quickly in infrastructure build-up and FCV adoption. These are followed in 2025 by an additional 16 LHCs, and in 2030 by an additional 34, or a total of 60 cities by In our base case, the national U.S. rollout progresses as follows: : 5 early lighthouse cities (LHCs) follow the FCV adoption rate and station build-out shown in Figures B.5-B.7. (The assumed rollout begins in Southern California, followed by New York City, Chicago, Washington/Baltimore and San Francisco.) By year 10 after the rollout begins, each early lighthouse city has a FCV population of 150,000 and annual sales of 50,000/yr. For reference 50,000 per year is about 10% of the annual sales of vehicles in the Los Angeles area (7% of Southern California annual light duty vehicle sales). This is a market adoption rate similar to the most successful PEV markets today, for example in the Netherlands or Norway. By year 12 after introduction (2027) the market increases to 120,000 FCVs per year in each early LHC and is assumed to stay at that level : 5 additional early LHCs adopt FCVs and build hydrogen infrastructure, following the rollout shown in Figures B.5-7. FCV adoption is assumed to happen more rapidly than for the first 5 cities, and by year 8 (2028), each late lighthouse city has an onroad FCV population of 150,000 and annual sales of 50,000/yr. It is assumed that regional sales in each LHC reach 120,000 per year in year 10. Depending on the size of the city, this requires FCVs to capture a major fraction of the fleet within about 10 years. By 2025, the nationwide annual FCV sales are about 0.5 million/yr and the on-road number of FCVs is about 1 million counting the first 10 cities : We assume that FCV markets continue to grow and FCVs and hydrogen infrastructure are introduced into an additional 16 LHCs starting in These cities follow the late lighthouse city scenario in Table B.2. We assume that sales in LHCs grow to 50,000 FCVs per year by year 6 (2031) and remain at this level. The total national FCV market fraction reaches about 11% by 2030 (2 million annual sales of FCVs out of a total of 18 million LDV sales) : We assume that FCV markets continue to grow and FCVs and hydrogen infrastructure are introduced into an additional 34 LHCs in Sales in these late LHCs grow to 50,000 FCVs per year by The total national FCV market fraction reaches about 22% by 2035 (4 million annual sales of FCVs out of a total of 18 million LDV sales). 80
81 There are 60 U.S. cities with metro-area populations of 1 million or more. A city of 1 million would have regional LDV annual sales of perhaps 60,000 units per year, so sales of 50,000 FCV/yr would be equivalent to 83% of the LDV market in that city. To accommodate growing numbers of PHEVs and BEVs in addition to FCVs, we might need to limit the sales of FCVs in LHCs to a fraction of the total. Basically, the scenario in Figure 2 and 3 requires that FCVs be introduced into many large U.S. cities by 2025, and that they rapidly capture market share, at a rate similar to the fastest growing PEV markets today. Figure B.8 shows the on-road fleet numbers over time as hydrogen FCVs are rolled out in a series of 60 lighthouse cities. The first 5 rollouts begin in (blue area), followed by an additional 5 cities in 2020 (red area), 16 more cities in 2025 (yellow area), and an additional 34 LHCs in 2030, Figure B.8. The on-road fleet for H2 FCVs is shown over time for a scenario where FCVs are introduced over time in a series of early lighthouse cities (#1-5) and later lighthouse cities (#6-60). Year 0 corresponds to 2015 and year 20 to
.")

82 Figure B.9 Two different rollout plans to produce the on-road vehicle numbers shown in Figure B.8. Figure B.9 shows two different regional sales profiles to meet the total on-road vehicle fleet numbers in Figure B.8. The upper graphs show the sales per year in the progression of lighthouse cities (LHC). The first 5 rollouts begin in 2015 (blue area), followed by an additions 5 cities in 2020 (red area), 16 cities in 2025 (yellow area), and 34 LHCs in The lower graphs show the regional FCV fraction of light duty vehicle sales in each city over time. This is an indication of how much local market share FCVs are assumed to capture over time. The left hand graphs show a case where the market fraction in the early cities (shown in blue and red) stabilizes at 10-30% after about years and doesn t grow beyond that. The cities introduced in 2030 show a very rapid market uptake, reaching market fractions of 40-90% in about 5 years. (Such high fractions may not be realistic, given competition from conventional technologies as well as PEVs.) The right hand graphs illustrate a case where sales fractions keep growing in the early lighthouse cities until they reach 20-40%, and the later LHCs grow at a slower rate, reaching about 10-20% of sales after 5 years. In both cases, the average U.S. sales fraction is 22% in 2035, but in the left hand case, the fractional sales rate is higher for later LHCs. Looking at the aggregated national numbers, the U.S. average levelized cost of hydrogen is shown in Figure B.10. The investment in hydrogen stations is shown in as well. This is the sum of the investments required to bring each region to cost competitive hydrogen production (defined as $6-8/kg). 82
83 Figure B.10. U.S. National FCV rollout scenario. Average H2 cost, and cumulative investments for the first 200 stations in early lighthouse cities and the first 100 stations in later lighthouse cities. These levels are estimated to be enough to launch the regional infrastructure in each city. The estimated national average hydrogen cost is used to analyze the breakeven year for FCVs considering vehicle buydown. The national breakeven year is reached in 2031 when an estimated 10 million FCVs are on the road in a total of 60 cities. The total vehicle subsidy required to 2031 is about $43 Billion, spent over a total of 16 years (starting in 2015). We assume that the infrastructure capital cost must be supported in each city until the regional hydrogen cost is $7/kg. We estimate that reaching this infrastructure launch point in each city requires paying for an initial stations in the 10 early lighthouse cities and stations in each of the next 15 (later) lighthouse stations. The total launch cost is about $8.2 Billion capital cost for 4200 stations, the majority of them truck delivery stations. The total capital expenditure on hydrogen stations (including those stations built after hydrogen becomes profitable) is $48 B in 2030 and $99 B in SLOW MARKET ADOPTION CASE The figures and tables below summarize the hydrogen infrastructure analysis for the Slow Market Adoption case. 83
84 84
85 Table B.4. Scenario for rollout of FCVs and hydrogen stations in early lighthouse city : slow market case Year # FCVs in fleet H2demand kg/d #NEW STATIONS INSTALLED PER YEAR BY STATION SIZE (kg/d) AND TYPE Station Size Compressed Gas Truck Delivery 100 kg/d kg/d kg/d kg/d Onsite Steam Reformer 1000 kg/d TOTAL STATION CAPACITY (kg/d) NETWORK CAPACITY FACTOR TOTAL NUMBER OF STATIONS CUMULATIVE CAPITAL INVESTMENT IN STATIONS ($ millions) LEVELIZED COST OF HYDROGEN ($/kg) Network Average for entire rollout Table B.5. Scenario for rollout of FCVs and hydrogen stations in a later lighthouse city : slow market case Year # FCVs in fleet (1000s) H2demand kg/d #NEW STATIONS INSTALLED PER YEAR BY STATION SIZE (kg/d) AND TYPE Station Size Compressed Gas Truck Delivery 500 kg/d Onsite Steam Reformer 1000 kg/d TOTAL STATION CAPACITY (kg/d) NETWORK CAPACITY FACTOR TOTAL NUMBER OF STATIONS CUMULATIVE CAPITAL INVESTMENT IN STATIONS ($ millions) LEVELIZED COST OF HYDROGEN ($/kg) Network Average
86 Figure B.13. U.S. National FCV rollout scenario: slow market case. Average H2 cost, and cumulative investments for the first 200 stations in early lighthouse cities and the first 100 stations in later lighthouse cities. These levels are estimated to be enough to launch the regional infrastructure in each city. Comparing to Figure B. 9, we see that the early levelized hydrogen cost and the cumulative overall infrastructure investment is higher than the base case. This occurs because the stations are less well utilized in the slow market case. 86
87 REFERENCES APPENDIX B California Air Resources Board, 2014 Annual Evaluation of Fuel Cell Electric Vehicle Deployment and H2 Fuel Station Network Deployment July California Air Resources Board, 2015 Annual Evaluation of Fuel Cell Electric Vehicle Deployment and Hydrogen Fuel Station Network Deployment July California Air Resources Board, 2016 Annual Evaluation of Fuel Cell Electric Vehicle Deployment and Hydrogen Fuel Station Network Deployment July McKinney, Jim, et al Joint Agency Staff Report on Assembly Bill 8: Assessment of Time and Cost Needed to Attain 100 Hydrogen Refueling Stations in California. California Energy Commission. Publication Number: CEC Melaina, M.W.; Heath, G.; Sandor, D.; Steward, D.; Vimmerstedt, L.; Warner, E.; Webster, K.W. (March 2013). Alternative Fuel Infrastructure Expansion: Costs, Resources, Production Capacity, and Retail Availability for Low-Carbon Scenarios. Transportation Energy Futures Series. Prepared for the U.S. Department of Energy by National Renewable Energy Laboratory, Golden, CO. DOE/GO pp. NRC, 2008: Transitions to Alternative Transportation Technologies: A Focus on Hydrogen, ISBN-13: The National Academic Press, Washington, 142pp. National Research Council, Committee on Assessment of Resource Needs for Fuel Cell and Hydrogen Technologies, Transitions to Alternative Transportation Technologies: A Focus on Plug-in Hybrids, Washington, DC: National Academies Press, National Research Council. Transitions to Alternative Vehicles and Fuels. Washington, DC: The National Academies Press, Nicholas, M., Handy, S., and Sperling, D. Using Geographic Information Systems to Evaluate Siting and Networks of Hydrogen Stations, Transportation Research Record 1880, 2004, Nicholas, M. A. and Ogden, J. M. Detailed Analysis of Urban Station Siting for California Hydrogen Highway Network, Transportation Research Record , Ogden J.M. and L. Anderson, Sustainable Transportation Energy Pathways, Institute of Transportation Studies. University of California, Davis, Regents of the University of California, Davis campus. Available under a Creative Commons BY-NC-ND, 3.0 license, August Ogden, J. and Nicholas, M. "Analysis of a Cluster Strategy for Introducing Hydrogen Vehicles in Southern California", Energy Policy, 39, J. Ogden and C. Yang, Build-up of a hydrogen infrastructure in the U.S., Chapter 15, in The Hydrogen Economy: Opportunities and Challenges, edited by Dr Michael Ball and Dr Martin Wietschel, Cambridge University Press, 2009, pp Ogden, Joan M., Christopher Yang, Michael A. Nicholas, Lewis Fulton (2014) NextSTEPS White Paper: The Hydrogen Transition. Institute of Transportation Studies, University of California, Davis, Research Report UCD-ITS-RR-14-11, 87
88 APPENDIX C. COMPARISON OF THIS REPORT WITH RECENT ANL CRADLE TO GRAVE REPORT. In June 2016, a group of industry and government analysts published a new report on current and future light duty vehicle pathways in the United States. Elgowainy, A. et al. Cradle to Grave Lifecycle Analysis of U.S. Light Duty Vehicle/Fuel Pathways: A Greenhouse Gas Emissions and Economic Assessment of Current and Future ( ) Technologies, Argonne National Laboratory, Energy Systems Division, ANL/ESD 16/7, June Several reviewers of earlier drafts of this paper, suggested that we compare STEPS results with those in the C2G report. We make this comparison in this Appendix. OVERALL CONCLUSIONS OF THE ANL C2G REPORT AND COMPARISON WITH STEPS RESULTS Below we quote from the Executive Summary of the ANL C2G report, noting in capital letters whether the STEPS study is in overall agreement with these major findings of the C2G study. The following observations are drawn from this (C2G) report: Emissions: Large GHG reductions for LDVs are challenging and require consideration of the entire lifecycle, including vehicle manufacture, fuel production, and vehicle operation. (STEPS REPORT AGREES) Cost: High-volume production is critical to the viability of advanced technologies. (AGREE, SEE FIGURE 6) Incremental costs of advanced technologies in FUTURE TECHNOLOGY, HIGH VOLUME cases are significantly reduced, reflecting estimated R&D outcomes. (AGREE, SEE FIGURE 6) Low-carbon fuels can have significantly higher costs than conventional fuels. (AGREE, SEE FIGURE 12, BUT THE HIGHER EFFICIENCY OF ELECTRIC AND HYDROGEN VEHICLES COMPARED TO GASOLINE VEHICLES CAN COMPENSATE FOR THIS ON A CENT PER MILE BASIS, ONCE THE LOW CARBON FUEL IS PRODUCED AT SCALE- SEE FIGURE 13.) Vehicle cost is the major (60 90%) and fuel cost the minor (10 40%) component of LCD when projected at volume. Treatment of residual vehicle cost is an important consideration. Many alternative vehicles and/or fuels cost significantly more than conventional gasoline vehicles for the CURRENT TECHNOLOGY case, even when costs are projected for high-volume production. (AGREE, ALTHOUGH WE DON T EXPLICITLY SHOW THIS RESULT). Cost of carbon abatement: For the CURRENT TECHNOLOGY, HIGH VOLUME case, carbon abatement costs are generally on the order of $100s per tonne CO2 to $1,000s per tonne CO2 for alternative vehicle-fuel pathways compared to a conventional gasoline vehicle baseline. (AGREE FOR THE 2015 TIMEFRAME, SEE FIGURE 21) FUTURE TECHNOLOGY, HIGH VOLUME carbon abatement costs are generally expected to be in the range $100 $1,000/tonne CO2. (AGREE, SEE FIGURE 21) 88
89 Technology feasibility: Significant technical barriers still exist for the introduction of some alternative fuels. Further, market transition barriers such as low-volume costs, fuel or make/model availability, and vehicle/fuel/infrastructure compatibility may play a role as well. (AGREE, SEE DISCUSSIONS IN SECTION ON P. 17 ff on INFRASTRUCTURE COSTS FOR ELECTRIC AND HYDROGEN VEHICLES Limitations: AEO 2015 data for prices of crude oil, gasoline, and diesel fuel used in the CURRENT TECHNOLOGY case differ from subject data reported for early Because these data are different and because they are among several factors considered in this analysis, the calculated CURRENT TECHNOLOGY LCD for gasoline and diesel and the CURRENT TECHNOLOGY cost of avoided GHG emissions for the other alternative pathways relative to gasoline would be different if 2016 prices were used. One of the consequences of using AEO 2015 data for the CURRENT TECHNOLOGY cases is that the prices of crude oil, gasoline, and diesel fuel used in this report are 40 50% higher than actual market prices for those products in the first quarter of 2016 (the time this report was written). This report examines current fuel costs in greater detail in Section 9.4 and Appendix F. (STEPS STUDY BASE CASE USED EIA AEO 2015 GASOLINE PRICES, DOING SENSITIVITY CASES FOR LOW, REF., AND HIGH OIL PRICE CASE) This (the C2G) study evaluated GHG emissions and cost of individual pathways and assumed common vehicle platforms for comparison. The cost estimates in this study are subject to uncertainties due to their projection at both high- and low-volume production for the CURRENT TECHNOLOGY case and their dependence also on technology advancement for the FUTURE TECHNOLOGY case. Furthermore, market scenario analysis should build on this pathway analysis to explore the realistic potential of the mix of different pathways to achieve GHG emission targets in different regions (STEPS STUDY ASSUMED THAT TECHNOLOGY DEVELOPED OVER TIME, AS MANUFACTURING SCALED UP. EXPECTED AND OPTIMISTIC CASES FROM THE NRC 2013 TRANSITIONS REPORT WERE USED TO ESTIMATE VEHICLE COSTS.) Key GHG emission parameters influencing the results of various pathways are subject to different degrees of uncertainty. For example, methane emissions of the CURRENT TECHNOLOGY natural gas pathway vary greatly between the various studies. Land use change attributed to large-volume biofuel production is another example of uncertainty and varies greatly between studies. (AGREED) Factors other than cost of avoided GHG emissions, such as air quality, vehicle functionality (range, refueling time and infrastructure availability, packaging), and fuel production scalability, are important but not captured in this study. (STEPS STUDY DID NOT EXPLICITLY ESTIMATE THESE COSTS EITHER). Overall, there was significant agreement between the STEPS report and the major findings of the C2G report. DETAILED COMPARISONS BETWEEN ASSUMPTIONS IN THE C2G REPORT AND THE STEPS STUDY CASES CONSIDERED 89
90 The C2G report considered a wide range of fuels and vehicles as shown in the table below and focused on two time frames current (2015) and future ( ) (see Table C.1 below). Table C.1 (from ANL C2G study) The STEPS study also focused on the timeframe between , but considered only four pathways, gasoline ICEVs, gasoline fueled plug-in hybrids, battery electrics, and hydrogen fuel cell vehicles. The STEPS study looked at transition scenarios for each year between , while the C2G study analyzed snapshot years of 2015 and representing Current and Future technologies. 90

91 VEHICLE MODELING The C2G report did extensive runs with the Autonomie model to estimate vehicle performance, configuration and cost for current and future ( ) technology. Vehicle costs assumed large scale manufacturing with a base case of 500,000 units per year. The STEPS study relied on modeling results from the NRC 2013 report on Light Duty Vehicle Transitions for vehicle attributes and costs. However, we updated the battery costs to reflect more recent thinking using Nyquist and Nilsson s 2015 report. In the STEPS study, the assumed level of vehicle manufacturing varied over time, in step with assumed market growth. Further, we assumed that the vehicle and fuel technologies came down in cost over time due to learning and scale-up. FUEL INFRASTRUCTURE MODELING The C2G study used the following sources for fuel and infrastructure costs. Tables C.2 and C.3 (from ANL C2G study) 91
92 The STEPS study used the EIA AEO 2015 for projections of future fuel and electricity prices, plus in house UC Davis models for hydrogen infrastructure design and costs (Ogden et al. 2014). 92
93 FUEL COST ASSUMPTIONS Figure C.2 Assumed Fuel Costs from ANL C2G study Figure C.3 Fuel Cost assumptions vs. time for gasoline, hydrogen and electricity (STEPS study). We used taxed gasoline prices, but no taxes on hydrogen or electricity. This contrasts with the C2G study, which assumed no taxes on any fuel. We ran untaxed gasoline cases as a sensitivity study, which made it harder for electric vehicles to compete with gasoline vehicles. 93
94 Fuel costs were comparable in the two studies, although our assumed near term hydrogen costs were significantly higher in the early years than those in the C2G study, which assumed a more mature infrastructure. FUEL ECONOMY ASSUMPTIONS The assumptions from the C2G study are shown in Table C.4 below. 94
95 Figure C.5 shows fleet averaged fuel economy assumptions from the STEPS study Fuel economy assumptions from the STEPS study are shown above. These are higher efficiency compared to the C2G study. Also, in the STEPS study these are fleet averages fuel economies for a light duty fleet with a mix of cars and light trucks. The BEV 100 has a fuel economy x that of a gasoline car. The FCV fuel economy is X greater than a gasoline ICEV. These fuel economy assumptions make it easier for the BEVs and FCVs to compete with gasoline cars on a lifecycle cost basis in our study compared to the C2G study. VEHICLE COSTS Vehicle costs increments are higher in the C2G study than in the STEPS study. This makes it more difficult for alternative fueled vehicles to compete with gasoline vehicles. 95

96 Table C.7 Assumed vehicle costs in the C2G study ASSUMED VEHICLE COSTS IN THE STEPS STUDY The vehicle costs are taken from NRC 2013, except for battery costs which are from Nyquist and Nilsson We used a composite light duty vehicle based on NRC costs for a light duty fleet made up of cars and light trucks. 96
How vehicle fuel economy improvements can save $2 trillion and help fund a long-term transition to plug-in vehicles
 How vehicle fuel economy improvements can save $2 trillion and help fund a long-term transition to plug-in vehicles Policy Institute, NextSTEPS and GFEI Webinar November 7, 2013 Dr. Lewis Fulton, NextSTEPS
1 Faculty advisor: Roland Geyer
 Reducing Greenhouse Gas Emissions with Hybrid-Electric Vehicles: An Environmental and Economic Analysis By: Kristina Estudillo, Jonathan Koehn, Catherine Levy, Tim Olsen, and Christopher Taylor 1 Introduction
Electric Vehicle Cost-Benefit Analyses
 Electric Vehicle Cost-Benefit Analyses Results of plug-in electric vehicle modeling in eight US states Quick Take M.J. Bradley & Associates (MJB&A) evaluated the costs and States Evaluated benefits of
Energy Challenges and Costs for Transport & Mobility. 13th EU Hitachi Science and Technology Forum: Transport and Mobility towards 2050
 Energy Challenges and Costs for Transport & Mobility 13th EU Hitachi Science and Technology Forum: Transport and Mobility towards 25 Dr. Lewis Fulton Head, Energy Policy and Technology, IEA www.iea.org
Electric Vehicles: Opportunities and Challenges
 Electric Vehicles: Opportunities and Challenges Henry Lee and Alex Clark HKS Energy Policy Seminar Nov. 13, 2017 11/13/2017 HKS Energy Policy Seminar 1 Introduction In 2011, Grant Lovellette and I wrote
Implementation of Future Transportation Technologies: Getting Beyond the Low Hanging Fruit without Chopping Down the Tree
 Implementation of Future Transportation Technologies: Getting Beyond the Low Hanging Fruit without Chopping Down the Tree Balancing Business Needs with Societal Change Paradigm Shifts Consumer Values Global
PEV Charging Infrastructure: What can we learn from the literature?
 PEV Charging Infrastructure: What can we learn from the literature? David L. Greene Howard H. Baker, Jr. Center for Public Policy The University of Tennessee A presentation to the STEPS Workshop: Critical
Perspectives on Vehicle Technology and Market Trends
 Perspectives on Vehicle Technology and Market Trends Mike Hartrick Sr. Regulatory Planning Engineer, FCA US LLC UC Davis STEPS Workshop: Achieving Targets Through 2030 - Davis, CA Customer Acceptance and
Funding Scenario Descriptions & Performance
 Funding Scenario Descriptions & Performance These scenarios were developed based on direction set by the Task Force at previous meetings. They represent approaches for funding to further Task Force discussion
Economic Development Benefits of Plug-in Electric Vehicles in Massachusetts. Al Morrissey - National Grid REMI Users Conference 2017 October 25, 2017
 Economic Development Benefits of Plug-in Electric Vehicles in Massachusetts Al Morrissey - National Grid REMI Users Conference 2017 October 25, 2017 National Grid US Operations 3.5 million electric distribution
Electric Vehicle Cost-Benefit Analyses
 Electric Vehicle Cost-Benefit Analyses Results of plug-in electric vehicle modeling in five Northeast & Mid-Atlantic states Quick Take With growing interest in the electrification of transportation in
Fueling Savings: Higher Fuel Economy Standards Result In Big Savings for Consumers
 Fueling Savings: Higher Fuel Economy Standards Result In Big Savings for Consumers Prepared for Consumers Union September 7, 2016 AUTHORS Tyler Comings Avi Allison Frank Ackerman, PhD 485 Massachusetts
Exhibit to Agenda Item #1a
 Exhibit to Agenda Item #1a Board Strategic Development Committee Meeting and Special SMUD Board of Directors Meeting Tuesday, February 13, 2018, scheduled to begin at 5:30 p.m. Customer Service Center,
The Hybrid and Electric Vehicles Manufacturing
 Photo courtesy Toyota Motor Sales USA Inc. According to Toyota, as of March 2013, the company had sold more than 5 million hybrid vehicles worldwide. Two million of these units were sold in the US. What
LEGAL STATEMENT 1 / 2018 NAVIGANT CONSULTING, INC. ALL RIGHTS RESERVED
 LEGAL STATEMENT The purpose of the information in this presentation is to guide ICA programs and provide members with information to make independent business decisions. 1 ANTITRUST GUIDELINES Antitrust
California Feebate: Revenue Neutral Approach to Support Transition Towards More Energy Efficient Vehicles
 California Feebate: Revenue Neutral Approach to Support Transition Towards More Energy Efficient Vehicles A Research Report from the University of California Institute of Transportation Studies Alan Jenn,
Opportunities for Reducing Oil Demand for Transportation
 M I T Opportunities for Reducing Oil Demand for Transportation John B. Heywood Sun Jae Professor of Mechanical Engineering Director, Sloan Automotive Laboratory M.I.T. NRC Workshop on Trends in Oil Supply
Grid Services From Plug-In Hybrid Electric Vehicles: A Key To Economic Viability?
 Grid Services From Plug-In Hybrid Electric Vehicles: A Key To Economic Viability? Paul Denholm (National Renewable Energy Laboratory; Golden, Colorado, USA); paul_denholm@nrel.gov; Steven E. Letendre (Green
Electric Vehicles and State Funds
 Electric s and State Funds Current Contributions in Massachusetts and Long-Term Solutions to Transportation Funding March 2018 Overview Electric vehicles are a practical, commercially available option
The Electrification Coalition
 The Electrification Coalition Revolutionizing Transportation and Achieving Energy Security The Problem Oil dependence weakens our national security, threatens our economy, and creates environmental challenges.
Transitioning to low carbon / low fossil fuels and energy sources for road transport
 Transitioning to low carbon / low fossil fuels and energy sources for road transport FUELSEUROPE / BULGARIAN PETROLEUM AND GAS ASSOCIATION (BPGA) CONFERENCE SOFIA, 18 APRIL 2018 Dr Paul Greening Director,
Global EV Outlook 2017 Two million electric vehicles, and counting
 Global EV Outlook 217 Two million electric vehicles, and counting Pierpaolo Cazzola IEA Launch of Chile s electro-mobility strategy Santiago, 13 December 217 Electric Vehicles Initiative (EVI) Government-to-government
A CO2-fund for the transport industry: The case of Norway
 Summary: A CO2-fund for the transport industry: The case of Norway TØI Report 1479/2016 Author(s): Inger Beate Hovi and Daniel Ruben Pinchasik Oslo 2016, 37 pages Norwegian language Heavy transport makes
EV, fuel cells and biofuels competitors or partners?
 EV, fuel cells and biofuels competitors or partners? Presentation to the Institute of Engineering and Technology 16 th November 2011 Greg Archer, Managing Director, Low Carbon Vehicle Partnership LowCVP
May 1, SUBJECT: Demand Forecasting and the Transportation Sector
 James Yost Chair Idaho W. Bill Booth Idaho Guy Norman Washington Tom Karier Washington Jennifer Anders Vice Chair Montana Tim Baker Montana Ted Ferrioli Oregon Richard Devlin Oregon May 1, 2018 MEMORANDUM
Opportunities for Reducing Transportation s Petroleum Use and Greenhouse Gas Emissions
 Opportunities for Reducing Transportation s Petroleum Use and Greenhouse Gas Emissions John B. Heywood Professor of Mechanical Engineering Director, Sloan Automotive Laboratory M.I.T. Transportation @
Electric mobility Status, policies and prospects. Clean Transport Forum - 22 September 2016, Bogotá Marine Gorner, International Energy Agency
 Electric mobility Status, policies and prospects Clean Transport Forum - 22 September 216, Bogotá Marine Gorner, International Energy Agency Well to wheel GHG emissions (Gt CO₂) GHG emissions (Gt CO₂)
H 2. State-of-the-World Fuel Economy. Paris, 11 June 2015
 LEW FULTON UC DAVIS State-of-the-World Fuel Economy Paris, 11 June 2015 Dr. Lewis Fulton, STEPS3 Program, Institute of Transportation Studies University of California, Davis H 2 www.steps.ucdavis.edu Typical
Index Long term vision Transport sector in the big picture Cost effectiveness of low carbon technologies investment Sales mix in the coming decades Sh
 Transport Future Workshop 2 nd Workshop for Automobile and Energy CO2 emission reduction from light duty vehicles by 2050: long term vision for short term actions François Cuenot International Energy Agency
POLICIES THAT REDUCE OUR DEPENDENCE ON OIL. Carol Lee Rawn Ceres November 2013
 POLICIES THAT REDUCE OUR DEPENDENCE ON OIL Carol Lee Rawn Ceres November 2013 THE CERES NETWORK Ceres is an advocate for sustainability leadership, mobilizing investors and business to build a thriving,
A portfolio of power-trains for Europe: a fact-based analysis
 A portfolio of power-trains for Europe: a fact-based analysis Fuel Cells and Hydrogen Joint Undertaking 3rd Stakeholders General Assembly Brussels, November 9, 21 Dr. Martin Linder, McKinsey & Company
High Pressure Fuel Processing in Regenerative Fuel Cells
 High Pressure Fuel Processing in Regenerative Fuel Cells G. J. Suppes, J. F. White, and Kiran Yerrakondreddygari Department of Chemical Engineering University of Missouri-Columbia Columbia, MO 65203 Abstract
Alternative and Renewable Fuel and Vehicle Technology Program. Advisory Committee Meeting
 Alternative and Renewable Fuel and Vehicle Technology Program Advisory Committee Meeting December 4, 2012 California Energy Commission Hearing Room A 1 Meeting Agenda 10:00 Introductions and Opening Remarks
Consumer Choice Modeling
 Consumer Choice Modeling David S. Bunch Graduate School of Management, UC Davis with Sonia Yeh, Chris Yang, Kalai Ramea (ITS Davis) 1 Motivation for Focusing on Consumer Choice Modeling Ongoing general
Accelerating electric vehicle deployment and support policies
 Global Climate Action Agenda: Transport Action Event COP 22, Marrakech, Morocco 12 November 2016 Accelerating electric vehicle deployment and support policies Kamel Ben Naceur Director Directorate of Sustainability,
California Transportation Electrification and the ZEV Mandate. Analisa Bevan Assistant Division Chief, ECARS November 2016
 California Transportation Electrification and the ZEV Mandate Analisa Bevan Assistant Division Chief, ECARS November 2016 1 Air Quality Challenges in California Need for Strong Transportation Measures
H 2. State of the World Fuel Economy. Paris, 11 June 2015
 State of the World Fuel Economy Paris, 11 June 2015 Dr. Lewis Fulton, STEPS3 Program, Institute of Transportation Studies University of California, Davis H 2 www.steps.ucdavis.edu Typical national objectives
Aging of the light vehicle fleet May 2011
 Aging of the light vehicle fleet May 211 1 The Scope At an average age of 12.7 years in 21, New Zealand has one of the oldest light vehicle fleets in the developed world. This report looks at some of the
Electric Vehicles and EV Infrastructure Municipal Electric Power Association
 Electric Vehicles and EV Infrastructure Municipal Electric Power Association Alleyn Harned Virginia Clean Cities May 26, 2011 Clean Cities / 1 The Opportunity of EVs Those communities who actively prepare
3. TECHNOLOGIES FOR MEETING ZEV PROGRAM REQUIREMENTS AND PRODUCTION VOLUME ESTIMATES
 -21-3. TECHNOLOGIES FOR MEETING ZEV PROGRAM REQUIREMENTS AND PRODUCTION VOLUME ESTIMATES This section provides an overview of the vehicle technologies that auto manufacturers may use to meet the ZEV program
State s Progress on 1.5 Million Zero Emission Vehicles by 2025
 State s Progress on 1.5 Million Zero Emission Vehicles by 2025 The latest new vehicle sales data from California New Car Dealers Association shows Californians remain on track to exceed 2 million new light
Study Results Review For BPU EV Working Group January 21, 2018
 New Jersey EV Market Study Study Results Review For BPU EV Working Group January 21, 2018 Mark Warner Vice President Advanced Energy Solutions Gabel Associates Electric Vehicles: Why Now? 1914 Detroit
Direct Injection Ethanol Boosted Gasoline Engines: Biofuel Leveraging For Cost Effective Reduction of Oil Dependence and CO 2 Emissions
 Direct Injection Ethanol Boosted Gasoline Engines: Biofuel Leveraging For Cost Effective Reduction of Oil Dependence and CO 2 Emissions D.R. Cohn* L. Bromberg* J.B. Heywood Massachusetts Institute of Technology
Final Report. LED Streetlights Market Assessment Study
 Final Report LED Streetlights Market Assessment Study October 16, 2015 Final Report LED Streetlights Market Assessment Study October 16, 2015 Funded By: Prepared By: Research Into Action, Inc. www.researchintoaction.com
Transport An affordable transition to sustainable and secure energy for light vehicles in the UK
 An insights report by the Energy Technologies Institute Transport An affordable transition to sustainable and secure energy for light vehicles in the UK 02 03 Energy Technologies Institute www.eti.co.uk
Electric Vehicle Cost-Benefit Analysis. Plug-in Electric Vehicle Cost-Benefit Analysis: North Carolina
 Electric Vehicle Cost-Benefit Analysis Plug-in Electric Vehicle Cost-Benefit Analysis: North Carolina June 2018 Contents List of Figures... ii List of Tables... ii Executive Summary... ii Study Results...
Electric Vehicle Cost-Benefit Analysis. Plug-in Electric Vehicle Cost-Benefit Analysis: Ohio
 Electric Vehicle Cost-Benefit Analysis Plug-in Electric Vehicle Cost-Benefit Analysis: Ohio June 2018 Contents List of Figures... ii List of Tables... ii Executive Summary... ii Study Results... 1 Plug-in
Benefits of greener trucks and buses
 Rolling Smokestacks: Cleaning Up America s Trucks and Buses 31 C H A P T E R 4 Benefits of greener trucks and buses The truck market today is extremely diverse, ranging from garbage trucks that may travel
GEAR 2030 Working Group 1 Project Team 2 'Zero emission vehicles' DRAFT RECOMMENDATIONS
 GEAR 2030 Working Group 1 Project Team 2 'Zero emission vehicles' DRAFT RECOMMENDATIONS Introduction The EU Member States have committed to reducing greenhouse gas emissions by 80-95% by 2050 with an intermediate
California s Low Carbon Fuel Standard
 California s Low Carbon Fuel Standard Outlook and Opportunities Philip Sheehy, PhD EMA Annual Meeting September 27, 2013 0 Overview Introduction Basic Rules of the Game (a bit redundant with whatever Dan
Infraday: The Future of E-Mobility
 Infraday: The Future of E-Mobility Fabian Kley, Fraunhofer ISI October 9 th, 2009 Fraunhofer ISI is actively researching the field of e-mobility with focus on system analysis Fraunhofer ISI Current E-Mobility
Submission to Select Committee on Electric Vehicles - inquiry into the use and manufacture of electric vehicles in Australia
 31 July 2018 Senator Tim Storer Department of the Senate PO Box 6100 Parliament House Canberra ACT 2600 Dear Senator Storer, RE: Submission to Select Committee on Electric Vehicles - inquiry into the use
Plug-in Hybrid Vehicles
 Plug-in Hybrid Vehicles Bob Graham Electric Power Research Institute Download EPRI Journal www.epri.com 1 Plug-in Hybrid Vehicles Attracting Attention at the Nation s Highest Level President Bush February
U.S. Light-Duty Vehicle GHG and CAFE Standards
 Policy Update Number 7 April 9, 2010 U.S. Light-Duty Vehicle GHG and CAFE Standards Final Rule Summary On April 1, 2010, U.S. Environmental Protection Agency (EPA) and U.S. Department of Transportation
Michigan Public Service Commission Electric Vehicle Pilot Discussion
 Michigan Public Service Commission Electric Vehicle Pilot Discussion Brett Smith Assistant Director, Manufacturing & Engineering Technology Valerie Sathe Brugeman Senior Project Manager, Transportation
The Electrification Futures Study: Transportation Electrification
 The Electrification Futures Study: Transportation Electrification Paige Jadun Council of State Governments National Conference December 7, 2018 nrel.gov/efs The Electrification Futures Study Technology
Influences on the market for low carbon vehicles
 Influences on the market for low carbon vehicles 2020-30 Alex Stewart Senior Consultant Element Energy Low CVP conference 2011 1 About Element Energy London FC bus, launched December 2010 Riversimple H2
Future Funding The sustainability of current transport revenue tools model and report November 2014
 Future Funding The sustainability of current transport revenue tools model and report November 214 Ensuring our transport system helps New Zealand thrive Future Funding: The sustainability of current transport
Electric Vehicle Charge Ready Program
 Electric Vehicle Charge Ready Program September 20, 2015 1 Agenda About SCE The Charge Ready Initiative Depreciation Proposals of The Charge Ready Initiative Challenges Outcomes September 20, 2015 2 About
Consumers, Vehicles and Energy Integration (CVEI) project
 project") Consumers, Vehicles and Energy Integration (CVEI) project Dr Stephen Skippon, Chief Technologist September 2016 Project aims To address the challenges involved in transitioning to a secure and sustainable
Consumers, Vehicles and Energy Integration (CVEI) project Dr Stephen Skippon, Chief Technologist September 2016 Project aims To address the challenges involved in transitioning to a secure and sustainable
Future Fuels. John Eichberger Executive Director
 Future Fuels John Eichberger Executive Director Fuels Institute jeichberger@fuelsinstitute.org @eichbergerjohn @fuelsinstitute Fuels Institute Board of Advisors Disclaimer: The opinions and views expressed
climate change policy partnership
 climate change policy partnership Plug-in and regular hybrids: A national and regional comparison of costs and CO 2 emissions November 2008 Eric Williams CCPP 08-04 Nicholas School of the Environment at
Contents. Figures. iii
 Contents Executive Summary... 1 Introduction... 2 Objective... 2 Approach... 2 Sizing of Fuel Cell Electric Vehicles... 3 Assumptions... 5 Sizing Results... 7 Results: Midsize FC HEV and FC PHEV... 8 Contribution
A Techno-Economic Analysis of BEVs with Fast Charging Infrastructure. Jeremy Neubauer Ahmad Pesaran
 A Techno-Economic Analysis of BEVs with Fast Charging Infrastructure Jeremy Neubauer (jeremy.neubauer@nrel.gov) Ahmad Pesaran Sponsored by DOE VTO Brian Cunningham David Howell NREL is a national laboratory
Department of Energy Analyses in Support of the EPA Evaluation of Waivers of the Renewable Fuel Standard November 2012
 Department of Energy Analyses in Support of the EPA Evaluation of Waivers of the Renewable Fuel Standard November 2012 Ethanol Demand Curve for 2012 and 2013 In support of EPA analyses of the 2012 RFS
ON-ROAD FUEL ECONOMY OF VEHICLES
 SWT-2017-5 MARCH 2017 ON-ROAD FUEL ECONOMY OF VEHICLES IN THE UNITED STATES: 1923-2015 MICHAEL SIVAK BRANDON SCHOETTLE SUSTAINABLE WORLDWIDE TRANSPORTATION ON-ROAD FUEL ECONOMY OF VEHICLES IN THE UNITED
EVSE Impact on Facility Energy Use and Costs
 EVSE Impact on Facility Energy Use and Costs Bhaskaran Gopalakrishnan Professor and Director of the Industrial Assessment Center Department of IMSE, Statler College West Virginia University Need to understand
September 21, Introduction. Environmental Protection Agency ( EPA ), National Highway Traffic Safety
, National Highway Traffic Safety") September 21, 2016 Environmental Protection Agency (EPA) National Highway Traffic Safety Administration (NHTSA) California Air Resources Board (CARB) Submitted via: www.regulations.gov and http://www.arb.ca.gov/lispub/comm2/bcsubform.php?listname=drafttar2016-ws
September 21, 2016 Environmental Protection Agency (EPA) National Highway Traffic Safety Administration (NHTSA) California Air Resources Board (CARB) Submitted via: www.regulations.gov and http://www.arb.ca.gov/lispub/comm2/bcsubform.php?listname=drafttar2016-ws
Hydrogen & Fuel cells From current reality to 2025 and beyond
 Hydrogen & Fuel cells From current reality to 2025 and beyond Future Powertrain Conference Adam Chase, Director 1 st March 2017 Strategy Energy Sustainability E4tech perspective International consulting
Discussing the Ratepayer Benefits of EVs On the Electrical Grid
 Discussing the Ratepayer Benefits of EVs On the Electrical Grid Webinar Series on Transportation Electrification Sponsored by Edison Electric Institute and the U.S. Department of Energy Ed Kjaer, CMK Consulting
How much oil are electric vehicles displacing?
 How much oil are electric vehicles displacing? Aleksandra Rybczynska March 07, 2017 Executive summary EV s influence on global gasoline and diesel consumption is small but increasing quickly. This short
Driving the Market for Plug-in Vehicles - Understanding Financial Purchase Incentives
 Driving the Market for Plug-in Vehicles - Understanding Financial Purchase Incentives Scott Hardman, Tom Turrentine, Jonn Axsen, Dahlia Garas, Suzanne Goldberg, Patrick Jochem, Sten Karlsson, Mike Nicholas,
Transitioning to zero-emission heavy-duty freight vehicles
 Transitioning to zero-emission heavy-duty freight vehicles A system perspective on zero-emission heavy-duty road freight transport and challenges for a successful market entry Florian Hacker Brussels,
Electric Vehicles in China:
 Electric Vehicles in China: Technology Trajectories, Policies, and lessons Chen Ling, Doris Fischer, Shen Qunhong, Yang Wenhui Presentation for the final conference in Bonn April 7-8, 2014 Outline Research
BENEFITS OF RECENT IMPROVEMENTS IN VEHICLE FUEL ECONOMY
 UMTRI-2014-28 OCTOBER 2014 BENEFITS OF RECENT IMPROVEMENTS IN VEHICLE FUEL ECONOMY MICHAEL SIVAK BRANDON SCHOETTLE BENEFITS OF RECENT IMPROVEMENTS IN VEHICLE FUEL ECONOMY Michael Sivak Brandon Schoettle
Powertrain Technologies and Energy Carriers for Future Transport - a sectoral portfolio approach
 Powertrain Technologies and Energy Carriers for Future Transport - a sectoral portfolio approach Konstantinos Boulouchos* Institute of Energy Technology, ETH Zürich & Swiss Competence Center for Energy
TECHNICAL WHITE PAPER
 TECHNICAL WHITE PAPER Chargers Integral to PHEV Success 1. ABSTRACT... 2 2. PLUG-IN HYBRIDS DEFINED... 2 3. PLUG-IN HYBRIDS GAIN MOMENTUM... 2 4. EARLY DELTA-Q SUPPORT FOR PHEV DEVELOPMENT... 2 5. PLUG-IN
Improving Engine Efficiency and Fuels: An Overview. John B. Heywood. Massachusetts Institute of Technology
 Improving Engine Efficiency and Fuels: An Overview John B. Heywood Sun JaeProfessor of Engineering, Emeritus Massachusetts Institute of Technology Presentation at CRC Advanced Fuel and Engine Efficiency
NASEO 2015 Central Regional Meeting. Vision Fleet June 12, 2015
 NASEO 2015 Central Regional Meeting Vision Fleet June 12, 2015 Agenda Vision Fleet Overview Indy Project Overview Analytics to Improve Performance 1 Vision Fleet at a Glance Our Mission & Value: Enable
HEV, EV, Diesel Technology ; Indian trends and Role of Government for supporting
 HEV, EV, Diesel Technology ; Indian trends and Role of Government for supporting Presented: 6 th JAMA SIAM meeting 30 th. November 2011 Tokyo 30th November 2011 Tokyo Encouraging Electric Mobility and
A multi-model approach: international electric vehicle adoption
 A multi-model approach: international electric vehicle adoption Alan Jenn Postdoctoral Researcher Gil Tal Professional Researcher Lew Fulton STEPS Director Sustainable Transportation Energy Pathways Institute
WHEN ARE FUEL CELLS COMPETITIVE? Hans Pohl, Viktoria Swedish ICT AB Bengt Ridell, SWECO AB Annika Carlson, KTH Göran Lindbergh, KTH
 WHEN ARE FUEL CELLS COMPETITIVE? Hans Pohl, Viktoria Swedish ICT AB Bengt Ridell, SWECO AB Annika Carlson, KTH Göran Lindbergh, KTH SCOPE OF STUDY WP1 policy relating to fuel cell vehicles (FCVs) Emission
U.S. Fuel Economy and Fuels Regulations and Outlook
 U.S. Fuel Economy and Fuels Regulations and Outlook An Industry Perspective Mike Hartrick Fuels2018 May 23, 2018 Topics Market Perspective Regulatory Perspective What Could Changes in Fuel Economy Regulations
California Low Emission Truck Policies and Plans
 1 California Low Emission Truck Policies and Plans STEPS Truck Choice Workshop Davis, California May 22, 2017 Tony Brasil, Chief Transportation and Clean Technology Branch Outline California s major challenges
Economics and Barriers to Solar Photovoltaic Applications in Barbados
 Economics and Barriers to Solar Photovoltaic Applications in Barbados Roland R Clarke PhD Clarke Energy Associates www.clarkeenergy@aol.com clarkeenergy@aol.com Presented to Alternative Energy: Pathways
Summit County Greenhouse Gas Emissions Summary, 2017
 Summit County Greenhouse Gas Emissions Summary, 2017 In 2018, Summit County completed its first greenhouse gas inventory to better understand its emissions profile and to give insight to policies and programs
CITY OF MINNEAPOLIS GREEN FLEET POLICY
 CITY OF MINNEAPOLIS GREEN FLEET POLICY TABLE OF CONTENTS I. Introduction Purpose & Objectives Oversight: The Green Fleet Team II. Establishing a Baseline for Inventory III. Implementation Strategies Optimize
Executive Summary. Light-Duty Automotive Technology and Fuel Economy Trends: 1975 through EPA420-S and Air Quality July 2006
 Office of Transportation EPA420-S-06-003 and Air Quality July 2006 Light-Duty Automotive Technology and Fuel Economy Trends: 1975 through 2006 Executive Summary EPA420-S-06-003 July 2006 Light-Duty Automotive
Overview of Global Fuel Economy Policies
 Overview of Global Fuel Economy Policies Zifei Yang Researcher 2018 APCAP Joint Forum and Clean Air Week Theme: Solutions Landscape for Clean Air Bangkok, Mar 20, 2018 What is ICCT? ICCT is an independent
PECC Seminar Perth. Clean transportation and carbon-free electric vehicles, short and long term vision
 PECC Seminar Perth Clean transportation and carbon-free electric vehicles, short and long term vision Henri Boyé, French Ministry of Sustainable Development Transport Stakes : The most GHG emitting sector
THE ELECTRIC VEHICLE REVOLUTION AND ITS IMPACT ON PEAK OIL DEMAND
 THE ELECTRIC VEHICLE REVOLUTION AND ITS IMPACT ON PEAK OIL DEMAND INDONESIAN GAS SOCIETY JAKARTA 20 TH NOVEMBER JUNE 2016 - SELECTED SLIDES JON FREDRIK MÜLLER PARTNER HEAD OF CONSULTING ASIA-PACIFIC When
FutureMetrics LLC. 8 Airport Road Bethel, ME 04217, USA. Cheap Natural Gas will be Good for the Wood-to-Energy Sector!
 FutureMetrics LLC 8 Airport Road Bethel, ME 04217, USA Cheap Natural Gas will be Good for the Wood-to-Energy Sector! January 13, 2013 By Dr. William Strauss, FutureMetrics It is not uncommon to hear that
EV - Smart Grid Integration. March 14, 2012
 EV - Smart Grid Integration March 14, 2012 If Thomas Edison were here today 1 Thomas Edison, circa 1910 with his Bailey Electric vehicle. ??? 2 EVs by the Numbers 3 10.6% of new vehicle sales expected
When to Expect Robust
 EV vs ICE Vehicles: When to Expect Robust Competition? VYGON Consulting - March 2016 Authors Grigory VYGON Managing Director, Ph.D. Econ info@vygon.consulting Maria BELOVA Senior Analyst, Ph.D. Econ M.Belova@vygon.consulting
What the Future Holds for Automotive Powertrains
 What the Future Holds for Automotive Powertrains Bob Wimmer Director, Energy & Environmental Research Center for Energy Economics December 8, 2016 https://vimeo.com/143250488 1 Outline How did we get here
Electric Vehicle Cost- Benefit Analysis. Plug-in Electric Vehicle Cost-Benefit Analysis: Maryland
 Electric Vehicle Cost- Benefit Analysis Plug-in Electric Vehicle Cost-Benefit Analysis: Maryland December 2016 Acknowledgements Authors: Prepared By: For Submission to: Dana Lowell, Brian Jones, and David
Future of Mobility and Role of E-mobility for Future Sustainable Transport. Petr Dolejší Director Mobility and Sustainable Transport
 Future of Mobility and Role of E-mobility for Future Sustainable Transport Petr Dolejší Director Mobility and Sustainable Transport ACEA MEMBERS 3 KEY FIGURES ABOUT THE INDUSTRY 12.1 million direct and
National Engineering 2017: SMART CAR 4.0. Ninnart Chaithirapinyo. Toyota Motor Thailand Co., Ltd. November 16, 2017
 National Engineering 2017: SMART CAR 4.0 Ninnart Chaithirapinyo Toyota Motor Thailand Co., Ltd. November 16, 2017 MAJOR GLOBAL CHALLENGES CLIMATE CHANGE is no longer a far-off problem; It is happening
CHARGING AHEAD: UNDERSTANDING THE ELECTRIC-VEHICLE INFRASTRUCTURE CHALLENGE
 Hauke Engel, Russell Hensley, Stefan Knupfer, Shivika Sahdev CHARGING AHEAD: UNDERSTANDING THE ELECTRIC-VEHICLE INFRASTRUCTURE CHALLENGE August 08 Access to efficient charging could become a roadblock
Fuel Economy State of the World 2014: The World is Shifting into Gear on Fuel Economy
 Fuel Economy State of the World 2014: The World is Shifting into Gear on Fuel Economy BAQ Integrated Conference of BAQ 2014 and Intergovernmental 8th Regional EST Forum in Asia Session Topic: Doubling