Attachment 1. Saskatoon Transit Annual Report
|
|
|
- Ethelbert Harrison
- 6 years ago
- Views:
Transcription


1 Attachment 1 Saskatoon Transit 2015 Annual Report
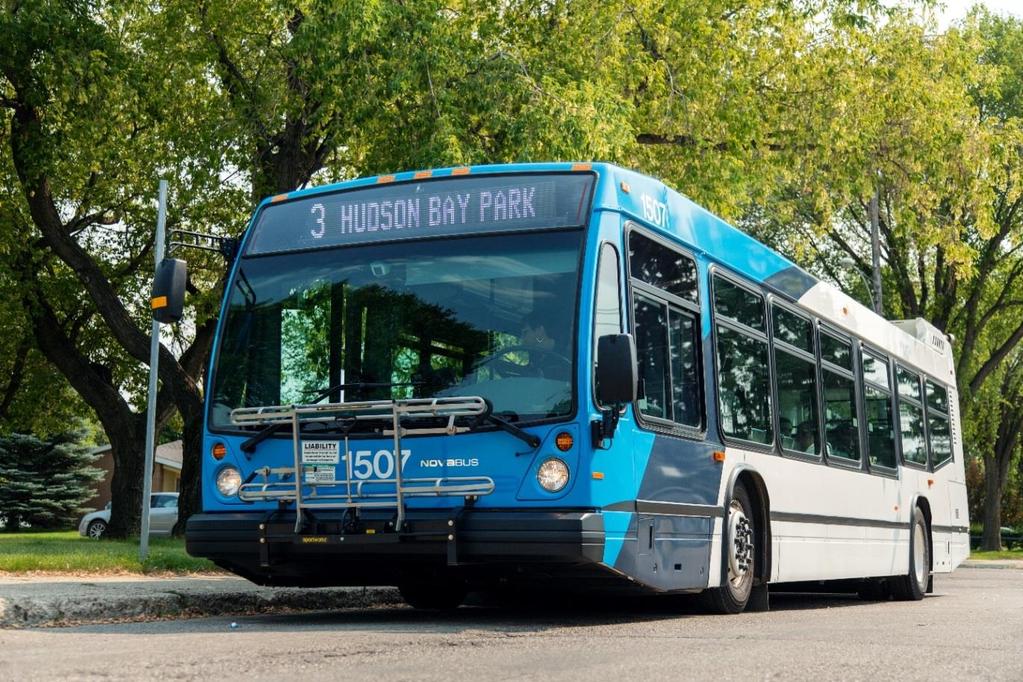
2 INTRODUCTION Public Transit services in Saskatoon began on January 1, 1913 with the establishment of the Saskatoon Municipal Railway. Approximately 5,200 people used streetcars that first day of service. Over the years, the types of vehicles changed as did the name, eventually becoming Saskatoon Transit. In July 2004, the next big chapter started when Access Transit was established as the Demand Response section of Saskatoon Transit. Access Transit is meant to provide service to those who are unable to use regular transit with safety and dignity. In 2013, Saskatoon Transit celebrated 100 years of making connections within the community and continues to do so today. In 2015, ridership was approximately 8.5 Million Fixed Route or Conventional Transit riders and 132,000 Demand Response or Access Transit trips. To provide that level of service, Saskatoon Transit used the following: Terminals located at: Confederation Mall; Lawson Heights Mall; Centre Mall; Place Riel at the University of Saskatchewan; 23 rd Street Transit Mall; and Market Mall. A fleet of 184 buses: 158 Serving Fixed Route demands: 142 conventional 40-foot diesel buses, of which there are still 39 High floor; 10 articulating low floor 62-foot diesel buses; 6 mid-sized low floor 26-foot diesel buses; and 26 mid-sized para transit diesel buses providing Access Transit Demand Response services. A staff complement of 399 employees, working 365 days to provide service to the City of Saskatoon. Conventional Transit is a Fixed Route service that operates 22 bus routes along approximately 276 kilometers of streets with 1,668 bus stops. During peak hours there are 100 buses on various routes throughout the city resulting in a spare ratio of 58%. Transportation and Utilities Saskatoon Transit Page 1


3 In 2015, Saskatoon Transit contracted MTB Transit solutions to perform structural refurbishments to 4 buses in its articulating fleet will see the implementation of a component of the Fleet Renewal Strategy, that component being the refurbishment plan. Saskatoon Transit will begin the process of refurbishing ten buses in its conventional 40 foot fleet every year, with an expectation of extending the life of a bus by 6 to 9 years. Access Transit is an accessible door-to-door Demand Response service operated for citizens who, by reason of a disability, are unable to use Conventional Transit with safety and/or dignity. Unlike Conventional Transit, Access Transit does not have predetermined routes so trip booking and scheduling decisions are strategically made to allow as many trips as possible, while staying within trip time and resource availability parameters. Trip booking requests are on a first-come-firstserved basis and dependent on the present limited fleet size. Access Transit is equipped with 26 wheel chair lift buses. During peak hours there are 19 on the road resulting in a spare ratio of 36%. OUR CUSTOMER Customer Satisfaction and Complaints: Our goal is to provide consistent, timely, friendly, and professional services to customers where they feel they have received valuable service that is fair and equitable. The City of Saskatoon s 2015 Civic Services Survey results demonstrate that public transportation is important to residents of Saskatoon. A score of 10 means excellent and 5 means average. The following chart tracks customer satisfaction for public transportation, buses and routes. Public satisfaction decreased by 0.4% between 2014 and Saskatoon Transit believes the underlying issues are increased traffic congestion and higher passenger loads during peak operating periods. Transportation and Utilities Saskatoon Transit Page 2
4 Customer Satisfaction Figure 1: Customer Satisfaction Saskatoon Transit received 982 complaints in 2015, which is 247 less than both 2013 and Overall complaints were primarily about operators and the buses arriving early, late, or driving by without stopping. 1,400 1,200 1, Transit Customer Complaints Operator Driving Early/late/missed Other Total ,261 1, Figure 2: Transit Customer Complaints In 2015, Saskatoon Transit received 52 commendations from the citizens which is 1 more than in The majority of Transit drivers provide excellent customer service, and complaints are dealt with directly with the individuals affected. Transportation and Utilities Saskatoon Transit Page 3
5 Transit Commendations Figure 3: Transit Commendations Competitive Fares: Saskatoon Transit offers discounted fares for low-income residents, seniors, elementary, high school and post-secondary students. Fares accepted include cash, tickets or one of several passes that allow unlimited monthly rides (i.e. Adult Pass and High School Student Pass). Senior citizens may purchase passes for periods of one month, three months, six months and one year. Postsecondary students may purchase a semester pass that allows unlimited rides. All fare types are accepted on both Access Transit and Conventional Transit buses. Adult fares on Saskatoon Transit are compared to other similar sized cities in the following charts. Of note - Regina does not have a senior monthly fare; they currently only offer semi-annual and annual senior passes. $4.50 $4.00 $3.50 $3.00 $2.50 $2.00 $1.50 $1.00 $0.50 $ Adult Fares Cash Ticket Saskatoon $3.10 $2.40 Regina $2.75 $2.45 Longueuil $3.25 $3.08 Oakville $3.50 $2.80 Gatineau $3.90 $ Monthly Passes $ $ $80.00 $60.00 $40.00 $20.00 $0.00 Adult Seniors Saskatoon $81.00 $27.00 Regina $75.00 Longueuil $92.50 $55.50 Oakville $ $50.00 Gatineau $92.00 $39.50 Figure 4: 2015 Adult Fares and Monthly Passes Transportation and Utilities Saskatoon Transit Page 4

6 Conventional Transit: Between 2014 and 2015, ridership increased by 5.3% (using formula-based ridership) and 4.4% (using electronic ridership). Transit ridership is distributed between the following categories: seniors, cash/ticket, month/day pass, discounted pass, and post-secondary pass. Currently the top three categories of transit users include monthly/day pass (29%), post-secondary (22%), and discounted pass (16%) Ridership Distribution - Electronic Ridership Post Secondary Pass 22% Seniors 6% Cash 13% Tickets 14% Discounted Pass 16% Month/Day Pass 29% Figure 5: 2015 Ridership Distribution Total Rides for 2015 are 8,573,054 which is an increase of 4.4% compared to Transit s formula based (calculated) ridership for 2015 was 12,216,188 which is 3,643,134 rides more than actual ridership information provided by the automated fare box system. Transportation and Utilities Saskatoon Transit Page 5
7 Rides Saskatoon Transit 2015 Annual Report Transit Ridership 14,000,000 12,000,000 10,000,000 8,000,000 6,000,000 4,000,000 2,000,000 0 Calculated 12,329,979 12,770,458 13,188,586 11,596,982 12,216,188 Electronic 8,972,666 9,364,010 9,406,908 8,215,330 8,573,054 Figure 6: 5 Year Transit Ridership Trend A recent report from the Canadian Urban Transit Association (CUTA) showed 2014 passengers per service hour of 41.50, 18.43, and respectively for Longueil, Regina, Gatineau and Oakville (peer communities). Saskatoon Transit s passenger per service hour numbers for the 5 year period ending 2015 is shown below: Conventional Transit: Passengers per Vehicle Hour Calculated Ridership Electronic Ridership Figure 7: Passengers per Vehicle Hour Transportation and Utilities Saskatoon Transit Page 6


8 Transit will continue to focus on increasing ridership by providing strong customer service and providing a service that is safe, convenient, efficient and affordable. These initiatives support the Strategic Goal of Moving Around and the Growth Plan to 500,000. The intention is to provide Transit that is considered a viable option as part of the overall transportation network. Access Transit: 31% Ambulatory 69% Non Ambulatory There was an approximate 12% decrease in the number of registered active customers in 2015 over Some of this decrease could be attributed to a new registration process in conjunction with the new ride trainer program. This program allows for citizens that don t qualify for Access Transit to receive detailed instructions, and sometimes personal demonstrations, on how to use Conventional Transit. The goal is to ensure that Access Transit capacity is being utilized by the citizens who require the service while still promoting Conventional Transit service. Access Transit categorizes its bookings into two groups: Ambulatory (customers who do not require a wheelchair or scooter for mobility), and Non-Ambulatory (customers who require a mobility device such as a wheelchair or scooter). The number of Ambulatory customer trips has been slowly increasing over the years and in 2015 we observed a 2% increase in Non-Ambulatory customer trips. Access Transit Administration tracks the purpose for which customers use the service. Customer trip categories in 2015 Figure 8: Ambulatory vs Non-Ambulatory Ridership were relatively the same as previous years, with the exception of day program trips. That number increased to 7% in 2015 from 4% in 2014, which is both significant and alarming. Access Transit attributes this mostly to Sherbrooke Nursing Home and the Saskatchewan Abilities Council relying on Access Transit for an increasing number of their Day Programs. With current Capital and operating resources, Access Transit will not be able to continue absorbing increases of this type. This is one of the main reasons we are conducting a complete review of Access Transit to determine the best way forward when there is a 100% accessible fleet in The forecasted requirements for Access Transit services are increasing across the country as the population continues to age and rural users are increasingly relocating to the urban setting. Transportation and Utilities Saskatoon Transit Page 7


9 Trips Saskatoon Transit 2015 Annual Report Trip By Purpose Education, 2% Day Programs, 7% Dialysis, 6% Leisure, 20% Therapy, 13% Not Specified, 1% Work, 15% Medical, 15% Special Events, 1% Recreation, 1% Church, 7% Shopping, 13% Figure 9: Access Trip by Purpose A denial is a trip requested by a customer that cannot be accommodated. There are two types of denials: Customer Denials and Dispatch Denials. A Customer Denial is when a customer refuses the alternate trip time offered to them by a dispatcher, regardless of the proximity of time to the original request. A Dispatch Denial is a trip request that cannot be accommodated due to insufficient resources (insufficient run time or bus availability for that trip). Trip Denials: Customer vs. Dispatch 15,000 10,000 5,000 0 Customer Dispatch Figure 10: Access Trip Denials Transportation and Utilities Saskatoon Transit Page 8
10 The denial rate for 2015 was 9.16%, which is an increase of 0.96% over When comparing the average time frames for denials, there are subtle differences to be noted in the 9:00 am to 7:00 pm time frame. These fluctuations occur annually, however comparatively speaking; the 2015 denial time pattern is quite similar to To reduce denials, Access Transit will schedule and book the budgeted number of service hours according to the demand of the customers Denials by Time Comparison: 2015 vs Figure 11: Denials by Time vs 2015 Access Transit service demand is calculated by taking the sum of revenue trips (one-way trips from point A to B), plus the number of no-shows (customers who are absent at the pickup location when the bus arrives, thus wasting a trip). Therefore demand for service is the total amount of trips that could have been provided had all variables been optimal. In 2015, the total service demand for Access Transit decreased by 2.5% (3,515 trips). Changes to the registration process as well as the relatively mild winter of 2015 are contributing factors in this demand decrease. Previously, Access Transit Annual Reports have shown that there is a direct correlation between harsh weather conditions and increased service demand. Transportation and Utilities Saskatoon Transit Page 9
11 160, , , ,000 80,000 60,000 40,000 20,000 0 Annual Demand 144, , , , ,619 Figure 12: 5 Year Annual Demand Trends Access Transit experienced a 2.8% decrease in revenue trips compared to As boundaries for the City of Saskatoon continue to increase so does the area Access Transit provides service to. This service area increase, an increase in traffic congestion and the static size of the fleet contribute negatively to the total amount of revenue trips that Access Transit is able to provide. This year Access Transit Administration has had to take the step of slowing down the travel speed of the scheduling and booking software system to make the travel times and schedule more realistic, based on the actual road experience. Although productivity is still high, averaging 2.54 revenue trips per hour, this adjustment had the effect of reducing the revenue trips completed in 2015 by approximately 2.8% (3,659 trips) over 2014 numbers. Despite the various challenges Access Transit operators face on the road, they were still able to maintain an average of 91% on-time performance for Revenue Trips vs Denials: 5 Year Comparison , , , , ,258 10,729 11,083 12,399 11,493 11,669 Total Rev Trips Total Denials Figure 13: 5 Year Revenue Trips Vs Denials Comparison Transportation and Utilities Saskatoon Transit Page 10
12 Access Transit also provides service using an alternate delivery model. This alternate model calls upon the local Saskatoon taxi industry to assist with the provision of service, especially in the winter months when the demand for Access Transit service is the highest. Due to the finite capacity of the bus service the alternate service delivery model provides a flexible, cost effective tool to assist with seasonal demand fluctuations. There are however, limitations associated with this model. On occasion, when the demand for taxi service is also high, it can be just as challenging for Access Transit to acquire a taxi as it is for members of the general public. Access Transit used more taxies in 2015 than in the last 5 years in an effort to keep denials low and provide service for customers. Monthly Taxi Use Comparison: 2015 vs Jan Feb Mar Apr May Jun Jul Aug Sept Oct Nov Dec Taxi Rev Trips 2015 Taxi Rev Trips 2014 Figure 14: Monthly Taxi Use Comparison 2014 Vs 2015 OUR PEOPLE Transit services are provided to the residents of Saskatoon 365 days per year. The Transit team is made up of a diverse and skilled group of people including operators, customer service staff, administration staff, dispatchers, booking and scheduling clerks, planners, payroll employees, mechanics, utility and servicemen, accountants, driver trainers, supervisors and managers. Transit s team also includes support from Human Resources to assist in administering collective bargaining/labour related issues, recruitment and health and safety programs in the workplace. Administration and Finance, Facilities division provides support with building maintenance and repairs. All levels and classifications of employees are passionate about delivering a quality transit service to the community on a daily basis. Transportation and Utilities Saskatoon Transit Page 11

13 Number FTEs Saskatoon Transit 2015 Annual Report Transit s employee complement increased by 0.76% or 3.0 employees between 2011 and In comparison, Conventional Transit service hours increased by 1,170 or 0.3% in that same time period and the population has increased by 12%. Access transit had no change to service hours Saskatoon Transit Employees (FTEs) Admin Maintenance Operations Figure 15: Saskatoon Transit FTEs In 2015, Saskatoon Transit experienced 35 lost time incidents for a total of 800 lost time days. Lost time incident and lost time days have increased this year. Safety statistics are presented in the following charts, which show the lost time incidents and days by year as well as frequency rates (number of incidents or days per 200,000 hours worked). Figure 16: Lost Time Incidents Transportation and Utilities Saskatoon Transit Page 12
14 OUR FINANCES In 2015, Saskatoon Transit s service line operating budget was $44.8 million made up of $40.1 million for Conventional Transit and $4.7 million for Access Transit. The actual operating expenses for 2015 came in under budget at $43.2 million. The savings of $1.6 million (3.6%) on the operating expense were primarily related to a low fuel price and reduced fuel consumption due to a warmer winter. The budgeted funding sources for Saskatoon Transit s service line were $1.9 million through provincial funding for DCR Passes and Accessible Transit Grant and $14.9 million from Fares and other revenue sources with the remainder made up through the city contribution. The 2015 actual funding received was under budget by $1.6 million. The graphs below show a breakdown of Transit s 2015 funding sources: Conventional Transit City Contribution Province Fares & Other 34% 2% 64% Access Transit City Contribution Province Fares 5% 21% 74% Figure 17: Contribution Rates Transportation and Utilities Saskatoon Transit Page 13
15 Conventional Transit s city contribution in 2014 was 67% while in 2015 the contribution decreased by 2.7%. Access Transit s city contribution was 73% in 2014 and in 2015 the contribution increased by 0.7%. A report from CUTA showed 2014 Conventional Transit City Contributions for peer cities as 58%, 67%, 58%, and 66% respectively for Longueuil, Regina, Gatineau and Oakville. The $1.6 million in operating savings for the Transit service line was offset by lower than budgeted funding of $1.6 million. Therefore, 2015 actuals resulted in a variance of $17,000 from budgeted city contribution to actuals. Below is the summary of operating budgets for both Conventional Transit and Access Transit: 2015 Conventional Transit Operating Budget Budget Actual Variance % Fare Revenue $13,378 $12,072 $(1,307) -9.77% Charter & Advertising 1,259 1,072 (187) % City Contribution 24,613 24,564 (49) -0.20% Province of Sask (110) % Total Revenue $40,105 $38,453 ($1,652) -4.12% Transit Operations $20,427 $19,705 $ % Fuel, Lube & Oil 5,005 3,455 1, % Transit Maintenance 7,189 7,964 (774) 10.77% Building Maintenance 1,038 1, % City Hall Services % General & admin 2,853 2, % Capital (debt & reserve) 2,977 2, % Total expense $40,105 $38,453 $1, % Return on Investment $0 $0 $0 0% Figure 18: Conventional Transit Operating Budget An aging fleet, and the additional maintenance required to maintain an aging fleet, have resulted in increased operating costs. Fuel prices provided significant savings that, fortunately, resulted in the Conventional Transit average cost-perpassenger decreasing from $3.22 in 2014 to $3.15 for The most recent CUTA fact book shows the 2014 transit average cost per passenger at $4.50, $4.84, $6.40 and $7.31 respectively for Longueuil, Regina, Gatineau and Oakville. Transportation and Utilities Saskatoon Transit Page 14
16 The cost per passenger is calculated by taking total operating expenses and dividing them by ridership. The graph below shows the average based on calculated and electronic ridership. At present CUTA statistics only show calculated results as not all properties have electronic fareboxes. Transit Cost per Passenger $4.55 $4.49 $3.77 $3.93 $3.69 $3.22 $3.15 $2.74 $2.70 $2.80 Calculated Ridership Electronic Ridership Figure 19: Transit Cost per Passenger 2015 Access Transit Operating Budget Budget Actual Variance % City Contribution $3,413 $3,479 $66 2% Province of Sask grant (11) -1% Fares (22) -9% Total Revenue $4,654 $4,687 $33 1% Salaries & payroll $3,206 $3,397 ($191) 6% Fuel, lube, oil % AF -Facilities division % Maintenance equip & radio % Debt cost % Other expense % Transfer to reserves % Total expense $4,654 $4,687 ($33) 1% Return on Investment $0 $0 $0 Figure 20: Access Transit Operating Budget Transportation and Utilities Saskatoon Transit Page 15
17 In 2015, the average cost per trip for Access Transit was $ Through the Provincial Transit Assistance for People with Disabilities Program, Access Transit receives an operating grant based on available funding and ridership data. The 2015 operating grant amounted to $7.73 per trip such that the total cost per trip to the city was $ This cost is inclusive of all program expenditures and is calculated by dividing total expenditures by the total number of revenue trips less the operating grant. $38.00 $37.00 $36.00 $35.00 $34.00 $33.00 $32.00 $31.00 $30.00 $29.00 Access Transit Total Cost Per Trip $36.83 $35.24 $34.20 $32.21 $32.87 Figure 21: Access Transit Cost per Trip OUR WORK MOVING FORWARD Conventional Transit Meeting customer service expectations is integral to increasing ridership. To better fulfill these promises, Transit Operations is developing a continuous training program. Currently in the final stages of development and set to be implemented mid-2016, this program focuses on customer service delivery, situation de-escalation and driving for comfort and efficiency. The principles reinforced through this process will support the promises within the Passenger Pledge and provide Transit staff with the necessary tools to succeed. Slated for 2017, Saskatoon Transit will conduct a complete review of the Access Transit model with a goal of better integration with Conventional Transit. As we move toward a 100% accessible fleet in 2018, this review will allow for a more efficient use of resources in providing coverage throughout Saskatoon. Technology within the transit industry continues to provide opportunities for increased operational efficiencies, data analytics and customer tools. Saskatoon Transit is working with various vendors to improve its ability to report on performance measures as well as informational tools for customers. Products such as these allow administration to make more accurate service delivery Transportation and Utilities Saskatoon Transit Page 16
18 decisions while providing customers the ability to conveniently and reliably plan their trip. Internal processes and standard operating procedures continue to be refined and developed at Saskatoon Transit. Ongoing operational reviews will aid in the consistency of the service we provide, as well as create opportunities to more effectively serve the citizens of Saskatoon. Growth Plan to 500,000: In April of 2016, the Growth Plan to 500,000 was approved in principle by City Council. Transit forms an integral, coordinated part of this plan, in addition to Transportation Networks, Corridor Growth and Core Bridges. Part of the plan involves creation of two Bus Rapid Transit (BRT) routes over the next years, the Blue Line (North-South) and the Red Line (East-West). The plan calls for increased funding for Capital equipment and Service hours to support higher ridership in the Saskatoon area. 8th street Initiative: In an effort to better serve citizens and grow ridership, Saskatoon Transit is implementing a concept that reallocates resources in order to increase frequency along popular routes. Using principles found in the Growth Plan to 500,000, and aiming to provide a demonstration of the possibilities for a BRT System, an initiative has been developed for the summer of 2016 to provide service at 7.5 minute frequencies along 8 th Street during peak periods and 10 minute frequencies during the remainder of the weekday, with 30 minute frequencies during evenings, weekends, and statutory holidays. Other bus routes that serve the 8 th Street Corridor are being redesigned to increase service frequency along 8 th Street and increase ridership to downtown. Ongoing initiatives will be rolled out in 2017 and 2018 for 22 nd Street, Idylwyld and College Drive. Relocation to the Civic Operations Centre: The City of Saskatoon initiated a project to replace the current Caswell Hill bus barns with a new purpose built garage. The site of the new facility is called the Civic Operations Centre (COC) and is located on Valley Road near the current landfill. Eventually this site will have facilities for Public Works as well as other City departments, but at the moment only the transit facility and a snow storage site will be ready for occupancy in The garage will be the product of a Public Private Partnership, which will see the day-to-day operation of the facility itself managed by Cofely Services. The garage is capable of housing up to 224 Transportation and Utilities Saskatoon Transit Page 17
19 Transit buses and will meet LEED certifications. Transit operations will be moving to the new location in the first quarter of 2017, and the change of location should be seamless to the public. It will, however, be a culture change for staff moving to this new facility, having everything under one roof, sorting out how buses are routed into service, as well as when/where seat changes are completed. Customer Support and Engagement Section: In late 2015, approval was given to create a new section within Saskatoon Transit to provide improved customer focus and a customer advocacy role. A section manager was hired at the beginning of 2016 who will transition the Customer Service, Planning and ITS groups from their current sections into the new section. Engagement is high on the agenda for this new manager and there will be some close coordination between this section and the Communications Division throughout 2016, and as we move into the new COC. Passenger Pledge: In an effort to better serve our customer base and improve the transit experience, Saskatoon Transit is developing customer commitments that will be a public pledge to the kind of service delivered to transit customers. The development of this passenger pledge will be based on the CUTA model which has become industry best practice. CUTA has developed training programs and initiatives that have supported the development of customer commitments, which Saskatoon Transit will be utilizing to enhance customer service. The development of the passenger pledge will start to address the strategic goal outlined in the five-year transit plan of changing attitudes around transit and increasing Saskatoon Transit ridership. Access Transit: The current Mobile Data Terminal (MDT s) system is 10 years old, and consists of a 7.5 inch screen, a separate onboard computer, and a modem on each Access Transit bus. Over the course of the second quarter of 2016, the MDTs will be replaced with Samsung Tablets. They are a self-contained unit that can be purchased, repaired, replaced, and/or upgraded locally at a considerably lower price. This change will save time, precious operating dollars, and eliminate dependency on vendor specific hardware. Access Transit will also be working with IT and the vendor to install Interactive Voice Response (IVR) software into our Trapeze Pass software. IVR is a program that calls our customers, who have booked trips, the night before the actual trip to confirm it is still required and provides the customer with the opportunity to cancel the trip if not needed. The intent of this program is to reduce the amount of late cancellations and no-shows, which will in turn allow us to provide more revenue trips and utilize our resources more efficiently. Transportation and Utilities Saskatoon Transit Page 18
20 There will be public demonstrations of low floor bus service through our Ride Trainer project in late spring, summer, and early fall 2016, subject to more pleasant weather conditions. These on-site demonstrations will provide people in the community who are living with some type of disability the opportunity to learn more about low floor bus service and how it can be a great option or compliment to Access Transit, providing a wider range of travel options, thus promoting more spontaneity and an improved quality of life, in a calm, supportive learning environment. Access Transit will be receiving four replacement buses in These new buses are the last diesel units available in the cutaway body style. From 2017 and beyond, the cutaway style of bus will only be available with gas engines. Access Transit will be conducting a review of the current service model and vehicles used in 2017 to determine if there are better/different alternatives. There are diesel accessible vans in the market segment; however, interior space is quite limited. 30 foot conventional platforms will also be looked at and there are smaller models currently in the process of getting certification for the North American market, hopefully in the later part of The Access Transit bus replacement options for 2017 will be very interesting and somewhat challenging. Access Transit and Regina Paratransit provide similar services; however, the delivery models are quite different. Access Transit service provides lift van transportation that is all done in-house with some taxi augmentation while Regina Paratransit contracts out the operations and maintenance, similar to how it was done in Saskatoon prior to Access Transit Administration, Regina Paratransit Administration, and the Saskatchewan Human Rights Commission are currently working on a pilot project to track denials in a manner that is synonymous so that a true comparison can be made in order to work towards developing a provincial standard. Access Transit is an extremely valuable, essential service for people living with disabilities in our community. This service would not be possible without the financial support of the City of Saskatoon, the Provincial Government and of course those who ride it every day, the customer. Access Transit Administration will continue to be diligent in financial stewardship, implementing new incentives and/or technology that will increase efficiency to improve our service for our customers. With the current level of resources, Access Transit has peaked in terms of capacity. Although 2015 was a bit of an anomaly, it is expected that demand for Access Transit will increase in the coming years. As stated in previous Annual Reports, more resources (capital and operating) will be required to meet this demand. For the sake of comparison, Access Transit currently has 26 buses in the fleet, with 19 on the road during peak times. The population of Saskatoon is 262,900. The city of Regina has a population of 232,000 people, and they have Transportation and Utilities Saskatoon Transit Page 19
21 33 Paratransit buses, with 28 buses on the road during peak times. The current funding plan in place for Regina s Paratransit Service enables replacement of buses at, or around, 5 years of age. Access Transit is only able to replace buses at, or around, 7-10 years of age. Employees are Access Transit s greatest resource. The dedication to customers and service they provide is both inspirational and unparalleled and it is because of them that Access Transit has been able to develop into the successful highquality caring service it is. IN CONCLUSION Saskatoon Transit has had a challenging few years, highlighted by equipment, bargaining and personnel related issues. In 2015, a new leadership team was put in place with a main objective to move Saskatoon Transit past a number of these issues and rebuild relationships with employees, customers, and the City of Saskatoon in general. Saskatoon Transit currently provides the service that the City of Saskatoon mandates as part of the Official Community Plan, with some augmentation to provide peak hour frequency. The concept of coverage and frequency, as part of the same spectrum, was recently introduced through the Growth Plan to 500,000 as a concept that should be taken up by Saskatoon Transit in both service delivery and the planning of same when coordinating with Planning and Development and Transportation divisions. Saskatoon Transit is committed to doing better! One of the primary aims is to connect our community by providing professional, reliable, safe and affordable mobility options. Transportation and Utilities Saskatoon Transit Page 20
Attachment 1. Saskatoon Transit Annual Report
 Attachment 1 Saskatoon Transit 2016 Annual Report INTRODUCTION Public Transit services in Saskatoon began January 1, 1913, with the establishment of the Saskatoon Municipal Railway. Approximately, 5,200
2011 Saskatoon Transit Services Annual Report
 2011 Annual Report Saskatoon Transit provides a high quality of service for all citizens in our community, and is undertaking initiatives focused on building its ridership. Saskatoon, like most North American
2017 Annual Report. Attachment 1
 2017 Annual Report Attachment 1 INTRODUCTION On January 1, 1913 Saskatoon embarked on a journey into Public Transportation. The Saskatoon Municipal Railway began its service and had 5200 people ride streetcars
April 2010 April 2010 Presented by Alan Eirls
 April 2010 April 2010 Presented by Alan Eirls A Partnership Between the Coeur d Alene Tribe, the State of Idaho, the KMPO, and Kootenai County. Current System The Citylink system began on the Coeur d Alene
TRANSIT FEASIBILITY STUDY Town of Bradford West Gwillimbury
 TRANSIT FEASIBILITY STUDY Town of Bradford West Gwillimbury Open House Presentation January 19, 2012 Study Objectives Quantify the need for transit service in BWG Determine transit service priorities based
High Quality Service through Continuous Improvement st Quarter Performance Report
 High Quality Service through Continuous Improvement 6 st Quarter Performance Report TriMet Board Meeting May 5, 6 Quality is a never ending quest and continuous improvement is a never ending way to discover
Mississauga Transit 2009 Budget
 Mississauga Transit 2009 Budget Budget Committee Presentation December 2, 2008 Revenue Ridership Forecasted 2008 Total Rides Including transfers 11% growth in the last 24 months Transit Service Area Business
Strategic Plan Performance Metrics & Targets
 San Francisco Municipal Transportation Agency Strategic Plan Performance Metrics & Targets Fiscal Year 2019 Fiscal Year 2020 April 3, 2018 SAFETY Goal 1: Create a safer transportation experience for everyone.
TORONTO TRANSIT COMMISSION REPORT NO.
 Revised: March/13 TORONTO TRANSIT COMMISSION REPORT NO. MEETING DATE: March 26, 2014 SUBJECT: COMMUNITY BUS SERVICES ACTION ITEM RECOMMENDATION It is recommended that the Board not approve any routing
April 2011 April 2011 Presented by Robert Spaulding & Alan Eirls
 April 2011 April 2011 Presented by Robert Spaulding & Alan Eirls A Partnership Between the Coeur d Alene Tribe, FTA, the State of Idaho, the Local MPO, and Kootenai County. Current System The Citylink
Sound Transit Operations July 2016 Service Performance Report. Ridership
 Ridership Total Boardings by Mode Mode Jul-15 Jul-16 % YTD-15 YTD-16 % ST Express 1,618,779 1,545,852-4.5% 10,803,486 10,774,063-0.3% Sounder 333,000 323,233-2.9% 2,176,914 2,423,058 11.3% Tacoma Link
Strategic Plan
 2005-2015 Strategic Plan SUMMARY OF THE REVISED PLAN IN 2011 A decade focused on developing mass transit in the Outaouais A updated vision of mass transit in the region The STO is embracing the future
Branch Edmonton Transit
 Introduction to exceed 90 million by the end of 2015. This trend confirms Transit s on-going success towards achieving The Way We Move: by providing a comprehensive public transportation system that supports
COMMUNITY REPORT FISCAL YEAR We are making progress, are you on board? GOLD COAST TRANSIT DISTRICT
 FISCAL YEAR 178 GOLD COAST TRANSIT DISTRICT COMMUNITY REPORT We are making progress, are you on board? OJAI OXNARD PORT HUENEME VENTURA COUNTY OF VENTURA GENERAL MANAGER S MESSAGE STEVEN P. BROWN DEAR
6 Mobility Plus Annual Service Plan
 6 Mobility Plus 6 Mobility Plus Mobility Plus will implement specific strategies to assist York Region in achieving a more balanced specialized transportation service. Family of Services Program In 2011,
V03. APTA Multimodal Operations Planning Workshop August Green Line LRT
 V03 APTA Multimodal Operations Planning Workshop August 2016 Green Line LRT 2 Presentation Outline Past Present Future 3 16/03/2016 RouteAhead Update 4 4 16/03/2016 RouteAhead Update 5 5 16/03/2016 6 6
METRO TRANSIT a n n ua l re p o r t. madison, wisconsin // mymetrobus.com
 METRO TRANSIT 2016 a n n ua l re p o r t madison, wisconsin // mymetrobus.com metro transit In 2016, Metro Transit took steps to address capacity issues both on and off the road. Off the road, Metro began
CITY of GUELPH Transit Growth Strategy and Plan, Mobility Services Review. ECO Committee
 CITY of GUELPH Transit Growth Strategy and Plan, Mobility Services Review ECO Committee July 19, 2010 1 Study Purpose Vision and growth strategy for Guelph Transit, ensuring broad consultation Operational
STRATEGIC PRIORITIES AND POLICY COMMITTEE MAY 5, 2016
 STRATEGIC PRIORITIES AND POLICY COMMITTEE MAY 5, 2016 Shift Rapid Transit Initiative Largest infrastructure project in the city s history. Rapid Transit initiative will transform London s public transit
GODURHAM PROGRESS REPORT
 GODURHAM PROGRESS REPORT OVERVIEW OPERATIONS & PERFORMANCE With the service enhancements, total revenue hours increased In 2016, GoDurham connected 5.9 million passengers to jobs, education and health
RIDERSHIP TRENDS. March 2017
 RIDERSHIP TRENDS March 2017 Prepared by the Division of Strategic Capital Planning May 2017 Table of Contents Executive Summary...1 Ridership...3 Estimated Passenger Trips by Line...3 Estimated Passenger
Branch Edmonton Transit
 Introduction Edmonton Transit System (ETS) plays a critical role in connecting people, businesses and citizens within Edmonton and the Capital Region. ETS is wholly owned and operated by the City of Edmonton
CITY OF LONDON STRATEGIC MULTI-YEAR BUDGET ADDITIONAL INVESTMENTS BUSINESS CASE # 6
 2016 2019 CITY OF LONDON STRATEGIC MULTI-YEAR BUDGET ADDITIONAL INVESTMENTS BUSINESS CASE # 6 STRATEGIC AREA OF FOCUS: SUB-PRIORITY: STRATEGY: INITIATIVE: INITIATIVE LEAD(S): BUILDING A SUSTAINABLE CITY
An Asset Management Plan for Transit And Access Transit Fleet
 Header Title ATTACHMENT 1 Building Better Transit: An Asset Management Plan for Transit And Access Transit Fleet 2 June 2016 Transit & Access Transit Fleet INTRODUCTION The Saskatoon Transit fleet is currently
Martha s Vineyard Regional Transit Authority
 Martha s Vineyard Regional Transit Authority Annual Report Fiscal Year 2005 Martha s Vineyard Transit Authority Fiscal Year ending June 30, 2005 Annual Report Angela E. Grant, Administrator Advisory Board
The Engineering Department recommends Council receive this report for information.
 CORPORATE REPORT NO: R161 COUNCIL DATE: July 23, 2018 REGULAR COUNCIL TO: Mayor & Council DATE: July 19, 2018 FROM: General Manager, Engineering FILE: 8740-01 SUBJECT: Surrey Long-Range Rapid Transit Vision
The City of Toronto s Transportation Strategy July 2007
 The City of Toronto s Transportation Strategy July 2007 Presentation Outline Transportation Statistics Transportation Building Blocks Toronto s Official Plan Transportation and City Building Vision Projects
RIDERSHIP TRENDS. April 2018
 RIDERSHIP TRENDS April Prepared by the Division of Strategic Capital Planning June Table of Contents Executive Summary...1 Ridership...3 Estimated Passenger Trips by Line...3 Estimated Passenger Trips
2.1 TRANSIT VISION 2040 FROM VISION TO ACTION. Expand regional rapid transit networks STRATEGIC DIRECTION
 TRANSIT VISION 2040 FROM VISION TO ACTION TRANSIT VISION 2040 defines a future in which public transit maximizes its contribution to quality of life with benefits that support a vibrant and equitable society,
ROCHESTER, MINNESOTA
 ROCHESTER, MINNESOTA Rochester Public Works TRANSIT AND PARKING DIVISION Transit and Parking Manager Tony Knauer tknauer@rochestermn.gov SERVICE ATTITUDE CONSISTENCY - TEAMWORK ROCHESTER TRANSIT & PARKING
Regional Transportation Commission, Washoe County Lee Gibson, Executive Director Roger Hanson, Senior Planner
 Regional Transportation Commission, Washoe County Lee Gibson, Executive Director Roger Hanson, Senior Planner Presentation Outline Transit System Facts Economic Challenges in the Truckee Meadows RTC Transit
Amman Green Policies Projects and Challenges. Prepared by: Eng. Sajeda Alnsour Project coordinator Sept. 20, 2017
 Amman Green Policies Projects and Challenges Prepared by: Eng. Sajeda Alnsour Project coordinator Sept. 20, 2017 Amman: Demographics Greater AMMAN Municipality GAM Amman is the capital of Jordan with a
RIDERSHIP TRENDS. July 2018
 RIDERSHIP TRENDS July Prepared by the Division of Strategic Capital Planning September Table of Contents Executive Summary...1 Ridership...3 Estimated Passenger Trips by Line...3 Estimated Passenger Trips
Late Starter. Tuesday, November 6, 2018
 Late Starter Tuesday, Please note the following item(s) was not included with your agenda as this item(s) was received after the agenda package was printed. Planning and Works Committee Report TES-RTS-18-09,
Draft Results and Recommendations
 Waco Rapid Transit Corridor (RTC) Feasibility Study Draft Results and Recommendations Chris Evilia, Director of Waco Metropolitan Planning Organization Allen Hunter, General Manager Waco Transit System
Innovation in Transport. Mike Waters
 Innovation in Transport Mike Waters West Midlands as the home of mobility Accomodating growth Our population is forecast to grow by 444,000 people by 2035 Housing Deal: 215,000 homes by 2030/31 100m Land
The Case for. Business. investment. in Public Transportation
 The Case for Business investment in Public Transportation Introduction Public transportation is an enterprise with expenditure of $55 billion in the United States. There has been a steady growth trend
Transportation Demand Management Element
 Transportation Demand Management Element Over the years, our reliance on the private automobile as our primary mode of transportation has grown substantially. Our dependence on the automobile is evidenced
2015 LRT STATION ACTIVITY & PASSENGER FLOW SUMMARY REPORT
 LRT STATION ACTIVITY & PASSENGER FLOW SUMMARY REPORT CAPITAL and METRO LINES Project Team: ETS Transit Data Management Transportation Planning Strategic Monitoring and Analysis April, 2016 LRT STATION
Valley Metro Overview. ITE/IMSA Spring Conference March 6, 2014
 Valley Metro Overview ITE/IMSA Spring Conference March 6, 2014 Valley Metro Who Are We? Operate Regional Transit Services Valley Metro and Phoenix are region s primary service providers Light Rail and
SamTrans Business Plan Update May 2018
 SamTrans Business Plan Update May 2018 SamTrans Business Plan Core Principles: 1. Sustain and enhance services for the transit-dependent 2. Expand and innovate mobility services 3. Promote programs that
Presentation A Blue Slides 1-5.
 Presentation A Blue Slides 1-5. 1 Presentation A Blue Slides 1-5. 2 Presentation A Blue Slides 1-5. 3 Presentation A Blue Slides 1-5. 4 Presentation A Blue Slides 1-5. 5 Transit Service right. service
Proposed FY2015 Budget and Fare Increase
 Washington Metropolitan Area Transit Authority Proposed FY2015 Budget and Fare Increase Riders Advisory Council January 8, 2014 1 Washington Metropolitan Area Transit Authority What will riders see from
Paratransit Overview O & O Presentation January 11, 2018
 Paratransit Overview O & O Presentation January 11, 2018 Our vision is to be a valued regional partner that drives prosperity and makes life better for our community. Our mission is to connect Hampton
Milwaukee County Transit System
 Milwaukee County Transit System 2018 Proposed Transit Budget for Paratransit and Fixed Route Transit Operations and Capital Projects August 2017 Total Transit Budget State $ Federal $ Transit Rev. $ Vehicle
PUBLIC TRANSPORTATION
 PUBLIC TRANSPORTATION PROJECT TITLE U-MED DISTRICT MULTI-MODAL IMPROVEMENTS- PHASE II Transit Vehicles and Upgrades MUNICIPALITY OF ANCHORAGE Capital Improvement Program PROJECT LIST BY DEPARTMENT Public
TORONTO TRANSIT COMMISSION REPORT NO.
 Form Revised: February 2005 TORONTO TRANSIT COMMISSION REPORT NO. MEETING DATE: October 24, 2012 SUBJECT: DOWNTOWN RAPID TRANSIT EXPANSION STUDY (DRTES) PHASE 1 STRATEGIC PLAN ACTION ITEM RECOMMENDATIONS
The Regional Municipality of York. Purchase of Six Battery Electric Buses
 1. Recommendations The Regional Municipality of York Committee of the Whole Transportation Services January 10, 2019 Report of the Commissioner of Transportation Services Purchase of Six Battery Electric
El Metro Operations Proposed FY Budget
 Laredo Transit Management Inc.- El Metro El Metro Operations Proposed FY 2017-2018 Budget Claudia San Miguel Acting General Manager Mission Statement To provide a safe, reliable, cost effective, and efficient
CHAPTER 5 CAPITAL ASSETS
 CHAPTER 5 CAPITAL ASSETS This chapter describes the capital assets of GCTD, including revenue and nonrevenue vehicles, operations facilities, passenger facilities and other assets. VEHICLE REVENUE FLEET
MONTHLY PERFORMANCE DASHBOARD
 AUSTIN ENERGY JULY MONTHLY PERFORMANCE DASHBOARD A report highlighting key Austin Energy metrics for e FY FINANCIAL HEALTH Standard and Poor s Bond Rating Austin Energy Rating AA AA Budget Based Revenues
EUGENE-SPRINGFIELD, OREGON EAST WEST PILOT BRT LANE TRANSIT DISTRICT
 EUGENE-SPRINGFIELD, OREGON EAST WEST PILOT BRT LANE TRANSIT DISTRICT (BRIEF) Table of Contents EUGENE-SPRINGFIELD, OREGON (USA)... 1 COUNTY CONTEXT AND SYSTEM DESCRIPTION... 1 SYSTEM OVERVIEW... 1 PLANNING
Blue Ribbon Committee
 Blue Ribbon Committee February 26, 2015 Kick-off Meeting Blue Ribbon Committee 1 2,228 Metro CNG Buses 170 Bus Routes 18 are Contract Lines Metro Statistics 2 Transitway Lines (Orange/Silver Lines) 20
US 29 Bus Rapid Transit Planning Board Briefing. February 16, 2017
 US 29 Bus Rapid Transit Planning Board Briefing February 16, 2017 Project Goals Improve the quality of transit service Improve mobility opportunities and choices Enhance quality of life Support master
Sustainability SFMTA Path to Platinum
 Sustainability SFMTA Path to Platinum Ed Reiskin San Francisco Municipal Transportation Agency, Director of Transportation San Francisco, CA Timothy Papandreou Deputy Director Strategic Planning & Policy
FREQUENTLY ASKED QUESTIONS
 FREQUENTLY ASKED QUESTIONS 2018 What is the More MARTA Atlanta program? The More MARTA Atlanta program is a collaborative partnership between MARTA and the City of Atlanta to develop and implement a program
ARC TAQC. June 12, 2014
 ARC TAQC June 12, 2014 MARTA AT A GLANCE 9th largest transit system in U.S. Approximately 418,000 weekday boardings 4,536 total employees Major contributor to regional and state economy ECONOMIC IMPACT
Utah Transit Authority Rideshare. CTAA Conference June 12, 2014
 Utah Transit Authority Rideshare CTAA Conference June 12, 2014 UTA Statistics and Info A Public Transit Agency Six counties, about 1600 square miles Within this area is 80% of the state s population, an
Aren t You Really a Mobility Agency? Why The Vanpool Works for Transit
 Aren t You Really a Mobility Agency? Why The Vanpool Works for Transit Presenter: Kevin Coggin, Coast Transit Authority, Gulfport, MS Presenter: Lyn Hellegaard, Missoula Ravalli TMA, Missoula, MT Moderator:
ACT Canada Sustainable Mobility Summit Planning Innovations in Practice Session 6B Tuesday November 23, 2010
 ACT Canada Sustainable Mobility Summit Planning Innovations in Practice Session 6B Tuesday November 23, 2010 Presentation Outline Context t of Mississauga i City Centre Implementing Paid Parking and TDM
Downtown Transit Connector. Making Transit Work for Rhode Island
 Downtown Transit Connector Making Transit Work for Rhode Island 3.17.17 Project Evolution Transit 2020 (Stakeholders identify need for better transit) Providence Core Connector Study (Streetcar project
5. OPPORTUNITIES AND NEXT STEPS
 5. OPPORTUNITIES AND NEXT STEPS When the METRO Green Line LRT begins operating in mid-2014, a strong emphasis will be placed on providing frequent connecting bus service with Green Line trains. Bus hours
Form Revised: February 2005 TORONTO TRANSIT COMMISSION REPORT NO. MEETING DATE: August 30, SUBJECT: Scarborough Rt Strategic Plan
 Form Revised: February 2005 TORONTO TRANSIT COMMISSION REPORT NO. MEETING DATE: August 30, 2006 SUBJECT: Scarborough Rt Strategic Plan RECOMMENDATIONS It is recommended that the Commission: 1. Endorse
REPORT TO THE CHIEF ADMINISTRATIVE OFFICER FROM THE DEVELOPMENT AND ENGINEERING SERVICES DEPARTMENT COMPRESSED NATURAL GAS TRANSIT FLEET UPDATE
 September 7, 2016 REPORT TO THE CHIEF ADMINISTRATIVE OFFICER FROM THE DEVELOPMENT AND ENGINEERING SERVICES DEPARTMENT ON COMPRESSED NATURAL GAS TRANSIT FLEET UPDATE PURPOSE To update Council on Kamloops
Draft Results and Open House
 Waco Rapid Transit Corridor (RTC) Feasibility Study Draft Results and Open House Chris Evilia, Director of Waco Metropolitan Planning Organization Allen Hunter, General Manager Waco Transit System Jimi
Mr. Vince Mauceri General Manager Transportation Operations and Technology
 Mr. Vince Mauceri General Manager Transportation Operations and Technology METROLINX OVERVIEW AND MANDATE Established in 2006 to address the significant transportation challenges in the Greater Toronto
Used Vehicle Supply: Future Outlook and the Impact on Used Vehicle Prices
 Used Vehicle Supply: Future Outlook and the Impact on Used Vehicle Prices AT A GLANCE When to expect an increase in used supply Recent trends in new vehicle sales Changes in used supply by vehicle segment
August ATR Monthly Report
 August ATR Monthly Report Minnesota Department of Transportation Office of Transportation Data and Analysis August 2011 Introduction The purpose of this report is to examine monthly traffic trends on
Car Sharing at a. with great results.
 Car Sharing at a Denver tweaks its parking system with great results. By Robert Ferrin L aunched earlier this year, Denver s car sharing program is a fee-based service that provides a shared vehicle fleet
Central City Line Locally Preferred Alternative (LPA) Amendment Public Hearing. July 24, 2014
 Amendment Public Hearing. July 24, 2014") Central City Line Locally Preferred Alternative (LPA) Amendment Public Hearing July 24, 2014 Project Description The Central City Line is a High Performance Transit project that will extend from Browne
Central City Line Locally Preferred Alternative (LPA) Amendment Public Hearing July 24, 2014 Project Description The Central City Line is a High Performance Transit project that will extend from Browne
TORONTO TRANSIT COMMISSION REPORT NO.
 Form Revised: February 2005 TORONTO TRANSIT COMMISSION REPORT NO. MEETING DATE: September 27, 2012 SUBJECT: NOTICE OF AWARD PROCUREMENT AUTHORIZATION - ARTICULATED BUSES INFORMATION ITEM RECOMMENDATION
Too Good to Throw Away Implementation Strategy
 Too Good to Throw Away Implementation Strategy Council Briefing by Sanitation Services October 4, 2006 Purpose of Briefing Summarize preparations for Too Good To Throw Away recycling services FY07 Recommend
TORONTO TRANSIT COMMISSION REPORT NO.
 Revised: March/13 TORONTO TRANSIT COMMISSION REPORT NO. MEETING DATE: SUBJECT: August 19, 2014 OPPORTUNITIES TO IMPROVE TRANSIT SERVICE IN TORONTO ACTION ITEM RECOMMENDATIONS It is recommended that the
Sean P. McBride, Executive Director Kalamazoo Metro Transit. Presentation to Michigan Transportation Planning Association July 13, 2016
 Sean P. McBride, Executive Director Kalamazoo Metro Transit Presentation to Michigan Transportation Planning Association July 13, 2016 Metro Transit in Kalamazoo County Square Miles = 132 Urbanized Population:
The Funding of Pupil Transportation In North Carolina March, 2001
 The Funding of Pupil Transportation In North Carolina March, 2001 North Carolina Department of Public Instruction Division of School Support, Transportation Services Three main components of pupil transportation
Capital Needs Assessment Riders Advisory Council July2, 2008
 Capital Needs Assessment 2011-2020 Riders Advisory Council July2, 2008 1 Outline I. Capital Improvement Plan History II. Capital Improvement Plan Update III. Capital Needs Assessment State of Good Repair
PUBLIC TRANSPORT IMPROVEMENT, PLANNING AND OPERATIONS.
 PUBLIC TRANSPORT IMPROVEMENT, PLANNING AND OPERATIONS. Email: mohamed.kuganda@udagroup.co.tz Mobile: +255754 810570 Presentation by: Eng. Mohamed Kuganda Chief Operations Officer UDART Plc - TANZANIA PRESENTATION
MARTA s blueprint for the future. COFFEE AND CONVERSATION Kyle Keahey, More MARTA Atlanta Dec. 5, 2018
 MARTA s blueprint for the future COFFEE AND CONVERSATION Kyle Keahey, More MARTA Atlanta Dec. 5, 2018 TODAY S AGENDA About MARTA Economic development/local impact More MARTA Atlanta program Program summary/timeline
Transit System Technical Report
 Transit System Technical Report Table of Contents Introduction... 1 Regional Setting... 1 Road Network... 1 The Mass Transportation Authority FY 2016-2020 Plan... 2 Other Growth Areas... 5 Senior Citizens...
AMERICA. rides the BUS
 AMERICA rides the BUS This brochure provides information on the positive development and direction of the bus industry today, as well as on the broad-based need the bus industry fills in American communities.
Executive Summary October 2013
 Executive Summary October 2013 Table of Contents Introduction... 1 Rider Transit and Regional Connectivity... 1 Plan Overview... 2 Network Overview... 2 Outreach... 3 Rider Performance... 4 Findings...
MONTHLY PERFORMANCE DASHBOARD
 AUSTIN ENERGY MONTHLY PERFORMANCE DASHBOARD A report highlighting key Austin Energy metrics for uary FY 219 FINANCIAL HEALTH Standard and Poor s Bond Rating Austin Energy Rating AA AA Budget Based Revenues
Table of Contents. Page 1 of 15
 Annual Report 2016 2017 Table of Contents CAO and Governance Committee Update... 2 Governance Committee Members... 3 Mission Statement... 3 Vision Statement... 3 2016 2017 Highlights... 4 Route/Operator
Paid Parking at Park & Ride Lots: Framing the Issues. Capital Programs Committee May 2014
 Paid Parking at Park & Ride Lots: Framing the Issues Capital Programs Committee May 2014 Outline Current Status Industry Review DART Case Study Issues Alternatives Mechanics 2 Current Status: All Lots
An Overview of Transportation Responsibility
 1 An Overview of Transportation Responsibility Fast Facts Our Business History of Budget Cuts (2007 2013) Benchmark Comparison Proposed Budget Cuts for FY14 Community Input Peer Comparison 2 Mission Statement:
Back ground Founded in 1887, and has expanded rapidly Altitude about 2500 meters above MSL Now among the ten largest cities in Sub Saharan Africa
 Back ground Founded in 1887, and has expanded rapidly Altitude about 2500 meters above MSL Now among the ten largest cities in Sub Saharan Africa Annual growth rate is 3.8% By 2020 population growth would
Commuter Transit Service Feasibility
 Commuter Transit Service Feasibility West Michigan Transit Linkages Study Submitted to: Ottawa County, Michigan Submitted by: MP2PLANNING, LLC AUGUST 2012 Table of Contents 1. Introduction... 2 2. Overall
GO Transit s deliverable: the 2020 Service Plan
 GO Transit s deliverable: the 2020 Service Plan GO Transit s 2020 Service Plan describes GO s commitment to customers, existing and new, to provide a dramatically expanded interregional transit option
City of Kelowna Regular Council Meeting AGENDA
 Regular Council Meeting AGENDA Monday, January 15, 2018 9:00 am Knox Mountain Meeting Room (#4A) City Hall, 1435 Water Street Pages 1. Call to Order 2. Confirmation of Minutes 3-4 Regular AM Meeting -
PUBLIC TRANSPORTATION
 PUBLIC TRANSPORTATION An Overview of the Industry, Key Federal Programs, and Legislative Processes American Public Transportation Association 1 The Public Transportation Industry: What is "public transportation"?
The Denver Model. Miller Hudson
 The Denver Model Miller Hudson The Regional Transportation District Created in 1969 Eight county service area 40 municipalities Service area: 2,410 square miles 2.5 million population 15 elected Board
Wyoming School Funding Model Recalibration: Transportation Reimbursement Model Study
 Wyoming School Funding Model Recalibration: Transportation Reimbursement Model Study Robert Schoch and Dr. William Hartman, Education Finance Decisions For Augenblick, Palaich and Associates, Inc. Presentation
Dr. K. Gunasekaran Associate Professor Division of Transportation Engineering Anna University Chennai
 Dr. K. Gunasekaran Associate Professor Division of Transportation Engineering Anna University Chennai INTRODUCTION Bus Transport is the most preferred Public Transport System in many Indian cities Recent
Recommended Vision for the Downtown Rapid Transit Network
 Recommended Vision for the Downtown Rapid Transit Network April 2008 Presentation Overview Context Transit options Assessment of options Recommended network Building the network 2 1 Rapid Our Vision Reliable
MONTHLY PERFORMANCE DASHBOARD
 AUSTIN ENERGY MONTHLY PERFORMANCE DASHBOARD A report highlighting key Austin Energy metrics for ember FY 219 FINANCIAL HEALTH Standard and Poor s Bond Rating Austin Energy Rating AA AA Budget Based Revenues
MONTHLY PERFORMANCE DASHBOARD
 AUSTIN ENERGY MARCH 21 MONTHLY PERFORMANCE DASHBOARD A report highlighting key Austin Energy metrics for uary FY 21 FINANCIAL HEALTH Standard and Poor s Bond Rating Current AA AA Budget Based Revenues
UC Santa Cruz TAPS 3-Year Fee & Fare Proposal, through
 UC Santa Cruz TAPS 3-Year Fee & Fare Proposal, 2016-17 through 2018-19 Introduction Transportation and Parking Services (TAPS) proposes a three-year series of annual increases to most Parking fees and
6 York Region Transit (YRT/Viva) On-board Security Camera System Upgrade Contract Award
 On-board Security Camera System Upgrade Contract Award") Clause 6 in Report No. 11 of Committee of the Whole was adopted, without amendment, by the Council of The Regional Municipality of York at its meeting held on June 25, 2015. 6 York Region Transit (YRT/Viva)
Clause 6 in Report No. 11 of Committee of the Whole was adopted, without amendment, by the Council of The Regional Municipality of York at its meeting held on June 25, 2015. 6 York Region Transit (YRT/Viva)
BOARD OF COUNTY COMMISSIONERS AGENDA ITEM SUMMARY. Consent Workshop [ ]
![BOARD OF COUNTY COMMISSIONERS AGENDA ITEM SUMMARY. Consent Workshop [ ]](/thumbs/82/86800449.jpg "BOARD OF COUNTY COMMISSIONERS AGENDA ITEM SUMMARY. Consent Workshop [ ]") - _j POSTPONED FROM THE JANUARY 14 BCC MEETING Agenda Item #5,::.. I BOARD OF COUNTY COMMISSIONERS AGENDA ITEM SUMMARY Meeting Date: February 4, 2014 [ ] [ ] Department: Submitted By: Engineering & Public
- _j POSTPONED FROM THE JANUARY 14 BCC MEETING Agenda Item #5,::.. I BOARD OF COUNTY COMMISSIONERS AGENDA ITEM SUMMARY Meeting Date: February 4, 2014 [ ] [ ] Department: Submitted By: Engineering & Public
Central London Congestion Charging Scheme. 17 March 2005 Impacts - 9 th Annual Conference. Michele Dix Director Congestion Charging Division
 Central London Congestion Charging Scheme 17 March 2005 Impacts - 9 th Annual Conference Michele Dix Director Congestion Charging Division Contents 1. The Scheme 2. Impacts 3. Next Steps The Scheme Where