Estimation of Annual Average Daily Traffic (AADT) and Missing Hourly Volume Using Artificial Intelligence
|
|
|
- Harold Powers
- 6 years ago
- Views:
Transcription
1 Clemson University TigerPrints All Theses Theses Estimation of Annual Average Daily Traffic (AADT) and Missing Hourly Volume Using Artificial Intelligence Sababa Islam Clemson University Follow this and additional works at: Recommended Citation Islam, Sababa, "Estimation of Annual Average Daily Traffic (AADT) and Missing Hourly Volume Using Artificial Intelligence" (2016). All Theses This Thesis is brought to you for free and open access by the Theses at TigerPrints. It has been accepted for inclusion in All Theses by an authorized administrator of TigerPrints. For more information, please contact
2 ESTIMATION OF ANNUAL AVERAGE DAILY TRAFFIC (AADT) AND MISSING HOURLY VOLUME USING ARTIFICIAL INTELLIGENCE A Thesis Presented to the Graduate School of Clemson University In Partial Fulfillment of the Requirements for the Degree Master of Science Civil Engineering by Sababa Islam December 2016 Accepted by: Mashrur Chowdhury, Committee Chair Wayne Sarasua Feng Luo
3 ABSTRACT Annual Average Daily Traffic (AADT) is one of the most important traffic parameters used in transportation planning and engineering analysis. Moreover, each state Department of Transportation (DOT) must report the AADT data to the Federal Highway Administration (FHWA) annually as part of the Highway Performance Monitoring System (HPMS) reporting requirements. For this reason, state DOTs continually collect AADT data via permanent count stations and short-term counts. In South Carolina, only interstates and primary routes are equipped with permanent count stations. For the majority of the secondary routes, AADT data are estimated based on short-term counts or are simply guesstimated based on their functional classifications. In this study the use of Artificial Neural Network (ANN) and Support Vector Regression (SVR) were applied to estimate AADT from short-term counts. These estimated AADTs were compared to the traditional factor method used by South Carolina Department of Transportation (SCDOT) and also to the Ordinary Least-square Regression method. The comparison between ANN and SVR revealed that SVR functions better than ANN in AADT estimation for different functional classes of roadways. A second comparison was conducted between SVR and the traditional factor method. A comparative analysis revealed that SVR performed better that the traditional factor method. Similarly, the comparison between SVR and regression analysis, for the principal arterials, revealed no significant difference in the actual AADT and AADTs estimated through SVR. However, it did show a significant difference between the actual AADT and AADT estimated through regression analysis. ii
4 One of the primary challenges of accurate measurement of AADT is having reliable, complete, and accurate traffic data. Previous literature indicated that often the transportation agencies reported the problem of missing hourly volume from the permanent traffic count stations. These studies reported that the percentage of missing traffic data vary between 10% to 60%. In an effort to address this issue, most of the state departments of transportation either discard or impute the missing data. SCDOT imputes the missing hourly volume using the historical average of the last 3 months data from the same day and hour. This method of data imputation could often be erroneous. In order to develop an accurate estimation of missing hourly volume from the permanent count stations, this study applied two Artificial Intelligence Paradigms, Artificial Neural Network (ANN) and Support Vector Regression (SVR) for predicting hourly missing data. Data imputation models were developed for Urban Principal Arterial (Interstate), Rural Principal Arterial (Interstate), and Urban Principal Arterials-other functional class. Each of these functional classes were divided into different ANN and SVR models based on the on different combination of input features. This study indicated that for each functional class, SVR outperformed ANN. The SVR model performance was later compared with current SCDOT s imputation practice, which revealed that SVR model is more accurate in estimating missing values compared to the imputation method by SCDOT. iii
5 DEDICATION I would like to dedicate this thesis to my grandparents, my parents and my youngest uncle for their unconditional love and support. My youngest uncle, who himself is a renowned Civil Engineer, dreamt of me being a Civil Engineer since the day I was born, and has greatly contributed to my passion for this field. iv
6 ACKNOWLEDGMENTS I would like to express my sincere appreciation and gratitude to my advisor, Dr. Mashrur Chowdhury for his continuous guidance, inspiration, and support throughout my journey as a master s student. He is the one who motivated me to endeavor challenges that I never imagined I could accomplish. I can t thank him enough for believing in me and for involving me in different research activities and projects. I would also like to thank Dr. Wayne Sarasua and Dr. Feng Luo for serving as my thesis committee members. Thank you for reviewing my thesis, and providing valuable insights about the research. I would like to specially acknowledge my better half, Sakib Mahmud Khan, who has done everything for my ease and comfort during my entire journey as an MS student. It s he who took care of everything when I was busy with my thesis. I simply could not be able to earn this degree without him having beside me. I would like to thank the South Carolina Department of Transportation (SCDOT) for providing me with the data that were necessary for my research. I would like to extend my deep appreciation to Dr. Kakan Dey for his continuous effort to improve the research quality and for always being there whenever I needed him. I would like to specially thank Md. Mizanur Rahman to help me out in times when I was in need of suggestions for my research. I sincerely thank Joshua Mitchell and McKenzie Keehan for being the best colleagues that I can ask for. I appreciate both of them for reviewing my work. I am grateful to Dr. Katalin Beck, for reviewing my thesis when I was desperately in need of a technical writing expert. I also acknowledge the help from the v
7 Clemson University Writing Center while writing this thesis. Moreover, I will like to recognize Md Mhafuzul Islam and Md Zadid khan for helping me to improve my thesis defense. I cordially thank my parent-in-laws, my sister and my niece and everyone else from my family for being the support system for me during any critical times. They have always been my inspiration to reach my goals. I appreciate the staff members from the Glenn Department of Civil Engineering, and Kristin Baker in particular for extending her help with any types of administrative work. Finally, I would like to express my wholehearted gratitude to the Bangladeshi Community in Clemson for making Clemson my home and giving me the warmth of a family. vi
8 Table of Content TITLE PAGE.... i ABSTRACT... ii DEDICATION... iv ACKNOWLEDGMENTS... v Chapter One... 1 INTRODUCTION Background and Motivation Research Objectives Organization of the Thesis... 5 Chapter two... 6 LITERATURE REVIEW Overview Different methods for AADT Estimation Different Methods for Imputing Missing Hourly Volume Chapter three RESEARCH METHOD Overview AADT Estimation Using Machine Leaning Techniques Imputation of Missing Hourly Volume for ATRs Using Artificial Intelligence 29 Chapter four ANALYSIS AND RESULTS Overview Evaluation of AI Models for Estimating Annual Average Daily Traffic Evaluation of Models for Imputing Missing Hourly Volume Chapter Five CONCLUSIONS AND RECOMMENDATIONS Overview Conclusions Recommendations vii
9 References APPENDICES APPENDIX A: MATLAB CODE FOR AADT ESTIMATION APPENDIX B: MATLAB CODE FOR MISSING HOURLY VOLUME IMPUTATION APPENDIX C: RMSE CALCULATION FOR AADT ESTIMATION AND MISSING HOURLY VOLUME IMPUTATION viii
10 List of Tables Table 3-1 Feature Selection Methods Table 3-2 List of Models and Input features for Different Functional Classes Table 3-3 List of Models and Input features for Different Functional Classes Table 4-1 Input and Target Features of AADT Estimation Models Table 4-2 SVR Parameter Values with least RMSE Table 4-3 Features selected using Sequential Feature Selection Method and the total number of features of the models with least RMSE Table 4-4 RMSE of Urban Principal Arterial Interstate Models Table 4-5 RMSE of Rural Principal Arterial Interstate Model Table 4-6 RMSE of Urban Principal Arterial Other Model Table 4-7 RMSE of Rural Principal Arterial Other Model Table 4-8 RMSE of General Model Table 4-9 Comparison of AADT estimated by SVR to Traditional Factor Method Table 4-10 Input and Target Feature Determination Table 4-11 SVR Parameter Values Table 4-12 Features selected using Sequential Feature Selection Method and the total number of features of the models with least RMSE Table 4-13: RMSE of Urban Principal Arterial Interstate Model Table 4-14: RMSE of Rural Principal Arterial Interstate Table 4-15 RMSE of Urban Principal Arterial Other ix
11 List of Figures Figure 3-1 AADT Estimation Method Figure 3-2 ATR Locations in South Carolina Figure 3-3 Sample one-day data for Station Table of Contents Figure 3-4 Data collection method from SCDOT website Figure 3-5 Sample Neural Network Model Figure 3-6 Overview of SVR model Figure 3-6 Method for missing hourly volume imputation Figure 4-1 RMSE of Urban Principal Arterial Interstate Models Figure 4-2 RMSE of Rural Principal Arterial Interstate Models Figure 4-3 RMSE of Urban Principal Arterial Other Models Figure 4-4 RMSE of Rural Principal Arterial Other Models Figure 4-5 RMSE of All ATR Functional Class Models Figure 4-6: R 2 for SVR and Factor Method Figure 4-7: R 2 for SVR and Regression Models Figure 4-8: RMSE of Urban Principal Arterial Interstate Model (SVR) Figure 4-9: RMSE of Urban Principal Arterial Interstate Model (ANN) Figure 4-10: Average RMSE of Urban Principal Arterial Interstate Model (SVR Vs ANN) Figure 4-11: RMSE of Rural Principal Arterial Interstate (SVR) Figure 4-12: RMSE of Rural Principal Arterial Interstate (ANN) x
12 Figure 4-13: Average RMSE of Rural Principal Arterial Interstate Model (SVR Vs ANN) Figure 4-14: RMSE of urban Principal Arterial other (SVR) Figure 4-15: RMSE of urban Principal Arterial other (ANN) Figure 4-16: Average RMSE of Urban Principal Arterial Other Models (SVR Vs ANN) Figure 4-17: Actual Vs Predicted Volume by SVR and historical average method by SCDOT xi
13 CHAPTER ONE INTRODUCTION 1.1 Background and Motivation Annual Average Daily Traffic (AADT) is one of the most important parameters in transportation engineering. It is calculated by adding the total vehicle volume of a highway for a year divided by 365 days. It is one of the most important traffic measures used in any transportation related projects (i.e. roadway design, transportation planning, traffic safety analysis, highway investment decision making, highway maintenance, air quality compliance study and travel demand modeling). It is also an important input variable for safety analysis and is used in Safety Analyst software and the Highway Safety Manual (Harwood, 2004). Moreover, as a part of the traffic monitoring program, every state department of transportation has to report the AADT on federal aid highways to FHWA annually (TMG, 2016). Thus, the accuracy of AADT estimation is critical to any transportation problems that uses AADT as an input parameter. However, to develop an accurate method of estimating AADT is one of the biggest challenges in transportation engineering keeping in mind the lack of enough funding. An accurate means of measuring AADT for a road segment involves installing permanent traffic count stations or Automatic Traffic Recorders (ATRs). An ATR collects traffic data 24 hours a day and 365 days a year using traditional inductive loops, microwave radar sensors, magnetic counters, and piezoelectric sensors. However, installation of the 1
14 permanent count stations using the traditional technologies at thousands of traffic count stations throughout a given network to estimate AADT data is hardly economical (Atluri, et al., 2009); therefore, ATRs are installed only at a limited number of locations and short term traffic counts (i.e., 24/48-hour) are performed at most of the other locations where an AADT estimation is required. These short term counts are expanded using some calibration factors to calculate AADT, which is known as the Factor Method. The data collection frequencies at short term count stations are inconsistent among states. While short-term counts are performed annually in some states, others span a few years (Sharma et al., 1999). Traditional AADT estimation method entails the use of expansion factors (seasonal, daily, monthly, growth and axle adjustment factors) to the volume collected from the short-term traffic count stations. This method of AADT estimation involves 1) calculating the expansion/adjustment factors using the data from the continuous traffic count stations, and 2) applying the calculated factors to the roadway locations with shortterm counts to estimate AADT (Garber and Hoel, 2014). In order to develop reliable adjustment factors, permanent and short terms count stations are grouped together based on the geographical locations and the functional class of roadway. After grouping, permanent count station data are used to develop the average adjustment factors, and shortterm count locations within the same group is used to estimate AADT by applying these factors. This method of AADT estimation at short term count station is quite ambiguous since there are no defined guidelines or established standards regarding the method of assigning the expansion factors from ATR to the short-term traffic count stations (Sharma et al., 1999). Moreover, the relatively small number of ATRs in the lower functional class 2
15 of roadways makes it challenging for the development of accurate expansion factors for large number of short term count stations on local roads. Which creates the need for more permanent count stations in the lower functional classes. Researchers have used several alternative methods for estimating AADT, which include regression analysis, regression analysis using centrality and roadway characteristic variables, travel demand modelling, machine learning techniques, image processing to circumvent the limitations of the traditional AADT estimation methods (Sharma et al., 1999 and Keehan et al., 2017). The key for estimating accurate AADT is the availability of reliable, accurate and complete traffic data. These traffic data are not only used to calculate AADT but also to estimate Design Hourly Volume (DHS), average travel speed, and to forecast the future traffic conditions. Specific traffic data, such as volumes of traffic, speed data, occupancy rates are used for designing the traffic control system. Despite calculating traffic parameters and designing traffic control systems, transportation agencies are now more inclined to use real time traffic data for transportation network optimization with increasing travel demand. As mentioned earlier transportation agencies usually collect traffic data from permanent count stations continuously for 365 days a year, it is challenging to obtain accurate and complete data without any missing and inaccurate values due to several factors, such as hardware or software malfunctioning on data collection equipment and technology or loss of data packages during transmission from roadside ATRs to traffic data processing centers (Qu et al., 2009). Multiple previous studies have identified the extent of missing data at ATRs. A study by Zong et al. indicated that on an average, ATRs have more than 50% of values missing, based on data collected from Alberta, Minnesota, and 3
16 Saskatchewan ATRs (Zhong et al., 2004). Similarly, the percentage of missing data from some loop detectors in the California performance measurement system (PeMS) is higher than 10% (Performance Measurement System, 2016). South Carolina Department of Transportation (SCDOT) is not an exception. Due to the missing data of the permanent count stations (i.e., ATRs), traffic parameters (i.e. AADT) often have to be estimated based on incomplete data, which can lead to estimation inaccuracies. In order to overcome this limitation, transportation agencies often impute these missing hourly volume. It is mentioned in the AASHTO guidelines that if the missing traffic data is not extensive with respect to the entire data collected from a particular location and if the missing data is randomly scattered throughout the year, traffic agencies may impute hourly volume (Vandervalk-Ostrander, 2009). However, it is also mentioned in the guideline that, there should be a threshold (not more than 50% of the data) for the percentage of missing data and if missing data exceeds that threshold, agencies should not use that data for developing traffic statistics (Vandervalk-Ostrander, 2009). Although the transportation agencies impute missing traffic data, the Traffic Monitoring Guide (TMG) and AASHTO guidelines have particularly mentioned the importance of Truth-in-Data, and it is recommended that if state DOTs adjust/impute missing data they should maintain record of the data adjustment procedure (TMG, 2016 and Vandervalk-Ostrander, 2009). 1.2 Research Objectives The specific objectives of this research are as follows: 4
17 1. Develop AADT estimation models using machine learning techniques for different functional classes of roadways in South Carolina; 2. Compare the AADT estimated by machine learning techniques and traditional factor method used by SCDOT. 3. Develop missing hourly volume imputation models for different ATR locations using machine learning techniques. 4. Compare the missing hourly volume imputed by models using machine learning techniques and the historical average method used by SCDOT. 1.3 Organization of the Thesis The thesis is comprised of five chapters. Chapter 1 of the thesis consists of the research background and motivation for this study, followed by the research objectives of the thesis. Chapter 2 summarizes the review of different AADT estimation methods and missing hourly volume imputation methods. Chapter 3 presents the method describing how the Artificial Intelligence (AI) based models were developed for estimating AADT and imputing missing hourly volume traffic data. Chapter 4 summarizes the results of the AADT estimated using different ANN and SVR based models in the study and comparison of the AADT estimated for the AI based models developed in the study with the factor based method currently used by SCDOT. This chapter also presents the results of hourly missing hourly volume imputation developed my machine learning techniques and compare the results with the historical average method used by SCDOT. Finally, Chapter 5 concludes the thesis with the important research finding and recommendations based on the results. 5
18 CHAPTER TWO 2.1 Overview LITERATURE REVIEW This chapter is divided into two sections. Section 2.2 presents the review of different AADT estimation methods and their efficacies. The method includes: Traditional Factor method Regression analysis Machine learning techniques Section 2.3 of this chapter presents the different missing hourly volume imputation methods that have been reviewed for this research. The following is a list of methods presented in this section: Interpolation-based Imputation Methods Statistical Learning-Based Imputation Methods Prediction-Based Imputation Methods 2.2 Different methods for AADT Estimation This section summarizes the different AADT estimation methods that have been reviewed for this research Traditional Factor Method Traditional factor method is the most widely adopted method for estimating AADT in USA. According to a survey conducted by a research project, it was found that among 6
19 the 39 participating state DOTs 35 of them use factor method for estimating AADT from the short term traffic count stations (Islam et al., 2017). While the traffic monitoring guide and AASHTO have provided guidelines for estimating AADT using the factor methods, state DOTs usually improvise it according to their specific needs (TMG, 2001 and AASHTO, 1994). In this method, the short term traffic counts (24, 48 or 72 hours) taken at some strategic roadway locations are adjusted using different expansion factors. These factors include seasonal, axle adjustment factors and growth factors. The mathematical formulation of the AADT using the factor method is as follows AADTgi = ADTgi AFi SFg GFg AADTgi = the annual average daily traffic at location i of factor group g, ADThi = the average daily (vehicle/axle) traffic at location i of factor group g, AFi = the applicable axle correction factor for location i (if needed), SFg = the applicable seasonal adjustment factor for group g, and GFg = the applicable annual growth factor for group g (if needed). Permanent count stations data are used to develop these factors. The estimation of these factors is critical for calculating accurate estimate of AADT. Usually the ATRs are grouped and the factors developed from each ATR locations are averaged. The ATR stations are grouped based on roadway functional class, land use or geographic location in most of the time. The factors developed are than applied to an individual or to a group of short term traffic count stations. There are no defined guidelines on how to assign the 7
20 factors to the short term traffic count stations which often leads to inaccurate estimation of AADT Regression Analysis Regression analysis is one of the most popular methods for AADT estimation. Having incorporated demographic variables into the estimation model, Mohammad et al. found that county arterial mileage and county population were two significant quantitative independent variables (Mohammad et al. 1998). They also found that location and accessibility were two significant qualitative variables effecting the volume of traffic on the paved county roads. Roadways characteristics in AADT estimation in Florida were considered by Xia et al. (1999). GIS technology was used by Zhao and Chung (2001) to extract land-use and accessibility information to be used in regression models. However, few studies addressed modified version of the regression models. Geographically weighted regression (GWR) was applied by Zhao and Park (2004) to estimate regression parameters locally instead of globally. The comparison showed that GWR is more accurate than ordinary linear regression (OLR). Jiang et al. (2006) proposed to use a weighted average of i) growth factor method, which uses last years data to predict AADT and ii) traffic count from current year s image. Kingan and Westhuis (2006) proposed a regression method that is more robust in estimating AADT than the ordinary least square method, since the ordinary least square method is vulnerable to outliers. Yang et al. (2011) studied variable selection and parameter estimation using different groups of variables. The variable selection by smoothly clipped absolute deviation penalty (SCAD) method can select significant variables and estimate regression coefficients simultaneously. Important 8
21 variables can be selected using the smoothly clipped absolute deviation penalty (SCAD) method. Regression coefficients can also be estimated using this method simultaneously Machine Learning Techniques For the last decades, machine learning has been gaining constant attention in the field of transportation engineering (Bhavser et al., 2007). Among the different algorithms, ANN has been used extensively in studying driver behaviors, maintenance of pavement, classification or detection of vehicles, analysis of traffic patterns and forecasting of traffic (Himanen et al. 1998). In addition, Sharma et al. used hourly volume factors as the predictor variable for estimating AADT. Here, they determined the effectiveness of two or more short-term traffic counts that were collected at different periods of the traffic counting season over the traditional method of AADT estimation. While they determined that the traditional method outperformed the ANN, the reason for this superior performance was the accurate grouping of the permanent and short-term count stations, which is rare in practical cases (Sharma et al., 1999). In their follow up study using hourly volume from 55 permanent count stations to inform ANN for AADT for lower volume roadways of Alberta, Canada, they also found that the traditional factor method to be superior (Sharma et al., 2001). However, they also found that because estimating AADT using ANN does not require grouping of the permanent count stations, there is no need to correctly assign shortterm count stations to an ATR group. Therefore, in such a case ANN is recommended. SVR being another form of machine learning techniques is one of the most common applications of SVM. This method uses a set of supervised learning methods and can be 9
22 successfully applied for regression similar to the ANN. A study by Lin indicated that SVR has greater learning potential than ANN (Lin, 2004). However, limited research has been conducted using SVR in traffic data analysis (Vanajakshi and Laurence, 2004). The applications of SVR and SVM in the field of transportation engineering include; its use for travel time prediction, incident detection, real-time highway traffic condition assessment and development of decision support system for real-time traffic management (Ma et al., 2012; Ma et al., 2010; Ma et al. 2009, Chowdhury et al and Bhavsar et al., 2007). Vanajakshi and Laurence (2004) found that when training data was limited, SVR performed better then ANN for predicting short term traffic. For the years between 1985 and 2004, Castro-Neto et al. (2009) used AADT values for urban and rural roads in 25 different counties in Tennessee for evaluating the performance of a modified version of SVR named SVR with Data-dependent Parameters (SVR-DP). An evaluation of the SVR- DP approach with the Ordinary OLS-regression methods and popular Holt Exponential Smoothing (Holt-ES) revealed that the SVR-DP outperformed both, although the Holt-ES also performed well for estimating AADT. 2.3 Different Methods for Imputing Missing Hourly Volume In order to execute traffic management and traffic flow pattern predictions, a reasonable amount of traffic count data is necessary, both temporally and spatially. The technologies used for traffic data collection often produce missing or erroneous data. In an attempt to mitigate these missing data, a variety of data imputation methods have been developed. These methods have been divided into three main types: interpolation-based, statistical 10
23 learning-based, and prediction-based. These methods are discussed in the following subsections Interpolation-based Imputation Methods In the Interpolation-based methods missing data is imputed using a weighted average of known data that is either pattern neighboring or temporal-neighboring. For example, in a study by Zhong et al. (2004) developed, Autoregressive Integrated Moving Average (ARIMA), neural network and regression models. The study found that regression models that are genetically designed based on data from before and after the imputation performed better than other methods. The average errors of these models were lower than 1%. A time-delay neural network and locally-weighted regression model were developed by Zhong et al. based on genetic algorithm which had higher accuracy than the traditional imputation models. For the genetically designed neural network model and regression model the 95 th percentile errors were below 6% and 2% respectively. Imputation accuracy of the models is influenced to some extent by the underlying traffic pattern, revealed by the study results based on sample traffic counts from different functional classes and trip pattern groups. However, it is clear that in most cases, genetically designed regression models can bound the 95th percentile errors to less than 5% (Zhong et al. 2004) Statistical Learning-Based Imputation Methods Statistical feature of traffic flow is used in the statistical learning-based methods. The method assumes a special probability distribution of the experiential data. Using this method missing data are imputed using the data that best fit the assumed probability 11
24 distribution. Robust Principal Component Analysis (PCA) was applied by Qu et al. (2009) to filter the unusual traffic flow data that disturb the imputation process. In addition to this, the authors compared the performance of PPCA/Bayesian PCA-based imputation algorithms with different conventional methods (i.e. nearest/mean historical imputation methods and the local interpolation/regression methods). The results from the study revealed that, the PPCA based methods reduced the root-mean-square imputation error by at least 25% than the conventional methods. In order to predict the freeway travel time, Van Lint (2005) developed a framework that exploits a recurrent neural network topology which is called state space neural network (SSNN). The SSNN is designed based on the layout of the freeway stretch of interest. This proposed SSNN combines the traffic related design with the generality of the neural network approaches. In this method simple imputation methods like spatial interpolation and exponential forecasts are used for imputing missing data. Results from the study revealed that, SSNN generated a MRE of 1.5% and a standard deviation of the relative error of 6.5% on the larger data set. However, on the smaller set, the errors increased within a reasonable range. Asif et al. (2013) proposed methods that can construct a low-dimensional representation of large and diverse networks in the presence of missing historical and neighboring data to reconstruct data profiles for road segments, and impute missing values. They use Fixed Point Continuation with Approximate SVD (FPCA) and Canonical Polyadic (CP) decomposition for incomplete tensors to solve the problem of missing data. They concluded that FPCA and CP-WOPT can reconstruct traffic profiles with decent 12
25 accuracy, even from very sparse data sets. The methods work well for expressway networks as well as large urban settings containing a diverse set of road segments Prediction-Based Imputation Methods Two missing data imputation methods were developed by Nelwamondo (2010); 1. Expectation Maximization (EM) Algorithm and 2. A combination of auto-associative Neural Networks and Genetic Algorithm. These two types of methods performed differently based on the relationship among the independent variables. Results for the study revealed that, Expectation Maximization performs better when the input variables are either independent or minimally related to each other. However, the combination of autoassociative neural network and genetic algorithm performed well when there are some inherent non-linear relationships between some of the given variables. In order to impute the holiday traffic, Liu et al. (2008) developed a K-nearest neighbor (K-NN). The k-nn method is a data-driven non-parametric regression method which is renowned for modeling unusual conditions. Regardless of the season that holidays are observed and how high or low the traffic volumes are, their observed minimum estimation errors (MinARE) were always near zero, and their MARE and median errors (E50) were generally in the range of 6-10%. Regression models, Neural Network model that is designed with generic algorithm, the traditional factor method and Autoregressive Integrated Moving Average (ARIMA) models were used by Sharma et al. (2003) for missing hourly data imputation. They developed imputation models for different roadway functional classes and traffic pattern 13
26 groups using the data from 6 permanent count stations. Moreover, they tested how the accuracy of imputation using these methods effect the estimation of AADT and DHV. Study results revealed that the AADT and DHV estimation models are higher for the traditional factor method. The study results also showed that among the different methods studied in this study, genetically designed neural network produced the least error in estimation AADT and DHV. 14
27 CHAPTER THREE RESEARCH METHOD 3.1 Overview The two major objectives of this research were to develop models to estimate AADT for the different functional classes of roadways in South Carolina, and to develop models for imputing missing hourly volume for the permanent traffic count stations. In order to develop models for estimating AADT, two Artificial Intelligence (AI) paradigms (i.e., Artificial Neural Network and Support Vector Regression) have been used. Following the development of the models, the results were evaluated and were compared with the traditional factor based AADT estimation method currently used by SCDOT and a traditional regression analysis method for different roadway functional classes. To develop models for imputing missing hourly volume, two Artificial Intelligence paradigms have been used and the results were compared with the historical average method of missing data imputation currently used by SCDOT. In this chapter the Artificial Intelligence paradigms that have been used in this study have been introduced. Each step of the method for developing the models for estimating AADT and imputing missing hourly volume is descried in greater depth. 3.2 AADT Estimation Using Machine Leaning Techniques This section outlines the methods used in the AADT estimation model development using Artificial Intelligence. Figure 3-1 illustrates five- phased method followed for 15
28 developing of AADT estimation models using AI (Please see section for detail information). a) Urban Principal Arterial- Interstate and Expressways b) Rural Principal Arterial- Interstate c) Urban Principal Arterial Other d) Rural Principal Arterial- Other e) Combination of All Functional Classes Each of the phases are described in detail in the following section Phase 1: ATR Data Collection The AADT estimation models were developed for different functional class of roadways in South Carolina using two types of data. a) The hourly volume collected from all permanent count stations operating 365 days a year for the year b) Census data collected from the census database to represent socio-economic characteristics of cities where permanent count stations are located. SCDOT maintains a total number of 150 permanent count stations (i.e., ATR) on different functional classes with most on higher volume highways (Figure 3-2) and Figure 3-3 shows a sample of the data reported in the website. For this research, hourly volume counts for all ATRs were collected for year
29 Data Collection Phase 1 Data preparation Phase 2 Feature selection Phase 3 Training data Test data AADT estimation model development using machine learning Phase 4 Evaluation of the AADT estimation models Phase 5 Figure 3-1 AADT Estimation Method 17

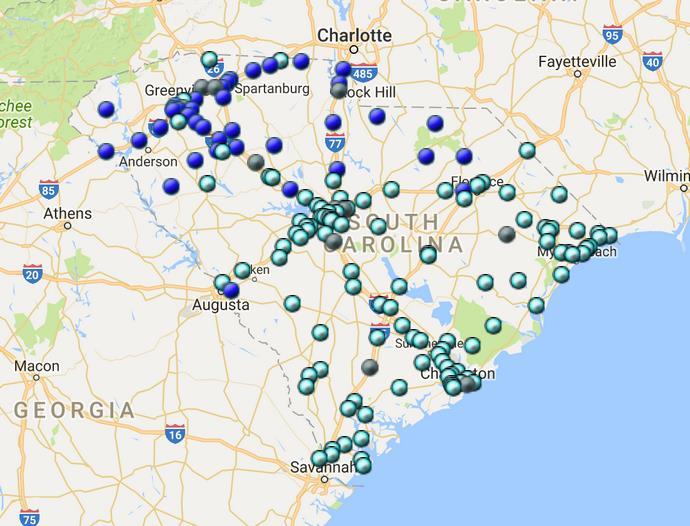
30 Figure 3-2 ATR Locations in South Carolina (Source: 18
 Data is collected from the SCDOT website using an interactive web crawling model developed in Python 2.7.10 using a library called Selenium (Muthukadan, 2016).")
31 Figure 3-3 Sample One-day Data for Station Table of Contents (Source: Data is collected from the SCDOT website using an interactive web crawling model developed in Python using a library called Selenium (Muthukadan, 2016). Selenium library is an Application program interface (API) on the object Web driver. Web driver works as a browser which can load a website and interacts with the different page elements. Web driver has the capability to fill forms and crawl through the web site like a human user and simulate mouse clicks (Web scraping 2016). Figure 3-4 presents the data 19
32 collection procedure from the SCDOT website for collecting data from the 134 ATR stations using selenium Web Driver. According to the Traffic Monitoring Guide, the presence of missing data in the permanent count stations can produce biased AADT (TMG, 2014). Therefore, the ATRs with more than six months missing data were not used for developing the models. Data were collected for the year of 2011 for the all the 134 ATRs. Hourly counts for a day was removed from the records if any hourly volume for that day was missing, caused by data collection equipment hardware or software malfunctions, or loss of data package during transmission in intelligent transportation systems (Qu et al. 2009). Launch Internet browser using selenium web driver Navigate through the URL of the website containing the desired ATR data Search the page element that contains the test box with date Extract the 24 hourly volume and save Search for the page element that contains the 24 hourly volume for that particular date Type the desired date then simulate mouse click to browse the page for updating the ATR data Figure 3-4 Data collection method In addition, census data was collected considering land use around ATRs (Smith, 2016). The census data used for developing the models are Income Employment Percent below poverty Number of vehicles 20
33 Urban or rural Number of housing units All of these data were collected from the census database for the year In addition to these data, categorical features (Day of week and Month of Year) and another feature for number of lanes at each ATR were also used. A detailed description of the preparation of the data is discussed in next section Phase 2: Data Preparation In order to develop and evaluate the AI models using machine learning techniques, two types of features were used a) input features: hourly volume factors, socio economic data from census database, number of lane and categorical features (day of week, and hours of the day) b) target feature: AADT factor which is a factor obtained by diving the actual AADT of an ATR station by the 24 hourly volume of a day. Once the data are prepared the entire data set (i.e., one-year worth of hourly volume counts for all 117 ATRs) is separated into training and testing cases. a. Training Data: This data is for developing the learning algorithm for predicting AADT. As a rule of thumb for developing the AI models 2/3 (two-third) of the data from the data set is used for training purpose (Mitchell 1998). b. Test Data: This data is only used for testing the performance of the models developed using training data, and should be totally independent of the training data 21
34 set. In this study, 1/3 (one third) of the data from the data set is used for testing purpose. Following sections presents the detailed description about how the data were prepared for developing the models. Input Features 1 to 24- Hourly Volume Factor Data Preparation: To develop the AADT estimation models 24 hourly volume factors were used. The formula for developing the hourly volume factor is expressed below: Hourly volume factor for hour x = Traffic volume for hour x (e. g., traffic volume for 7AM 8AM on1st monday of january, 2011) (1) Sum of 24 hourly volume of that day Input Feature- Socio-economic Data Preparation: In addition to the 24 hourly factors the socio-economic information collected at zip-code level from the US census data were used. This data was obtained from a SCDOT sponsored research project (Islam at al., 2017). Input Feature- Categorical Features Preparation: Most AADT estimation models only used hourly volume (continuous features/variables) (Sharma et al and Sharma et al. 2001). In this study, however, the models were developed with continuous and categorical features, specifically i) day of week and ii) month of year. Dummy variables were used for creating these categorical features. For developing the day of week variables, one feature was developed for each day for a total of 7 features for seven days in a week. For example, if a particular hourly volume set is for Monday, then the Monday features were assigned 22
35 the value 1, and the features for the other days of the week were assigned 0. A similar method was used to develop the twelve month of the year categories. Target Feature Features Preparation: The target feature used in this study is a factor of the actual AADT calculated at the ATR locations called AADT factor (equation 2). AADT factor = AADT Sum of 24 hourly volume of that day (2) For each ATR, the AADT is computed by calculating a simple average mean of all the available hourly volume for a year as mentioned in the Traffic Monitoring Guide (TMG, 2016) Phase 3: Feature Selection Feature selection was performed in order to reduce the use of irrelevant/insignificant features in developing either classification or prediction models, and to improve the model performance (Langley, 1994). In this study, two types of feature selection methods were performed. Table 3-1 presents the feature selection methods applied for different types of data. The sequential feature selection method was used to select the best features from the 24 hourly volume. This method is a simple greedy search method which starts with an empty set of features. Eventually new features are added sequentially until the desired result from the criterion function is achieved. 23
36 Table 3-1 Feature Selection Methods Features Feature Selection Method Continuous features: 24 hourly volume factors Other features: i) Income ii) Employment iii) Percent below poverty iv) Number of vehicles v) Number of housing units vi) Day of week and vii) Month of year viii) Number of lane Sequential Feature Selection Cross Validation The models developed for each of the functional class were run through the feature selection algorithm for selecting the best hourly volume factors resulting in the least residual sum of square errors. Once the best continuous features (hourly volume factors) were selected, the other features (census data and categorical) were combined to find the least error for predicting the target values/features using MATLAB Phase 4: AADT Estimation Model Development Using Artificial Intelligence Once the continuous features were selected using the sequential feature selection method, and the other features (socio-economic variables and categorical features) were selected utilizing the cross validation method the models were developed using Artificial Neural Network (ANN) and Support Vector Regression (SVR). As mentioned earlier, separate models were developed for 5 functional classes of roadways of South Carolina 24
37 Each of the 5 functional class was then divided into different models based on the combination of different input features. Table 3-2 presents the combination of the features in different candidate models for each functional class. Table 3-2 List of Models and Input features for Different Functional Classes Model Model 1 Model 2 Model 3 Model 4 Model 5 Input features Number of Lane, Day, Month, Income, Employment, Percent Below Poverty, Vehicles, Housing Unit, Hourly Volume Factors Day, Month, Hourly Volume Factors Vehicles, Housing Unit, Hourly Volume Factors Individual Day Model: Month, Hourly Volume Factors Individual Month Model: Day, Hourly Volume Factors As mentioned earlier, the models were developed using two artificial intelligence paradigms, following sections discussed in detail how the models were developed using them. Model Development Using Artificial Neural Network: Artificial Neural Network (ANN) is one of the most widely adapted alternatives to linear regression, logistic regression, time-series analysis, which are commonly used for developing predictive models (Tu, 1996). It has been used for successful pattern recognition, generalization and trend prediction (Sharma et al. 1999). In this study a multilayered, feed-forward, backpropagation neural network for supervised learning was used. The developed neural network model consists of three layers: the input layer, the hidden layer and an output layer. This ANN model is named as a feed-forward network as it feeds the output of one layer to another. A tan-sigmoid transfer function was used for calculating the output from each 25
38 neuron. One of the remarkable characteristics of a back-propagation neural network is its ability to propagate the effects of error backward through the network after every training case (Leverington, 2009); thus this algorithm was chosen for estimating AADT. The training algorithm selected was the Levenberg-Marquardt, which is recommended for most of the prediction problems unless the data set is too noisy and small (Demuth et al., 1992). In this study, the author ran different ANN models with a different number of hidden neurons, with those neurons providing the least RMSE used for model development. The number of hidden neuron used in this study is varies based on models. Figure 3-5 presents a sample neural network model, the calculation of the input and target features are detailed in section
39 Hourly volume factors Input neurons Hidden neurons Output neuron AADT factor Figure 3-5 Sample Neural Network Model Model Developed using Support Vector Regression: The SVM method has been successfully applied for classification and regression analysis via the construction of either one or more hyperplanes in a higher dimensional space. Developed as an extension of the nonlinear models of the generalized portrait algorithm, the SVM is based on the Vapnik- Chervonenkis (VC) and the statistical learning theories. 27
40 In order to perform the regression SVR executes two steps, first it performs nonlinear regression by mapping the training samples onto a high-dimensional, kernel-induced feature space. After that a liner regression is performed (Drucker, 1999). Figure 3-6 presents an overview of support vector regression. Training samples Hourly volume factors and other input features SVR Training Radialbasis kernel Test samples Input features Trained SVR model Predicted AADT factor Figure 3-6 Overview of SVR model (Adopted from Bhavser et al. 2007) Although the basic theories of SVR and SVM are very similar they have their differences too. In case of SVM there is a finite number of classifier but SVR has infinite number of target output within the training data. As a result, SVR tends to give any possible value in the output space from a group of input vectors. In this study, MATLAB LIBSVM library tool in MATLAB (version 2013b) (Chang and Lin 2011) is used. The parameters used for SVR are C, ɣ and ɛ. C values varied for different combination of input features and for the models developed under different roadway 28
41 functional classes. Different C and ɣ values were tested by increasing the value of n in exponential order (i.e., 2 n ). The range of C is from 8 to 16 and the range for γ is -8 to 0 with a step of 2 increment. Once the C and ɣ values were determined using the grid search method and the ɛ value was found using cross validation. The value of the set of parameters varied from model to model with the change in training data. 3.3 Imputation of Missing Hourly Volume for ATRs Using Artificial Intelligence This section outlines the method of developing missing hourly volume imputation models using Artificial Intelligence. The seven-phase method is presented in Figure 3-6. Each of the phases are described in detail in the following sections Phase 1 and 2: ATR selection and Data Collection ATRs collect hourly volume 365 days a year. However, it was observed that there were a significant number of missing values in the collected data set at almost all ATRs. In this research, the author obtained hourly volume from 20 permanent count stations on the urban principal arterial- interstate, from 21 permanent count stations on the rural principal arterial- interstate and from 7 ATRs on urban principal arterial- other functional class of roadways for the year The hourly volume from different permanent count stations were collected from SCDOT. The data in this database did not contain any type of imputation or manipulation of hourly volume. Similar to data used for developing the AADT estimation models, two types of input features were used for missing hourly volume imputation models: a) Hourly volume available before the missing hours data 29
42 b) Categorical data: day of week, month of year and direction of traffic. Selection of ATR sites Phase 1 Data collection Phase 2 Data preparation Phase 3 Hourly volume normalization Phase 4 Feature selection Phase 5 Test data Training data Phase 7 Evaluate the AI models Develop AI models for missing hour data imputation using SVR and ANN Phase 6 Figure 3-6 Method for missing hourly volume imputation 30
43 3.3.2 Phase 3: Data Preparation Data preparation is one of the most important steps for developing models. For developing these models, the following features were used a) input features: hourly volume before the missing hours (12AM-12AM data before the assumed missing hour data) and categorical features (Day of week, Month of Year and Direction of Traffic) b) target feature: Hourly volume that was missing from the permanent count stations. While developing the models it was assumed continuous 8 hours of data were missing, hence the target feature was the hourly volume from the hour 12AM- 8AM. Section presents how the input and target features are selected Phase 4: Hourly Volume Normalization Once the hourly volume was prepared in the previous phase, it was necessary to normalize data (both input hourly volume features and the target features) for the models developed under different functional classes. The data were normalized using the following formula: Normalized hourly volume = Absolute ( X X mean std (x) ) X= hourly volume for a particular hour Xmean= mean of the hourly volume for a particular hour for a year std (x) = Standard deviation of the hourly volume for a particular hour for a year 31
44 3.3.4 Phase 5: Feature Selection Feature selection methods were applied to select the significant features for the missing hourly volume imputation models. The hourly volume features were selected using the sequential feature selection method. Once the best hourly volume features were selected, different combinations of the categorical features were combined to find the combination resulting in the least RMSE values Phase 6: Model Development Using Machine Learning Techniques As discussed in the previous section, a combination of the hourly volume and the categorical data were prepared for different functional classes. The models were developed for the following roadway functional classes a. Urban Principal Arterial- Interstate and Expressways b. Rural Principal Arterial- Interstate c. Urban Principal Arterial Other In this study, for each of the three functional class of roadways, following 4 models were developed to determine the model with least RMSE error. Table 3-3 List of Models and Input features for Different Functional Classes Model Model 1 Model 2 Model 3 Model 4 Input features Day, Month, Hourly Volume Available Before the Missing Hours Day, Month, Hourly Volume Available Before the Missing Hours Individual Day Model: Month, Hourly Volume Available Before the Missing Hours Individual Month Model: Day, Hourly Volume Available Before the Missing Hours 32
45 The next step prior to model development is separating the data into train and test cases. Similar to the models developed for AADT estimation, 2/3 of the data from the entire data set were used for training and development of the learning algorithm and 1/3 of the data were used for testing the developed algorithms. Model Development Using Artificial Neural Network: A multilayer feed forward neural network with back propagation learning was used for developing the missing hourly volume imputation models. The developed neural network consists of three layers: a) an input layer; b) a hidden layer; and c) an output layer). As this is a backpropagation algorithm, it has the ability to propagate the effects of error backward through the network after every training case, and this characteristic of the network to adjust error is one of the motivating factors for choosing this particular architecture of ANN for missing data imputation. The training algorithm used is Levenberg-Marquardt. In this study, trial and error method was performed to find the number of neurons that produce the minimum RMSE. The neural network model was implemented in MATLAB using the library function NNtool (Demuth, 1992). Model Development Using Support Vector Regression: In this study, a support Vector regression algorithm with radial basis kernel function was chosen from the MATLAB LIBSVM library tool in MATLAB (version 2013b) (Chang and Lin 2011). The parameters used for SVR are C, ɣ and ɛ. C values varied for different combination of input features and for the models developed under different functional classes. Different C and ɣ values were tested by increasing them in exponential order. i.e. 2 n, in the range of 8 to 16 for C and -12 to -4 for γ with a step of 2. Once the C and ɣ values were determined using the grid 33
46 search method the ɛ value was found using cross validation. The value of the set of parameters varied from model to model with the change in training data. 34
47 CHAPTER FOUR ANALYSIS AND RESULTS 4.1 Overview This chapter presents the results and analysis of the following two primary sections: 1. Estimation of Annual Average Daily Traffic (AADT) a. Evaluation of the estimated AADT using the artificial intelligence (AI) models developed with two machine leaning techniques (SVR and ANN) (section 4.2.1) b. Comparison of the estimated AADT using machine leaning techniques to Traditional Factor method used by SCDOT (section 4.2.2) c. Comparison of the estimated AADT using machine leaning techniques to an Ordinary Least Square Regression based method (section 4.2.3) 2. Imputation of Missing Hourly Volume from the ATR Stations a. Evaluation of the imputed missing hourly data using the models developed with two machine leaning techniques (SVR and ANN) (4.3.1) b. Comparison of the imputed hourly volume using machine leaning techniques to the historical average method used by SCDOT (4.3.2) 4.2 Evaluation of AI Models for Estimating Annual Average Daily Traffic This section presents the performance evaluation of the Artificial Intelligence (AI) models developed using two machine learning techniques. After that, the AADT estimated by the best AI models are compared to the AADT estimated by the traditional factor 35
48 method used by SCDOT. In addition, a comparison is conducted between the AADT estimated by the AI models and a regression based method. The performance of models is decided based on the Root Mean Square (RMSE) and Mean Average Percentage Error (MAPE) values. The formulas used for calculating RMSE and MAPE are given below For ith day, Root Mean Square Error (RMSE) = ( n i=1 (Yi yi)2 n )..(1) Mean Average Percentage Error (MAPE) = 1 n ( Yi yi ) * 100 (2) Y Yi = Actual AADT yi = Predicted AADT n = Number of observations Evaluation of Estimated AADT using Machine Learning Techniques In this section the evaluation of AI models developed for the 5 roadway functional classes (as discussed in section 3.2.4) is presented. Prior to present the results from the models, the steps performed for developing the models are discussed Input and target feature calculation for ANN and SVR models Section presents the formula for calculating the input features and target feature. In this section, a sample calculation of these features for one of the ATRs from principal arterial is presented (Please see Table 4-1). 36
49 Input features calculation For an ATR in the Principal Arterial (ATR ID - 6) (Date: 01/03/2011) AADT = 77,500 and Sum of 24-hour volume from the day (01/03/2011) = 22,416 Volume for 1AM- 2 AM (Both direction) = 106 veh Volume for 2AM- 3 AM (Both direction) = 45 veh Volume for 3AM- 4 AM (Both direction) = 44 veh So the hourly volume factors (Input feature) are: Hourly volume factor for 12 AM- 1 AM (Both direction) = 106/ = (Column 26) Hourly volume factor for 1 AM- 2 AM (Both direction) = 291 / 22416= (Column 27) Hourly volume factor for 2 AM- 3 AM (Both direction) = 257 / = (Column 28) Column 9 to Column 25 (All columns are not shown in the figure) in Table 4-1 represents the categorical features. The date 1/3/2011 is a Monday, so the column for Monday (column 9) is assigned 1 and categorical features related to other days are assigned zero. Similarly, as the data is for January, column 15 for January is assigned 1 and the rest of the columns for the other 11 months are assigned 0 (Table 4-1 only shows the month January- March and Hourly volume from Hour 1-Hour 3 and Hour 23-Hour 24). 37
50 Apart from the hourly volume features and the categorical features, there are also socioeconomic features (Not shown in this table) listed in section Also Appendix B contains the list of socio-economic features used in this study. The number of lane for this ATR is 4 Target features calculation The target feature, AADT factor for Monday is calculated using the following formula: AADT factor = / = Table 4-1 presents the sample input and target features used for developing different AADT estimation models listed in Table

51 Table 4-1 Input and Target Features of AADT Estimation Models high 39
Traffic Data For Mechanistic Pavement Design
 NCHRP 1-391 Traffic Data For Mechanistic Pavement Design NCHRP 1-391 Required traffic loads are defined by the NCHRP 1-37A project software NCHRP 1-39 supplies a more robust mechanism to enter that data
Optimal Vehicle to Grid Regulation Service Scheduling
 Optimal to Grid Regulation Service Scheduling Christian Osorio Introduction With the growing popularity and market share of electric vehicles comes several opportunities for electric power utilities, vehicle
CHARACTERIZATION AND DEVELOPMENT OF TRUCK LOAD SPECTRA FOR CURRENT AND FUTURE PAVEMENT DESIGN PRACTICES IN LOUISIANA
 CHARACTERIZATION AND DEVELOPMENT OF TRUCK LOAD SPECTRA FOR CURRENT AND FUTURE PAVEMENT DESIGN PRACTICES IN LOUISIANA LSU Research Team Sherif Ishak Hak-Chul Shin Bharath K Sridhar OUTLINE BACKGROUND AND
Supervised Learning to Predict Human Driver Merging Behavior
 Supervised Learning to Predict Human Driver Merging Behavior Derek Phillips, Alexander Lin {djp42, alin719}@stanford.edu June 7, 2016 Abstract This paper uses the supervised learning techniques of linear
PROCEDURES FOR ESTIMATING THE TOTAL LOAD EXPERIENCE OF A HIGHWAY AS CONTRIBUTED BY CARGO VEHICLES
 PROCEDURES FOR ESTIMATING THE TOTAL LOAD EXPERIENCE OF A HIGHWAY AS CONTRIBUTED BY CARGO VEHICLES SUMMARY REPORT of Research Report 131-2F Research Study Number 2-10-68-131 A Cooperative Research Program
Sample Geographic Information System (GIS) Staffing and Response Time Report Virtual County Fire Department GIS Analysis
 Staffing and Response Time Report Virtual County Fire Department GIS Analysis") Sample Geographic Information System (GIS) Staffing and Response Time Report Fire Department GIS Analysis Executive Summary This study examines predicted response times and geographic coverage areas for
Sample Geographic Information System (GIS) Staffing and Response Time Report Fire Department GIS Analysis Executive Summary This study examines predicted response times and geographic coverage areas for
Development of Weight-in-Motion Data Analysis Software
 Development of Weight-in-Motion Data Analysis Software Rafiqul A. Tarefder and Md Amanul Hasan Abstract While volumetric data were sufficient for roadway design in the past, weight data are needed for
Engineering Dept. Highways & Transportation Engineering
 The University College of Applied Sciences UCAS Engineering Dept. Highways & Transportation Engineering (BENG 4326) Instructors: Dr. Y. R. Sarraj Chapter 4 Traffic Engineering Studies Reference: Traffic
From Developing Credit Risk Models Using SAS Enterprise Miner and SAS/STAT. Full book available for purchase here.
 From Developing Credit Risk Models Using SAS Enterprise Miner and SAS/STAT. Full book available for purchase here. About this Book... ix About the Author... xiii Acknowledgments...xv Chapter 1 Introduction...
Preface... xi. A Word to the Practitioner... xi The Organization of the Book... xi Required Software... xii Accessing the Supplementary Content...
 Contents Preface... xi A Word to the Practitioner... xi The Organization of the Book... xi Required Software... xii Accessing the Supplementary Content... xii Chapter 1 Introducing Partial Least Squares...
Journey into quality for traffic monitoring equipment. Short session monitoring operations
 Journey into quality for traffic monitoring equipment Short session monitoring operations Introduction Quality assurance/quality control for short session portable equipment. Historically, quality assurance/quality
Who has trouble reporting prior day events?
 Vol. 10, Issue 1, 2017 Who has trouble reporting prior day events? Tim Triplett 1, Rob Santos 2, Brian Tefft 3 Survey Practice 10.29115/SP-2017-0003 Jan 01, 2017 Tags: missing data, recall data, measurement
CITY OF EDMONTON COMMERCIAL VEHICLE MODEL UPDATE USING A ROADSIDE TRUCK SURVEY
 CITY OF EDMONTON COMMERCIAL VEHICLE MODEL UPDATE USING A ROADSIDE TRUCK SURVEY Matthew J. Roorda, University of Toronto Nico Malfara, University of Toronto Introduction The movement of goods and services
Acceleration Behavior of Drivers in a Platoon
 University of Iowa Iowa Research Online Driving Assessment Conference 2001 Driving Assessment Conference Aug 1th, :00 AM Acceleration Behavior of Drivers in a Platoon Ghulam H. Bham University of Illinois
PREDICTION OF REMAINING USEFUL LIFE OF AN END MILL CUTTER SEOW XIANG YUAN
 PREDICTION OF REMAINING USEFUL LIFE OF AN END MILL CUTTER SEOW XIANG YUAN Report submitted in partial fulfillment of the requirements for the award of the degree of Bachelor of Engineering (Hons.) in Manufacturing
Technical Memorandum Analysis Procedures and Mobility Performance Measures 100 Most Congested Texas Road Sections What s New for 2015
 Technical Memorandum Analysis Procedures and Mobility Performance Measures 100 Most Congested Texas Road Sections Prepared by Texas A&M Transportation Institute August 2015 This memo documents the analysis
TRAFFIC SIMULATION IN REGIONAL MODELING: APPLICATION TO THE INTERSTATEE INFRASTRUCTURE NEAR THE TOLEDO SEA PORT
 MICHIGAN OHIO UNIVERSITY TRANSPORTATION CENTER Alternate energy and system mobility to stimulate economic development. Report No: MIOH UTC TS41p1-2 2012-Final TRAFFIC SIMULATION IN REGIONAL MODELING: APPLICATION
Development of the Idaho Statewide Travel Demand Model Trip Matrices Using Cell Phone OD Data and Origin Destination Matrix Estimation
 Portland State University PDXScholar TREC Friday Seminar Series Transportation Research and Education Center (TREC) 10-24-2016 Development of the Idaho Statewide Travel Demand Model Trip Matrices Using
Data envelopment analysis with missing values: an approach using neural network
 IJCSNS International Journal of Computer Science and Network Security, VOL.17 No.2, February 2017 29 Data envelopment analysis with missing values: an approach using neural network B. Dalvand, F. Hosseinzadeh
Act 229 Evaluation Report
 R22-1 W21-19 W21-20 Act 229 Evaluation Report Prepared for Prepared by Table of Contents 1. Documentation Page 3 2. Executive Summary 4 2.1. Purpose 4 2.2. Evaluation Results 4 3. Background 4 4. Approach
Quantifying Annual Bridge Cost by Overweight Trucks in South Carolina
 Clemson University TigerPrints All Theses Theses 5-2013 Quantifying Annual Bridge Cost by Overweight Trucks in South Carolina Linbo Chen Clemson University, linboc@clemson.edu Follow this and additional
Missouri Seat Belt Usage Survey for 2017
 Missouri Seat Belt Usage Survey for 2017 Conducted for the Highway Safety & Traffic Division of the Missouri Department of Transportation by The Missouri Safety Center University of Central Missouri Final
Predicting Solutions to the Optimal Power Flow Problem
 Thomas Navidi Suvrat Bhooshan Aditya Garg Abstract Predicting Solutions to the Optimal Power Flow Problem This paper discusses an implementation of gradient boosting regression to predict the output of
ESTIMATION OF VEHICLE KILOMETERS TRAVELLED IN SRI LANKA. Darshika Anojani Samarakoon Jayasekera
 ESTIMATION OF VEHICLE KILOMETERS TRAVELLED IN SRI LANKA Darshika Anojani Samarakoon Jayasekera (108610J) Degree of Master of Engineering in Highway & Traffic Engineering Department of Civil Engineering
Journal of Emerging Trends in Computing and Information Sciences
 Pothole Detection Using Android Smartphone with a Video Camera 1 Youngtae Jo *, 2 Seungki Ryu 1 Korea Institute of Civil Engineering and Building Technology, Korea E-mail: 1 ytjoe@kict.re.kr, 2 skryu@kict.re.kr
Intelligent Fault Analysis in Electrical Power Grids
 Intelligent Fault Analysis in Electrical Power Grids Biswarup Bhattacharya (University of Southern California) & Abhishek Sinha (Adobe Systems Incorporated) 2017 11 08 Overview Introduction Dataset Forecasting
2. LITERATURE REVIEW. Keywords: Design hourly factor ( K-factor), annual average daily traffic(aadt), design hour volume(dhv), road design
, annual average daily traffic(aadt), design hour volume(dhv), road design") Study on Estimating Design Hourly Factor Using Design Inflection Point Won Bum Cho Senior Researcher, Korea Institute of Civil Engineering and Building Technology, Korea Ph.D. Student, Department of Transportation
Study on Estimating Design Hourly Factor Using Design Inflection Point Won Bum Cho Senior Researcher, Korea Institute of Civil Engineering and Building Technology, Korea Ph.D. Student, Department of Transportation
Section 5. Traffic Monitoring Guide May 1, Truck Weight Monitoring
 Section 5 Traffic Monitoring Guide May 1, 2001 Section 5 Truck Weight Monitoring Section 5 Traffic Monitoring Guide May 1, 2001 SECTION 5 CONTENTS Section Page CHAPTER 1 INTRODUCTION TO TRUCK WEIGHT DATA
The Highway Safety Manual: Will you use your new safety powers for good or evil? April 4, 2011
 The Highway Safety Manual: Will you use your new safety powers for good or evil? April 4, 2011 Introductions Russell Brownlee, M.A. Sc., FITE, P. Eng. Specialize in road user and rail safety Transportation
DRIVER SPEED COMPLIANCE WITHIN SCHOOL ZONES AND EFFECTS OF 40 PAINTED SPEED LIMIT ON DRIVER SPEED BEHAVIOURS Tony Radalj Main Roads Western Australia
 DRIVER SPEED COMPLIANCE WITHIN SCHOOL ZONES AND EFFECTS OF 4 PAINTED SPEED LIMIT ON DRIVER SPEED BEHAVIOURS Tony Radalj Main Roads Western Australia ABSTRACT Two speed surveys were conducted on nineteen
Transportation Statistical Data Development Report BAY COUNTY 2035 LONG RANGE TRANSPORTATION PLAN
 Transportation Statistical Data Development Report BAY COUNTY 2035 LONG RANGE TRANSPORTATION PLAN Prepared for Bay County Transportation Planning Organization and The Florida Department of Transportation,
Linking the Alaska AMP Assessments to NWEA MAP Tests
 Linking the Alaska AMP Assessments to NWEA MAP Tests February 2016 Introduction Northwest Evaluation Association (NWEA ) is committed to providing partners with useful tools to help make inferences from
Travel Demand Modeling at NCTCOG
 Travel Demand Modeling at NCTCOG Arash Mirzaei North Central Texas Council Of Governments for Southern Methodist University The ASCE Student Chapter October 24, 2005 Contents NCTCOG DFW Regional Model
Exhibit F - UTCRS. 262D Whittier Research Center P.O. Box Lincoln, NE Office (402)
") UTC Project Information Project Title University Principal Investigator PI Contact Information Funding Source(s) and Amounts Provided (by each agency or organization) Exhibit F - UTCRS Improving Safety
UTC Project Information Project Title University Principal Investigator PI Contact Information Funding Source(s) and Amounts Provided (by each agency or organization) Exhibit F - UTCRS Improving Safety
Regularized Linear Models in Stacked Generalization
 Regularized Linear Models in Stacked Generalization Sam Reid and Greg Grudic Department of Computer Science University of Colorado at Boulder USA June 11, 2009 Reid & Grudic (Univ. of Colo. at Boulder)
MPO Staff Report Technical Advisory Committee: July 12, 2017
 MPO Staff Report Technical Advisory Committee: July 12, 2017 RECOMMENDED ACTION: 2 nd TAC Meeting with Kimley-Horn/WSB in Updating the Street/Highway Element of 2045 Metropolitan Transportation Plan. Matter
Oregon DOT Slow-Speed Weigh-in-Motion (SWIM) Project: Analysis of Initial Weight Data
 Project: Analysis of Initial Weight Data") Portland State University PDXScholar Center for Urban Studies Publications and Reports Center for Urban Studies 7-1997 Oregon DOT Slow-Speed Weigh-in-Motion (SWIM) Project: Analysis of Initial Weight Data
Portland State University PDXScholar Center for Urban Studies Publications and Reports Center for Urban Studies 7-1997 Oregon DOT Slow-Speed Weigh-in-Motion (SWIM) Project: Analysis of Initial Weight Data
Analyzing Crash Risk Using Automatic Traffic Recorder Speed Data
 Analyzing Crash Risk Using Automatic Traffic Recorder Speed Data Thomas B. Stout Center for Transportation Research and Education Iowa State University 2901 S. Loop Drive Ames, IA 50010 stouttom@iastate.edu
Applicability for Green ITS of Heavy Vehicles by using automatic route selection system
 Applicability for Green ITS of Heavy Vehicles by using automatic route selection system Hideyuki WAKISHIMA *1 1. CTI Enginnering Co,. Ltd. 3-21-1 Nihonbashi-Hamacho, Chuoku, Tokyo, JAPAN TEL : +81-3-3668-4698,
Alpine Highway to North County Boulevard Connector Study
 Alpine Highway to North County Boulevard Connector Study prepared by Avenue Consultants March 16, 2017 North County Boulevard Connector Study March 16, 2017 Table of Contents 1 Summary of Findings... 1
Conventional Approach
 Session 6 Jack Broz, PE, HR Green May 5-7, 2010 Conventional Approach Classification required by Federal law General Categories: Arterial Collector Local 6-1 Functional Classifications Changing Road Classification
Linking the Virginia SOL Assessments to NWEA MAP Growth Tests *
 Linking the Virginia SOL Assessments to NWEA MAP Growth Tests * *As of June 2017 Measures of Academic Progress (MAP ) is known as MAP Growth. March 2016 Introduction Northwest Evaluation Association (NWEA
GIS and GPS as useful tools to determine transportation noise levels
 GIS and GPS as useful tools to determine transportation noise levels D. Fabjan 1, D. Paliska 1 & S. Drobne 2 1 Faculty of Maritime Studies and Transportation, University of Ljubljana, Slovenia 2 Faculty
Subarea Study. Manning Avenue (CSAH 15) Corridor Management and Safety Improvement Project. Final Version 1. Washington County.
 Corridor Management and Safety Improvement Project. Final Version 1. Washington County.") Subarea Study Manning Avenue (CSAH 15) Corridor Management and Safety Improvement Project Final Version 1 Washington County June 12, 214 SRF No. 138141 Table of Contents Introduction... 1 Forecast Methodology
Subarea Study Manning Avenue (CSAH 15) Corridor Management and Safety Improvement Project Final Version 1 Washington County June 12, 214 SRF No. 138141 Table of Contents Introduction... 1 Forecast Methodology
APPENDIX C1 TRAFFIC ANALYSIS DESIGN YEAR TRAFFIC ANALYSIS
 APPENDIX C1 TRAFFIC ANALYSIS DESIGN YEAR TRAFFIC ANALYSIS DESIGN YEAR TRAFFIC ANALYSIS February 2018 Highway & Bridge Project PIN 6754.12 Route 13 Connector Road Chemung County February 2018 Appendix
National Road Safety Action Plan in China
 Sixth SHRP 2 Safety Research Symposium National Road Safety Action Plan in China Dr. Yan Wang July 14, 2011 Washington DC, USA Outline 1 Initiative of Road Safety Action Plan 2 Phase I 3 For Next Phase?
The major roadways in the study area are State Route 166 and State Route 33, which are shown on Figure 1-1 and described below:
 3.5 TRAFFIC AND CIRCULATION 3.5.1 Existing Conditions 3.5.1.1 Street Network DRAFT ENVIRONMENTAL IMPACT REPORT The major roadways in the study area are State Route 166 and State Route 33, which are shown
Real-time Bus Tracking using CrowdSourcing
 Real-time Bus Tracking using CrowdSourcing R & D Project Report Submitted in partial fulfillment of the requirements for the degree of Master of Technology by Deepali Mittal 153050016 under the guidance
BUILDING A ROBUST INDUSTRY INDEX BASED ON LONGITUDINAL DATA
 CASE STUDY BUILDING A ROBUST INDUSTRY INDEX BASED ON LONGITUDINAL DATA Hanover built a first of its kind index to diagnose the health, trends, and hidden opportunities for the fastgrowing auto care industry.
ACCIDENT MODIFICATION FACTORS FOR MEDIAN WIDTH
 APPENDIX G ACCIDENT MODIFICATION FACTORS FOR MEDIAN WIDTH INTRODUCTION Studies on the effect of median width have shown that increasing width reduces crossmedian crashes, but the amount of reduction varies
State Highway 32 East TIGER Discretionary Grant Application APPENDIX C - BENEFIT COST ANALYSIS REPORT
 State Highway 32 East TIGER Discretionary Grant Application APPENDIX C - BENEFIT COST ANALYSIS REPORT April 2016 I. COST-EFFECTIVENESS ANALYSIS A Benefit-Cost Analysis (BCA) was conducted in conformance
Speed Evaluation Saw Mill Drive
 Speed Evaluation Saw Mill Drive Prepared for: Mount Laurel Township Burlington County, New Jersey Prepared by: Dana Litwornia Litwornia & Associates, Inc. Transportation, Traffic & Environmental Engineering
Master of Engineering
 STUDIES OF FAULT CURRENT LIMITERS FOR POWER SYSTEMS PROTECTION A Project Report Submitted in partial fulfilment of the requirements for the Degree of Master of Engineering In INFORMATION AND TELECOMMUNICATION
Statistical Estimation Model for Product Quality of Petroleum
 Memoirs of the Faculty of Engineering,, Vol.40, pp.9-15, January, 2006 TakashiNukina Masami Konishi Division of Industrial Innovation Sciences The Graduate School of Natural Science and Technology Tatsushi
Data Mining Approach for Quality Prediction and Improvement of Injection Molding Process
 Data Mining Approach for Quality Prediction and Improvement of Injection Molding Process Dr. E.V.Ramana Professor, Department of Mechanical Engineering VNR Vignana Jyothi Institute of Engineering &Technology,
A Personalized Highway Driving Assistance System
 A Personalized Highway Driving Assistance System Saina Ramyar 1 Dr. Abdollah Homaifar 1 1 ACIT Institute North Carolina A&T State University March, 2017 aina Ramyar, Dr. Abdollah Homaifar (NCAT) A Personalized
Linking the North Carolina EOG Assessments to NWEA MAP Growth Tests *
 Linking the North Carolina EOG Assessments to NWEA MAP Growth Tests * *As of June 2017 Measures of Academic Progress (MAP ) is known as MAP Growth. March 2016 Introduction Northwest Evaluation Association
The Value of Travel-Time: Estimates of the Hourly Value of Time for Vehicles in Oregon 2007
 The Value of Travel-Time: Estimates of the Hourly Value of Time for Vehicles in Oregon 2007 Oregon Department of Transportation Long Range Planning Unit June 2008 For questions contact: Denise Whitney
EFFECT OF PAVEMENT CONDITIONS ON FUEL CONSUMPTION, TIRE WEAR AND REPAIR AND MAINTENANCE COSTS
 EFFECT OF PAVEMENT CONDITIONS ON FUEL CONSUMPTION, TIRE WEAR AND REPAIR AND MAINTENANCE COSTS Graduate of Polytechnic School of Tunisia, 200. Completed a master degree in 200 in applied math to computer
Integrating remote sensing and ground monitoring data to improve estimation of PM 2.5 concentrations for chronic health studies
 Integrating remote sensing and ground monitoring data to improve estimation of PM 2.5 concentrations for chronic health studies Chris Paciorek and Yang Liu Departments of Biostatistics and Environmental
EXECUTIVE SUMMARY. The following is an outline of the traffic analysis performed by Hales Engineering for the traffic conditions of this project.
 EXECUTIVE SUMMARY This study addresses the traffic impacts associated with the proposed Shopko redevelopment located in Sugarhouse, Utah. The Shopko redevelopment project is located between 1300 East and
Alberta Infrastructure HIGHWAY GEOMETRIC DESIGN GUIDE AUGUST 1999
 &+$37(5Ã)Ã Alberta Infrastructure HIGHWAY GEOMETRIC DESIGN GUIDE AUGUST 1999 &+$37(5) 52$'6,'()$&,/,7,(6 7$%/(2)&217(176 Section Subject Page Number Page Date F.1 VEHICLE INSPECTION STATIONS... F-3 April
CHAPTER 1 INTRODUCTION
 CHAPTER 1 INTRODUCTION 1.1 CONSERVATION OF ENERGY Conservation of electrical energy is a vital area, which is being regarded as one of the global objectives. Along with economic scheduling in generation
Collective Traffic Prediction with Partially Observed Traffic History using Location-Based Social Media
 Collective Traffic Prediction with Partially Observed Traffic History using Location-Based Social Media Xinyue Liu, Xiangnan Kong, Yanhua Li Worcester Polytechnic Institute February 22, 2017 1 / 34 About
DISTRIBUTION AND CHARACTERISTICS OF CRASHES AT DIFFERENT LOCATIONS WITHIN WORK ZONES IN VIRGINIA
 DISTRIBUTION AND CHARACTERISTICS OF CRASHES AT DIFFERENT LOCATIONS WITHIN WORK ZONES IN VIRGINIA Nicholas J. Garber Professor and Chairman Department of Civil Engineering University of Virginia Charlottesville,
Statistics and Quantitative Analysis U4320. Segment 8 Prof. Sharyn O Halloran
 Statistics and Quantitative Analysis U4320 Segment 8 Prof. Sharyn O Halloran I. Introduction A. Overview 1. Ways to describe, summarize and display data. 2.Summary statements: Mean Standard deviation Variance
TRAVEL DEMAND FORECASTS
 Jiangxi Ji an Sustainable Urban Transport Project (RRP PRC 45022) TRAVEL DEMAND FORECASTS A. Introduction 1. The purpose of the travel demand forecasts is to assess the impact of the project components
Small Scale-Wind Power Dispatchable Energy Source Modeling
 Small Scale-Wind Power Dispatchable Energy Source Modeling Jordan Cannon, David Moore, Stephen Eason, Adel El Shahat Department of Electrical Engineering, Georgia Southern University, USA Abstract Due
The 1997 U.S. Residential Energy Consumption Survey s Editing Experience Using BLAISE III
 The 997 U.S. Residential Energy Consumption Survey s Editing Experience Using BLAISE III Joelle Davis and Nancy L. Leach, Energy Information Administration (USA) Introduction In 997, the Residential Energy
HAS MOTORIZATION IN THE U.S. PEAKED? PART 2: USE OF LIGHT-DUTY VEHICLES
 UMTRI-2013-20 JULY 2013 HAS MOTORIZATION IN THE U.S. PEAKED? PART 2: USE OF LIGHT-DUTY VEHICLES MICHAEL SIVAK HAS MOTORIZATION IN THE U.S. PEAKED? PART 2: USE OF LIGHT-DUTY VEHICLES Michael Sivak The University
Linking the New York State NYSTP Assessments to NWEA MAP Growth Tests *
 Linking the New York State NYSTP Assessments to NWEA MAP Growth Tests * *As of June 2017 Measures of Academic Progress (MAP ) is known as MAP Growth. March 2016 Introduction Northwest Evaluation Association
Draft Project Deliverables: Policy Implications and Technical Basis
 Surveillance and Monitoring Program (SAMP) Joe LeClaire, PhD Richard Meyerhoff, PhD Rick Chappell, PhD Hannah Erbele Don Schroeder, PE February 25, 2016 Draft Project Deliverables: Policy Implications
Linking the Georgia Milestones Assessments to NWEA MAP Growth Tests *
 Linking the Georgia Milestones Assessments to NWEA MAP Growth Tests * *As of June 2017 Measures of Academic Progress (MAP ) is known as MAP Growth. February 2016 Introduction Northwest Evaluation Association
The Session.. Rosaria Silipo Phil Winters KNIME KNIME.com AG. All Right Reserved.
 The Session.. Rosaria Silipo Phil Winters KNIME 2016 KNIME.com AG. All Right Reserved. Past KNIME Summits: Merging Techniques, Data and MUSIC! 2016 KNIME.com AG. All Rights Reserved. 2 Analytics, Machine
Where are the Increases in Motorcycle Rider Fatalities?
 Where are the Increases in Motorcycle Rider Fatalities? Umesh Shankar Mathematical Analysis Division (NPO-121) Office of Traffic Records and Analysis National Center for Statistics and Analysis National
Simulating Trucks in CORSIM
 Simulating Trucks in CORSIM Minnesota Department of Transportation September 13, 2004 Simulating Trucks in CORSIM. Table of Contents 1.0 Overview... 3 2.0 Acquiring Truck Count Information... 5 3.0 Data
Professor Dr. Gholamreza Nakhaeizadeh. Professor Dr. Gholamreza Nakhaeizadeh
 Statistic Methods in in Data Mining Business Understanding Data Understanding Data Preparation Deployment Modelling Evaluation Data Mining Process (Part 2) 2) Professor Dr. Gholamreza Nakhaeizadeh Professor
Residential Lighting: Shedding Light on the Remaining Savings Potential in California
 Residential Lighting: Shedding Light on the Remaining Savings Potential in California Kathleen Gaffney, KEMA Inc., Oakland, CA Tyler Mahone, KEMA, Inc., Oakland, CA Alissa Johnson, KEMA, Inc., Oakland,
Linking the Florida Standards Assessments (FSA) to NWEA MAP
 to NWEA MAP") Linking the Florida Standards Assessments (FSA) to NWEA MAP October 2016 Introduction Northwest Evaluation Association (NWEA ) is committed to providing partners with useful tools to help make inferences
Linking the Florida Standards Assessments (FSA) to NWEA MAP October 2016 Introduction Northwest Evaluation Association (NWEA ) is committed to providing partners with useful tools to help make inferences
LONG RANGE PERFORMANCE REPORT. Study Objectives: 1. To determine annually an index of statewide turkey populations and production success in Georgia.
 State: Georgia Grant Number: 08-953 Study Number: 6 LONG RANGE PERFORMANCE REPORT Grant Title: State Funded Wildlife Survey Period Covered: July 1, 2010 - June 30, 2011 Study Title: Wild Turkey Production
Linking the Kansas KAP Assessments to NWEA MAP Growth Tests *
 Linking the Kansas KAP Assessments to NWEA MAP Growth Tests * *As of June 2017 Measures of Academic Progress (MAP ) is known as MAP Growth. February 2016 Introduction Northwest Evaluation Association (NWEA
UNDERSTANDING THE SIGNIFICANCE OF AXLE VERSUS LENGTH CLASSIFICATION ON AXLE FACTORS AND THE EFFECT ON AADT TO ENSURE RELIABLE TRAFFIC DATA
 WISCONSIN DOT CASE STUDY FINDINGS UNDERSTANDING THE SIGNIFICANCE OF AXLE VERSUS LENGTH CLASSIFICATION ON AXLE FACTORS AND THE EFFECT ON AADT TO ENSURE RELIABLE TRAFFIC DATA NATMEC 2014, Chicago, Illinois
Sharif University of Technology. Graduate School of Management and Economics. Econometrics I. Fall Seyed Mahdi Barakchian
 Sharif University of Technology Graduate School of Management and Economics Econometrics I Fall 2010 Seyed Mahdi Barakchian Textbook: Wooldridge, J., Introductory Econometrics: A Modern Approach, South
An Evaluation of the Relationship between the Seat Belt Usage Rates of Front Seat Occupants and Their Drivers
 An Evaluation of the Relationship between the Seat Belt Usage Rates of Front Seat Occupants and Their Drivers Vinod Vasudevan Transportation Research Center University of Nevada, Las Vegas 4505 S. Maryland
Linking the Indiana ISTEP+ Assessments to the NWEA MAP Growth Tests. February 2017 Updated November 2017
 Linking the Indiana ISTEP+ Assessments to the NWEA MAP Growth Tests February 2017 Updated November 2017 2017 NWEA. All rights reserved. No part of this document may be modified or further distributed without
Factors Affecting Vehicle Use in Multiple-Vehicle Households
 Factors Affecting Vehicle Use in Multiple-Vehicle Households Rachel West and Don Pickrell 2009 NHTS Workshop June 6, 2011 Road Map Prevalence of multiple-vehicle households Contributions to total fleet,
Linking the Mississippi Assessment Program to NWEA MAP Tests
 Linking the Mississippi Assessment Program to NWEA MAP Tests February 2017 Introduction Northwest Evaluation Association (NWEA ) is committed to providing partners with useful tools to help make inferences
FHWA/IN/JTRP-2000/23. Final Report. Sedat Gulen John Nagle John Weaver Victor Gallivan
 FHWA/IN/JTRP-2000/23 Final Report DETERMINATION OF PRACTICAL ESALS PER TRUCK VALUES ON INDIANA ROADS Sedat Gulen John Nagle John Weaver Victor Gallivan December 2000 Final Report FHWA/IN/JTRP-2000/23 DETERMINATION
NEW-VEHICLE MARKET SHARES OF CARS VERSUS LIGHT TRUCKS IN THE U.S.: RECENT TRENDS AND FUTURE OUTLOOK
 SWT-2017-10 JUNE 2017 NEW-VEHICLE MARKET SHARES OF CARS VERSUS LIGHT TRUCKS IN THE U.S.: RECENT TRENDS AND FUTURE OUTLOOK MICHAEL SIVAK BRANDON SCHOETTLE SUSTAINABLE WORLDWIDE TRANSPORTATION NEW-VEHICLE
Parks and Transportation System Development Charge Methodology
 City of Sandy Parks and Transportation System Development Charge Methodology March, 2016 Background In order to implement a City Council goal the City of Sandy engaged FCS Group in January of 2015 to update
1) The locomotives are distributed, but the power is not distributed independently.
 The locomotives are distributed, but the power is not distributed independently.") Chapter 1 Introduction 1.1 Background The railway is believed to be the most economical among all transportation means, especially for the transportation of mineral resources. In South Africa, most mines
Chapter 1 Introduction 1.1 Background The railway is believed to be the most economical among all transportation means, especially for the transportation of mineral resources. In South Africa, most mines
Featured Articles Utilization of AI in the Railway Sector Case Study of Energy Efficiency in Railway Operations
 128 Hitachi Review Vol. 65 (2016), No. 6 Featured Articles Utilization of AI in the Railway Sector Case Study of Energy Efficiency in Railway Operations Ryo Furutani Fumiya Kudo Norihiko Moriwaki, Ph.D.
Responsive Bus Bridging Service Planning Under Urban Rail Transit Line Emergency
 2016 3 rd International Conference on Vehicle, Mechanical and Electrical Engineering (ICVMEE 2016) ISBN: 978-1-60595-370-0 Responsive Bus Bridging Service Planning Under Urban Rail Transit Line Emergency
Machine Drive Electricity Use in the Industrial Sector
 Machine Drive Electricity Use in the Industrial Sector Brian Unruh, Energy Information Administration ABSTRACT It has been estimated that more than 60 percent of the electricity consumed in the United
Robust Fault Diagnosis in Electric Drives Using Machine Learning
 Robust Fault Diagnosis in Electric Drives Using Machine Learning ZhiHang Chen, Yi Lu Murphey, Senior Member, IEEE, Baifang Zhang, Hongbin Jia University of Michigan-Dearborn Dearborn, Michigan 48128, USA
INTERNATIONAL JOURNAL OF CIVIL AND STRUCTURAL ENGINEERING Volume 5, No 2, 2014
 INTERNATIONAL JOURNAL OF CIVIL AND STRUCTURAL ENGINEERING Volume 5, No 2, 2014 Copyright by the authors - Licensee IPA- Under Creative Commons license 3.0 Research article ISSN 0976 4399 The impacts of
CHAPTER 7: EMISSION FACTORS/MOVES MODEL
 CHAPTER 7: EMISSION FACTORS/MOVES MODEL 7.1 Overview This chapter discusses development of the regional motor vehicle emissions analysis for the North Central Texas nonattainment area, including all key
2018 Linking Study: Predicting Performance on the TNReady Assessments based on MAP Growth Scores
 2018 Linking Study: Predicting Performance on the TNReady Assessments based on MAP Growth Scores May 2018 NWEA Psychometric Solutions 2018 NWEA. MAP Growth is a registered trademark of NWEA. Disclaimer:
Investigating the Concordance Relationship Between the HSA Cut Scores and the PARCC Cut Scores Using the 2016 PARCC Test Data
 Investigating the Concordance Relationship Between the HSA Cut Scores and the PARCC Cut Scores Using the 2016 PARCC Test Data A Research Report Submitted to the Maryland State Department of Education (MSDE)
Linking the Indiana ISTEP+ Assessments to NWEA MAP Tests
 Linking the Indiana ISTEP+ Assessments to NWEA MAP Tests February 2017 Introduction Northwest Evaluation Association (NWEA ) is committed to providing partners with useful tools to help make inferences