Quantifying the Benefits of Bus Rapid Transit Elements
|
|
|
- Pierce Dawson
- 6 years ago
- Views:
Transcription


1 Quantifying the Benefits of Bus Rapid Transit Elements August 2010 FTA-DC


2 Quantifying the Benefits of Bus Rapid Transit Elements Funded by the Federal Transit Administration Project Manager: Helen M. Tann Transportation Program Specialist FTA Office of Mobility Innovation 1200 New Jersey Avenue, SE Washington, DC
3 Quantifying the Benefits of Bus Rapid Transit Elements Project Team: William Vincent, Breakthrough Technologies Institute John Niles, Global Telematics Elizabeth Delmont, Breakthrough Technologies Institute Sandra Curtin, Breakthrough Technologies Institute August 2010 NOTICE This document is disseminated under the sponsorship of the U.S. Department of Transportation in the interest of information exchange. The United States Government assumes no liability for its contents or use thereof. The United States Government does not endorse products of manufacturers. Trade or manufacturers names appear herein solely because they are considered essential to the objective of this report. 2
4 ACKNOWLEDGMENTS The authors wish to thank Mr. Walter Kulyk, Mr. Venkat Pindiprolu, and Ms. Helen Tann of FTA s Office of Mobility Innovation for their support and guidance in implementing this project. The authors also want to thank the many organizations that participated in the workshop organized at the beginning of this project, including: Chicago Transit Authority Center for Urban Transportation Research/National Bus Rapid Transit Institute, University of South Florida Federal Transit Administration Lane Transit District City of Los Angeles Maryland Transit Administration Montgomery County DOT Nelson/Nygaard Pace Suburban Bus Parsons Brinckerhoff Santa Clara VTA University of Washington Washington State DOT Washington Metropolitan Area Transit Authority The World Bank The authors would also like to thank the transit agencies that provided data for this project: Los Angeles County Metropolitan Transportation Authority TransLink Vancouver, British Columbia Metro Transit King County, Washington Chicago Transit Authority Lane Transit District, Eugene, Oregon Regional Transportation Commission of Southern Nevada, Las Vegas Kansas City Area Transportation Authority Washington Metropolitan Area Transit Authority York Region Transit, Ontario 3
5 REPORT DOCUMENTATION PAGE 1. AGENCY USE ONLY (Leave blank) 2. REPORT DATE August TITLE AND SUBTITLE Quantifying the Benefits of Bus Rapid Transit Elements 6. AUTHOR(S William Vincent, John Niles, Elizabeth Delmont, Sandra Curtin Form Approved OMB No REPORT TYPE AND DATES COVERED 5. FUNDING/GRANT NUMBER DC PERFORMING ORGANIZATION NAME(S) AND ADDRESS(ES) Breakthrough Technologies Institute Global Telematics 1100 H Street, NW. Suite th Avenue West, Suite 111 Washington, DC Seattle, Washington SPONSORING/MONITORING AGENCY NAME(S) AND ADDRESS(ES) Federal Transit Administration U.S. Department of Transportation Website: 1200 New Jersey Avenue, SE Washington, DC SUPPLEMNTARY NOTES 8. PERFORMING ORGANIZATION REPORT NUMBER 10. SPONSORING/MONITORING AGENCY REPORT NUMBER FTA-DC a. DISTRIBUTION/AVAILABILITY STATEMENT 12b. DISTRIBUTION CODE Available From: National Technical Information Service (NTIS), Springfield, VA Phone , Fax , [orders@ntis.gov] 13. ABSTRACT (Maximum 200 words). The purpose of this study was to quantify the benefits of elements of Bus Rapid Transit. Data was collected through voluntary surveys sent to transit agencies across North America, and information was solicited from European systems as well. The final data set included information on 119 individual rapid bus and BRT lines from 9 different transit agencies across North America. Agencies included Los Angeles, Eugene, King County, Vancouver, Las Vegas, Chicago, Kansas City, Washington D.C., and York Region. From the collected data, datasets were built for the AM peak, PM peak, and the combined AM/PM Peak. A stepwise regression was conducted using travel time as the dependant variable. Independent variables included route length, station density, dedicated lanes, traffic signal priority (TSP), low floor buses, and number of boarding doors. The effects of other BRT elements, such as off-board fare collection, are believed to be implicitly captured by the model. The results found significant and consistent travel time benefits for a number of BRT elements. However, the travel time benefits for TSP were not conclusive, in some cases showing decreased travel times, while in other cases showing increased travel times. Additional research is needed to better understand the travel time benefits of TSP. Moreover, future research would benefit from standardized data reporting and collection, to ensure that metrics and data are consistent across transit agencies. 14. SUBJECT TERMS: Bus rapid transit, BRT, elements, components, travel time savings, benefits, rapid bus 15. NUMBER OF PAGES PRICE CODE 17. SECURITY CLASSIFICATION OF REPORT Unclassified 18. SECURITY CLASSIFICATION OF THIS PAGE Unclassified 19. SECURITY CLASSIFICATION OF ABSTRACT Unclassified 20. LIMITATION OF ABSTRACT 4
6 5
7 Contents ACKNOWLEDGMENTS... 3 LIST OF FIGURES... 7 LIST OF TABLES... 8 TABLE OF ACRONYMS... 9 FOREWORD EXECUTIVE SUMMARY I. INTRODUCTION a. Background b. Study Objectives c. Approach II. STUDY CONTEXT a. Defining BRT b. Description of BRT Routes Included in the Study i. Los Angeles, California- Metro Rapid and Orange Line Busway ii. Vancouver, British Columbia B-Line and TransLink Frequent Service Network iii. King County, Washington King County Metro iv. Chicago, Illinois - Express and Limited Bus Lines v. Eugene and Springfield, Oregon- EmX vi. Las Vegas, Nevada - MAX vii. Kansas City, Missouri - MAX viii. Washington, DC Metro Area Express Bus Service ix. York Region, Ontario - VIVA III. LITERATURE REVIEW a. Running Way b. Stations c. Vehicles d. Fare Collection e. Intelligent Transportation Systems f. Service and Operations g. Branding IV. QUANTIATIVE ASSESSMENT OF BRT ELEMENTS a. Purpose b. Methodology i. Workshop ii. Developing the Surveys iii. Developing the Model c. Results i. Station Density ii. Low Floor Buses iii. Number of Boarding Doors iv. Transit Signal Priority Density v. Dedicated Bus Lanes vi. Route Length d. Key Findings and Conclusions CONCLUSION REFERENCES APPENDICES Appendix 1 PM Correlation Table
8 Appendix 2 Surveys for Transit Agencies Appendix3 Cost of BRT Elements LIST OF FIGURES Figure 1: Curitiba BRT vehicle at station Figure 2: Eugene EmX BRT Figure 4: Los Angeles Rapid Bus Figure 5: Los Angeles Orange Line Bus Way Figure 6: B8017 running 99 B-Line Broadway Station at UBC Loop Figure 7: King County Metro 60 foot diesel, low floor, articulated bus Figure 8: Chicago Transit Authority Figure 9: EmX New Flyer DE60LFA Figure 10: Las Vegas MAX Vehicle Figure 11: Kansas City MAX Station Figure 12: Washington, DC Metrobus route 42 headed to Mount Pleasant Figure 13: York Region Transit, Ontario Figure 14 York University VIVA Station Figure 15: High Platform Station and Bus, Mexico City, Mexico Figure 16: Los Angeles Metro Rapid Logo Figure 17: Metro Rapid System Map
9 LIST OF TABLES Table ES1. Summary of Key Findings Table 1: Bus Route Characteristics Table 2: Select Reported Travel Time Reduction Table 3: Major Findings Related to Travel Time Savings Contained in BRT Performance Analyses Table 4: Typical or Estimated Effects of BRT Components and Conditions on Travel Time Table 5: BRT Systems and Types of Dedicated Lanes Table 6: Station Design And Amenities By BRT System Table 7: Typical U.S. and Canadian BRT Vehicle Dimensions and Capacities Table 8: Passenger Service Times by Floor Types Table 9: Multiple Channel Passenger Service Times per Total Passenger with a High-Floor Bus Table 10: Bus Passenger Service Times (sec/passenger) Table 11: Travel Time Effects of Station Spacing and Dwell Times Table 12: AM Correlation Table Table 13: Coefficients Table 14: BRT Element by Time Savings and Cost
10 TABLE OF ACRONYMS AVL Automatic Vehicle Location BRT Bus Rapid Transit BTI Breakthrough Technologies Institute CNG Compressed Natural Gas CTA Chicago Transit Authority CUTR Center for Urban Transportation Research DOT Department of Transportation FTA Federal Transit Administration GPS Global Positioning System ICE Internal Combustion Engine ITS Intelligent Transport Systems KCATA Kansas City Area Transportation Authority LNG Liquefied Natural Gas LTD Lane Transit District RITA Research and Innovation Technology Administration RTC Regional Transportation Commission of Southern Nevada TCRP Transit Cooperative Research Program TRB Transportation Research Board TSP Transit Signal Priority WMATA Washington Metropolitan Area Transit Authority YRT York Region Transit 9

11 FOREWORD Public transportation is a key strategy to address critical national issues such as climate change, air pollution, urban congestion, and energy security. Buses are the workhorse of the US transit industry, serving more trips than all other modes combined. 1 Improving bus service, therefore, has substantial potential to address these issues of national importance while, at the same time, improving quality of life in urban areas. Figure 1: Curitiba BRT vehicle at station (Courtesy: Jaime Lerner Institute) Bus Rapid Transit (BRT) was first implemented in Curitiba, Brazil nearly four decades ago but is relatively new in the United States, with systems currently implemented in Los Angeles, California, Eugene, Oregon, and Cleveland, Ohio. However, many US transit agencies have adopted elements of BRT systems as a way to improve local bus service operating in general traffic. Often referred to as rapid bus, these services frequently use traffic signal priority, increased stop spacing, high service frequencies, and other strategies to reduce travel 2 time and improve the customer experience. This is the first project designed to quantify benefits of various BRT and rapid bus elements across a substantial sample of North American rapid bus and BRT routes. It is the result of a collaborative effort with industry, including a workshop with transit operators and other stakeholders to discuss project goals and approach. Project staff also worked extensively with agencies on data development. This project is intended to provide guidance on the performance benefits of various BRT strategies and to encourage additional research in this area. This project was conducted by the Breakthrough Technologies Institute (BTI) and Global Telematics under a Cooperative Agreement with the FTA. BTI is a not-for-profit (501(c)(3)) based in Washington, DC. Global Telematics is a policy research and consulting firm located in Seattle, Washington. 1 Dickens, Matthew and John Neff Public Transportation Fact Book, 61 st Edition. American Public Transportation Association. P Bus Rapid Transit: Why More Communities Are Choosing Bus Rapid Transit. Transportation Research Board P.1 10
12 EXECUTIVE SUMMARY Bus transit in the United States is often perceived as slow, unreliable, and subject to delays caused by operating in congested general traffic. Yet bus transit is the workhorse of public transportation, serving more trips than all other modes combined. It is therefore critical to find ways to improve the speed, reliability, and image of bus service. Bus Rapid Transit (BRT) is designed to do just that. There are seven overarching elements of BRT that are outlined in the Federal Transit Administration s Characteristics of Bus Rapid Transit for Decision-Making: Running Ways; Stations; Vehicles; Fare Collection; Intelligent Transportation Systems; Service and Operations Plans; and Branding Elements. Although a few US transit agencies have implemented all of these characteristics in specific corridors, many more have chosen to adopt one or more of these characteristics to enhance local bus service. Known as rapid bus, these systems typically use traffic signal priority, greater service frequency, low floor buses, cash-less fare collection, and branding to increase bus speeds and to make bus services more attractive to customers. The concept of this research was to develop metrics regarding the elements of BRT, build a database of as many rapid bus and BRT routes as possible, and to conduct a stepwise regression analysis to isolate the impact of specific BRT elements on route time. The goal was to provide guidance on which BRT elements appear to have the greatest impact on route time. Route time was selected because it is an important component of customer satisfaction and because reduced route times can result in significant cost savings for transit operators, as well as reductions in emissions and fuel consumption. A workshop was held at the 2009 annual meeting of the Transportation Research Board (TRB), where more than thirty representatives from industry and academia were briefed on the project plan and offered the opportunity to provide feedback. Feedback was incorporated into the project plan and several transit operators volunteered to provide data. Project staff developed spreadsheets (see Appendix 2) and populated them with data from publicly available sources. The spreadsheets were sent to operators for verification and 11
13 additional data. Information was sought from transit operators in the United States, Canada, and Europe, and data was received from the US and Canadian operators. The spreadsheets requested information on a wide range of metrics which, based upon the workshop, it was believed most transit agencies would be able to provide. However, not every transit agency could provide information on all of the metrics, thus limiting the number of characteristics that ultimately were included in the analysis. For example, most routes used multiple fare collection media, including cash, smart cards, and passes. To understand the impact of fare collection on running time, it is necessary to know the proportion of trips per route that use each type of fare collection. Most transit agencies did not have this information, and thus a separate fare collection variable could not be constructed. However, because off-board fare collection generally is bundled with other BRT elements, such as multiple door boarding, the effects of off-board fare collection are implicitly captured. The data was compiled into a database and was reviewed for accuracy and consistency, resulting in a total sample size of 119 rapid bus and BRT routes. The data was divided into six data sets encompassing the AM Peak, PM Peak, and a combination of both AM and PM Peak. A least squares regression model was developed with route time as the dependent variable. Independent variables included station density, presence of dedicated bus lanes, use of low floor buses, the presence of queue jump lanes, total weekday boardings, number of doors used for boarding, transit signal priority density, headway, and route length. The model indicated that, based upon the available data, queue jump lanes, total weekday boardings, and headway were inconclusive predictors of route time. Very few routes in the sample used queue jump lanes, which likely accounts for its failure to be a good predictor of route time in the model. It is unclear why total weekday boardings was not a good predictor of route time, because dwell time should increase as the number of boardings increases, which would lead to to increased route times. A possible explanation for the failure of weekday boardings as a predictor of route time is that the various BRT elements implemented by transit agencies are effectively compensating for any increase in dwell time caused by increasing weekday boardings. It also is unclear why headway was not a good predictor of route time. As headways increase, the likelihood of bus bunching also should rise, which typically impacts route time. A possible explanation for the failure of headway as a predictor of route time is that bus bunching as a result of increasing headways was not a significant issue on the sample routes. Using the remaining variables, the model generally showed a clear and intuitive relationship between BRT characteristics and route time. For example, substantial travel time benefits were 12
14 found for increased station spacing, the use of low floor buses, multiple door boarding, and the use of dedicated bus lanes. The travel time benefit of transit signal priority (TSP) was less conclusive. In some of our datasets, TSP appeared to provide travel time benefits, while in other data sets it did not. This finding is consistent with the literature, which indicates that TSP can significantly reduce travel time, but that these benefits can vary widely based upon local conditions, such as traffic levels in the corridor and on cross streets, the type of TSP system implemented, and the data and methodologies used to evaluate TSP operations. Indeed, a number of studies have found limited travel time benefits of TSP in specific corridors. Table ES1. Summary of Key Findings Characteristic Effect Confidence Level Notes Station density (stations per mile) minute increase in route time per station added per mile 95% confident in all six data sets Intuitive and consistent with the literature Use of low floor buses minute decrease in route time where fleets consist of all low floor buses 95% confident in four of the six data sets Likely includes effects of complementary strategies, such as level boarding and fare collection Dedicated bus lanes minute increase in route time where no dedicated bus lanes are used compared with a high level of dedicated bus lanes 95% confident in two of the six data sets A low level of dedicated bus lanes shows a similar but smaller effect Transit signal priority density (ratio of TSP signalized intersection to total number of signalized intersections) The effect varied across data sets and levels of TSP density, showing both increases and decreased in route time 95% confident in three of the six data sets Consistent with literature that effectiveness of TSP is highly dependent on a variety of local factors Number of boarding doors minute increase in route time where only one boarding door is used as compared with two boarding doors 95% confident in one data set; 90% confident in one data set Likely includes effects of complementary strategies, such as off-board fare collection. Increased route time was found with use of 3 boarding doors, which is likely due to other factors, such as a small sample size Finally, in a few cases, the results were counter-intuitive. For example, the use of three boarding doors appeared to increase route time as compared with the use of two boarding doors. This 13
15 result is most likely due to anomalies in the data, such as sample size, which made it impossible to account for other factors that may be impacting the travel time for routes that use three boarding doors. Table ES1 provides a summary of the key relationships revealed by the analysis. The project provided insight into the benefits of individual elements of BRT and merits several observations. First, relatively low-cost improvements to bus service, such as increasing station spacing, multiple-door boarding with off-board fare collection, and low floor buses can have significant benefits in terms of reduced travel time. Moreover, these benefits appear to be comparable to the benefits of more infrastructure-intensive improvements, such as dedicated lanes. For example, the low floor bus variable showed a consistent travel time reduction of between 8.16 and 9.85 minutes, while the dedicated lane variable showed a travel time reduction between 6.05 and 7.02 minutes. The model did not, however, account for other potential benefits of dedicated lanes, such as reductions in travel time variability and the image of permanence. Second, improving bus travel time can significantly improve the image of bus service and provide other co-benefits, such as reduced operating costs, improved air quality, reduced greenhouse fuel consumption, and lower greenhouse gas emissions. Faster travel times make bus services more competitive with automobile travel, thus making the service more attractive to potential riders. At the same time, faster travel times enable transit agencies to use fewer buses to serve particular routes, because each bus can make more trips within a given time period. For example, compared with the previous local service operating on the same route, the Cleveland Healthline BRT has experienced nearly a 50 percent increase in ridership and a 25 percent decrease in travel time, all the while requiring fewer buses and drivers to provide the same service. Third, although the benefits of some BRT elements may be applicable across many urban areas, these benefits may vary significantly depending upon local conditions. This appeared especially true regarding TSP which, based upon the data in the sample, showed inconsistent benefits, in some cases increasing route time while in other cases decreasing route time. An evaluation sponsored by FTA of Las Vegas Max, which is included in our sample, found that TSP had no travel time benefit for buses in the corridor. Other studies have found similar results. Fourth, there are potential policy implications of these findings. For example, bus-based Small Starts projects must either: (a) meet the definition of a fixed guideway for at least 50 percent of the project length in the peak period, (b) be a new fixed guideway project, or (c) be new corridor-based bus project with all of the following minimum elements: Substantial transit stations; 14
16 Traffic signal priority/pre-emption, to the extent, if any, that there are traffic signals on the corridor; Low-floor vehicles or level boarding; Branding of the proposed service; and 10 minute peak/15 minute off peak headways or better while operating at least 14 hours per weekday. 3 Bus projects generally establish eligibility by meeting the requirements of part (c), which requires the use of TSP if traffic signals are present. However, the results of this report, as well as the literature, suggest that the benefits of TSP vary significantly with local conditions, and in some cases may have no benefit in terms of travel time savings. There is, therefore, a risk that current policy requires investment in technology that does not achieve the benefits that were intended. Finally, given the potential policy, financial, and other implications of our findings, there are potential next steps that should be considered. These include: additional research to understand better the benefits of TSP, including demonstration of different types of TSP systems and documenting their performance in detailed before and after studies; demonstrating new approaches to improving travel times and reducing variability on arterial bus services. Our research, as well as some anecdotal evidence in the literature, suggests that implementing BRT elements on arterial streets can have a comparable running time effect as dedicated lanes, but may not be effective at addressing travel time variability. FTA could therefore demonstrate new technologies, such as intermittent bus lanes, to address both running time and travel time variability on arterial streets, without the need for physical bus lanes. Improving data collection and reporting to better understand the benefits of specific interventions. Although transit agencies were willing to share their data and were generous with their time in this project, it is important to note that providing transit service is their primary function, not data collection. Thus, data was often not sufficiently detailed to provide the depth of analysis originally envisioned for this project, and there were wide gaps in the consistency and quality of the data among transit agencies. A federal program could establish performance metrics as well as standards for data collection and reporting. The program could be demonstrated initially in a single BRT corridor, such as the Los Angeles Orange Line or the Eugene EmX corridor, and expanded over time to additional corridors. 3 Updated Interim Guidance on Small Starts, US Federal Transit Administration (2007), available at 15
17 I. INTRODUCTION a. Background Public transportation is an essential component of building more livable urban communities. High quality public transportation can attract drivers away from their cars, reducing emissions and oil consumption and promoting a more sustainable future. Building and operating public transportation services is expensive, requiring significant capital and operating cost investments. Improving the efficiency of public transportation saves money and improves the customer experience, attracting and retaining more riders. This study was commissioned to quantify the benefits of specific bus rapid transit (BRT) elements in terms of reduction in route time for bus services. Improving bus travel times is attractive for a number of reasons. First, in most urban areas in the United States, the majority of public transportation trips are by bus. Improvements in travel time and service quality can benefit a large number of users and can attract new users to the system. Second, the tools available to decrease bus travel times, such as transit signal priority (TSP) and bus lanes, are relatively inexpensive and can be implemented quickly, especially compared with other major capital investments, such as new rail lines. For example, a Research and Innovation Technology Administration (RITA) report found that TSP costs between $8,000 and $35,000 per intersection. 4 Research by the city of Chula Vista, California, found that implementing queue jumpers costs $250,000 per intersection. 5 By contrast, the cost for new light rail lines typically is $50-$100 million per mile, and the costs for new heavy rail lines may be $200 million per mile or more. Third, investments to improve travel times likely will be offset, at least in part, by both capital and operating cost savings. A Metropolitan Washington Council of Governments report found that increasing bus speeds by 50 percent can result in a 33 percent reduction in operating and 6 capital costs, or a 33 percent reduction in headways without an increase in operating costs. 4 Baker, Ronald J. Implementation costs for transit signal priority range from $8,000 to $35,000 per intersection. July Research and Innovative Technology Administration. Query=CApp 5 Capital Cost Estimates: Task 6. Otay Ranch Transit Planning Study. January vista.ca.us/city_services/development_services/planning_building/about/documents/or-task6_capcost- Final.pdf 6 Eichler, M. and Bonsall, M. Development of a Regional BRT System Proposal, Metropolitan Washington Council of Governments. Washington, DC.2009 Available at 16
18 Similarly, TransLink in Vancouver, Canada, estimated that a 20 percent improvement in bus travel times resulted in $3.2 million in capital cost savings and $1.8 million per year in operating cost savings 7. These savings are achieved primarily because faster travel times enable service to be maintained with fewer buses. Finally, BRT is becoming increasingly popular in the United States as a cost-effective strategy to provide high quality, rapid transit services. Understanding the potential of BRT elements to reduce travel times will help communities optimize existing and future bus systems. b. Study Objectives The purpose of this research was to determine whether travel time benefits of various BRT strategies can be quantified across a large data set of bus lines. The goal was to provide information about the potential impact on route time of specific BRT strategies. Understanding these benefits will help the FTA and transit agencies better evaluate ways to improve service, reduce costs, and increase transit ridership. Moreover, it will help ensure that limited funding for new transit investment is directed toward projects that can best meet significant local and national challenges, such as traffic congestion, energy security, climate change, and air quality. c. Approach Project researchers worked with industry to create a database of BRT and rapid bus routes and to conduct a stepwise regression to determine the relative contribution of various BRT elements to travel time. A work plan was developed, and a workshop was conducted with representatives from industry, academia, and others to receive feedback and refine the work plan. Routes were selected that operated on headways of 15 minutes or less and that employed one or more elements of a BRT system. A database was populated by analyzing publicly available data on travel times, service plans, capital components, and other attributes of the routes. The information for each route was then delivered to transit agencies with a request to verify and supplement the information. Project staff worked with transit agencies to ensure consistency of the data across routes operated by different transit agencies. Based upon the information 7 Hartmann, Sheila, and Kitasaka, Keenan. Vancouver, British Columbia s High Tech Bus Rapid Transit Achieves Mode Shift From Private Vehicles Surpassing Rapid Rail Transit, Translink Available at 17
19 compiled by project staff and provided by transit agencies, models were developed using travel time as the dependent variable and various BRT elements as independent variables. II. STUDY CONTEXT a. Defining BRT According to the Federal Transit Administration (FTA), a BRT system contains the following elements: Dedicated running ways; enhanced stations; innovative vehicles; improved service (including higher frequency and reduced travel times); off-board fare collection; intelligent transportation system technologies (such as traffic signal priority and real-time vehicle arrival information); and system branding and marketing. In the United States, many transit agencies have chosen to implement only a few of these elements. These systems, often referred to as rapid bus, typically deploy relatively low cost improvements to existing bus lines, such as queue jump lanes, traffic signal priority, reduced stop spacing, and relocation of stops to the far side of intersections. The Los Angeles Metro Rapid system pioneered this approach in the late 1990 s. By contrast, full-brt systems invest extensively in all BRT elements, with the goal of providing service that is at least comparable to what would be expected in a light rail or even heavy rail system. Full-BRT systems are common in developing countries, which typically require the carrying capacity of rail, but where city governments lack resources to build extensive rail systems. The first of these surface subway systems appeared in Curitiba, Brazil, in the 1970 s and today similar systems can be found in several Latin American cities as well as in Asia. The United States, however, has yet to build a full-brt network, although a few examples of full-brt corridors exist, including the Orange Line in Los Angeles, the Healthline in Cleveland, and much of the EmX line in Eugene, Oregon. 18

20 Unlike other rapid transit modes, the path to a full-brt may be traversed incrementally, as resources or demand requires. In other words, full-brt can be achieved in stages, rather than all at once. Transit agencies have flexibility to enhance local bus service with relatively inexpensive improvements, such as low floor buses, enhanced shelters, and TSP, with the potential to add more expensive features such as bus lanes or busways later. A recent study identified five approaches to BRT implementation, which helps demonstrate the incremental nature and flexibility of BRT deployment. Development of a full-brt network by starting with implementation of full-brt in a single corridor; Implementing a full-brt corridor as a stand-alone project; Simultaneous implementation of a network of rapid bus routes; Implementation of demonstration rapid bus corridors, leading to a network of rapid bus routes; and Identification and upgrade of high ridership bus routes. 8 Figure 2: Eugene EmX BR. Photo: Bill Vincent The study further found that the incremental nature of BRT is a fundamental strength, because it allows great flexibility in terms of where, when, and how BRT elements are implemented. In other words, BRT is not a one-size-fits-all solution and can be tailored significantly to meet local needs and conditions. The benefits of BRT and rapid bus systems have been well documented. BRT systems attract new riders, including choice riders who would have otherwise used a car. After the Orange Line BRT was opened in Los Angeles, traffic on the adjacent highway decreased, and congestion began later in the day than prior to Orange Line implementation 9. Ridership surveys indicated that 18 percent of riders had previously used the highway to make the trip. BRT also can encourage transit-oriented development. In Cleveland, more than $3 billion in investment has been associated with the Healthline, and in Boston, the Washington Street 8 Niles, John and Lisa Callaghan Jarram. From Buses to BRT: Case Studies of Incremental BRT Projects in North America. June Vincent, William and Lisa Callaghan Jerram. A Preliminary Evaluation of the Metro Orange Line Bus Rapid Transit Project. April 2, P.9 19
21 Corridor experienced more than $571 million dollars in investment between 1997 and These experiences suggest that BRT can attract development to an extent previously associated only with rail transit. The federal government offers substantial financial support for cities seeking to implement new transit services, primarily through the New Starts and the Small Starts programs. Program goals include improving mobility, reducing congestion and air pollution, and addressing energy security, climate change, and other national priorities. Most BRT or rapid bus projects receive funding through the Small Starts program. Eligibility for Small Starts requires that bus-based projects either: (a) meet the definition of a fixed guideway for at least 50 percent of the project length in the peak period, (b) be a new fixed guideway project, or (c) be new corridor-based bus project with all of the following minimum elements: Substantial transit stations, Traffic signal priority/pre-emption, to the extent, if any, that there are traffic signals on the corridor, Low-floor vehicles or level boarding, Branding of the proposed service, and 10 minute peak/15 minute off peak headways or better while operating at least 14 hours per weekday Vincent, William and Lisa Callaghan Jerram. Bus Rapid Transit and Transit Oriented Development: Case Studies on Transit Oriented Development Around Bus Rapid Transit Systems in North America and Australia. April 2008 P Federal Transit Administration
22 b. Description of BRT Routes Included in the Study A total of 119 rapid bus and BRT routes in nine cities are included in the analysis. This section provides a brief summary of these systems and routes included. Table 1 provides a summary of the characteristics of these routes. Table 1: Bus Route Characteristics Number of Lines Included Type TSP Low Floor Buses Los Angeles Metro Rapid Los Angeles Orange Line King County Metro Vancouver, British Columbia Washington, D.C. Eugene, Oregon EmX Las Vegas MAX Kansas City MAX York Region Viva Chicago CTA Express and Limited 22 Rapid 1 Full- 32 Rapid Bus Bus Dedicated Bus Lanes BRT Depends on Line 36 Rapid Bus 4 Rapid Bus 2 Full- 2 Rapid 2 Rapid 10 Rapid 8 Rapid Bus BRT Bus Bus Bus Depends on Line Number of Doors for Boarding 1 3 Off-Board Fare Collection Limited Stop Service Some 2 Some Some Some 1 (a few lines have 3) Some 1 Some Some 2 Some 3 (no fare) Some 2 Some 2 (One line has 3) 1 Some Some 21
, operating both Metro Bus and Metro Rail services.")

23 i. Los Angeles, California- Metro Rapid and Orange Line Busway Los Angeles County Metropolitan Transportation Authority (Metro) serves one of the country's largest, most populous counties (1,433 square miles of service area, more than nine million residents), operating both Metro Bus and Metro Rail services. Metro also funds 16 municipal bus operators and an array of other local transportation projects. Metro operates over 2,000 peakhour buses on an average weekday, serving 191 bus routes and 15,967 bus stops, with more than one million average weekday bus boardings. Figure 4: Los Angeles Rapid Bus taken on April 17, 2008 in Westwood, CA In 2000, Metro implemented an arterial BRT service, Metro Rapid, to improve bus travel speeds. The initial two-line demonstration program was successful and led to the development of the present 25 line Metro Rapid network. Metro Rapid buses are up to 29 percent faster than local buses due to the use of signal priority, headway-based scheduling (three to ten minutes during peak periods), and greater stop spacing (eight-tenths of a mile, compared to two-tenths of a mile for local buses). Metro Rapid has increased ridership by up to 40 percent in the bus corridors, with one-third of the increased ridership comprised of new riders. Metro also operates a fixed guideway BRT bus service, the Orange Line, a 14-mile busway situated along the right-of-way of an abandoned rail line, connecting North Hollywood with the Warner Center. Opened in 2005, the line is served by 60-foot articulated buses and service is frequent (headways of four to five minutes peak and 10-minutes off-peak). The line notably reached its 15-year forecast ridership within the first seven months of operation, attracting more than 20,000 daily riders, and reached almost 29,000 daily riders in September In June 2009, Metro began construction of a Figure 5: Los Angeles Orange Line Bus Way at White Oak Ave. 22

24 4-mile Orange Line extension to Chatsworth that is anticipated to generate 9,000 additional weekday boardings by The data set for this analysis includes 22 Metro Rapid bus lines and the Orange Line. ii. Vancouver, British Columbia B-Line and TransLink Frequent Service Network Vancouver s TransLink is the regional transit authority for the Greater Vancouver region, comprised of 21 municipalities and covering 1,250 square miles. The agency offers bus, rail, and ferry services. The bus fleet is comprised of 1,432 vehicles. TransLink s high frequency, limited stop 99 B-Line service debuted in 1996, followed by the 98 B-Line in 2001 and the 97 B- Line in The 98 B-Line, a 10-mile route connecting downtown Vancouver and Richmond, was designed as a BRT line and features exclusive curbside peak period bus lanes through Vancouver, median bus lanes in Richmond, and employs traffic signal priority and high capacity, articulated vehicles. A 2003 report indicated that the 98 Figure 6: B8017 running 99 B-Line Broadway Station at UBC Loop. B-Line was estimated to provide approximately a 20 percent reduction in travel time over previous bus services. The 98 B-Line was discontinued in September 2009, after the Canada Line rail service opened in the same Vancouver-Richmond corridor. Our analysis included 37 lines that were identified by Translink staff as part of their Frequent Service Network of buses operating with headways of 15 minutes or less throughout the day. These routes included the 99 and 97 B-Line. Data on the now discontinued 98 B-Line was not provided bytranslink for this report. 23
 within a 2,134 square mile area. Metro carries nearly 400,000 daily passengers daily.")

25 iii. King County, Washington King County Metro Metro Transit, the public transit agency serving King County, Washington, operates a fleet of about 1,300 vehicles (buses, electric trolleys, streetcars) within a 2,134 square mile area. Metro carries nearly 400,000 daily passengers daily. King County s Transit Now initiative, passed in 2006, led to the development of more than 55,000 new hours of Metro service in high-ridership corridors. RapidRide, a new, streamlined bus service, will provide frequent, all-day bus service in five corridors. RapidRide will feature greater stop spacing using low floor, three-door buses and traffic signal priority. Depending on the outcome of a pilot project, an off-board fare payment system may be used. The first of the five RapidRide routes is scheduled to begin operation in Annual ridership in the five RapidRide corridors, which is currently 10.5 million riders, is expected to increase to almost 16 million riders with this new service, or within the next five years. Figure 7: King County Metro 60 foot diesel, low floor, articulated bus Thirty-two of Metro Transit s bus routes were analyzed, all of which provide frequent, all-day service with 15 minute or less headways on weekdays through six p.m. iv. Chicago, Illinois - Express and Limited Bus Lines The Chicago Transit Authority (CTA) operates the nation's second largest public transportation system, serving Chicago and 40 surrounding suburbs. The agency provides both bus and rail service, with most riders utilizing bus services. The bus system consists of 150 routes and 2,517 route miles, making over 25,000 daily trips and serving nearly 12,000 bus stops. CTA bus routes include both Figure 8: Chicago Transit Authority local and express services. 24

26 As of 2009, the Chicago Department of Transportation and CTA were in the process of designing a pilot program to test BRT service along certain high ridership corridors across the city not currently served by rail. The pilot program was to examine and test BRT technologies and services to determine the best way to implement BRT in the CTA service area. However, a drop in tax revenue during the 2009 recession led to CTA budget cuts and layoffs, putting CTA s BRT efforts in a state of temporary suspension. Eight CTA express and limited bus lines were analyzed in this project. These routes were selected because they operate with frequencies of 15 minutes or less and they represent high ridership corridors. All of these routes were eliminated as of February 2010, due to a budget crisis faced by CTA. v. Eugene and Springfield, Oregon- EmX Lane Transit District (LTD) provides transportation services to the Eugene and Springfield, Oregon area, offering 42 bus routes and Breeze shuttle bus service. Formed in 1970, the agency serves 40,122 average weekday bus passengers and carries an average of passengers per schedule hour (May 2009). Eugene-Springfield s 20-year Regional Transportation Plan Figure 9: EmX New Flyer DE60LFA identifies BRT as the preferred transit strategy for the region. LTD s first EmX BRT line, the Green Line, debuted in 2007, connecting downtown Eugene and Springfield. The four-mile Green Line uses exclusive single and dual bus lanes along 60 percent of the route, and features traffic signal priority, queue jump lanes, and level boarding on articulated vehicles. Green Line ridership has more than doubled since the line was introduced, growing from 2,700 daily riders (before introduction of BRT), to 6,700 daily riders. Officials envision that EmX will be expanded to a 61-mile network, and plans have been laid for subsequent lines. The Gateway EmX Extension is currently under construction and is anticipated to begin service by the end of
 serves the greater Las Vegas Valley, providing 36 bus routes served by 360 vehicles, and carrying more than")
27 EmX Green Line data was collected for the analysis, as well as data on the Route 11 local bus line previously operating in the corridor. vi. Las Vegas, Nevada - MAX The Regional Transportation Commission of Southern Nevada (RTC) serves the greater Las Vegas Valley, providing 36 bus routes served by 360 vehicles, and carrying more than 176,000 passengers per weekday as of August RTC started the Citizens Area Transit (CAT) bus system in 1992 and debuted Figure 10: Las Vegas MAX Vehicle the Metropolitan Area Express (MAX) BRT line in Since 2002, RTC s transit system has increased by more than 40 percent. RTC operates at approximately one-and-a-half times above the national average of passengers per service hour (PPSH); PPSH in September 2009 vs. the national average of The agency serves an area of 382 square miles and 3,567 bus stops. MAX bus service began in 2004, operating along a 7.5-mile portion of Las Vegas Boulevard, serving 22 stations between downtown and North Las Vegas. The line facilitates improved travel times through the use of off-board fare collection, high capacity, articulated buses with multiple wide doors for quicker boarding, 4.5 miles of dedicated bus lane, and the use traffic signal prioritization to give buses green light priority. MAX carries 70 PPSH, nearly 2.5 times the US average, and serves more than 2.5 million passengers per year. Data on the MAX BRT service and local line CAT 113 were provided for the analysis. vii. Kansas City, Missouri - MAX The Kansas City Area Transportation Authority (KCATA) provides bus service throughout the Kansas City metropolitan area, encompassing four counties in Missouri and three in Kansas. The agency is governed by a Board of Commissioners representing both states. 26

28 KCATA s first BRT line, Metro Area Express (MAX), was implemented in 2005 and is credited by the agency with increasing corridor ridership by more than 50 percent. Operating over a sixmile route in Kansas City, Missouri, the limited stop MAX service uses multiple-door, low floor vehicles to provide frequent service. Buses operate on exclusive bus lanes along segments of the route. TSP technology is used to add time to a green light or shorten a red light when transit vehicles are behind schedule. Due to the success of MAX on Main Street, KCATA plans to deploy a second BRT line on Troost Avenue in the Fall of An alternative analysis has also determined that BRT is the best option for the State Avenue corridor, and if sufficient funding is secured, State Avenue BRT could open in Figure 11: Kansas City MAX Station Analysis data was collected on MAX BRT, as well as on the local line, No. 56 Country Club Line, previously operating in the corridor. viii. Washington, DC Metro Area Express Bus Service The Washington Metropolitan Area Transit Authority (WMATA) operates the sixth largest bus network in the United States, serving a population of 3.5 million over a 1,500 square-mile area. WMATA was created in 1967 by an interstate compact to develop and operate a regional transportation system in the National Capital area (District of Columbia, suburban Maryland and Virginia). Metrorail system construction began in 1969, opening in 1976, and four area bus systems were acquired in Today, 42 percent of commuters working in Washington s center core and parts of Arlington County use mass transit. MetroBus serves 12,227 bus stops along 319 routes on 174 lines, with an average weekday ridership of more than 429,000 riders as of August WMATA is creating a new vision for a family of bus services that feature service integration, operations improvements, running way improvements, bus stop facilities, and customer information. The agency currently operates six express bus routes along high ridership lines, 27


29 including a new service called MetroExtra. The agency plans to expand MetroExtra to 24 routes by Figure 12: Washington, DC Metrobus route 42 headed to Mount Pleasant We analyzed data on four of WMATA s six Express bus routes: 79 Georgia Avenue MetroExtra, 37 Wisconsin Avenue Limited line, REX (Richmond Highway Express) and PikeRide (16F Limited). At the recommendation of agency personnel, the two lines excluded were the S9 16 th Street Express route, which started service in March 2009 and lacked sufficient history, and the NH1 National Harbor Line. ix. York Region, Ontario - VIVA York Region Transit (YRT) provides local transit services connecting the York Region s nine municipalities and offering access to Toronto, Durham and Peel. The agency operates more than 100 bus routes, including conventional, shuttle, and express bus services. Figure 13: York Region Transit, Ontario 28

30 YRT s VIVA bus line was launched in 2005, offering frequent, headway-based service in a distinctive fleet of new buses. A proof of payment fare collection system, with ticket vending machines at stations, helps speed passenger boarding. According to YRT officials, corridor ridership more than doubled within the first two years of VIVA s introduction. VIVA has since grown to five lines in four York Region corridors. Phase 2 will improve on VIVA bus travel times through the Figure 14 York University VIVA Station addition of dedicated rapidway bus lanes. The first rapidway is scheduled to be completed in 2012 and the initial segments of several additional rapidways are planned to be completed in 2012 or Remaining rapidway segments will be completed beyond 2015, if additional funding is granted. The analyzed data set includes YRT s five VIVA bus lines and five local bus routes that provide service in the same corridors. 29
31 III. LITERATURE REVIEW Significant research has been conducted regarding the travel time savings and other benefits of BRT systems. For example, TCRP Report 90, Volume 1: Case Studies in Bus Rapid Transit, sets forth the reported travel time savings of BRT systems as compared with local bus service that previously operated in the same corridor. Table 2 shows that the travel time savings can be quite significant. Table 2: Select Reported Travel Time Reduction Location Facility Travel Time Before After % Reduction (minutes) (minutes) Eugene, Oregon EmX arterial median busway Los Angeles, California Wilshire-Whittier Metro Rapid Pittsburgh, East Busway Pennsylvania Adelaide, Australia O-Bahn Guided Busway Source: TCRP Report 90 TCRP 118, Bus Rapid Transit Practitioner s Guide, expanded upon this work, presenting estimated effects on travel time of various BRT treatments. These estimates were based upon reviews of project profiles and upon the Transit Capacity and Quality of Service Manual and are discussed in greater detail below. In addition, many existing North American BRT systems have been evaluated, including evaluations sponsored by FTA. Many of these studies contain information on travel time savings for the BRT corridor, including estimates of the travel time savings for specific BRT components. The project team reviewed the evaluations for the following systems: EmX (Eugene, Oregon) MAX (Las Vegas, Nevada) - two separate evaluations conducted in 2005 and 2006 San Pablo Rapid (Alameda and Contra Costa counties, California) BRT (Honolulu, Hawaii) Silver Line (Boston, Massachusetts) West Busway (Pittsburgh, Pennsylvania) 98-B Line (Vancouver, British Columbia, Canada) Metro Rapid (Los Angeles, California) Orange Line (Los Angeles, California) - two separate evaluations in 2007 Lynx Lymmo (Orlando, Florida) 30
32 South Miami-Dade Busway (Miami, Florida) The methodologies used in these studies varied significantly. In some cases, the travel times savings were estimated based upon observation or an educated assessment by the transit operator, such as in Honolulu, Las Vegas, and Vancouver. In other cases, such as Eugene, measurements were taken. Where measurements were used, the studies employed varying methodologies and data sources, including before-and-after analysis of daily ridership and travel time and the use of AVL, published schedules, and other data to examine the impact of BRT. Table 3 provides a summary of the findings of these evaluations regarding travel times. These evaluations generally show aggregate performance benefits due to the implementation of BRT, and in some cases the benefits are attributed to specific elements. However, there are interesting and in some cases wide variances in the performance of specific elements. For example, in some cases, transit signal priority (TSP) is credited with a substantial reduction in travel time, while in at least one case in Las Vegas, it resulted in no decrease in travel time. Many of these performance differences likely are the result of unique local conditions. The following sections discuss the travel time benefits associated with specific BRT elements as reported in the literature. 31
33 Table 3: Major Findings Related to Travel Time Savings Contained in BRT Performance Analyses System EmX Eugene/ Springfield, Oregon Findings Related to Travel Time End-to-end travel time savings: 28 seconds attributed to TSP (statistically significant at 99% confidence level) 10 seconds due to reduction in dwell time 18 seconds due to reduction in transit time 45 seconds attributed to other factors MAX Las Vegas, Nevada Routes A, B, C Honolulu, Hawaii San Pablo Rapid East Bay area, California Silver Line Boston, Massachusetts MAX Kansas City, Missouri West Busway Pittsburgh, Pennsylvania 98 B-Line Vancouver, British Columbia Metro Rapid Los Angeles, California Faster end-to-end travel time and reduced variability: 33% time savings during peak and 26% off-peak 7.6 minutes per trip saved due to faster boarding and alighting 59% reduction in dwell time due to proof-of-payment fare collection Little or no benefit from the TSP installation, likely insufficient traffic congestion Exclusive bus lane is believed to have an effect, but not quantified Average travel time savings compared with local route: Route A vs. local route 1: 17-21% (AVL data), 0-24% (schedule data) Route A vs. local route 3: 7-42% (AVL data), -9-36% (schedule data) Route B: 19-26% (AVL data), 27-34% (schedule data) Route C: 27-33% (AVL data), 26-34% (schedule data) Operating speeds were up to 20% higher than comparable local bus routes, due to fewer stops Travel time reduced 21% compared to local bus service, 17% compared to limited stop bus 1/3 of savings from fewer stops and signal progression, 1/6 due to TSP, 1/6 due to far-side stops Reduction in mean running time as high as 25%, increased service reliability Attributed to real-time bus management, enabled by the CAD/AVL system Delay per passenger reduced by about 1 second in 2003 compared to 2001 due to low floor vehicles and/or reduction in the number of stops Average travel times improved by 26.3%-42.8% due to increased stop spacing Improved travel time variability attributed to dedicated bus lane Headway reliability measured at almost 100% Dwell times reduced 38%-65% in PM, 75%-83% in AM and midday due to level, multipledoor boarding Average speeds 25%-38% higher northbound, 63%-66% higher southbound attributed to greater stop spacing Travel time reduced 20 minutes on average in the corridor Schedule adherence improved 68% Average travel speed increased 63% and speeds are faster than local LRT, attributed to the exclusive busway and limited stops 20% reduction in travel time Travel time variability reduced 40-50%, attributed to TSP and AVL system Efficiency (person throughput) grew significantly due to improved travel times and variability Average time savings of 27% in the Wilshire corridor, 33% in the Ventura corridor Operating speeds increased 29% on Wilshire Blvd. and 23% on Ventura Blvd, attributed 1/3 to TSP and 2/3 to other BRT elements 33% reduction in traffic signal delays on Wilshire and 36% savings on Ventura 32
34 a. Running Way BRT running ways provide buses with a priority right-of-way. 12 Running ways can be gradeseparated, such as Pittsburgh s West Busway, at-grade, or bus lanes designated on an arterial street or on a highway. Running ways also can be designated all-day or only during certain periods. The operational benefits of dedicated bus lanes include reduced travel time, better schedule adherence, and reduced travel time variability. The extent of these benefits varies greatly depending upon a wide range of factors, such as the extent to which it is grade-separated, the number of intersections crossed by the running way, local traffic conditions, and whether physical barriers prevent cars and other vehicles from accessing the running way. Table 4: Typical or Estimated Effects of BRT Components and Conditions on Travel Time Travel Time Effects of BRT Components Component Savings Compared with Baseline* (minutes per mile) Off-Street Elevated 4.5 Some grade 4.3 separation At-grade 3.6 On-street Median arterial 1.5 busway Bus lane 1.1 * Baseline is a running speed of 10 mph with 6 stations per mile TCRP 118 suggests that travel time benefits increase as a function of the level of grade separation. As shown in Table 4, TCRP 118 found that elevated, grade-separated running ways can save 4.5 minutes per mile versus local service, whereas an arterial bus lane can save 1.1 minutes per mile. TCRP 118 also found that exclusive running ways accounted for 55 percent and 50 percent of the total travel time savings of the Adelaide O-Bahn and the South Miami-Dade Busway, respectively. Other research has found similar results. In Pittsburgh, the West Busway saved approximately 20 minutes on inbound morning trips with an average speed of 30 mph, a significant improvement over the previous average speed of 19 mph. 13 At the same time, 68 percent of passengers perceived improved reliability in the service. 14 Moreover, as shown in Table 3 on the previous page, exclusive running ways accounted for a significant portion of the travel time savings of BRT projects evaluated by the FTA. 12 Transportation Research Board P.2 13 McKeown, Stewart. Evaluation of Port Authority of Allegheny County s West Busway Bus Rapid Transit Project. Report Number: FTA-PA Washington, DC. Federal Transit Administration, Ibid 33
35 Table 5 provides examples of the types of exclusive running ways currently in use in North America. Table 5: BRT Systems and Types of Dedicated Lanes System and City Type of Dedicated Running ways Orange Line, Los Angeles At-grade Dedicated Busway EmX, Eugene At-grade Median Busway / Dedicated Bus Lane South Miami-Dade Busway, Miami At-grade Median Busway Lynx Lymmo, Orlando Dedicated Bus Lane West Busway, Pittsburgh Grade-separated Busway Silver Line, Boston On-street Exclusive Bus Lane/ Grade-separated Busway MAX, Las Vegas Dedicated Bus Lane Healthline, Cleveland Dedicated bus Lane Another type of dedicated bus lane is the queue by-pass lane, which provides buses with priority at intersections. According to TCRP 118, a queue by-pass lane can decrease travel time by roughly six seconds per mile. Very few of the routes in our sample used queue by-pass lanes, so we were unable to measure the effect of these lanes. b. Stations Running time can be impacted by altering the distance between stations, the location of the station relative to intersections, and by incorporating design elements that reduce dwell time at the stations. Station spacing and location generally is considered a service planning and operations issue and is discussed below. Dwell time historically has been difficult to quantify, primarily because dwell time data typically requires extensive manual data collection, which is expensive. 15 Indeed, the Transit Capacity and Quality of Service Manual contains a detailed procedure for manual recording of dwell time data. As a result, there is a limited amount of data available on dwell time. Nevertheless, a number of studies have estimated dwell time at between five to twenty seconds 16 per stop and between two to five seconds per boarding and alighting passenger. Various station elements can help reduce dwell time, including the interface between the vehicle and the platform, placing fare collection within the station instead of on the bus, the design and layout of 15 Dueker, Kenneth J. and Thomas J. Kimpel, James G. Strathman, and Steve Callas. Determinants of Bus Dwell Time. Journal of Public Transportation. Vol.7, No. 1, See e.g., Levinson, H. S. Analyzing transit travel time performance. Transportation Research Record, 915: 1-6 (1983); Guenthner, R. P. and K. C. Sinha, Modeling bus delays due to passenger boardings and alightings. Transportation Research Record, 915: 7-13 (1983). 34

36 the platform itself, and the type of docking system used. Table 6 shows the different station types and station amenities deployed by the systems included in this study. Table 6: Station Design And Amenities By BRT System Station Design Type Location Curb Design Vehicles Accommod ated Seating Los Angeles King County Vancouver, British Columbia Washingto n, DC Eugene Las Vegas Kansa s City York Region Chicago Pole, Pole, Shelter Pole, shelter Shelter Shelter, Shelter Station Pole shelter, shelter, station station station On/offstreestreestreestreet On-street On-street On-street On-street On- On- On/off- On-street Standard Standard Standard Standard Raised Raised Standard Standard Some Next Bus Display Trash receptacle Typically, station modifications are implemented in conjunction with other BRT elements as part of a package of improvements. For example, Figure 15 shows how a raised platform that is used to match the height of the platform with the height of the bus, enabling level boarding. Similarly, fare collection is placed in the station to enable passengers to use multiple doors for boarding and alighting. Because station elements are almost always part of a broader package, it is difficult if not impossible to measure the time savings of station elements alone. Figure 15: High Platform Station and Bus, Mexico City, Mexico Consequently, for purposes of this study, the effects of station elements are assumed to be included in the effects of other variables, most notably low floor buses and the use of multiple doors for boarding. It also is important to note that station design can have significant benefits beyond travel time. For example, a recent study on image and perception of BRT found that, in Los Angeles, station 35
37 comfort received a score of 4.05 out of five in terms of importance to riders. 17 Similarly, a survey of real estate developers found that the quality of the BRT station is one of the most important factors to developers regarding the decision to invest near a BRT station. 18 c. Vehicles Table 7: Typical U.S. and Canadian BRT Vehicle Dimensions and Capacities Length (ft) # Seats (incl. seats in wheel chair tie down areas) Width (ft) # Door Channels Maximum Capacity Source: Characteristics of Bus Rapid Transit, p A number of vehicle characteristics can impact system performance, including low floor design, multiple door channels, and seating configuration. Table 7 provides a summary of the type of buses typically found in the United States. Vehicle design impacts travel time primarily by impacting dwell time. For example, the use of multiple doors, when coupled with off-board fare collection, provides passengers with multiple options for boarding and alighting, thus minimizing queues that may occur when a single door is used. Larger capacity buses may reduce the number of buses required during peak periods, thus reducing opportunities for bus bunching and other operational delays. 17 Cain, Alasdair and Jennifer Flynn, Mark McCourt and Taylor Reyes. Quantifying the Importance of Image and Perception to Bus Rapid Transit. FTA-FL , March P Vincent, William, Case Studies on BRT and Land Use, webinar presentation (March 2010). 36
38 Table 8 summarizes the experience of several transit agencies regarding low floor buses and service time per passenger. As shown in the table, low floor buses consistently reduce the service time per passenger for both boarding and alighting. The effect of low floor buses alone has been shown to be 0.11 seconds per dwell, without deployment of lift operations for wheelchairs, and nearly five seconds per dwell in the presence of lift operations. 19 Because these effects are per dwell, they accumulate over the length of a route, increasing with each additional stop made by the bus. Table 8: Passenger Service Times by Floor Types Transit Agency Ann Arbor Transportation Agency Boarding Times (Sec) Low- High- Floor Floor Alighting Times (Sec) Low Floor High Floor Cash Revenue No Cash Shuttle No Fare not reported not reported Victoria Regional Transit System Vancouver Regional N/A N/A Transit System 1.43 St. Albert Transit Single Boarding Two Boarding not reported not reported Senior Boarding Kitchner Transit Characteristics of Bus Rapid Transit, p.3-24 In addition, the impact of low floor buses can be magnified by other impacts, such as the use of pre-paid fares. For example, as shown in Table 8, the average boarding time per passenger paying cash on a low floor bus was 3.09 seconds, but that time dropped to 1.92 seconds when no cash was used. Similarly, Table 9 shows that boarding and alighting times consistently decrease as additional doors are available for boarding and alighting. 19 Dueker, Kenneth J. and Thomas J. Kimpel, James G. Strathman, and Steve Callas. Determinants of Bus Dwell Time. Journal of Public Transportation. Vol.7, No. 1, P
39 Table 9: Multiple Channel Passenger Service Times per Total Passenger with a High-Floor Bus (sec/passenger) Available Door Channels Boarding Front Alighting Rear Alighting Characteristics of Bus Rapid Transit, p Finally, recent research highlights the importance of vehicle door width on dwell time. The research found, among other things, that a wider door can reduce the average alighting time almost 40 percent and the average boarding time almost 20 percent, regardless of platform height. 20 d. Fare Collection Table 10: Bus Passenger Service Times (sec/passenger) Fare Payment Method Default (single-door Boarding) Observed Range Boarding Pre-payment Smart Card Single ticket or token Exact change Swipe or dip card Alighting Rear door Front door Characteristics of Bus Rapid Transit, p As mentioned above, moving away from on-board cash fares can decrease boarding times, reducing dwell time and overall travel time. 21 Table 10 shows that the observed boarding times for prepaid fares are significantly lower than the observed boarding times for other fare collection media, such as cash, tokens, and smart cards. New York City recently implemented a rapid bus service, known as Select Bus Service, to 20 Fernandez, Rodrigo, et al, Influence of Platform Height, Door Width, and Fare Collection on Bus Dwell Time. Laboratory Evidence for Santiago De Chile, Transportation Research Board Annual Meeting 2010, Paper # Transportation Research Board P.2 38
40 address chronic issues with slow buses on New York streets. A combination of pre-paid fares and the ability to board and alight through the rear door resulted in a 40 percent reduction in dwell times, from nearly 15 minutes to roughly 9.5 minutes corridor-wide. 22 In other cases, the benefits of advanced fare collection have not been as clear. For example, in Brisbane, Australia, a smart card system was implemented on the Southeast busway, requiring the use of smart cards during the afternoon peak and requiring users to tap their smart cards during both boarding and alighting. A recent analysis found that the smart card system decreased boarding time per passenger by at least 14 percent, but increased alighting times by more than 50 percent. 23 Similarly, in 2005 a new automated fare collection system was implemented on the Boston Silver Line. The system could accept cash and read proximity and magnetic stripe cards. The system created significant confusion and congestion upon boarding and resulted in an increase in both travel time and travel time variability. 24 Measuring the impact of fare collection on a specific rapid bus or BRT route can be challenging. It requires careful review and observation of the fare collection system, as well as how passengers interact with that system. Moreover, many routes use multiple fare collection media, including cash, passes, and smart trip cards. Therefore, to isolate the travel time impacts of fare collection, it is necessary to know the proportion of trips per route that use each type of fare collection, and to observe how the various fare collection systems are used in practice. e. Intelligent Transportation Systems BRT systems use intelligent transportation systems (ITS) to improve bus operations, reliability, speed, and customer satisfaction. 25 Common technologies implemented include TSP, automatic vehicle location systems (AVL), automated scheduling and dispatch systems, and real-time traveler information systems. 26 The most relevant ITS application for bus travel time is TSP, and there is a significant amount of research on the travel time benefits of TSP. In general, the research shows that there are 22 Beaton, Eric, Select Bus Service on the BX12, Power Point Presentation, Transportation Research Board (2009) 23 Jaiswall, Sumeet, Effects of Fare Collection Policy on Operating Characteristics of a Brisbane Busway Station, 32 nd Australasian Transport Research Forum (2009), available at 24 Schimek, Paul, et al, Boston Silver Line Washington Street Demonstration Project Evaluation, FTA-VA , 2005, at Transportation Research Board P.2 26 Characteristics of Bus Rapid Transit for Decision Making. Federal Transit Administration. February 2009, Project Number FTA-FL p. E-3 39
41 substantial variations in the time savings associated with TSP, with initial estimates ranging between 2-18 percent travel time saved, and a typical effect of 0.33 minutes per mile. 27 Similarly, the contribution of TSP to overall travel time saved has been estimated to range between 2-33 percent. 28 The literature suggests a number of reasons for this variation. For example, there are significant differences in the types and quality of data collected as well as in the methods used to analyze the data. 29 Thus, different studies have yielded different results, and these results often are not comparable. FTA has funded research to develop common assessment frameworks and methodologies, which should help address this issue in the future. There also are differences in the types of TSP systems deployed (e.g., GPS, loop detectors, etc.) and how these systems grant priority, and these differences can have a significant impact on bus travel times. For example, a 2006 analysis found that using red truncation or phase advance as priority strategies can significantly outperform phase extension, in terms of bus travel times. The study further found that the effect of phase extension in terms of bus travel time appeared to 30 be minimal. Finally, there are differences in the operating context of various BRT systems. For example, prior research suggests that TSP works best when stations are located at the far-side of intersections or when there are not significant amount of cross-traffic that may interfere with TSP operations. 31 Similarly, TSP will only be effective if there is sufficient traffic congestion to create signal delays in the corridor. A large number of near-side stations, a significant amount of cross-traffic, or relatively little traffic congestion can significantly degrade or eliminate the potential benefits of TSP. As a result of the large variation, it is not surprising to find a wide range in the reported benefits of TSP. In some cases, the travel time savings for TSP appear quite significant. For example: Eugene Oregon s EmX BRT achieved a travel time reduction of roughly one minute compared with the previous local service, with 28 seconds attributed to TSP Kittelson & Associates, Inc., et. al. TCRP 118, Bus Rapid Transit Practitioner s Guide, Transportation Research Board, Washington, DC P Available online at 28 Ibid at US Federal Transit Administration, Transit Signal Priority Research Tools P Abdelghany, Khaled, et al. Modeling Bus Priority Using Intermodal Dynamic Network Assignment-Simulation Methodology. Journal of Public Transportation. Vol. 9, No. 5 (2006): Available online at: 31 TCRP 118 at Thole, Cheryl and Alasdair Cain and Jennifer Flynn. The EmX Franklin Corridor BRT Project Evaluation FTA-FL April P.15 40
42 TSP in the Los Angeles Crenshaw corridor reduced average bus travel time by 8.8 percent in the northbound direction and 4.2 percent in the southbound direction. 33 TCRP 90 attributed a 7.5 percent reduction in travel time on the Wilshire-Whittier and Ventura Boulevards lines to TSP, with little to no impact on the opposing traffic. 34 The Santa Clara Valley Transit Authority attributed a number of benefits to TSP on Route 52, including better on-time performance, reduced variation in arrival times, and a travel time decrease of about 40 seconds. 35 In other cases, however, the travel time benefit is not as clear. A 2006 evaluation of the Las Vegas MAX BRT found that TSP had little or no impact on travel time. 36 The evaluation examined AVL data for northbound and southbound trips, finding that although TSP appeared to increase the speed of southbound off-peak trips, it actually decreased the speed of northbound off-peak trips. The report therefore concluded that TSP has little if any travel time benefit for the MAX route. The evaluation project team considered two possible explanations for the failure to identify a benefit for TSP. The first was potential limitations in the data provided, including gaps in the recording of AVL data. The second was the lack of significant traffic congestion in the corridor, which means that there were few signal delays in the corridor. The report concluded that the lack of traffic congestion was the most likely explanation. Similarly, an analysis of TSP along 82 nd Avenue in Portland, Oregon, examined bus travel times during periods when TSP was both turned on and turned off. The study found that TSP offered no significant benefit in the corridor, both in terms of travel time and schedule adherence. 37 A number of potential explanations were offered, including the existence of a significant number of near-side station locations, the existence of several cross-streets with high traffic volumes, and the fact that the study corridor was relatively short. Another study examined TSP on multiple bus routes in Portland, including a statistical analysis of bus running times based upon trip data provided by the local transit agency. The study found that the benefit of TSP for bus running times was inconclusive. On the one hand, a benefit was found in the afternoon peak in the primary direction of travel. On the other hand, the benefits during the morning peak and the afternoon off-peak periods were ambiguous. The authors 33 Gota, Stephen; Jones, Reinland, Metro s Countywide Signal Priority Program, Power Point presentation (2008), available at 34 Levinson, H., et. al. TCRP Report 90, Volume 1: Case Studies in Bus Rapid Transit, Transportation Research Board P Available online at 35 Transit Signal Priority Research Tools. FTA 2008 p US Federal Transit Administration, 2006 Evaluation of the Las Vegas Metropolitan Area Express (MAX) BRT Project (2006) at iv. 37 Sundstrom, Carl; Evaluation Of Transit Signal Priority Effectiveness Using Automatic Vehicle Location Data (2008), available at 41
43 concluded that a considerable amount of work needs to be done with respect to signal priority programs before the expected benefits of TSP are fully realized. 38 f. Service and Operations Service and operations planning includes a wide variety of issues, such as route length, route structure, service plan, frequency of service, station spacing and location, and method of schedule control. 39 All of these features interact to contribute to route time, schedule adherence, reliability, and customer experience. For example: shorter routes may reduce end-to-end running time and improve travel time reliability, 40 but may require more transfers; wider station spacing can reduce end-to-end travel times as well as total dwell time, but can require customers to travel greater distances to access stations; and Irregular headways can lead to irregular passenger distribution, increased bus bunching, and increased travel times. 41 Table 11: Travel Time Effects of Station Spacing and Dwell Times Condition Before (6 stops per mile) After (2 stops per mile) Same Boarding Times Dwell/stop 15 seconds 15 seconds Minutes/mile Slower Boarding Dwell/stop 15 seconds 20 seconds Times Minutes/mile Faster Boarding Dwell/stop 15 seconds 10 seconds Times Minutes/mile This project focused upon the impact of station spacing and location on route time. The literature suggests that increasing station spacing can have a significant impact on route time. For example, as shown in Table 11, TCRP 118 found that a change from six stations per mile to two stations per mile, with no change in the average dwell time, can reduce travel time from Kimpel, et al, Analysis of Transit Signal Priority Using Archived TriMet Bus Dispatch System Data, Transportation Research Record: No. 1925, at 166 (2005), available at 39 Characteristics of Bus Rapid Transit for Decision Making. Federal Transit Administration. February 2009, Project Number FTA-FL p. E-4 40 Characteristics of Bus Rapid Transit for Decision Making. Federal Transit Administration. February 2009, Project Number FTA-FL p Liu, Ronghui, et al, Modelling Urban Bus Service and Passenger Reliability, Institute for Transport Studies, University of Leeds (2007), available at 42

44 minutes per mile to 2.6 minutes per mile. 42 When average dwell times are reduced from 15 seconds to 10 seconds, the additional travel time benefit is just 0.2 minutes per mile, bringing the total to 2.4 minutes per mile. Similarly, a number of the FTA evaluations, summarized in Table 3, found very significant time savings as a result of reduced station spacing. Station stop location also can have a significant impact on travel time. In general, the literature suggests that far-side stops provide greater travel time and variability benefits than near-side stops. 43 However, in some cases the effect may not be due to station location alone. For example, an analysis in Portland, Oregon examined scenarios with near-side and far-side station locations, both with and without TSP. The analysis found, among other things, that with TSP, far-side station stops resulted in an 11 percent travel time reduction, while near-side station locations resulted in a six percent travel time increase. 44 The analysis further found that the travel time benefit of station stop location was minimal without TSP. g. Branding The use of naming, logos, and color schemes plays an important role in forming public perception. A successful branding campaign conveys the image of a faster, more convenient service and helps fuel a lasting increase in ridership. 45 Figure 16: Los Angeles Metro Rapid Logo As shown in Figure 16, the Metro Rapid service in Los Angeles, uses distinctive red lettering and an elongated dot over the letter i to provide the impression of speed. Similarly, the Las Vegas Max service uses distinctive buses with a unique livery. In Boston, the Silver Line is branded as 42 TCRP 118 at TCRP 118, at Pangilinan, Christopher, Using Hardware-in-the-Loop Simulation to Evaluate Signal Control Strategies for Transit Signal Priority, Power Point presentation at the 84 th Annual Meeting of the Transportation Research Board (2004), available at 45 Hess, D., & Bitterman, A. (2008). Bus Rapid Transit Identity: An Overview of Current Branding Practice. Journal of Public Transportation, 11(2). p
45 an extension of the light rail system rather than an additional bus route. 46 Research shows that BRT vehicles are more recognizable and memorable than traditional buses. 47 Although branding is a critical element of BRT, there is no direct link between branding and route time. Rather, branded services tend to use BRT features, such as increased station spacing and TSP, that increase speeds and thus decrease route time. Thus, branding was not included in this analysis. IV. QUANTIATIVE ASSESSMENT OF BRT ELEMENTS a. Purpose The purpose of this study was to determine the effect on bus speed of individual characteristics of BRT. A variety of techniques are available for increasing bus speeds, including dedicated bus lanes, virtual bus lanes, such as buses operating on managed lanes, priority treatments, such as traffic signal priority and queue jump lanes, reducing dwell times at stops, and reducing the total number of stops along a bus route. This study was designed to assess the relative contributions of these characteristics to travel time. Increasing average bus speeds has a number of significant benefits, including reducing capital and operating costs for transit agencies, attracting new transit riders, and reducing travel times for transit customers. Thus, a secondary purpose was to provide guidance on which BRT elements can best help to achieve these benefits. b. Methodology The overall methodology was to develop a set of metrics to assess the travel time benefits of various BRT elements, to collect data on these metrics from as many transit agencies as possible, and to conduct a stepwise linear regression analysis to determine the impacts of specific elements on travel time. Key steps in the process included a workshop, the development and delivery of a survey, working with transit agencies to fill out the survey, compiling data into a series of data sets, and running the regression model. 46 Hess, D., & Bitterman, A. (2008). Bus Rapid Transit Identity: An Overview of Current Branding Practice. Journal of Public Transportation, 11(2). p Hess, D., & Bitterman, A. (2008). Bus Rapid Transit Identity: An Overview of Current Branding Practice. Journal of Public Transportation, 11(2). p
46 The primary audience for this report is US cities and transit agencies. Therefore, data collection efforts were targeted at US transit agencies. However, there also was a significant effort to collect data on international systems, especially those systems operating in similar contexts as US systems. We reached out to several Canadian transit operators and received data from the York Region and Vancouver. We also discussed the project with the European Union s Buses with High Levels of Service (BHLS) project. BHLS sent us information on a variety of European projects, as well as a report on enhanced bus service in France. However, this information did not have sufficient data to be included in the analysis. i. Workshop A work plan was developed and a workshop was held at the Transportation Research Board s (TRB) 2009 annual meeting. More than 30 participants attended the workshop, representing transit agencies, consulting firms, bus equipment suppliers, metropolitan planning organizations, international development banks, and the federal government. The purpose of the workshop was to brief transit agencies and industry members on the research project, to receive feedback on the scope and key issues that should be considered, and to identify transit agencies and others who would like to contribute data to the project or otherwise participate. The workshop attracted a wide range of participants, with representatives from the following cities, planning agencies, and consulting firms: Chicago Transit Authority Center for Urban Transportation Research/National Bus Rapid Transit Institute, at University of South Florida Federal Transit Administration Lane Transit District City of Los Angeles Maryland Transit Administration Montgomery County Department of Transportation, Maryland Nelson/Nygaard Pace Suburban Bus Parsons Brinckerhoff Santa Clara Valley Transportation Authority University of Washington 45
47 Washington State Department of Transportation Washington Metropolitan Area Transit Authority World Bank A presentation regarding the research plan was made by the project team, followed by presentations from Los Angeles Metro, the Washington Metropolitan Area Transit Authority, and Lane County Transit. A facilitated discussion followed designed to gather feedback and suggestions on the work plan. That feedback, as well as other suggestions, was incorporated and a final work plan was developed. In general, participants were enthusiastic about the project. They expressed a need for better understanding of the performance implications of various BRT strategies and looked forward to the results of this project. There was significant discussion regarding the data needs to complete the analysis. Most participants expressed a belief that the data was available within transit agencies. Several transit agencies volunteered to provide data, and those agencies were the initial focus of data collection efforts. ii. Developing the Surveys Based upon the workshop and a literature review, a survey was developed to solicit information on key metrics for use in the analysis. A target list of potential rapid bus and BRT routes was created, and routes were selected in consultation with participating transit agencies. The primary criteria for inclusion of specific routes were headways of 15 minutes or less and the use of at least some BRT elements. Project staff filled in information on the surveys through publicly available sources. The surveys were then sent to transit agencies to verify the data compiled by project staff and to fill in missing data. The surveys sought data on: Number of stops per direction. Use of low floor buses. Presence of dedicated lanes. Operating hours, start and end times, and total daily hours of coverage. Peak end-to-end travel time AM and PM peak. Headway, AM and PM peak time, peak direction, AM and PM peak time, non-peak direction, AM and PM mid-day peak and non-peak direction. 46
48 Route length. Total number of general purpose lane-miles during peak periods. On street parking restrictions during peak hours. Number of lane miles where parking is restricted during peak hours. Total number of signalized intersection crossings. Number of intersections with TSP installed. Number of intersections with queue jump lanes. Number of intersections with bus delays caused by left turn queues in peak period. Number of intersections with bus delays caused by right turn queues in peak period. Average daily traffic, AM and PM peak, non-peak, and location where measured. Number of stations or stops located at the near side of intersection. Number of stations or stops located at the far side, or mid-block. Number of stations or stops where the bus stops in travel lane. Percent of boardings where fare is paid in cash, peak periods. Number of doors used for boarding. Date boarding data was collected. Average number of weekday boardings. Average number of weekday boardings per revenue hour. Average number of passenger boardings per stop, peak hours. Average number of passenger alightings per stop, peak hours. Average weekday ridership. Average total ridership in corridor per day. Percent of peak period buses with levels of service D,E, or F. Average passenger trip length. Number of stations or stops where bus does not stop in the travel lane. Percent of boardings where passengers use a pass during peak periods. Percent of stops where wheelchair ramp is deployed, peak periods. Percent of stops where bicycle is loaded. Average non-express bus weekday riders in corridor. Average number of weekday boardings where wheelchair ramp is deployed. Project staff reviewed each of the surveys and attempted to fill in missing data by searching the literature and websites and by working directly with agency staff. Ultimately, however, there was significant missing information for a number of variables, including: percent of fares paid on-board; station stop location; average daily traffic data; 47
49 the extent to which parking is permitted in the bus lane; queue jump lanes; intersection delays; and level of service data. Of these, one of the most important is fare collection, because fare collection is a major determinant of dwell time. Most routes in the sample offer multiple options for fare collection, including cash, smart cards, and passes. To understand the impact of fare collection on travel time, it is therefore necessary to collect data on the proportion of trips, per route, that use each type of fare collection. It also is necessary to understand how passengers interact with the various fare collection systems. Most transit agencies did not have information on the proportion of trips that use each fare collection medium. They also did not have information on boardings and alightings per stop. Therefore, it was impossible to construct an adequate fare collection variable. Nevertheless, because off-board fare collection typically is implemented with other strategies, such as multiple door boarding and low floor buses, we believe the data sets and the model implicitly capture the effects of fare collection. Station stop location also is an important variable. As discussed in the literature review, far-side stops generally are believed to provide a significant travel time benefit as compared with nearside stops. Most transit agencies, however, did not have information on the proportion of nearside and far-side stops on their routes. Project staff made several attempts to determine station stop location, including discussions with transit agencies and reviews of satellite images of specific routes. It was finally determined, however, that the only way to accurately determine station stop location would be to physically inspect each route, which was beyond the scope of the project. Thus, this study did not assess the impact of station stop location on travel time. Appendix 2 contains a sample survey. iii. Developing the Model The data was divided into six different data sets: (1) AM Peak data, (2) PM Peak data, (3) combined AM/PM data, and the same three data sets again, but with the Los Angeles data excluded. As discussed below, the data sets excluding Los Angeles were developed because we were unable to verify the number of signalized intersections with TSP in Los Angeles. It was believed that this missing information could affect the results regarding TSP. 48
50 The dependant variable for all regressions was peak route travel time. The independent variables included route length, peak headway, number of stations per mile (station density), average number of boardings per weekday, and average number of boardings per stop during peak hours. Five independent categorical variables also were used: a TSP density variable, a dedicated bus way variable, a low floor bus variable, a queue jump lane variable, and a number of doors variable. The TSP categorical variable measured TSP density along the bus route. TSP density was coded as high, medium, low, or none. Bus routes with more than 70 percent of signalized intersection crossings with TSP were coded as high. Routes with percent of signalized intersection crossings with TSP were coded as medium, and routes with less than 30 percent of signalized intersection crossings with TSP were coded as low. Routes with zero signalized intersection crossings with TSP were coded as none. The dedicated bus lane categorical variable captured the extent to which a bus route used a dedicated bus lane or busway, broken down into high for most of the route, low for some of the route, and none or none of the route. The low floor bus variable was coded into three groups. All low floor buses are those routes where the entire bus fleet consists of low floor buses. Mixed low floor buses are those routes were some low floor buses and some standard buses are used. No low floor buses are fleets made up entirely of standard buses. The queue jump lanes variable was coded in a binary manner, with 0 for no queue jump lanes and 1 for queue jump lanes included anywhere on the route. The number of doors variable measured the number of doors typically used for boarding and alighting. It was coded as one door, two doors, or three doors, depending upon the number of doors reported by the transit agency. The first step in the analysis was to assess correlations between the independent variables. A correlation of one or negative one is perfectly correlated, and correlation decreases as numbers diverge from one or negative one. Table 12 provides the correlations for the complete AM Peak data set, which is representative of the correlation tables for all six data sets. Appendix 2 contains the correlation table for the complete PM Peak data set. Table 12 shows that route time and route length are highly correlated. This correlation is intuitive and expected. However, because the goal was to address all possible impacts on route time, we included route length as an independent variable. We also noted that low and no 49
51 dedicated bus lanes were high correlated with each other. However, we believe that this correlation likely was due to the fact that these are categorical variables constructed for purposes of the analysis, and not due to correlation in the data itself. Thus, we continued to use both variables in the model. All other independent variables were neither highly correlated with each other nor with the dependent variable. As a result, no multi-colinearity was assumed. In other words, the Table 12: AM Correlation Table Legend: A-Route Time, B-AM Length, C-Stations Spacing, D-High TSP, E- Medium TSP, F-Low TSP, G- Low Dedicated Lanes, H-No Dedicated Lanes, I-1 Door, J- 3-Door, K-All Low Bus, L-Mixed Low Bus AM Model A B C D E F G H I J K L A 1 B C D E F G H I J K L predictions made from the model concerning a single independent variable are not skewed by another independent variable in the model. A regression model using the full AM Peak data set (n=119) was constructed. Initially, peak route time was regressed against a basic set of independent variables: AM route length, AM number of stations per mile (station density), and AM headway. Also, the constant term was set to zero to ensure that peak route time would be greater than zero. The model showed that AM 50
52 headway was not a good predictor of route time, and thus AM headway was removed, resulting in the following basic regression equation: y= 3.45 (AM Length) +.14 (AM Station Density) The equation had an adjusted R-Squared of.92686, indicating that much of the variation in the data is explained by the included variables. Both variables were significant at the 95 percent level. An F-test was performed to test if the model results were significantly different than what would have been found by chance. The F-test showed that the model is a good predictor of route time. Next, a series of nested models was developed by adding variables piecewise to the simple model. Testing was conducted at each stage to determine the significance of each new set of variables, the model as a whole, and the new model compared to the previous one. The variables were added in the following order: TSP, dedicated busways, number of boarding doors, low floor buses, queue jump lanes, average number of boardings per weekday, and average number of weekday boardings per stop. Based upon testing of each of the variables, average number of weekday boardings and average number of weekday boardings per stop were eliminated from the final model, because each variable was shown to be insignificant as a predictor of route time. The project team explored a number of possible explanations for the elimination of these variables, including anomalies in how the data was imported into the data sets. In each case, however, it was clear that neither of the boardings variables was appropriate to include in the final model, and the boardings variables were eliminated. Similarly, the queue jump categorical variable was eliminated from the final model because it was an insignificant predictor of route time. This is most likely because very few routes reported the use of queue jump lanes, and thus there was insufficient variability in the data. The final model took the form: y= 3.18(AM Route Length) (AM Station Density) (High TSP) (Medium TSP) 5.42 (Low TSP) (Low Dedicated Lane) (No Dedicated Lane) (1 Door) (3 Door) 9.85 (All Low Bus) -.85 (Mixed Low Bus) The model has an adjusted R-Squared of.9357, indicating that the model is a very good predictor of route time, although the improvement in R-Squared over the basic model is small. F-tests show that the model is an improvement over the simple models, and that all the variables are significant at the 95 percent level except for the dedicated bus lanes and the number of doors used for boarding categorical variables. 51
53 Next, the procedure was repeated for the PM data. The final PM model had an adjusted R- squared of.9417 and took the form: y= 3.6 (PM Route Length) (PM Station Density) (High TSP) (Medium TSP) (Low TSP) (Low Dedicated Lanes) (No Dedicated Lanes) (1 Door) (3 Doors) (Low Buses) (Mixed Low Buses) The partial F-test shows that the model is an improvement over the simple model, and all of the variables are significant at the 95 percent level except for the TSP categorical variables. A comparison of the AM and PM model shows some interesting differences, including the significance of some of the variables and the values and signs of some of the coefficients. Some of these differences may be attributed to differences in the AM and PM data sets, including differences in running times, number of stations, route length, and number of signalized intersection crossings with TSP. Because of the differences in the AM and PM routes, the two data sets were merged to create a combined data set. The combined data set also doubled the sample size, to n=238. The combined data was regressed in the same nested fashion as the AM and PM individual models. The final combined model had an adjusted R-Square of.9348 and took the form: y= 3.39 (Length) (Station Density) (High TSP) (Medium TSP) 5.3 (Low TSP) (Low Dedicated Lanes) (No Dedicated Lanes) (1 Door) (3 Doors) -9.4 (Low Buses) (Mixed Low Buses) The F-test shows that the model is an improvement over the simple model, and all of the variables are significant at the 95 percent level except for the number of doors used for boarding categorical variable. As discussed more fully below, the nested models yielded both intuitive and counter-intuitive results. One area that appeared to yield significant counter-intuitive results was TSP. We reviewed the data to determine whether anomalies in the data could be impacting the TSP results. The data for Los Angeles included number of signalized intersections with TSP, but not a total number of intersections crossed. Nevertheless, we had coded the Los Angeles routes as high TSP, based upon conversations with staff at Metro and the Los Angeles Department of Transportation. Without data on total number of intersections crossed, however, it is possible that some of the routes were improperly coded. Therefore, we excluded the Los Angeles routes from the data set and ran the model again in the same nested fashion as described above. The results are discussed in more detail below. 52
54 c. Results To analyze the results, the regressions for all six data sets were assessed together, rather than individually, to enable the identification of trends across the data sets. Table 13 contains the coefficients for each data set, and the discussion that follows interprets these coefficients. It is important to note that the data sets contained in Table 13 are not nested models and cannot be directly compared against each other. All six of the model runs produced very high R-squared values, indicating that most of the variation in route time is explained by the independent variables. In most cases, the sign or direction of the effect was intuitive, although there were some anomalies that are discussed below. Table 13: Coefficients Independent Variable AM Peak Includes Los Angeles PM Peak Combined AM/PM Peak AM Peak Excludes Los Angeles PM Peak Combined AM/PM Peak Station Density 1.42* 2.23* 1.81* 1.45* 2.33* 1.88* High TSP Density 7.08* * -5.76* Medium TSP Density 13.07* * 12.76* Low TSP Density -5.42* * -4.56* Low Dedicated Bus * * Lane No Dedicated Bus * * Lane 1 Door used for * 6.29** boarding 3 Doors used for * 17.02** boarding Route length 3.18* 3.60* 3.39* 2.94* 3.49* 3.22* All low Buses -9.85* * -8.50* * Mixed Low Buses -0.85* * 2.36* * N= Adjusted R-Squared * = significant at the 95% level ** = significant at the 90% level i. Station Density Station density is a measure of the number of stations per mile along the route. The literature suggests that reduced station spacing tends to have a significant impact on travel time, often in 53
55 the range of percent, and in some cases as high as 67 percent. 48 The analysis supports this conclusion generally, with each of the six data sets demonstrating a positive relationship between station spacing and route time. These effects ranged from a low of 1.42 additional minutes, to a high of 2.23 additional minutes, for each station added per route mile. In other words, as the density of stations increases per mile, route time consistently increases. The station density variable was significant at the 95 percent level in all six data sets. Although there appears to be a clear relationship between station density and route times, it should be noted that decreasing station density can have a significant negative impacts on passenger convenience, which in turn could affect ridership. As noted by the Transit Capacity and Quality of Service Manual, a balance must be struck between providing too few stops, each with relatively high dwell times and relatively long passenger walk times, and providing too many stops (which reduce overall travel speeds due to the time lost in accelerating, decelerating, and possibly waiting for a traffic signal every time a stop is made). 49 In other words, there is a tradeoff between the convenience of passengers attempting to access stations and the convenience of passengers on board the bus, who experience additional trip times for each additional station stop. Transit agencies should carefully weigh the benefits and costs of reduced station density before making major service changes. ii. Low Floor Buses Transit agencies use low floor buses to decrease boarding and alighting times, or dwell time, and thus increase travel speeds. This analysis found a strong relationship between the use of low floor buses and route time. In all six data sets, the use of all low floor buses significantly decreases route time compared with routes that use no low floor buses, with the magnitude of the decrease ranging from 8.16 to 9.85 minutes. These findings were significant at the 95 percent level, except in both PM models. Similarly, five of the six data sets found that the use of a mixed fleet of low floor buses decrease route time as compared with a fleet without low floor buses. The magnitude of the decreases ranged from 0.85 minutes to minutes. In the sixth data set, the use of a mixed fleet of low floor buses showed an increase of route time of 2.36 at the 95 percent significance level. Given the isolated nature of this result, as well as its relatively small magnitude, it likely is the result of an anomaly in the data, rather than an indication that low floor buses may reduce speeds. 48 TCRP Kittelson & Associates, Inc., et. al. Transit Capacity and Quality of Service Manual, 2d Edition, at 4-4, Transportation Research Board
56 Although the time savings associated with low floor buses appears quite significant, it is important to note that these savings may not be the result of low floor buses alone, but rather of a combination of strategies associated with low floor buses. For example, low floor buses typically are implemented with off-board fare collection. Thus, implementation of low floor buses alone may not achieve the types of results suggested by the model. iii. Number of Boarding Doors The literature suggests that increasing the number of boarding doors, coupled with other strategies, such as off-board fare collection, can reduce dwell time and thus reduce travel times. The model produced mixed results in this regard. On one hand, it shows that having one boarding door increases route time as compared with having two doors for boarding, and this result was significant at either the 95 percent or 90 percent confidence level in two of the data sets. In the PM Peak data set excluding Los Angeles, the use of one boarding door increased route time by nearly 12 minutes as compared with two boarding doors, with the result significant at the 95 percent confidence level. As with low floor buses, however, the large magnitude of this effect is likely due in part to the implementation of complementary strategies, such as off-board fare collection, that are not included in the model. The result for three boarding doors is counter-intuitive. In all six model runs, the use of three boarding doors showed a significant increase in route time as compared with the use of two boarding doors. In four of the data sets, the result was not statistically significant, but significance at the 95 percent level was demonstrated in one model run. Nevertheless, we are hesitant to draw any conclusions from these results, because the number of bus routes in the sample reporting the use of three boarding doors was quite small (n=4). iv. Transit Signal Priority Density Our analysis paints a mixed picture of the benefits of TSP. As discussed in the Methodology section, a data set excluding Los Angeles was created to address anomalies in the Los Angeles data regarding TSP. Thus, the results will be discussed for the three model runs that included data for all bus routes, and then for the three model runs that excluded the Los Angeles data. In each case, low, medium, and high density TSP is compared with routes with no TSP installed, all else being equal. 55
57 For the three model runs that included all bus routes, low TSP density consistently showed reductions in travel time as compared with no TSP, with two of the model runs testing at the 95 percent confidence level (AM Peak and Combined AM/PM Peak). Moreover, the magnitude of the reduction was very consistent, ranging from a time savings of 5.42 minutes to a time savings of 5.52 minutes. By contrast, medium TSP density consistently showed increases in travel time. These increases spanned a wide range, from 3.67 minutes to minutes. Moreover, two of the model runs showed significant travel time increases at the 95 percent confidence level. Finally, high TSP density produced mixed results, ranging from a slight travel time savings of 0.27 minutes to a travel time increase of 7.08 minutes. Two of the results, AM Peak and Combined AM/PM Peak, tested at the 95 percent confidence level, and both of these showed travel time increases. The results in the model runs that excluded Los Angeles yielded more intuitive results. In all three data sets that excluded Los Angeles, high TSP density consistently showed a travel time savings, ranging between 4.8 and 5.76 minutes, with the 5.76 minute result, AM Peak, testing at the 95 percent confidence level. In other words, excluding the Los Angeles data eliminated all results showing a travel time increase for high TSP density. Similarly, the low TSP density data sets that excluded Los Angeles also showed consistent travel time savings, ranging from 4.56 minutes to 5.06 minutes, with the 4.56 travel time savings testing at the 95 percent confidence level. Thus, excluding the Los Angeles data did not impact the result for low TSP density, which we expected because all of the Los Angeles routes were coded as high TSP density routes. Finally, excluding the Los Angeles data also did not impact the result for medium TSP density. In other words, like the complete data sets that included Los Angeles, all of the medium TSP results showed a travel time increase. The range was between 3.32 and minutes, with the minute increase testing at the 95 percent confidence level. To summarize, our results showed that: Low density TSP provides a consistent travel time decrease, regardless of whether Los Angeles routes are included; Medium density TSP shows a consistent travel time increase, regardless of whether Los Angeles routes are included; If Los Angeles routes are excluded, high density TSP shows a consistent travel time decrease, with a 5.76 minute decrease in the AM Peak testing at the 95 percent confidence level. 56

58 If Los Angeles routes are included, high density TSP shows a consistent travel time increase, with the increase at the 95 percent confidence level in two of the three data sets. Why is the travel time benefit of TSP inconsistent in the model? One possible explanation is that there are anomalies in the data that we could not account for. As discussed in the literature review, data quality and consistency historically have been significant issues in assessing TSP effectiveness. Another possible explanation is that there are operational issues associated with the implementation of TSP in Los Angeles that hinder its effectiveness. When we excluded the Los Angeles data, high density TSP consistently showed a travel time decrease, which is what we expected. What might cause these operational issues? Los Angeles is a highly congested urban area. The literature suggests that the effectiveness of TSP can be significantly impacted by intersecting cross streets with high traffic levels. Thus, it is possible that the effectiveness of TSP in the Metro Rapid system is being degraded by the impacts of cross traffic. It also is possible that the signal priority system is interfering with itself. Figure 17 shows the Metro Rapid system, depicted by the red lines on the map, is laid out in a grid pattern, with a significant number of intersections among routes. All of these routes are operating high frequency service. If a bus is granted priority at an intersection with another bus route, that priority could introduce delays on the intersecting bus route. In other words, the benefits of TSP on one route could be reduced by delays introduced by the TSP on intersecting routes. The net result, on a systemwide basis, could be little or no benefit of TSP, which is what our analysis suggests. Figure 17: Metro Rapid System Map Finally, Los Angeles uses a phase extension strategy on its TSP, extending the green for buses within a certain distance of an intersection. One analysis in the literature review found that the travel time benefits of phase extension TSP may be minimal. 57
59 v. Dedicated Bus Lanes Dedicated bus lanes are often considered the gold standard for BRT and the literature suggests that dedicated busways can have a significant impact on travel time. For example, the evaluation report on the Pittsburgh West busway reported that the busway resulted in a significant travel time benefit. Our data contains 44 routes with bus lanes on at least a portion of the route, and the model confirms that dedicated bus lanes can reduce travel times. In all six data sets, the presence of either no dedicated bus lanes or low dedicated bus lanes increased route times as compared with high dedicated bus lanes, all else being equal. In the Combined AM/PM Peak data sets, this result was significant at the 95 percent level, with the magnitude ranging from 4.22 to 7.02 minutes. Moreover, the increase in route time was greater for the no dedicated bus lane variable than it was for the low dedicated bus lane variable, which is what one would expect. It is interesting to note that the magnitude of the effect regarding dedicated bus lanes at the 95 percent confidence level is not as great as the magnitude of the effect of low floor buses at the 95 percent confidence level. This suggests that although dedicated bus lanes may be effective to reduce travel times, the use of low floor buses and other associated strategies on arterial streets may result in comparable or greater travel time savings. For example, the end-to-end travel times for the Los Angeles Orange Line are comparable to those of the Ventura Metro Rapid line, an arterial service that runs parallel to the Orange Line. 50 Travel time variability on the Ventura Metro Rapid line, however, is significantly higher than on the Orange Line. Although our model was limited by the number of routes with dedicated bus lanes, it seems to confirm that dedicated bus lanes lead to significant reductions in travel time. The model also suggests that the travel time benefits of a dedicated bus lane should be assessed in comparison to the travel time benefits of other BRT-related strategies. vi. Route Length The result regarding route length was consistent with expectations as route lengths increased, route time also increased. In all six models, the variable was significant at the 95 percent level. The magnitude of the effect was relatively consistent, ranging from additional minutes for each additional mile of route length, all else held constant. 50 Presentation by Rex Gephart, Program Manager, Los Angeles Metro, presented at the Federal Transit Administration Bus Rapid Transit Forum (April 2006) 58
60 d. Key Findings and Conclusions The following are the key findings and conclusions from this project: In general, there are significant travel time benefits associated with a number of BRT elements, and these benefits appear across a large sample of rapid bus and BRT routes. These travel time benefits can translate into both capital cost and operating cost savings for transit agencies, improved customer experience, and reductions in fuel consumption and emissions. The use of all low floor buses, as compared with the use of standard floor buses, provided the most significant travel time benefit. This benefit was consistent across all six data sets and, in four of the data sets, tested at the 95 percent confidence level. Fleets composed of a mix of standard and low-floor buses also showed significant benefits, but at a lower magnitude and with lesser consistency. It is important to note that the magnitude of the low floor bus travel time savings is not likely due to low floor buses alone. Rather, low floor buses typically are implemented with other strategies that were not included in the model, such as station design and the use of off-board fare collection. Thus, the time savings associated with the low floor bus variable should be attributed to a package of interventions that include, but are not limited to, low floor buses. Reducing station density, or decreasing the number of stations per mile, provided a consistent benefit in all six data sets at the 95 percent confidence level. Moreover, there was relatively little variability in the magnitude of the benefit across all six data sets. This result is not surprising, because reducing station density decreases the number of stops that a bus must make and reduces the total amount of dwell time across a route. In adjusting station spacing, however, it is important to strike a balance between run-time savings and passenger convenience, because wider station spacing generally requires longer access times to stations. The use of two boarding doors decreased travel time in all six data sets when compared with the use of one boarding door. Unlike low floor buses and station density, however, the benefit was statistically significant at the 95 percent confidence level in only one data set. It also was statistically significant at the 90 percent confidence level in another data set. As with low floor buses, the magnitude of the effect likely includes off-board fare collection and station design, which were not expressly captured by the model. Thus, the time savings associated with the multiple boarding doors should be attributed to a package of interventions that include, but are not limited to, the use of multiple doors. 59
61 The use of dedicated bus lanes offered a significant travel time benefit compared with no dedicated bus lanes. It is interesting to note, however, that the effect of low floor buses was greater at the 95 percent confidence level than the effect of dedicated bus lanes. In part, this may be because the sample of dedicated bus lane routes was relatively small. However, it also suggests that, in certain circumstances the use of low floor buses and other associated strategies on arterial streets may result in comparable or greater travel time savings than dedicated lanes alone. For example, a dedicated bus lane may have marginal time savings benefits compared with bus service on an arterial with low traffic volume. On the other hand, our model did not account for travel time variability, the perception of permanence, and other important issues associated with dedicated lanes. The travel time benefit of TSP was not conclusive. In some cases, TSP appeared to provide travel time benefits while in other cases it did not. This finding is consistent with the literature, which indicates that TSP can significantly reduce travel time, but that these benefits can vary substantially based upon local conditions, such as traffic levels in the corridor and on cross streets, the type of TSP system implemented, and the data and methodologies used to evaluate TSP operations. FTA has funded important work to develop better TSP assessment methodologies, the results of which may help address this issue in the future. The inability to establish a consistent benefit for TSP has policy implications. Most rapid bus and BRT projects that receive federal funding do so through the Small Starts program. For many of these projects, the use of TSP is a requirement to receive funding. It is therefore important to ensure that TSP provides benefits intended by the requirement. Transit agencies must take many factors into account when deciding which elements of BRT to implement. Travel time savings are important, but there are other factors that also must be considered, such as cost, customer perception, and transit oriented development goals. Although this study is not intended to be a cost benefit analysis, the following are examples of representative costs for different BRT elements, as set forth in the literature. A more extensive list can be found in Appendix 3. 60
62 Table 14: BRT Element by Time Savings and Cost Characteristic Effect Representative Costs** (2004 dollars) Station density (stations per mile) minute increase in route time per station added per mile Basic shelters: $20,000 Enhanced shelters: $30,000 Grade separated stations: $2.5 Million Use of low floor buses Dedicated bus lanes Transit signal priority density Number of boarding doors ** Source: TCRP minute decrease in route time where fleets consist of all low floor buses minute increase in route time where no dedicated bus lanes are used compared with a high level of dedicated bus lanes The effect varied across data sets and levels of TSP density, showing both increases and decreased in route time minute increase in route time where only one boarding door is used as compared with two boarding doors 40 ft. standard buses: $325, ft. low floor, articulated buses: $525,000 - $725,000 Advanced BRT vehicle: $900,000 - $1 Million Bus lanes: $100,000 per mile Median bus lanes: $ Million per mile Grade separated lanes: $13 Million TSP: $30,000 per intersection Loop detection: $2,000 per intersection See bus costs above. Although transit agencies were willing to share their data and generous with their time in this project, it is important to note that providing transit service is their primary function, not data collection. Thus, data was often not sufficiently detailed to provide the depth of analysis originally envisioned for this project. Moreover, there were wide gaps in the consistency and quality of the data among transit agencies. The FTA should consider pursuing and funding a program to help transit agencies develop and report data that would enable the industry to better understand the benefits of specific strategies and investments. Among other things, this would enable better assessment of system performance and would help guide future investment and funding decisions. 61
63 CONCLUSION Understanding the impact of various BRT strategies is critical to ensuring that transit investments maximize the benefits to transit agencies and customers. Although evaluations of individual corridors have been conducted, this was the first effort to measure performance across a large number of routes and across a wide range of BRT strategies. Significant travel time benefits were found with multiple door boarding, low floor buses, dedicated bus lanes, station density, TSP and route length. Although the model did not include a specific variable for off-board fare collection, it is believed to contribute to the effect of some of the other variables, especially multiple door boarding and low floor buses. There was significant variability in the travel time benefits of some of these elements, especially TSP. The literature clearly shows that the effectiveness of TSP is dependent upon a wide range of local conditions and can vary significantly across systems. For example, TSP applications have achieved time savings as high as 33 percent and as low as two percent and, in the case of the Las Vegas MAX, resulted in no travel time benefit. Our analysis confirms a moderate degree of variability in the performance of TSP. In some cases, the benefits of TSP were clear, while in other cases they were not. This variability could be due to the nature of the data received from transit agencies, which did not include intersection-level analysis. In other words, TSP could be achieving significant benefits at specific intersections, but those benefits are not showing up at the route level in our model. Moreover, the variability could be due to differences among cities regarding how TSP is implemented. For example, cities use different TSP technologies and different methodologies for granting priority. These can have a significant impact on performance. In any event, our analysis suggests the need to better understand the performance of TSP, as well as the effectiveness of various types of TSP technologies, especially because TSP is a requirement for Small Starts funding. Finally, given the potential policy, financial, and other implications of our findings, there are potential next steps that should be considered. These include: Additional research to understand better the benefits of TSP, including demonstration of different types of TSP systems and documenting their performance in detailed before and after studies; Demonstrating new approaches to improving travel times and reducing variability on arterial bus services. Our research, as well as some anecdotal evidence, suggests that 62
64 implementing BRT elements on arterial streets, such as TSP, low floor buses, and advanced fare collection, can have a comparable running time effect as dedicated lanes, but may not be effective at addressing travel time variability. FTA could therefore demonstrate new technologies, such as intermittent bus lanes, to address both running time and travel time variability on arterial streets, without the need for physical bus lanes. Improving data collection and reporting to better understand the benefits of specific interventions. Although transit agencies were willing to share their data and were generous with their time in this project, it is important to note that providing transit service is their primary function, not data collection. Thus, data was often not sufficiently detailed to provide the depth of analysis originally envisioned for this project, and there were wide gaps in the consistency and quality of the data among transit agencies. A federal program could establish performance metrics as well as standards for data collection and reporting. Moreover, the program could be demonstrated initially in a single BRT corridor, such as the Los Angeles Orange Line or the Eugene EmX corridor, and expanded over time to additional corridors. 63
65 REFERENCES Abdelghany, Khaled, et al. Modeling Bus Priority Using Intermodal Dynamic Network Assignment-Simulation Methodology. Journal of Public Transportation. Vol. 9, No. 5 (2006): Available online at: Baker, Ronald J. Implementation costs for transit signal priority range from $8,000 to $35,000 per intersection. July, Research and Innovative Technology Administration. Available online at: 929?OpenDocument&Query=CApp Baltes, Michael, and Dennis Hinebaugh. Lynx Lymmo Bus Rapid Transit Evaluation Technical Memorandums One Through Three. Federal Transit Administration. Report number: NCTR , PRWO-BC July Available online at: Year%20Report.pdf Beaton, Eric. Select Bus Service on the BX12. Transportation Research Board Presentation. Available online at: Year%20Report.pdf Bothwell, Brian. Brisbane s Busway. Brisbane Transport. Buses with High Level of Service. Presentation. Cain, Alasdair, Jennifer Flynn, Mark McCourt and Taylor Reyes. Quantifying the Importance of Image and Perception to Bus Rapid Transit. Federal Transit Administration. Report number: FTA-FL , March Available online at: %20March%202009_Final%20Draft_highres.pdf Cham, Laura et al. Honolulu Bus Rapid Transit (BRT) Project Evaluation Final Report. Federal Transit Administration. Report number: FTA June Available online at: Danielsson, Peter. BRT. Volvo Bus Corporation. Buses with High Level of Service. Presentation. Available online at: Diaz, Roderick B. and Dennis Hinebaugh. Characteristics of Bus Rapid Transit for Decision Making. Federal Transit Administration. February 2009, Project Number FTA-FL Print. Available online at: 64
66 Dickens, Matthew and John Neff Public Transportation Fact Book, 61st Edition. American Public Transportation Association. Available online at: Dueker, Kenneth J.,Thomas J. Kimpel, James G. Strathman, and Steve Callas. Determinants of Bus Dwell Time. Journal of Public Transportation. Vol.7, No. 1 (2004): Available online at: Federal Transit Administration. Evaluation of Port Authority of Allegheny County s West Busway Bus Rapid Transit Project. Report Number: FTA-PA Washington, DC Project Manger Stewart McKeown. Available online at: April_2003.pdf Federal Transit Administration. Small Starts Fact Sheet. A Section 5309 Capital Investment Grant Program. June 1, Available online at: Fernandez, Rodrigo, et al, Influence of Platform Height, Door Width, and Fare Collection on Bus Dwell Time. Laboratory Evidence for Santiago De Chile, Transportation Research Board Annual Meeting 2010, Paper # Finn, Brendon, Odile Heddebaut, Sébastien Rabuel. Buses with a High Level of Service (BHLS): The European BRT Concept. Transportation Research Board. July 15, Available to order online at: Garrigva, Damien. La Linea 4 de Busway Nantes. Nantes Mētropol Communauté Urbaine. Buses with High Level of Service. Presentation. Available online at: blobheadervalue1=filename%3d3.2_buswaynantes.pdf&blobwhere= &blobhea dername1=content-disposition&ssbinary=true&blobheader=application/pdf George, David. Kent Thameside Fastrack. Ketn Thameside Delivery Board. Buses with High Level of Service. Presentation. Available online at: Gephart, Rex. Program Manager, Los Angeles Metro. Presentation at the Federal Transit Administration Bus Rapid Transit Forum. April Available upon request. Guenthner, R. P. and K. C. Sinha. Modeling Bus Delays Due To Passenger Boardings and Alightings. Transportation Research Record, 915:
67 Goodman, Joseph, Melissa Laube and Judith Schwenk. Curitiba s Bus System is Model for Rapid Transit. Federal Transit Administration. Issues in Bus Rapid Transit. Available online at: Hardy, Nigel. Thames Gateway Transit. Transport for London. Buses with High Level of Service. Presentation. Hartmann, Sheila, and Kitasaka Keenan. Vancouver, British Columbia s High Tech Bus Rapid Transit Achieves Mode Shift From Private Vehicles Surpassing Rapid Rail Transit, Translink Available online at Hess, D., A. Bitterman. Bus Rapid Transit Identity: An Overview of Current Branding Practice. Journal of Public Transportation. Vol. 11, No.2. (2008): Available online at: Jaiswall, Sumeet, Effects of Fare Collection Policy on Operating Characteristics of a Brisbane Busway Station, 32 nd Australasian Transport Research Forum (2009), available at Lane Transit District. Eugene, EmX BRT System Advertisement. Available online at: Laroussinie, Victor. TVM-Trans Val-De-Marine. Buses with High Level of Service. April 24, Available online at: Kim, Eugene, George Darido, and Donald Schneck. Las Vegas Metropolitan Area Express Bus Rapid Transit (BRT) Demonstration Project. Federal Transit Administration. Report number: FTA-VA August Kimpel, et al. Analysis of Transit Signal Priority Using Archived TriMet Bus Dispatch System Data. Transportation Research Record: No (2005). Available online at: Kittelson & Associates, Inc., et. al. Transit Capacity and Quality of Service Manual, 2d Edition, Transportation Research Board Available online at aspx. Kittelson & Associates, Inc., et. al. TCRP 118, Bus Rapid Transit Practitioner s Guide, Transportation Research Board, Washington, DC Available online at 66
68 Kulyk, Walter, and Matthew Hardy. ITS Enhanced Bus Rapid Transit Systems. Available online at: Lane Transit District. Television Ad for EmX line in Eugene, Oregon. Available online at: Levinson, H. S. Analyzing Transit Travel Time Performance. Transportation Research Record, 915: Levinson, H., et. al. TCRP Report 90, Volume 1: Case Studies in Bus Rapid Transit, Transportation Research Board Available online at Li, Yu, et. Al. Transit Signal Priority Tools. Federal Transit Administration Available online at df Liu, Ronghui, et al, Modelling Urban Bus Service and Passenger Reliability, Institute for Transport Studies, University of Leeds (2007), available at Los Angeles County Metropolitan Transportation Authority. Metro s Countywide Signal Priority Program. Presented January 22, Stephen Gota and Reinland Jones. Available online at: Los Angeles County Metropolitan Transportation Authority. Metro Orange Line Sensation (Animated). Video added April, 28, Copyright Available online at: Los Angeles Metro. Final Report Los Angeles Metro Rapid Demonstration Project. March Available online at: McNally, R.A and Homayoun Vahidi. 98 B-Line Bus Rapid Transit Evaluation Study. IBI Group, September 29, Available online at: Mercier, Alain. Rapid Transit in Ottawa: BRT Today and Tomorrow. OC Transpo/City of Ottawa. Buses with High Level of Service. Presentation. Available online at: Metropolitan Washington Council of Governments. Eichler, M. and M. Bonsall, Development of a Regional BRT System Proposal. Washington, D.C. (2009). Available online at 67
69 Niles, John and Lisa Callaghan Jarram. From Buses to BRT: Case Studies of Incremental BRT Projects in North America. Mineta Transportation Institute Report June Available online at: %20with%20Covers).pdf Otay Ranch Transit Planning Study. Capital Cost Estimates: Task 6. January Available online at: vista.ca.us/city_services/development_services/planning_building/about/documents/or- Task6_CapCost-Final.pdf Pangilinan, Christopher, Using Hardware-in-the-Loop Simulation to Evaluate Signal Control Strategies for Transit Signal Priority, Power Point presentation at the 84 th Annual Meeting of the Transportation Research Board (2004), available at Park, Victoria, Michael Baltes, and Jennifer Perone. South Miami-Dade Busway On-Board Survey Project. Federal Transit Administration. Report number: NCTR October Peak, Matt. Analysis of Fuels and Propulsion System Options for BRT Vehicles. Federal Transit Administration Available online at: ptions_for_brt.sflb.ashx Peak, Matt, Cliff Henke and Lawrence Wnuk. Bus Rapid Transit Ridership Analysis. Federal Transit Administration. Report number: FTA-CA June Available online at: Rabuel, Sébastien et al. Buses with a High Level of Service, Choosing and Implementing the Right System. Center for the Study of Urban Planning, Transport, and Public Facilities. May Available online at: o_implementing_the_system/product_info.html?language=en Rabuel, Sébastien. Overground Rapid Transit Systems (BRT/BHLS/Tramways) in France: Scope of Application and Policy Choices. 12 th World Conference on Transport Research
70 Rat, Hans. The Bus Systems of the Future. UITP Secretary General. Buses with High Level of Service. April 24, Presentation. Available online at: Schimke, Paul et. al Evaluation of the Las Vegas Metropolitan Area Express (MAX) Bus Rapid Transit Project. Federal Transit Administration. Report number: FTA-DC December, Schimek, Paul, Georges Darido and Donald Schneck. Boston Silver Line Washington Street BRT Demonstration Project Evaluation. Federal Transit Administration. Report number: FTA- VA September Available online at: Small Starts Fact Sheet. A Section 5309 Capital Investment Grant Program. Available online at: Smith, Harriet R., Brendon Hemily and Miomir Ivanovic. Transit Signal Priority (TSP): A Planning and Implementation Handbook. Department of Transportation, May Available online at: Stanger, Richard. An Evaluation of Los Angeles s Orange Line Busway. Journal of Public Transportation. Vol.10, No.1 (2007): Available online at: Sundstrom, Carl. Evaluation Of Transit Signal Priority Effectiveness Using Automatic Vehicle Location Data Available online at Thole, Cheryl, Aladdair Cain and Jennifer Flynn. The EmX Franklin Corridor BRT Project Evaluation. Federal Transit Administration. Report number: FTA-FL April Available online at: Thole, Cheryl and Aladsair Cain. The San Pablo Rapid BRT Project Evaluation. Federal Transit Administration. Report number: FTA-FL June Transportation Research Board. Bus Rapid Transit: Why More Communities Are Choosing Bus Rapid Transit U.S. Federal Transit Administration. Updated Interim Guidance on Small Starts Available online at Van Der Spek, David. The Zuidtangent BRT. Stadsregio. Buses with High Level of Service. Presentation. April 24, Available online at: 69
71 Vincent, William. Case Studies on BRT and Land Use. Breakthrough Technologies Institute. Webinar Presentation. March Vincent, William and Lisa Callaghan Jerram. A Preliminary Evaluation of the Metro Orange Line Bus Rapid Transit Project. Breakthrough Technologies Institute. April 2, Available online at: Vincent, William and Lisa Callaghan Jerram. Bus Rapid Transit and Transit Oriented Development: Case Studies on Transit Oriented Development Around Bus Rapid Transit Systems in North America and Australia. Breakthrough Technologies Institute. April Available online at: Report.pdf Wright, Lloyd and Walter Hook, edt. Bus Rapid Transit Planning Guide. Institute for Transportation and Development Policy. June Available online at: %20complete%20guide.pdf Zimmerman, Samuel L., Herbert Levinson. Vehicle Selection for BRT: Issues and Options. Journal of Public Transportation, Vol. 7, No.1 (2004): Available online at: 70
72 APPENDICES Appendix 1 PM Correlation Table Table 14: PM Correlation Table Legend: A-Route Time, B-AM Length, C-Stations Spacing, D-High TSP, E- Medium TSP, F-Low TSP, G- Low Dedicated Lanes, H-No Dedicated Lanes, I-1 Door, J- 3-Door, K-All Low Bus, L-Mixed Low Bus PM Model A B C D E F G H I J K L A 1 B C D E F G H I J K L

73 Appendix 2 Surveys for Transit Agencies Schedule Survey 72

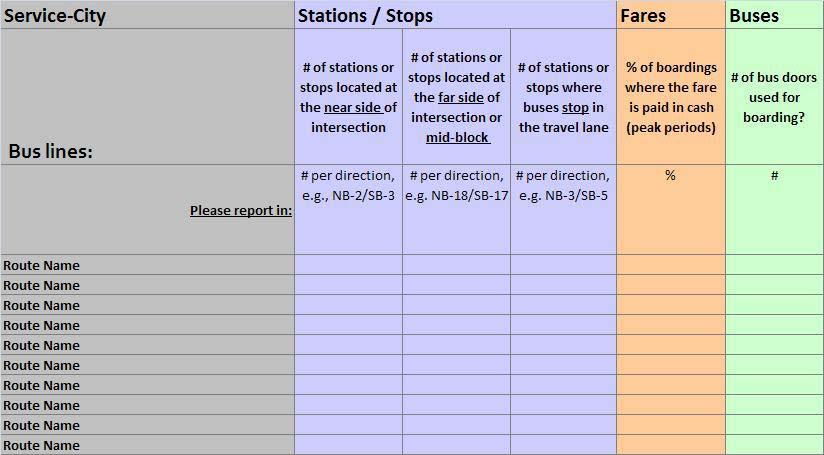
74 Guideway Survey Stops Survey 73

75 Boardings Survey 74
Bus Rapid Transit. Jennifer Flynn and Cheryl Thole Senior Research Associates Commuter Choice Workshop January 2012 Tampa, FL
 Bus Rapid Transit Jennifer Flynn and Cheryl Thole Senior Research Associates Commuter Choice Workshop January 2012 Tampa, FL What is Bus Rapid Transit? BRT is an enhanced bus system that operates on bus
Service Quality: Higher Ridership: Very Affordable: Image:
 Over the past decade, much attention has been placed on the development of Bus Rapid Transit (BRT) systems. These systems provide rail-like service, but with buses, and are typically less expensive to
EUGENE-SPRINGFIELD, OREGON EAST WEST PILOT BRT LANE TRANSIT DISTRICT
 EUGENE-SPRINGFIELD, OREGON EAST WEST PILOT BRT LANE TRANSIT DISTRICT (BRIEF) Table of Contents EUGENE-SPRINGFIELD, OREGON (USA)... 1 COUNTY CONTEXT AND SYSTEM DESCRIPTION... 1 SYSTEM OVERVIEW... 1 PLANNING
What IS BRT, Really? Not BRT and RNY
 What IS BRT, Really? 2007 Winter TexITE Meeting Presented by Jeff Arndt, TTI Not BRT and RNY 1 What is Bus Rapid Transit? A flexible, rubber-tired from of rapid transit that combines stations, vehicles,
REPORT CARD FOR CALIFORNIA S INFRASTRUCTURE WHAT YOU SHOULD KNOW ABOUT CALIFORNIA S TRANSIT FACILITIES
 TRANSIT GRADE: C- WHAT YOU SHOULD KNOW ABOUT TRANSIT FACILITIES California needs robust, flexible and reliable transit systems to reduce peak congestion on our highways, provide options for citizens who
TRANSIT IDEA STRATEGIC INITIATIVE On BUS RAPID TRANSIT (BRT)
") TRANSIT IDEA STRATEGIC INITIATIVE On BUS RAPID TRANSIT (BRT) The panel for the Transit IDEA program has endorsed a Bus Rapid Transit (BRT) strategic initiative and focus area as part of the Transit IDEA
TRANSIT IDEA STRATEGIC INITIATIVE On BUS RAPID TRANSIT (BRT) The panel for the Transit IDEA program has endorsed a Bus Rapid Transit (BRT) strategic initiative and focus area as part of the Transit IDEA
Brian Pessaro, AICP National Bus Rapid Transit Institute
 Brian Pessaro, AICP National Bus Rapid Transit Institute Source: WCVB TV, Boston BRT is an enhanced bus system that operates on bus lanes or other transitways in order to combine the flexibility of buses
The Engineering Department recommends Council receive this report for information.
 CORPORATE REPORT NO: R161 COUNCIL DATE: July 23, 2018 REGULAR COUNCIL TO: Mayor & Council DATE: July 19, 2018 FROM: General Manager, Engineering FILE: 8740-01 SUBJECT: Surrey Long-Range Rapid Transit Vision
APPENDIX I: [FIXED-GUIDEWAY TRANSIT FEASIBILITY]
![APPENDIX I: [FIXED-GUIDEWAY TRANSIT FEASIBILITY]](/thumbs/83/87090921.jpg "APPENDIX I: [FIXED-GUIDEWAY TRANSIT FEASIBILITY]") APPENDIX I: [FIXED-GUIDEWAY TRANSIT FEASIBILITY] Jackson/Teton Integrated Transportation Plan 2015 Appendix I. Fixed-Guideway Transit Feasibility Jackson/Teton County Integrated Transportation Plan v2
APPENDIX I: [FIXED-GUIDEWAY TRANSIT FEASIBILITY] Jackson/Teton Integrated Transportation Plan 2015 Appendix I. Fixed-Guideway Transit Feasibility Jackson/Teton County Integrated Transportation Plan v2
5. OPPORTUNITIES AND NEXT STEPS
 5. OPPORTUNITIES AND NEXT STEPS When the METRO Green Line LRT begins operating in mid-2014, a strong emphasis will be placed on providing frequent connecting bus service with Green Line trains. Bus hours
Waco Rapid Transit Corridor (RTC) Feasibility Study
 Feasibility Study") Waco Rapid Transit Corridor (RTC) Feasibility Study Chris Evilia, Director of Waco Metropolitan Planning Organization Allen Hunter, General Manager Waco Transit System Jimi Mitchell, Project Manager AECOM
Waco Rapid Transit Corridor (RTC) Feasibility Study Chris Evilia, Director of Waco Metropolitan Planning Organization Allen Hunter, General Manager Waco Transit System Jimi Mitchell, Project Manager AECOM
US 29 Bus Rapid Transit Planning Board Briefing. February 16, 2017
 US 29 Bus Rapid Transit Planning Board Briefing February 16, 2017 Project Goals Improve the quality of transit service Improve mobility opportunities and choices Enhance quality of life Support master
6/6/2018. June 7, Item #1 CITIZENS PARTICIPATION
 June 7, 2018 Item #1 CITIZENS PARTICIPATION 1 Item #2 APPROVAL OF MINUTES Item #3 TRAC GOALS, FRAMEWORK & AGENDA REVIEW 2 COMMITTEE GOALS Learn about Southern Nevada s mobility challenges, new developments
Preliminary Definition of Alternatives. 3.0 Preliminary Definition of Alternatives
 3.0 What preliminary alternatives are being evaluated? The alternatives for the East San Fernando Valley Transit Corridor project that were considered for screening include the No Build Alternative, Transportation
CEDAR AVENUE TRANSITWAY Implementation Plan Update
 CEDAR AVENUE TRANSITWAY Implementation Plan Update EECUTIVE SUMMARY DECEMBER 2015 Executive Summary In 2013, the Twin Cities metropolitan area s first bus rapid transit (BRT) line, the METRO Red Line,
Michigan/Grand River Avenue Transportation Study TECHNICAL MEMORANDUM #18 PROJECTED CARBON DIOXIDE (CO 2 ) EMISSIONS
 EMISSIONS") TECHNICAL MEMORANDUM #18 PROJECTED CARBON DIOXIDE (CO 2 ) EMISSIONS Michigan / Grand River Avenue TECHNICAL MEMORANDUM #18 From: URS Consultant Team To: CATA Project Staff and Technical Committee Topic:
TECHNICAL MEMORANDUM #18 PROJECTED CARBON DIOXIDE (CO 2 ) EMISSIONS Michigan / Grand River Avenue TECHNICAL MEMORANDUM #18 From: URS Consultant Team To: CATA Project Staff and Technical Committee Topic:
2.1 TRANSIT VISION 2040 FROM VISION TO ACTION. Expand regional rapid transit networks STRATEGIC DIRECTION
 TRANSIT VISION 2040 FROM VISION TO ACTION TRANSIT VISION 2040 defines a future in which public transit maximizes its contribution to quality of life with benefits that support a vibrant and equitable society,
Northeast Corridor Alternatives Analysis. Public Involvement Round 2 Input on Alternatives for Further Study
 Northeast Corridor Alternatives Analysis Public Involvement Round 2 Input on Alternatives for Further Study Feb. 7-9, 2012 Agenda Review project background Progress summary Recommended alternatives for
I-26 Fixed Guideway Alternatives Analysis
 I-26 Fixed Guideway Alternatives Analysis Public Meetings: North Charleston, January 25, 2016 Charleston: January 26, 2016 Summerville: January 28, 2016 Agenda I. Project Update II. III. IV. Screen Two
FREQUENTLY ASKED QUESTIONS
 FREQUENTLY ASKED QUESTIONS 2018 What is the More MARTA Atlanta program? The More MARTA Atlanta program is a collaborative partnership between MARTA and the City of Atlanta to develop and implement a program
TORONTO TRANSIT COMMISSION REPORT NO.
 Form Revised: February 2005 TORONTO TRANSIT COMMISSION REPORT NO. MEETING DATE: October 24, 2012 SUBJECT: DOWNTOWN RAPID TRANSIT EXPANSION STUDY (DRTES) PHASE 1 STRATEGIC PLAN ACTION ITEM RECOMMENDATIONS
Analysis of Top BUS RAPID TRANSIT. Projects in North America SPONSORED BY APRIL 2007 METRO MAGAZINE 27
 Analysis of Top BUS RAPID TRANSIT Projects in North America SPONSORED BY APRIL 2007 METRO MAGAZINE 27 BRT Projects Continue tothrive This year s compilation of METRO s BRT 25 survey showcases 35 projects
Bi-County Transitway/ Bethesda Station Access Demand Analysis
 Bi-County Transitway/ Bethesda Station Access Demand Analysis Prepared for: Washington Metropolitan Area Transit Authority Office of Planning and Project Development May 2005 Prepared by: in conjunction
Kendall Drive Premium Transit PD&E Study Project Kick-Off Meeting SR 94/Kendall Drive/SW 88 Street Project Development and Environment (PD&E) Study
 Study") Florida Department of Transportation District Six Kendall Drive Premium Transit PD&E Study Project Kick-Off Meeting SR 94/Kendall Drive/SW 88 Street Project Development and Environment (PD&E) Study What
Florida Department of Transportation District Six Kendall Drive Premium Transit PD&E Study Project Kick-Off Meeting SR 94/Kendall Drive/SW 88 Street Project Development and Environment (PD&E) Study What
CITY OF LONDON STRATEGIC MULTI-YEAR BUDGET ADDITIONAL INVESTMENTS BUSINESS CASE # 6
 2016 2019 CITY OF LONDON STRATEGIC MULTI-YEAR BUDGET ADDITIONAL INVESTMENTS BUSINESS CASE # 6 STRATEGIC AREA OF FOCUS: SUB-PRIORITY: STRATEGY: INITIATIVE: INITIATIVE LEAD(S): BUILDING A SUSTAINABLE CITY
The Case for. Business. investment. in Public Transportation
 The Case for Business investment in Public Transportation Introduction Public transportation is an enterprise with expenditure of $55 billion in the United States. There has been a steady growth trend
Executive Summary. Treasure Valley High Capacity Transit Study Priority Corridor Phase 1 Alternatives Analysis October 13, 2009.
 Treasure Valley High Capacity Transit Study Priority Corridor Phase 1 Alternatives Analysis October 13, 2009 Background As the Treasure Valley continues to grow, high-quality transportation connections
Executive Summary. Draft Environmental Impact Statement/Environmental Impact Report ES-1
 Executive Summary Introduction The Eastside Transit Corridor Phase 2 Project is a vital public transit infrastructure investment that would provide a transit connection to the existing Metro Gold Line
Downtown Transit Connector. Making Transit Work for Rhode Island
 Downtown Transit Connector Making Transit Work for Rhode Island 3.17.17 Project Evolution Transit 2020 (Stakeholders identify need for better transit) Providence Core Connector Study (Streetcar project
6/11/2018. June 7, Item #1 CITIZENS PARTICIPATION
 June 7, 2018 Item #1 CITIZENS PARTICIPATION 1 Item #2 APPROVAL OF MINUTES Item #3 TRAC GOALS, FRAMEWORK & AGENDA REVIEW 2 COMMITTEE GOALS Learn about Southern Nevada s mobility challenges, new developments
The City of Toronto s Transportation Strategy July 2007
 The City of Toronto s Transportation Strategy July 2007 Presentation Outline Transportation Statistics Transportation Building Blocks Toronto s Official Plan Transportation and City Building Vision Projects
The Regional Municipality of York. Purchase of Six Battery Electric Buses
 1. Recommendations The Regional Municipality of York Committee of the Whole Transportation Services January 10, 2019 Report of the Commissioner of Transportation Services Purchase of Six Battery Electric
Independence Institute Denver West Parkway, Suite 185 Golden, Colorado i2i.org/cad.aspx BRT = BTR
 Independence Institute 14142 Denver West Parkway, Suite 185 Golden, Colorado 80401 303-279-6536 i2i.org/cad.aspx BRT = BTR Bus-Rapid Transit Is Better Than Rail: The Smart Alternative to Light Rail Joseph
Public Meeting. City of Chicago Department of Transportation & Department of Housing and Economic Development
 Public Meeting City of Chicago Department of Transportation & Department of Housing and Economic Development Funded by Regional Transportation Authority September 12, 2011 In partnership with Presentation
A Transit Plan for the Future. Draft Network Plan
 A Transit Plan for the Future Draft Network Plan Project Overview and Status Completed Market Analysis and Service Evaluation. Developed Plan Framework and Guiding Principles. Developed a draft Five Year
Policy Note. Vanpools in the Puget Sound Region The case for expanding vanpool programs to move the most people for the least cost.
 Policy Note Vanpools in the Puget Sound Region The case for expanding vanpool programs to move the most people for the least cost Recommendations 1. Saturate vanpool market before expanding other intercity
FINAL. Sound Transit Long-Range Plan Update. Issue Paper S.1: Tacoma Link Integration with Central Link. Prepared for: Sound Transit
 Sound Transit Long-Range Plan Update Issue Paper S.1: Tacoma Link Integration with Central Link Prepared for: Sound Transit Prepared by: Quade & Douglas, Inc. FINAL March 2005 Foreword This issue paper
TORONTO TRANSIT COMMISSION REPORT NO.
 Revised: March/13 TORONTO TRANSIT COMMISSION REPORT NO. MEETING DATE: March 26, 2014 SUBJECT: COMMUNITY BUS SERVICES ACTION ITEM RECOMMENDATION It is recommended that the Board not approve any routing
Snelling Bus Rapid Transit. May 13, 2013 Technical Advisory Committee Meeting #1
 Snelling Bus Rapid Transit May 13, 2013 Technical Advisory Committee Meeting #1 1 Today s meeting TAC Introductions Project Overview Arterial BRT Concept Background Snelling Corridor Plan, Funding & Schedule
Vanpooling and Transit Agencies. Module 3: Benefits to Incorporating Vanpools. into a Transit Agency s Services
 Vanpooling and Transit Agencies Module 3: Benefits to Incorporating Vanpools into a Transit Agency s Services A common theme we heard among the reasons why the transit agencies described in Module 2 began
Needs and Community Characteristics
 Needs and Community Characteristics Anticipate Population and Job Growth in the City Strongest density of population and jobs in Ann Arbor are within the Study Area Population expected to grow 8.4% by
UTA Transportation Equity Study and Staff Analysis. Board Workshop January 6, 2018
 UTA Transportation Equity Study and Staff Analysis Board Workshop January 6, 2018 1 Executive Summary UTA ranks DART 6 th out of top 20 Transit Agencies in the country for ridership. UTA Study confirms
STRATEGIC PRIORITIES AND POLICY COMMITTEE MAY 5, 2016
 STRATEGIC PRIORITIES AND POLICY COMMITTEE MAY 5, 2016 Shift Rapid Transit Initiative Largest infrastructure project in the city s history. Rapid Transit initiative will transform London s public transit
SERVICE DESIGN GUIDELINES
 VTA TRANSIT SUSTAINABILITY POLICY: APPENDIX A SERVICE DESIGN GUIDELINES Adopted February 2007 COMMUNITYBUS LOCALBUS EXPRESSBUS BUSRAPIDTRANSIT LIGHTRAILTRANSIT STATIONAREAS S A N T A C L A R A Valley Transportation
Funding Scenario Descriptions & Performance
 Funding Scenario Descriptions & Performance These scenarios were developed based on direction set by the Task Force at previous meetings. They represent approaches for funding to further Task Force discussion
Kenosha-Racine-Milwaukee (KRM)
") Kenosha-Racine-Milwaukee (KRM) Commuter Rail #147925 November 6, 2009 1 Guidance of KRM Commuter Rail Studies Intergovernmental Partnership Technical Steering Committee Temporary and Limited Authority
Kenosha-Racine-Milwaukee (KRM) Commuter Rail #147925 November 6, 2009 1 Guidance of KRM Commuter Rail Studies Intergovernmental Partnership Technical Steering Committee Temporary and Limited Authority
Travel Time Savings Memorandum
 04-05-2018 TABLE OF CONTENTS 1 Background 3 Methodology 3 Inputs and Calculation 3 Assumptions 4 Light Rail Transit (LRT) Travel Times 5 Auto Travel Times 5 Bus Travel Times 6 Findings 7 Generalized Cost
WELCOME. Transit Options Amherst - Buffalo Public Workshops
 WELCOME Transit Options Amherst - Buffalo Public Workshops Sponsored by Niagara Frontier Transportation Authority Greater Buffalo Niagara Regional Transportation Council Where do you live? Where do you
1 On Time Performance
 MEMORANDUM: US 29 Travel Time & OTP To: From: Joana Conklin, Montgomery County DOT James A. Bunch, SWAI Subject: US 29 Travel Time and On Time Performance Analysis Date: This memorandum documents the US
Draft Results and Open House
 Waco Rapid Transit Corridor (RTC) Feasibility Study Draft Results and Open House Chris Evilia, Director of Waco Metropolitan Planning Organization Allen Hunter, General Manager Waco Transit System Jimi
USDOT CMAQ Program. Southeast Diesel Collaborative Annual Conference September, 2017
 USDOT CMAQ Program Southeast Diesel Collaborative Annual Conference September, 2017 1 CMAQ & Title 23: What and Why? Section 149: The CMAQ program is established for transportation projects that contribute
HOT Lanes: Congestion Relief and Better Transit
 HOT Lanes: Congestion Relief and Better Transit Robert W. Poole, Jr. Director of Transportation Studies Reason Foundation www.reason.org/transportation Basic Thesis: Current Transportation Plans Need Rethinking
Troost Corridor Transit Study
 Troost Corridor Transit Study May 23, 2007 Kansas City Area Transportation Authority Agenda Welcome Troost Corridor Planning Study Public participation What is MAX? Survey of Troost Riders Proposed Transit
Additional Transit Bus Life Cycle Cost Scenarios Based on Current and Future Fuel Prices
 U.S. Department Of Transportation Federal Transit Administration FTA-WV-26-7006.2008.1 Additional Transit Bus Life Cycle Cost Scenarios Based on Current and Future Fuel Prices Final Report Sep 2, 2008
Charlotte-Mecklenburg Region Rapid Transit and Land-Use Integration
 Charlotte-Mecklenburg Region Rapid Transit and Land-Use Integration Legislative Committee on Urban Growth and Infrastructure Carolyn Flowers CEO Charlotte Area Transit System March 23, 2010 Charlotte Region
Draft Results and Recommendations
 Waco Rapid Transit Corridor (RTC) Feasibility Study Draft Results and Recommendations Chris Evilia, Director of Waco Metropolitan Planning Organization Allen Hunter, General Manager Waco Transit System
State Safety Oversight Program
 State Safety Oversight Program Maps and Charts September 2015 Table of Contents States and Rail Fixed Guideway Public Transportation Systems (RFGPTS)... 3 RFGPTS by State and Mode... 4 RFGPTS Unlinked
Application of IVI Technologies for Bus Rapid Transit Systems
 Application of IVI Technologies for Bus Rapid Transit Systems Authors: Matthew Hardy Lead Transportation Engineer Mitretek Systems 600 Maryland Ave., SW Suite 755 Washington, DC 20024 (202) 863-2982 matthew.hardy@mitretek.org
Open House. Highway212. Meetings. Corridor Access Management, Safety & Phasing Plan. 5:30 to 6:30 p.m. - Southwest Corridor Transportation Coalition
 Welcome Meetings 5:30 to 6:30 p.m. - Southwest Corridor Transportation Coalition 6:30 to 8:00 p.m. - Open House Why is Highway 212 Project Important? Important Arterial Route Local Support Highway 212
Executive Summary. Phase 2 Evaluation Report. Introduction
 , Executive Summary Executive Summary Introduction TransLink and the Province of British Columbia sponsored a multi-phase study to evaluate alternatives for rapid transit service in the Broadway corridor
Click to edit Master title style
 Nelson/Nygaard Consulting Associates SERVICE IMPROVEMENT STRATEGIES September 22, 2015 1 PROJECT OVERVIEW & WORK TO DATE 1. Extensive stakeholder involvement Throughout 2. System and market assessment
State Avenue Corridor Bus Rapid Transit (BRT)
") State Avenue Corridor Bus Rapid Transit (BRT) Moving Forward Incrementally April 2010 State Ave. BRT Update Bus Rapid Transit Overview State Ave. Alternatives Analysis Results What s Coming Up Right Away!
State Avenue Corridor Bus Rapid Transit (BRT) Moving Forward Incrementally April 2010 State Ave. BRT Update Bus Rapid Transit Overview State Ave. Alternatives Analysis Results What s Coming Up Right Away!
Improving Accessibility of Regional Bus Stops and Pathways
 Customer Service and Operations Committee Board Information Item III-A March 13, 2014 Improving Accessibility of Regional Bus Stops and Pathways Page 3 of 17 Washington Metropolitan Area Transit Authority
Parks and Transportation System Development Charge Methodology
 City of Sandy Parks and Transportation System Development Charge Methodology March, 2016 Background In order to implement a City Council goal the City of Sandy engaged FCS Group in January of 2015 to update
Transit Vehicle (Trolley) Technology Review
 Technology Review") Transit Vehicle (Trolley) Technology Review Recommendation: 1. That the trolley system be phased out in 2009 and 2010. 2. That the purchase of 47 new hybrid buses to be received in 2010 be approved with
Transit Vehicle (Trolley) Technology Review Recommendation: 1. That the trolley system be phased out in 2009 and 2010. 2. That the purchase of 47 new hybrid buses to be received in 2010 be approved with
Tempe Streetcar. March 2, 2016
 Tempe Streetcar March 2, 2016 Tempe Profile 40 sq. miles, highest density in state University Town, center of region Imposed growth boundaries (density increase) Mixed use growth/intensifying land use
DRAFT Subject to modifications
 TREASURE COAST REGIONAL PLANNING COUNCIL M E M O R A N D U M DRAFT To: Council Members AGENDA ITEM 7A From: Date: Subject: Staff September 17, 2010 Council Meeting High Speed Rail Update Introduction The
Rapid Transit and Land-Use Integration a Reality
 City of Charlotte Rapid Transit and Land-Use Integration a Reality Transportation Oversight Committee Carolyn Flowers CEO Charlotte Area Transit System April 29, 2010 Charlotte Region Statistics Mecklenburg
Transit Access to the National Harbor
 Transit Access to the National Harbor December 2014 Table of Contents Executive Summary... 3 Introduction and Project Purpose... 6 Methodology.. 9 Definition of Alternatives..... 9 Similar Project Implementation
TRAFFIC SIMULATION IN REGIONAL MODELING: APPLICATION TO THE INTERSTATEE INFRASTRUCTURE NEAR THE TOLEDO SEA PORT
 MICHIGAN OHIO UNIVERSITY TRANSPORTATION CENTER Alternate energy and system mobility to stimulate economic development. Report No: MIOH UTC TS41p1-2 2012-Final TRAFFIC SIMULATION IN REGIONAL MODELING: APPLICATION
Paid Parking at Park & Ride Lots: Framing the Issues. Capital Programs Committee May 2014
 Paid Parking at Park & Ride Lots: Framing the Issues Capital Programs Committee May 2014 Outline Current Status Industry Review DART Case Study Issues Alternatives Mechanics 2 Current Status: All Lots
Blue Ribbon Committee
 Blue Ribbon Committee February 26, 2015 Kick-off Meeting Blue Ribbon Committee 1 2,228 Metro CNG Buses 170 Bus Routes 18 are Contract Lines Metro Statistics 2 Transitway Lines (Orange/Silver Lines) 20
Project Scoping Report Appendix B Project Web Site. APPENDIX B Project Web Site
 Project Scoping Report Appendix B Project Web Site APPENDIX B Project Web Site WESTSIDE EXTENSION TRANSIT CORRIDOR STUDY February 4, 2008 News and Info of 1 http://metro.net/projects_programs/westside/news_info.htm#topofpage
Strategic Plan
 2005-2015 Strategic Plan SUMMARY OF THE REVISED PLAN IN 2011 A decade focused on developing mass transit in the Outaouais A updated vision of mass transit in the region The STO is embracing the future
PEACHTREE CORRIDOR PARTNERSHIP. Current Status & Next Steps
 PEACHTREE CORRIDOR PARTNERSHIP Current Status & Next Steps PEACHTREE CORRIDOR PARTNERSHIP Why Peachtree? Why Now? I. THE CONTEXT High Level View of Phasing Discussion Potential Ridership Segment 3 Ease
BROWARD BOULEVARD CORRIDOR TRANSIT STUDY
 BROWARD BOULEVARD CORRIDOR TRANSIT STUDY FM # 42802411201 EXECUTIVE SUMMARY July 2012 GOBROWARD Broward Boulevard Corridor Transit Study FM # 42802411201 Executive Summary Prepared For: Ms. Khalilah Ffrench,
5 RAPID TRANSIT NETWORK PLAN PRINCIPLES, METROLINX BUSINESS CASE, AND ALTERNATIVE FINANCE AND PROCUREMENT ANALYSIS UPDATE
 5 RAPID TRANSIT NETWORK PLAN PRINCIPLES, METROLINX BUSINESS CASE, AND ALTERNATIVE FINANCE AND PROCUREMENT ANALYSIS UPDATE The Rapid Transit Public/Private Partnership Steering Committee recommends the
Los Angeles County Metropolitan Transportation Authority. Paid Parking Pilot Program Parking Management
 Los Angeles County Metropolitan Transportation Authority Paid Parking Pilot Program Parking Management Overview Metro currently operates over 22,000 parking spaces at 48 stations. This number will increase
Analyzing the Impacts of Vehicle Assist and Automation Systems on BRT
 Analyzing the Impacts Analyzing the Impacts of Vehicle Assist and Automation Systems on BRT Matthew Hardy, Susannah Proper Mitretek Systems Abstract This paper summarizes research that was conducted to
Bus Stop Optimization Study
 Bus Stop Optimization Study Executive Summary February 2015 Prepared by: Passero Associates 242 West Main Street, Suite 100 Rochester, NY 14614 Office: 585 325 1000 Fax: 585 325 1691 In association with:
PUBLIC TRANSPORTATION
 PUBLIC TRANSPORTATION An Overview of the Industry, Key Federal Programs, and Legislative Processes American Public Transportation Association 1 The Public Transportation Industry: What is "public transportation"?
Operating & Maintenance Cost Results Report
 Operating & Maintenance Cost Results Report Prepared for: Hennepin County Regional Railroad Authority Prepared by: Connetics Transportation Group Under Contract To: Kimley-Horn and Associates FINAL June
CITY OF VAUGHAN EXTRACT FROM COUNCIL MEETING MINUTES OF NOVEMBER 21, 2017
 CITY OF VAUGHAN EXTRACT FROM COUNCIL MEETING MINUTES OF NOVEMBER 21, 2017 Item 1, Report No. 41, of the Committee of the Whole (Working Session), which was adopted without amendment by the Council of the
Proposed Program of Interrelated Projects
 DALLAS AREA RAPID TRANSIT Proposed Program of Interrelated Projects Federal Transit Administration Capital Investment Program Summer 204 INTRODUCTION The current federal transportation bill, Moving Ahead
East San Fernando Valley Transit Corridor. Information Session, October 10, 2017
 East San Fernando Valley Transit Corridor Information Session, October 10, 2017 1 Welcome and Meeting Purpose Introductions Metro Transit Corridors Planning Metro Real Estate Metro Community Relations
Leadership NC. November 8, 2018
 v Leadership NC November 8, 2018 Planning for our region s growth The Triangle is one of the fastestgrowing regions in the nation. More than 2 million people are already part of the equation, and the
Appendix G: Rapid Transit Technology Backgrounder July 2017
 Appendix G: Rapid Transit Technology Backgrounder This appendix provides additional details regarding Bus Rapid Transit and Light Rail Transit technologies, with examples from other systems, including:
Pacific Electric Right-of-Way / West Santa Ana Branch Corridor Alternatives Analysis
 Pacific Electric Right-of-Way / West Santa Ana Branch Corridor Alternatives Analysis Transit Coalition September 26, 2012 2 Study Area Pacific Electric Rightof-Way/West Santa Ana Branch (PEROW/ WSAB) extends
THE WILSHIRE CORRIDOR: RAIL AND ITS ALTERNATIVES. Prepared By: Jacki Murdock Transportation and Environmental Planner
 THE WILSHIRE CORRIDOR: RAIL AND ITS ALTERNATIVES Prepared By: Jacki Murdock Transportation and Environmental Planner December 13 th, 2012 Overview Characteristics of Wilshire Boulevard Overview of the
West Broadway Reconstruction/LRT Design. March 19, 2015
 West Broadway Reconstruction/LRT Design March 19, 2015 1 Meeting Agenda 6:05 6:30 PM Brief presentation What we heard Project overview 6:30 8:00 PM Visit Six Topic Areas Road and LRT design elements Pedestrian
a GAO GAO MASS TRANSIT Bus Rapid Transit Shows Promise Report to Congressional Requesters United States General Accounting Office
 GAO United States General Accounting Office Report to Congressional Requesters September 2001 MASS TRANSIT Bus Rapid Transit Shows Promise a GAO-01-984 Contents Letter 1 Results in Brief 2 Background
RTSP Phase II Update
 Washington Metropolitan Area Transit Authority RTSP Phase II Update Presentation to the Technical Advisory Group July 18, 2013 Meeting 1 Presentation Outline RTSP Integration with Momentum RTSP Process
Metro Transit Update. Christina Morrison, Senior Planner Metro Transit BRT/Small Starts Project Office. John Dillery, Senior Transit Planner
 Metro Transit Update Christina Morrison, Senior Planner Metro Transit BRT/Small Starts Project Office John Dillery, Senior Transit Planner Metro Transit Service Development May 16, 2013 1 Transit Planning
Energy Technical Memorandum
 Southeast Extension Project Lincoln Station to RidgeGate Parkway Prepared for: Federal Transit Administration Prepared by: Denver Regional Transportation District May 2014 Table of Contents Page No. Chapter
Transportation Demand Management Element
 Transportation Demand Management Element Over the years, our reliance on the private automobile as our primary mode of transportation has grown substantially. Our dependence on the automobile is evidenced
An Overview of Rapid Transit Typical Characteristics. Date April 30, 2009
 An Overview of Rapid Transit Typical Characteristics Date April 30, 2009 Land Use and Transportation Is there a link? Streetcar Suburbs were the result of land developers creating streetcar lines in order
FACTSHEET on Bus Rapid Transit System
 FACTSHEET on Bus Rapid Transit System 2017 This paper was prepared by: SOLUTIONS project This project was funded by the Seventh Framework Programme (FP7) of the European Commission www.uemi.net Layout/Design:
Recommended Vision for the Downtown Rapid Transit Network
 Recommended Vision for the Downtown Rapid Transit Network April 2008 Presentation Overview Context Transit options Assessment of options Recommended network Building the network 2 1 Rapid Our Vision Reliable
Point A Point B Point C Point D. Fulton County Board of Commissioners and Mayors Meeting December 14, 2017
 Fulton County Board of Commissioners and Mayors Meeting December 14, 2017 Master Plan Overview Phase 1 Community Vision and Existing Transit Conditions Phase 2 Scenario Development Phase 3 Transit Master
Sepulveda Pass Corridor Systems Planning Study Final Compendium Report. Connecting the San Fernando Valley and the Westside
 Los Angeles County Metropolitan Transportation Authority November 2012 Connecting the San Fernando Valley and the Westside Interstate 405 Sepulveda Pass THIS PAGE INTENTIONALLY LEFT BLANK Sepulveda Pass