BROAD STREET LINE EXTENSION FEASIBILITY STUDY
|
|
|
- Derek Barber
- 6 years ago
- Views:
Transcription

")
 Southeastern")
 PREPARED BY")
1 BROAD STREET LINE EXTENSION FEASIBILITY STUDY PREPARED FOR City of Philadelphia Delaware Valley Regional Planning Commission (DVRPC) Philadelphia Industrial Development Corporation (PIDC) Southeastern Pennsylvania Transportation Authority (SEPTA) PREPARED BY Parsons Brinckerhoff September 2008


2 TABLE OF CONTENTS Acknowledgements...iii Executive Summary...iv Introduction...1 Study Goal...1 Purpose of the Study...2 Study Process...2 Advisory Committee...2 Project Description...3 Purpose and Need...4 Development Scenarios...5 Master Plan Development Scenario...5 Master Plan with Heavy Rail Development Scenario...7 Transportation Alternatives...8 Alternative 1 - Current Bus Service...9 Alternative 2 - Enhanced Bus Service...9 Bus Route Coverage (Alternatives 1 and 2)...10 Alternative 3 - Heavy Rail Extension...11 Evaluation Criteria...13 Ridership...13 Capital Costs...13 Operating Costs...13 Environmental Impacts...13 Economic Impacts...13 Traffic Impacts...13 Project Evaluation...14 Ridership...14 Operations Plan...16 Capital Costs...18 Operations and Maintenance Costs...18 Environmental Impacts...21 Economic Impacts...21 Traffic Impacts...22 Summary of Findings...24 Cost Effectiveness...26 Funding Needs...28 Similar Development Case Studies...28 Summary of Financial Assessments...29 Project Phasing (Heavy Rail)...31 Next Steps...32 Potential Roadmap to Implementation (Federal Funding Approach)...33 Potential Roadmap to Implementation (Innovative Funding Approach)...34 Endnotes...35 i

...10 Exhibit 11. Phase II (Current and Enhanced Bus).")
3 TABLE OF EXHIBITS Acknowledgements Exhibit 1. The Navy Yard Study Area...3 Exhibit 2. Development Assumptions within ½ Mile of Stations by Year...5 Exhibit 3. Annual Absorption with Master Plan Development Scenario...5 Exhibit 4. Annual Absorption with Master Plan with Heavy Rail Development Scenario...7 Exhibit 5. Comparison of Office Development by Scenario...7 Exhibit 6. Comparison of Retail and Residential Development by Scenario...7 Exhibit 7. Comparison of Development Assumptions...7 Exhibit 8. Comparison of Parking Availability by Scenario...7 Exhibit 9. Summary of Transit Alternatives...9 Exhibit 10. Phase I (Current and Enhanced Bus)...10 Exhibit 11. Phase II (Current and Enhanced Bus)...10 Exhibit 12. Alternative 3 Broad Street Line Extension (with original conceptual alignments)...11 Exhibit 13. Summary of Projected Daily Boardings at The Navy Yard by Alternative...14 Exhibit 14. Projected Boardings for Alternative 1 Current Bus and Alternative 2 Enhanced Bus...14 Exhibit 15. Comparison of Existing Boardings with Projected Boardings on Alternative 1 (Entire Route)...15 Exhibit 16. Comparison of Existing Boardings with Projected Boardings on Alternative 2 (Entire Route)...15 Exhibit 17. Projected Boardings for Alternative 3 Heavy Rail...15 Exhibit 18. Ridership Model Assumptions for New Broad Street Station 1 and Exhibit 19. Comparison of Existing Boardings of Select Transit Stations with Projected Boardings on Proposed Stations...16 Exhibit 20. General Characteristics of Alternatives 1 and 2 into The Navy Yard...17 Exhibit 21. Frequencies, Hours of Operation and Peak Bus Vehicle Requirements...17 Exhibit 22. General Characteristics of Local Service of the Broad Street Line with The Navy Yard Extension...17 Exhibit 23. Frequencies, Hours of Operation and additional Peak Passenger Cars...18 Exhibit 24. Summary of Capital Cost Estimates (2008 Dollars)...18 Exhibit 25. Proposed New Vehicle and Station Requirements...18 Exhibit 26. Annual Projected Bus O&M Costs (2008 Dollars)...20 Exhibit 27. Projected Annual O&M Costs (2008 Dollars)...20 Exhibit 28. Economic Impacts Methodology...21 Exhibit 29. Summary of Estimated Economic Impacts at The Navy Yard...22 Exhibit 30. Projected (2045) Entering and Exiting Traffic Volumes at Broad Street...23 Exhibit 31. Representative Peak Hour Volumes...23 Exhibit 32. Projected (2045) Levels of Service at Broad Street and League Island Boulevard...23 Exhibit 33. Full Build-out Summary of Anticipated Operating Characteristics and Costs (2008 Dollars)...25 Exhibit 34. Full Build-out Summary of Anticipated Development and Traffic Conditions at Broad Street...25 Exhibit 35. Comparison of Estimated Transit Mode Share in Exhibit 36. FTA New Starts/Small Starts Project Justification Measures...26 Exhibit 37. Cost per Rider ( )...26 Exhibit 38. Riders Served per Million Dollars of Investment ( )...26 Exhibit 39. Federal New Starts Allocations, Commitments and Full Funding Grant Agreements per Fiscal Year...28 Exhibit 40. Summary Table of Potential Capital Funding Sources...30 Exhibit 41. Summary Table of Potential Operating Funding Sources...30 Exhibit 42. Operating Expenditures and Fare Revenue Current Bus ($000 s)...29 Exhibit 43. Operating Expenditures and Fare Revenue Enhanced Bus ($000 s)...29 Exhibit 44. Operating Expenditures and Fare Revenue Heavy Rail ($000 s)...29 Exhibit 45. Summary of Estimated Heavy Rail Capital Costs in Phases (2008 Dollars)...31 Exhibit 46. New Starts Planning and Development Process...33 Exhibit 47. Planning and Development Process Utilizing Innovative Funding...34 This study was initiated in September 2007 with funds from the Delaware Valley Regional Planning Commission s Transportation and Community Development Initiative (TCDI) and the City of Philadelphia. This work product represents the contributions of many organizations that dedicated their time and effort to prepare, review, and revise this document. These organizations include: Center City District City of Philadelphia: Planning Commission Commerce Department Office of Transportation and Utilities Commonwealth of Pennsylvania Delaware River Port Authority Delaware Valley Regional Planning Commission Federal Transit Administration Liberty Property Trust Pennsylvania Department of Transportation Philadelphia City Council Philadelphia Industrial Development Corporation Port Authority Transit Corporation Southeastern Pennsylvania Transportation Authority Sports Complex Special Services District Consultant Team Parsons Brinckerhoff Urban Engineers Econsult Corporation Milligan and Company Debra Malinics Advertising ii iii

4 EXECUTIVE SUMMARY I n 1966, the City of Philadelphia commissioned a study to examine the feasibility of extending the Broad Street Subway Line beyond the newly planned terminus in the then-emerging sports complex at Pattison Avenue, into the Philadelphia Naval Yard, an active military base employing tens of thousands. That 1966 study found the project to be technically feasible with some minor challenges; however, with U.S. military engagements abroad and the Cold War, the decision was made not to build the $14.5-million extension ($96 million in 2008 dollars). In 2007, funded with a grant from the Delaware Valley Regional Planning Commission, this Broad Street Line Extension Feasibility Study was commissioned to revisit and evaluate the feasibility of construction and to estimate capital costs, ridership, and economic benefit of extending the subway by way of two stations into The Navy Yard. Now, The Navy Yard, located midway between New York and the District of Columbia along Interstate 95 and approximately 3.5 miles south of Philadelphia s bustling Center City, is an emerging regional employment center managed on behalf of the City of Philadelphia by the Philadelphia Industrial Development Corporation (PIDC). Encompassing 1,000 acres, an area as large as Center City Philadelphia, the site hosts more than 7,000 employees and 80 companies in more than 5.5 million occupied square feet of industrial, R&D and office space. The Navy Yard s 2004 Master Plan outlines future growth to more than 15 million SF of occupied space, 30,000 employees, and thousands of residents in six neighborhood districts (see Exhibit A) to create a vibrant 24-hour, live-work-play community. The Navy Yard is currently served by a transit shuttle service from the Pattison Avenue Station operated by the Southeastern Pennsylvania Transportation Authority (SEPTA) with funding from Navy Yard businesses. However, to achieve the full development potential of The Navy Yard with sustainable principles and rising energy costs in mind The Navy Yard requires better transit accessibility. According to the traffic analysis in this study, the primary access to The Navy Yard will be severely congested as the study area s traffic reaches critical levels of build-out. An extension of the subway can ameliorate this congestion and add capacity for more than 40% more commercial development and 500% more residential units, through the sustainable strategy of connecting The Navy Yard to the region s transportation hub. This new sustainable development would utilize existing infrastructure in the center of the metropolitan area rather than build new infrastructure on undeveloped land on the remote edges of the region. The Broad Street Line Extension Feasibility Study confirms the feasibility of constructing the 1.5-mile tunneled subway extension into The Navy Yard with two new stations supporting greater residential and commercial uses in a transit supportive manner at a cost of approximately $370 million (in 2008 dollars). The study demonstrates the strong ridership, development potential, and economic benefit for the City of Philadelphia and the Commonwealth of Pennsylvania. The Subway Extension The study team and a Steering Committee comprised of regional experts and stakeholders examined the Broad Street Line subway extension (preferred alignment pictured in Exhibit B) with trains arriving at current Broad Street Line levels of operation, including trains arriving every 7 minutes. Along its 1.5-mile route, the plan adds two new stations between Pattison Station and the Delaware River Waterfront: one station will be in The Navy Yard Corporate Center, which is under development by Liberty Property Trust/Synterra Partners; the other would be a Marina station along the South Delaware River Waterfront with the potential for a subway tunnel to South Jersey, providing additional regional connectivity. For two additional points of reference, the study team also examined two low-cost, bus options: Current Bus service at 20-minute intervals equal to today s shuttle service and Enhanced Bus service at 7-minute frequencies to meet all subway arrivals and departures. Exhibit B. Broad Street Line Extension + Original Conceptual Alignments Engineering Feasibility The study demonstrates that it s feasible to construct an extension of the Broad Street subway with some minor engineering challenges. The preliminary alignment and conceptual engineering for the tunnel design account for the high water table, soil conditions, and existing and future subsurface structures (i.e. utilities and building foundations). In addition, construction of the preferred alignment is greatly simplified once in The Navy Yard by excavating a U-shaped channel for more than 75% of the alignment along the grand Diagonal Boulevard in the Corporate Center and into the Marina. The channel is closed by constructing the roadway on top. This construction method, known as cut-and-cover, reduces the need for expensive tunnel boring. Exhibit A. Broad Street Line Extension Study Area iv v
.")

.")

5 EXECUTIVE SUMMARY Capital and Operating Expenses The Broad Street Line Extension Feasibility Study estimated the cost to construct the entire 1.5-mile subway extension at approximately $370 million (2008 dollars). This investment, although significantly greater than the current bus and enhanced bus options, at $8 million and $14 million, respectively, proves to be a significantly more cost effective on a per rider basis. In addition, this investment will leverage private investment and spur development that generates employment and tax benefits to the city and state. In a similar trend to capital costs, operating expenses are initially higher for the subway extension, but prove to yield a better return on investment. Annual operating costs are estimated at $5.0 million for the subway extension, $3.5 million for the Enhanced Bus, and $1.4 million for the current bus option (at full build out of The Navy Yard). Ridership According to modeling efforts conducted by the study team, the subway extension s daily boardings are substantially greater than those of either the current bus or enhanced bus because of the more intense development pattern supported by heavy rail. At The Navy Yard s full build-out, ridership is estimated at more than 8,000 boardings between the two stations. The number of boardings is in line with existing stations on the Broad Street Line. Exhibit C represent those riders entering the system at The Navy Yard. Exhibit C. Projected Daily Boardings Farebox Recovery The study also found that the subway farebox revenue capture (ratio of farebox revenue to total operating expenses) is estimated to be between 57 and 70 percent after 10 years of operation, (an average of 43 percent over the 35 year timeframe) far outpacing the farebox capture for the bus alternatives at maximum 20 percent. Although operating expenses are slightly greater for the subway, the farebox revenue generated is expected to cover the majority of those expenses, and therefore requiring less need for an operating subsidy. Exhibit D. Cost Per Rider Development Impacts The greatest benefits are derived from the subway s impact on land values and potential for development. The study explored two growth scenarios, each influenced by either of the bus alternatives or the subway expansion into The Navy Yard. The Broad Street subway extension is projected to support greater densities and produce a positive net benefit to property values within a short proximity of its stations. These impacts, illustrated in Exhibit E, show the additional commercial and residential development possible around each subway station. The Master Plan + Heavy Rail scenario represents more than $4.6 billion in economic impact from development and $390 million directly from constructing the subway to the City of Philadelphia. The economic benefits derived from subway extension are expected to be $1.7 billion more than with current bus service. Due to a multiplier effect, these impacts are greater at the state level. The Broad Street Line Extension will leverage, catalyze, and greatly enhance the development potential of the entire Navy Yard, generating investment, employment, and tax rateables for the city and state Exhibit E. Development Impacts and Scenarios than New Starts funding. With these mechanisms, capital is raised by leveraging revenue streams derived from the development surrounding the station. Revenue streams can include development right payments, private contributions, and tax revenue (i.e. Tax Increment Financing or Special Assessment Districts). Public-private partnerships (PPP) provide an opportunity to share some of the risks of development of the transit facility with the private sector and expedite the project delivery for a fee. Put together, innovative financing and public-private partnerships can save money and avoid cost creep during planning and construction, a common occurrence for large infrastructure projects. In order to bring this project to fruition, the region s leadership will work together to establish an aggressive implementation schedule to evaluate the funds and value capture mechanisms available and to define the potential applicability of a publicprivate partnership. The end result of this process will help The Navy Yard fulfill its full development potential, benefiting not only the immediate site but the region as a whole. The Navy Yard has successfully transitioned from a military property to a growing center of mixed use development and employment for the region. In its next phase, The Navy Yard can fulfill sustainable development principles for the region by building at the core, maximize the value of future and existing infrastructure investments, and catalyze transformative growth through an investment in transit. Cost Effectiveness Due to the substantially greater ridership generated by the subway extension over the other alternatives, the subway proves to be the most cost effective transit alternative over time, measured in terms of annualized capital and operating costs per rider and the farebox recovery ratio. Next Steps The Broad Street Line Extension Feasibility Study has been undertaken to identify the feasibility, cost, and benefits of improved rail and bus transit access to The Navy Yard. Normally for a project with a significant capital cost, such as the extension of the Broad Street Line, the use of federal resources would be preferred. However, in addition to the traditional New Starts Process, this study looked at innovative approaches for financing major transit investments as an alternative to the unpredictable and lengthy federal New Starts funding process. Cost per rider Exhibit D illustrates that once in operation the subway s cost per rider equals and outperforms the cost effectiveness of operating a fleet of buses serving The Navy Yard s transit needs. Innovative funding mechanisms, such as those used to fund the combined transit and real estate development projects like the Hudson Yards in Manhattan, NY or NorthPoint in Cambridge, MA projects could also be pursued to provide greater flexibility vi vii
6


7 INTRODUCTION A 1966 study for the City of Philadelphia examined the engineering constraints, operational considerations and capital costs associated with extending the Broad Street Subway Line into The Navy Yard. i The plans demonstrated that the project was feasible despite several engineering challenges with construction and design costs estimated at roughly $14.5 million in 1966 dollars (roughly $96 million today). Building from the 1966 study and other earlier transportation studies regarding the Philadelphia Navy Yard, as well as the 2004 Philadelphia Navy Yard Master Plan, this Broad Street Line Extension Feasibility Study explores future transit alternatives into The Navy Yard that would benefit not only the immediate site but the needs of the region as well. This study is the first of several steps in the overall planning, design and funding process to implement potential transit improvements into The Navy Yard. The Philadelphia Authority for Industrial Development (PAID), acting on behalf of the City of Philadelphia, acquired approximately 1,000 acres at the site of the former U.S. Navy Yard from the federal government in March The Philadelphia Industrial Development Corporation (PIDC), a private, not-for-profit corporation created to promote economic development and job creation throughout the city, manages the planning, development and operation of these real estate assets on behalf of PAID and the City of Philadelphia. The process of federal base closure and ownership transfer was accompanied by nearly a decade of extensive public review and participation, along with the development of the 1994 Community Reuse Plan that largely guided redevelopment of The Navy Yard during the early stages. The 2004 Philadelphia Navy Yard Master Plan further provided a guide for planning and investment decision-making in the short and long-term by proposing new conceptual designs and infrastructure improvements for areas primarily outside the traditional shipyard vicinity. The 2004 plan also evaluated a number of transit options for The Navy Yard, including a preliminary analysis of an extension of the Broad Street Line. Larger in area than Center City Philadelphia and located at the foot of historic Broad Street, 3.5 miles south of City Hall, the 1,000-acre Navy Yard is by many measures already a success with 7,000 jobs and 80 companies and presents an extraordinary opportunity for economic development. One of the key factors required to maximize this opportunity is access to the regional transportation network, especially as the number of workers and businesses grows. With the transformation and redevelopment of major areas within The Navy Yard from predominantly military and industrial activities to a mix of industrial, commercial, retail and residential uses, opportunities exist to expand and streamline transportation services while pursuing and implementing potential development scenarios. Study Goal The goal of the study was to identify the opportunities and challenges related to the implementation of improved transit access to and from The Navy Yard to help PIDC, the Southeastern Pennsylvania Transportation Authority (SEPTA), the City of Philadelphia and other regional stakeholders determine the appropriate means by which such a potential investment may occur. Purpose of Study The purpose of the study was to assess ridership, engineering feasibility, preliminary project costs and funding options of extending the Broad Street Line (BSL) to The Navy Yard. Additional transit alternatives were explored for an order of magnitude comparison. Study Process Key elements of the study included the creation of a problem statement, the identification of the project s purpose and need, and the development and evaluation of three transportation alternatives (two bus alternatives and one rail alternative). Alternatives were developed to address transportation and land use needs including enhanced connectivity to and throughout The Navy Yard. Development assumptions, defined later in this report were included to help demonstrate reasonable future growth scenarios and formed the basis for ridership projections and cost estimates. The growth scenarios are based primarily on the development proposals from the 2004 Master Plan for The Navy Yard modified to reflect current development plans. Each alternative was then compared using evaluation criteria involving both quantitative and qualitative analysis to help identify the most appropriate investment into The Navy Yard. The study consisted of the following activities: Information and Data Gathering Data collection and conceptual engineering Summary of previous transportation and engineering studies Research property value impacts surrounding transit stations Interviews with regional stakeholders Purpose and Need Development of the purpose and need statement Development Scenarios Commercial and residential absorption and growth assumptions Parking availability Development of Alternatives Development of alternatives and documentation of assumptions Steering Committee participation Evaluation of Alternatives Ridership projections Operations plans Cost estimates Environmental impacts Economic impacts Traffic impacts Discussion of Project Findings Funding needs and financial assessment Project phasing possibilities Steering Committee feedback Recommendation of next steps Advisory Committee Insight and input from the project s Steering Committee, a collection of transportation professionals and other key stakeholders, provided oversight and guidance at critical decision-making points throughout the process. Initial study findings were reviewed by the Steering Committee prior to the final report. These participants represented the following organizations: Anne Kelly King City Council (Office of City Council President, Anna Verna) Darin Gatti City of Philadelphia - Streets Department Christopher Zearfoss City of Philadelphia - Transportation and Utilities Stephen Buckley City of Philadelphia - Transportation and Utilities Sara Merriman City of Philadelphia - Commerce Department Anthony Santaniello City of Philadelphia - Planning Commission Smitha Matthew City of Philadelphia - Streets Department Nicole Westerman Commonwealth of Pennsylvania Kate McNamara Delaware River Port Authority (DRPA) Robert Box Port Authority Transit Corporation (PATCO) Karin Morris Delaware Valley Regional Planning Commission (DVRPC) Keith Lynch Federal Transit Administration (FTA) Brian Berson Liberty Property Trust Brian Cohen Liberty Property Trust John Rink Port Authority Transit Corporation (PATCO) Robert Zolyak PennDOT - Bureau of Public Transportation Shawn Jalosinski Sports Complex Special Services District (SCSSD) Steven Silkunas Southeastern Pennsylvania Transportation Authority (SEPTA) David Fogel Southeastern Pennsylvania Transportation Authority (SEPTA) 1 2


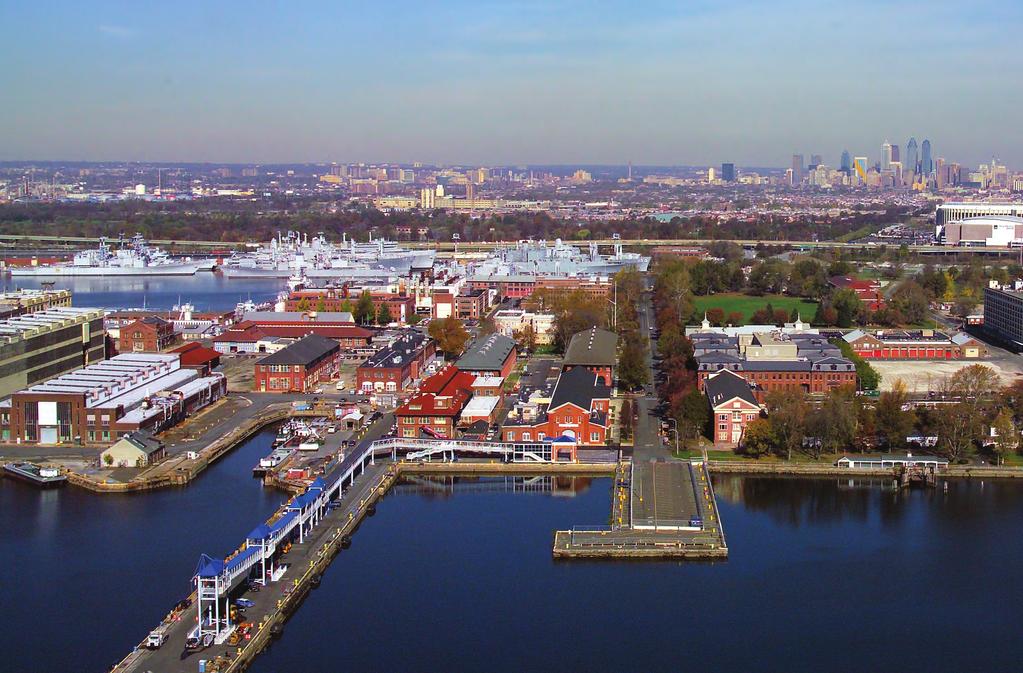
8 PROJECT DESCRIPTION T he Philadelphia Navy Yard (The Navy Yard) is located approximately 3.5 miles south of City Hall and encompasses 1,000 acres an area larger then Center City Philadelphia. The study area was defined as the entire Navy Yard site plus the area to the north of The Navy Yard from Interstate 95 to Pattison Avenue, which includes part of the stadium district and Franklin D. Roosevelt Park. The Broad Street Line Pattison Avenue station is located at the intersection of Broad Street and Pattison Avenue, along the northern boundary of the study area, approximately ½ mile from The Navy Yard front entrance. The study area boundary is shown in Exhibit 1. The 2004 Philadelphia Navy Yard Master Plan proposed six neighborhoods or development areas. From west to east, those areas are the Shipyard, Historic Core, Corporate Center, Research Park, Marina District, and the East End. The Research Park, Marina and the East End are mostly undeveloped currently, while the Historic Core, Corporate Center and Marina areas are expected to contain the majority of new office, retail and residential development over the next 40 years. Currently, there are 7,000 employees and more than 80 companies in a diverse array of industries from baking (coming in 2009) to shipbuilding in the Shipyard area to retail design and distribution, technology research and development, Exhibit A. Broad Street Line Extension Study Area 3 banking and consulting in the Historic Core, Research Park, and Corporate Center areas. As part of the 2004 Master Plan, future development in The Navy Yard without the subway extension includes $2-3 billion in private investment. With the anticipation of significant future growth, the study looked at three alternatives to improve transit access into The Navy Yard for areas primarily east of the Shipyard: Alternative 1: Current Bus (extended coverage) SEPTA s Route 71 bus provides service at 20 minute frequencies during peak periods using one vehicle. The study assumed the same level of service into the future and extends site coverage in phases as development occurs in The Navy Yard. Alternative 2: Enhanced Bus This alternative provides coverage similar to Alternative 1, but with an enhanced level of service that would make more frequent connections with the Broad Street Line at Pattison Avenue station to match the arrival/departure schedule of the subway. Alternative 3: Heavy Rail Extension This alternative consisted of a 1.5-mile extension of SEPTA s Broad Street Line into The Navy Yard, creating access to the region s rail network. This heavy rail investment is projected to support more aggressive high-value growth at greater densities within 0.5-mile radii of each of the two proposed stations. Purpose and Need The Navy Yard is poised to create over 12 million square feet of new commercial, industrial and residential development creating nearly 30,000 jobs. The ability to facilitate, and maximize, the enormous economic potential of the site is related directly to strengthening linkages between The Navy Yard, Center City Philadelphia and other regional commercial and residential centers. Access to The Navy Yard would benefit not only The Navy Yard employees, employers and future residents but also the region as a whole. To this end, The Navy Yard has begun to make major capital investments to its infrastructure systems to accommodate and encourage growth. However, without improved transit access, realizing the full development potential of the site may be impracticable. After considering The Navy Yard s connectivity to the region, heavy rail s potential to impact real estate values, and future traffic congestion concerns, the study s Steering Committee developed the following Purpose and Need statement: To improve the connection of The Navy Yard to Center City s jobs, residents and the region s transportation hub, To use public transportation as a means to create a vibrant development within The Navy Yard, To strengthen the development potential of the site and reinforce existing transportation investments, and To provide congestion relief, reduce driving, parking demand, and environmental impacts (resource impacts, runoff, air quality, etc.) associated with development at The Navy Yard through the implementation of quality public transportation. An extension of the Broad Street Line is projected to produce a positive net benefit to property values within a short proximity of its stations. Since The Navy Yard site provides extensive opportunities for new development, heavy rail can enhance the value of real estate being proposed for the site by improving access to The Navy Yard. As part of the study, a literature review ii on the The Navy Yard Main Gate at Broad Street 4 impacts of fixed guideway transit on surrounding property values (primarily around the station stops) was conducted demonstrating that property values in The Navy Yard could be positively impacted in three ways: Increase the desirability and the value of land simply through the improved access created by a project. Promote the density of development by requiring less parking and thereby increasing the property value per square foot of land. Provide the potential for more accelerated development given additional alternative for site access. The main gate of The Navy Yard site, on Broad Street north of Langley Avenue, is expected to become a point of significant congestion for traffic entering and exiting in the future without consideration of improvements to transit connections. Delays in accessing the site are expected to increase as peak hour traffic volumes are expected to exceed fixed capacity. This congestion could result in long queues on Broad Street entering the site, a condition which could interfere with the functioning of ramps to and from I-95, as well as on signal operations at Terminal Avenue. Projected evening peak hour intersection levels-of-service (LOS) at Broad Street indicate congested conditions by full build-out in 2045 with peak hour traffic volumes exceeding that of major roadways throughout Philadelphia. Without a reasonable solution to this problem, these conditions will increase travel times for employees and potentially inhibit The Navy Yard s growth and regional economic impact.


.")
9 Development Scenarios A s a large portion of the site is currently undeveloped, it creates several unique opportunities that would be challenging, if not impossible, in developed areas. These opportunities include planning and managing the scale, type and timing of development at The Navy Yard. Since these development factors greatly impact ridership projections and cost estimates, significant effort was invested to propose reasonable assumptions, absorption rates, and timeframes for the proposed development at the site. The exact size, type, timing and pattern of development will ultimately depend on market conditions and economic forces within the Philadelphia region and the country. However, the improved transit accessibility created by transit investments can be a significant factor in improving the competitiveness of The Navy Yard site compared to employment centers outside the region. Exhibit 2. Development Assumptions within ½ Mile of Stations by Year The 2004 Master Plan assumed an extension of the Broad Street Line with a terminating station at the physical center of the site (i.e., near the intersection of League Island Boulevard and Kitty Hawk Avenue). The Master Plan however did not account for the land use impacts or any potential increases in density surrounding the station as a result of the proposed transit investment. To account for these impacts for this study, PIDC enlisted Robert A.M. Stern, the original consultants on the master planning team, to revisit the planning and development assumptions. The re-evaluation of the plan resulted in a site plan concept with greater density of buildings and lower parking ratios (especially within a half-mile of the proposed stations) allowing less dependence on the automobile for trips. This plan calling for greater density was adopted as the Master Plan with Heavy Rail development scenario for the subway extension. The original master plan development scenario remains the default for the alternatives that do not include heavy rail (i.e., bus alternatives). The two development alternatives are described in 10-year increments in Exhibit 2. Master Plan Scenario: derived primarily from the original development plans from Robert A.M. Stern Architects which did not account for heavy rail access in land use patterns. This scenario was used for estimating ridership for each of the bus alternatives. Master Plan with Heavy Rail Scenario: assumed the extension of the Broad Street Line and increased development at the site. Development assumptions for this scenario included the addition of new buildings on surface parking lots, parking structures where needed with a decrease in the parking ratio, and an increase in the residential and office development. This scenario was used for estimating ridership for the heavy rail alternative. Master Plan Development Scenario The Master Plan development scenario assumes that growth will occur as proposed in the 2004 Navy Yard Master Plan. This scenario will result in a more auto-oriented suburban type development throughout, including the proposed Marina area in The Navy Yard. The Master Plan development scenario envisions an office park comprised of approximately 5.5 million square feet of office space with minimal residential component. However, the exact build-out and type of use for this area will be a market-driven decision. Exhibit 3 shows projected annual absorption rates for residential, office, and retail development. Exhibit 3. Annual Absorption with Master Plan Development Scenario In general, heavy rail is assumed to serve as an incentive for site investment and lead to greater intensity of activity while ameliorating the negative impact of additional traffic. The increased accessibility created by fixed guideway transit investments typically results in higher rents per square foot. This is particularly important in an era of increasing gasoline prices, congestion and limited roadway capacity. 5


10 Development Scenarios Transportation Alternatives Master Plan with Heavy Rail Development Scenario With an extension of the Broad Street Line into The Navy Yard, impacts to the pattern of development and the intensity of the development would be anticipated. Under this revised scenario the Marina, Corporate Center, and Historic Core districts would develop more as mixed-use destinations. Residents, tourists, shoppers, and employees will have an additional means to reach the site, creating a 24-hour destination. In this scenario, development will be denser and is catalyzed at a faster rate by the construction of the heavy rail extension. These greater absorption rates are shown in Exhibit 4. Exhibit 4. Annual Absorption with Master Plan with Heavy Rail Development Scenario Exhibits 5 and 6 illustrate the comparison of the two development scenarios. As expected, with heavy rail, more development is projected to occur on the site, particularly in retail and residential markets. Exhibit 6. Comparison of Retail and Residential Development by Scenario Exhibit 7 indicates the Master Plan with Heavy Rail scenario provides almost a 40% increase in office space and roughly a 500% increase in retail square footage and residential units compared with the 2004 Master Plan development scenario at full build-out. Due to the mixed-use environment over 3,000 parking spaces are anticipated to be converted into other uses as shown in Exhibit 8, a decrease of 13% from the Master Plan projection and an even greater reduction on a unit basis considering increased development. The development and growth assumptions derived in this section form the basis for the modeling efforts to project ridership and estimate costs as demonstrated in the Project Evaluation section of the study. Exhibit 7. Comparison of Development Assumptions T he intent of this study was to evaluate transit alternatives for connecting The Navy Yard to Center City s jobs, residents and the region s transportation hub. Several alternatives were initially considered for eligibility under the study, including those addressed in the 2004 Navy Yard Master Plan. These alternatives included bus, light rail and heavy rail. Ultimately, three alternatives were selected representing a full range of costs and service characteristics. First, a no-build alternative was defined to identify the consequence of maintaining the status quo and to provide a starting point for comparison of costs and ridership given different development scenarios in The Navy Yard. The no-build represented continuation of SEPTA s Route 71 service. Next, the study team defined a build alternative involving construction of a tunneled subway extension of the Broad Street Line. This build alternative reflected a reasonable solution to satisfy the purpose and need developed at the outset of the study and to help reduce travel times for transit users. It was determined that an enhanced bus service would be the third alternative considered for its lower-cost (compared to heavy or light rail), while providing a real solution for accommodating growth in The Navy Yard. This baseline alternative is typically the best that can be done without the provision of a major fixed guideway investment. This alternative was also seen as an incremental step toward a program leading to major investment. Light rail transit v, perceived to be a less expensive option to heavy rail, was originally under consideration. However it was determined that the cost estimates, projected ridership and service characteristics of light rail would have fallen within the ranges developed for the build and baseline alternatives. Light rail transit s advantages including route flexibility, less noise and pollution and its attraction to users were discussed, as were its potential drawbacks. These concerns focused on engineering constraints at The Navy Yard (i.e., road widths to accommodate both transit and non-transit vehicles along with other infrastructure requirements), as well as light rail s lower speeds if operated in mixed traffic and its capacity to handle high ridership demands expected to occur under the denser development scenario. Additionally, light rail transit would require a transfer from the BSL s Pattison Station for connection into The Navy Yard similar to the proposed bus alternatives, where as the heavy rail alternative provided a one seat ride. As part of PATCO s conceptual system expansion effort, light rail transit has the potential to connect service from The Navy Yard to destinations along the Delaware Waterfront and parts of Center City Philadelphia. In addition, the Broad Street Line Feasibility Study was not intended as an exhaustive list of alternatives given the study s limited scope. Likewise, the study does not preclude any alternatives from moving forward. The study s alternatives and additional modes and alignments will be explored during the next phase of project development (i.e., Alternatives Analysis) to define a preferred alternative should this project continue along the federal Small or New Starts process in the pursuit of federal funding. Exhibit 9 highlights the characteristics and assumptions of each of the three transit alternatives. Exhibit 5. Comparison of Office Development by Scenario Exhibit 8. Comparison of Parking Availability by Scenario 7 8
 and 30-minute frequencies during non-peak service that links The Navy Yard to SEPTA s Broad Street Line.")


11 Transportation Alternatives Exhibit 9. Summary of Transit Alternatives * Round trip lengths do not include limited daily service route extensions to shipyard. Alternative 1 Current Bus Service SEPTA currently operates 20-minute frequencies during peak periods (i.e., generally from 6:30 to 11:00 AM and from 4:30 to 6:30 PM) and 30-minute frequencies during non-peak service that links The Navy Yard to SEPTA s Broad Street Line. Over time greater frequencies will accommodate projected ridership increases. This operation is currently subsidized by PIDC and The Navy Yard tenants as an amenity and sole transit alternative during weekdays for The Navy Yard. This alternative does not include weekend service expected to be continued by SEPTA s Route 17. Alternative 2 Enhanced Bus Service Alternative 2 provides enhanced bus service that will arrive immediately in advance of each regularly scheduled Broad Street Line departure from the Pattison Avenue Station and depart shortly after each BSL subway arrival. The enhanced bus alternative would provide for general improvements to the current bus service by providing longer hours of operation including weekend/holiday service, improved frequencies, as well as additional service enhancements such as newly designed shelters, bus stop signage and other passenger amenities. These operational improvements and service adjustments combined with the identified passenger facility investments normally result in increased patronage. Septa Route 71 at The Navy Yard Septa Articulated Bus Bus Route Coverage (Alternatives 1 and 2) Phase I (Years ) Phase I is anticipated to begin in 2010 after construction of Diagonal Boulevard, the primary artery of the 72-acre Corporate Center development area. Phase I matches existing Route 71 coverage, but is modified slightly to include Diagonal Boulevard. Phase I route coverage is assumed to be the same for both Alternatives 1 and 2 operations. In this phase, a 40-foot, 39-seat bus (66 total passengers) starts its route at Pattison Avenue Station, the terminus of the Broad Street Line subway, and completes a 3.6-mile loop around the stadium district, south along Broad Street, east through the Historic Core (via Flagship Drive and Kitty Hawk Avenue), northwest along Diagonal Boulevard and returns to the Pattison Avenue station. During off-peak early morning and mid-afternoon hours, the bus runs west along Kitty Hawk Avenue to service Aker Philadelphia Shipyard in coordination with employee shift changes. The proposed route for Phase I is illustrated in Exhibit 10. Phase II (Years ) Phase II is anticipated to begin service in 2025 expanding coverage to serve newly developing areas of The Navy Yard that are not currently covered by SEPTA s Route 71. At the start of this phase over half of The Navy Yard s development potential is anticipated to be completed and it is expected that the eastern portion of The Navy Yard including the Marina district has begun to be constructed. Phase II will include a route expansion from 3.6 to 6.5 miles. This longer route will provide service to and connect with most areas within The Navy Yard. Phase II reflects all-day service with articulated 60-foot buses (65 seats, 99 total passengers) adding capacity to accommodate the peak load demand from 2025 through build-out. Phase II route coverage is assumed to be the same for both Alternatives 1 and 2 and would extend down Diagonal Boulevard through the Corporate Center employment area to the Marina and then west along Kitty Hawk Avenue to the Historic Core. The proposed route for Phase II is illustrated in Exhibit
 from the Broad Street Line s Pattison Station to The Navy Yard.")
.")

12 Transportation Alternatives Alternative 3 Heavy Rail Extension Four conceptual heavy rail alignments were explored and compared for their engineering feasibility and cost, as well as access and station proximity to proposed jobs and residential units in The Navy Yard. The preferred alignment for Alternative 3 provided the most direct connection (i.e., the shortest distance) from the Broad Street Line s Pattison Station to The Navy Yard. Additionally, the bulk of future employment and residential units were located within a half-mile radius of the preferred alignment s proposed stations vi (see Appendix A for a map and detailed descriptions of all four heavy rail alignments). Distances beyond a half-mile from each of proposed stations in The Navy Yard could benefit from an internal circulator shuttle or feeder bus service with connections to the subway. However, for this level of analysis and for comparison of isolated alternatives, connecting bus service was not included. With an anticipated opening date of 2016, Alterative 3 included two proposed stations: one situated in the middle of the Corporate Center on Diagonal Boulevard and one in the Marina area to be the terminus of the fixed guideway investment. The subway extension would operate the same train sizes and frequencies used by SEPTA for the Broad Street Line, with train frequencies varying from 7 and 13 minutes during weekday schedules and 11 minutes on weekends and holidays. This level of service is expected to meet demand through full build-out at The Navy Yard, anticipated to occur around The preferred heavy rail alignment shown in Exhibit 12 begins at the south end of the existing Pattison Avenue Station and extends the existing Broad Street Line (upper level only) approximately parallel to and east of Broad Street to a point immediately south of Interstate 95. The horizontal alignment has been developed to minimize potential impacts to I-95 including its access ramps and to avoid conflict with a proposed building at the beginning of Diagonal Boulevard on the north side. After passing beneath I-95, the alignment angles slightly to the west and passes beneath the existing freight rail line that parallels the south side of I-95. The preferred alignment will avoid impacts to the existing freight rail service both during construction and operation of the heavy rail alternative. The alignment then turns in a southeasterly direction underneath the proposed Diagonal Boulevard. The 500-foot radius curve at this location is required to accommodate the alignment beneath I-95 and to avoid existing and proposed buildings flanking the beginning of the Diagonal Boulevard. The alignment then follows Diagonal Boulevard and is offset closer to the south side of the boulevard to allow space for utilities along the north side of the boulevard. Beyond Kitty Hawk Avenue, the alignment turns eastward and terminates at the location of a proposed second station serving the Marina area. This alignment would not provide a new station to serve any part of the sports complex; Pattison Avenue station would continue to serve that market. Further evaluation of proposed modes and alignments will be undergone in the next step of the federal New Start s process leading to a preferred alternative. With the selection of a preferred alternative, preliminary engineering will provide more detailed plans for construction. Exhibit 12. Alternative 3 Broad Street Line Extension (with original conceptual alignments) 11


13 Evaluation Criteria Project Evaluation A s part of this study, each transportation alternative was assessed using a set of evaluation criteria to guide comparison of the alternatives. It was determined that the following key elements would be considered to evaluate the alternatives: Ridership Capital Costs Operating Costs Environmental Impacts Economic Impacts Traffic Impacts Ridership Ridership is a key criterion for determining the impacts of proposed transportation investments. Ridership projections were based upon the development assumptions and are expressed in average daily boardings, or the number of individuals boarding the bus or entering a subway station. Bus ridership was derived by applying current transit mode share at The Navy Yard to future employment and residential projections that reflected 2004 Master Plan development assumptions. For enhanced bus, ridership increases beyond current bus service were anticipated by the ridership response expected from increased service frequency, as well as through improved passenger amenities and facility improvements. These improvements include upgraded bus shelter designs and signage. For the heavy rail alternative, a sketch model was utilized. The model was developed based on ridership information of 11 other heavy rail systems in United States. The estimates are computed using station area characteristics, such as proposed office and residential development, availability of parking, proximity of the nearest station, as well as system wide characteristics such as Central Businesses District (CBD) density. Ridership estimations (for bus and rail) may be impacted by the uncertainty of fluctuating economic conditions and depend on the occurrence of future events that cannot be assured. Therefore, the actual results achieved may vary from the projections, and the variations could be significant. This preliminary analysis is intended to establish need and whether further study is desirable for this long-term investment project. Capital Costs Capital costs for bus and rail alternatives were estimated by applying standard unit costs from a capital cost library. To ensure thoroughness and to develop costs in a commonly accepted way, capital costs itemization was consistent with the Federal Transit Administration s (FTA) latest New Starts template, including guideway, facilities, vehicles, stations, utilities, systems, right-of-way, and soft costs including design, insurance and contingency. Capital costs for FY 2007 for fleet related costs were obtained directly from SEPTA. Each alternative s capital costs were measured in 2008 dollars. Operating Costs Based on the operating plans for each alternative, key operating drivers such as peak vehicles, revenue vehicle hours and revenue vehicle miles were developed. For bus and rail alternatives, SEPTA s current costs per vehicle mile, per vehicle revenue hour, per peak vehicle with an add-on for other administrative costs were computed. Other systems from the FTA s National Transit Database of transit agency operating statistics were used to ascertain reasonableness of these unit costs. Unit costs are multiplied by the alternative-specific operating drivers to arrive at the total operations and maintenance (O&M) cost. This approach is consistent with FTA guidelines for operating and maintenance costs. Each alternative s operating and maintenance costs were measured in 2008 dollars. Environmental Impacts A dashboard scan of potential environmental impacts was conducted by comparing the alternatives to existing inventories of significant environmental features. This includes parkland, cultural sites, potential hazardous waste sites, solid waste landfills, wetlands, water resources, areas that contain endangered or threatened species, and cemeteries. Results are presented qualitatively. Economic Impacts Economic impacts were evaluated by measuring the economic impact of construction costs and operating costs for each transportation alternative and the construction costs and on-going operating costs for the development at the site (which may vary among alternatives), as well as fiscal or tax activity generated by upfront construction and on-going operations. These impacts are computed in 2008 dollars. Traffic Impacts A top-level analysis of the traffic and parking impacts was conducted as a proxy for system improvements. Using the development assumptions and sketch ridership estimates, vehicle trip generation estimates for each alternative were based on standard trip generation rates from the Institute of Transportation Engineers Trip Generation manual. To estimate future daily traffic volumes and intersection levels-of-service for each alternative, new generated trips were added to existing traffic count data. T ransportation models and additional quantitative and qualitative analysis were utilized from data obtained by SEPTA, FTA and additional sources to evaluate several key elements of each transit alternative. These steps and a summary of project findings are described in the following sections. Ridership Real estate development drives the demand for transit and vice versa. Given the development assumptions, station area demographics, and the BSL s system-wide characteristics, demand for heavy rail patronage is similar to other stations on the Broad Street Line. When the fixed guideway extension is anticipated to open in 2016, it is expected that fewer than 3,000 total boardings a day would occur. As development progresses, however, that number is anticipated to increase to over 8,000 boardings a day by 2045 at the two Navy Yard stations combined. For the bus alternatives, ridership is estimated to be comparable to other routes in the region with similar service characteristics. The bus alternatives are anticipated to provide from 260 to almost 400 boardings a day starting in 2010 and increase with development to over 760 to 1,150 daily boardings at full build-out at The Navy Yard. As shown in Exhibit 13, the heavy rail alternative in its opening year (2016) is expected to generate roughly five to seven times the boardings when compared to the bus patronage estimates projected under Alternatives 1 and 2. However, these projections utilize different underlying development assumptions and build-out schedules reflecting different growth scenarios and population densities. Exhibit 13. Summary of Projected Daily Boardings at The Navy Yard by Alternative Bus Ridership (Alternatives 1 and 2) This section addresses the results of the ridership forecasting component of the study for each of the two bus alternatives. These ridership estimates are derived from the development scenarios and form the basis for the feasibility analysis. Current bus mode share vii for The Navy Yard was applied to future employment and residential projections in the Corporate Center, Historic Core and Marina, as well as the Shipyard areas (the Girard Point area was not included). Alternative 2 used an additional service enhancement factor taking into account improved frequencies, longer hours of service (to match the BSL operating hours) and new passenger amenities including shelter and signage improvements. As noted earlier, development assumptions for the bus alternatives were different than those of the rail alternative, reflecting a lower absorption rate, lower residential proportion in the commercial/residential mix, and lower densities at full build-out in Model results included projections of average daily boardings at The Navy Yard in five year intervals from 2010 through Alternatives 1 and 2 assume that several capital improvements including the construction of Diagonal Boulevard and additional stations would be completed by 2010 and mark the commencement of both alternatives. Ridership for 2016 is also included to compare with the initiation of operations for the rail alternative. Current ridership on other comparable SEPTA bus lines is also presented for comparative purposes. Expected average daily boardings viii occurring within The Navy Yard for each of the bus alternatives are presented in Exhibit 14. Exhibits 15 and 16 (next page) highlight opening and full build-out year ridership projections occurring along the entire proposed route for each alternative to similar ridership numbers from existing bus routes within the SEPTA system. Average peak hour frequencies are also presented to show comparisons in service. Exhibit 14. Projected Boardings for Alternative 1 Current Bus and Alternative 2 Enhanced Bus 13 14
 These were obtained through the study s development assumptions and were assumed to vary with time.")


 Heavy Rail Ridership (Alternative 3) This section addresses the results of the ridership forecasting")


14 Project Evaluation Exhibit 15. Comparison of Existing Boardings with Projected Boardings on Alternative 1 (Entire Route*) These were obtained through the study s development assumptions and were assumed to vary with time. Other variables were assumed to remain constant as shown in Exhibit 18. If these variables change, so will the ridership. Exhibit 19. Comparison of Existing Boardings of Select Transit Stations with Projected Boardings on Proposed Stations One potentially influential variable is the number of buses connecting to a station. Bus service may be provided in addition to the heavy rail service as a feeder route (or possible circulator shuttle) as development in The Navy Yard increases. However, for this level of analysis and for comparison of isolated alternatives, connecting bus service was not included. Such service could increase ridership modeling results. Exhibit 18. Ridership Model Assumptions for New Broad Street Station 1 and 2 Exhibit 16. Comparison of Existing Boardings with Projected Boardings on Alternative 2 (Entire Route*) Heavy Rail Ridership (Alternative 3) This section addresses the results of the ridership forecasting component of the study for the heavy rail alternative. Model results in Exhibit 17 included projections of average daily boardings at each of the two proposed stations in five year intervals between 2016 and Exhibit 17. Projected Boardings for Alternative 3 Heavy Rail xi As presented in Exhibit 19, existing boardings and other station area characteristics of select subway stations on the BSL were compared to projected boardings on proposed stations at The Navy Yard. These projected boardings indicate that patronage at the proposed stations compare favorably to other Broad Street Line stations currently serving customers. xii As presented in Exhibit 19, existing boardings and other station area characteristics of select subway stations on the BSL were compared to projected boardings on proposed stations at The Navy Yard. These projected boardings indicate that patronage at the proposed stations compare favorably to other Broad Street Line stations currently serving customers. Operations Plan Operations planning for each alternative anticipated the number of vehicles and types of service needed to handle the ridership demands projected for the future at The Navy Yard. These results were also essential for estimating capital and operational costs. The round trip operation time of the Broad Street Line would increase approximately 14% (or less given that the average speed on the extension is likely to be higher than the rest of the line due to station spacing). Assuming the continued use of a 5-car consist configuration on the BSL, the increased operation time would result in a need for only 5 xiv additional cars or 1 train during peak hours. If the heavy rail line only operated between The Navy Yard and Pattison Avenue stations, two trains would have been required, but analyzing the entire BSL s capacity including the extension indicated one extra train was sufficient. The bus alternatives included frequencies and hours of service that matched either SEPTA s Route 71 or current Broad Street Line operations. The travel times for the bus alternatives varied from 18 to 31 minutes round-trip (or 23 to 35 minutes round-trip including shipyard service) based on the phase of each alternative as the routes are modified to cover new development. Finally, Alternative 1 required from 1 to 3 vehicles xiii, while Alternative 2 required from 3 to 5 vehicles as The Navy Yard goes to full buildout in The heavy rail ridership model uses station-area demographic characteristics, such as employment within 0.25 miles of the station, employment within miles of the station, and population over 16 years old within 0.5 miles of the station. Using current Broad Street Line service characteristics, Alternative 3 would operate trains with a 7 to 13-minute frequency during weekday schedules and 11 minutes on weekends and holidays

.")


15 Project Evaluation Bus Operations Plan (Alternatives 1 and 2) In order to handle the projected ridership, the study team conducted an operations planning analysis for both bus alternatives. Routes will be modified in phases to provide additional site coverage as new development occurs in The Navy Yard for both Alternatives 1 and 2. Phase I is anticipated to begin in 2010 in concert with several capital improvements including the construction of Diagonal Boulevard and additional stations. Phase II is anticipated to begin in 2025, when development is anticipated to have begun on the eastern side of The Navy Yard (and when over half of the anticipated development has been completed). Phase II will include a bus route expansion from 3.6 to 6.5 miles. The longer route will provide service to and connect with most areas within The Navy Yard. Phase II reflects service with articulated 60-foot buses to accommodate the peak load demand from 2025 through build-out. This operation is typical as growth occurs over time on a route. requiring roughly 1 to 2 additional extra vehicles per alternative. Service to this area is being explored by SEPTA and PIDC possibly utilizing SEPTA Routes 68 or C. Exhibit 21. Frequencies, Hours of Operation and Peak Bus Vehicle Requirements Exhibit 23 shows the frequencies and hours of operation of the Broad Street Line based on its current characteristics. Because SEPTA does not operate its service at exact intervals throughout the day, average values were used in some cases to estimate general frequency characteristics. The additional cars needed column represents the estimated peak rail car requirement for the extension only xvii. This column is the difference between the existing and future peak cars. The table assumes that the service will run from 5 AM to 1 AM daily without additional Night Owl bus service. Exhibit 23. Frequencies, Hours of Operation and additional Peak Passenger Cars Due to the very small number of buses and railcars required for the alternatives, it was anticipated that existing shop/storage facilities can absorb the small increase without additional investment. Although the railcars were priced conservatively considering the small number required, it is possible that they could be part of a larger purchase depending on the timing of the subway completion and SEPTA s fleet replacement program. New rail and bus vehicle costs were derived from the operations plan and include a spare ratio of 15%. Capital costs for Alternative 1 and 2 reflect new buses at roughly 2010, 2025 and replacement buses around 2037 in Phase II to account for the assumed 12-year vehicle life cycle. Railcars were assumed to remain operational for 30 years and therefore no replacement vehicles were included given the planning horizon to Vehicle requirements are shown in Exhibit 25. Average bus speed was calculated at roughly 14 mph xv. Additional environmental considerations and traffic interferences may affect operating speed and can be adjusted as site conditions are better known. Service characteristics including average speeds, round trip distances and travel times (incorporating estimated layovers) were assumed to be the same for each bus alternative as shown in Exhibit 20. Exhibit 20. General Characteristics of Alternatives 1 and 2 into The Navy Yard Heavy Rail Operations Plan (Alternative 3) This section addresses the results of the operations planning analysis for the heavy rail alternative. Future operational characteristics for the subway extension were assumed to remain the same as current Broad Street Line operations. Results of the operations plan are crucial for the development of other elements of the study, most importantly the operations and maintenance costing and the capital cost analysis. The service characteristics for the BSL extension are based on current SEPTA operations, yet were modified to accommodate the two additional Navy Yard stations. The current peak period service frequencies, off-peak service frequencies, and weekend operating hours were used and assumed to remain constant into the future. Hours of operation during weekdays and weekends (including SEPTA service holidays) were also assumed to remain constant. Capital Costs An important component in any new transit investment is the identification of estimated construction and equipment costs. Planning-level capital costs were formulated for each alternative. Actual implementation costs may be higher or lower depending on subsurface conditions encountered and utility relocation necessary, among other construction challenges. To account for these uncertainties, capital costs are represented in a range for the three transit alternatives in Exhibit 24. Capital costs were estimated in 2008 dollars. Exhibit 24. Summary of Capital Cost Estimates (2008 Dollars) Exhibit 25. Proposed New Vehicle and Station Requirements For the heavy rail alternative, the guideway (tunnel structure) and site work are the largest cost elements. These are conservatively estimated considering unknowns of soil and lower groundwater conditions that will require detailed investigation during preliminary engineering. Detailed discussion on subsurface conditions is located in Appendix C. Alternative 1 assumed a 20 minute peak bus frequency (30 min off-peak) during Phase I and a 12 minute peak (20 min off-peak) frequency during Phase II. The increase in service frequency accounts for the increase in ridership as development occurs in The Navy Yard. Alternative 1 will not operate on weekends or holidays. Alternative 2 assumed roughly 7 minute peak frequencies (13 minute off-peak) and 11 minute frequencies on weekends and holidays in both Phases I and II. Exhibit 21 shows the frequencies and hours of operation, as well as peak vehicle requirements for each bus alternative by phase. Additional limited weekday service extending each route to the Shipyard area (an extension of roughly 1-mile round trip) reflects approximately 12% of weekday boardings per day and was incorporated into the vehicle requirement calculations. Limited weekday service originating from Broad Street and Langley Avenue to the Girard Point area was not included in the operations plan. This service would add another 2.4-mile round-trip leg to each route, increasing travel times and operating costs and SEPTA currently reports service characteristics of the Broad Street Line combining the local and express service along with the Ridge Avenue Spur. For the purposes of this analysis, it was assumed that the BSL extension to The Navy Yard would only operate using the local service on the Broad Street Line. As a result, the speed of the local service was also utilized for the extension. Exhibit 22 presents the local service characteristics of the Broad Street Line (without the Ridge Avenue Spur) with the proposed extension. A 5-car train consist configuration, currently used on the Broad Street Line, was assumed for the extension. Exhibit 22. General Characteristics of Local Service of the Broad Street Line with The Navy Yard Extension For Alternative 3, it is expected that both stations would be implemented as one project with the same opening date of Quantities of construction elements were estimated based on the conceptual profile, alignment, and typical tunnel cross section developed for the study (see Appendix A and B for heavy rail alignments and conceptual engineering). For current and enhanced bus alternatives, costs were developed for two phases, 2010 and 2025, when additional equipment purchases are anticipated. Costs include additives for engineering (10%) and construction and program management (10%) applied to construction costs but not vehicles. A 20% contingency was applied to the total costs for each alternative. Appendix D provides a full summary of capital costs by the standard FTA New Starts cost categories. No right-of-way purchase requirements are anticipated. Operations and Maintenance Costs This section addresses the results of the Operations and Maintenance (O&M) costing analysis for each of the three transit alternatives. O&M costing for the bus alternatives and the Broad Street Line extension assume that unit costs for the operation of the each alternative would be similar to those currently incurred by SEPTA provided bus or heavy rail service. The cost estimating model allocates annual O&M costs to several service variables: annual vehicle revenue hours, annual scheduled revenue vehicle miles, peak vehicles and directional miles of guideway (for heavy rail only). The models were derived from SEPTA s actual fully allocated unit costs, as well as the FTA s National Transit Database (NTD) data, which is disaggregated into various cost functions. This methodology is consistent with FTA guidance suggesting a resource productivity approach to estimating O&M costs. All O&M costs are represented in 2008 dollars and do not include the effects of inflation over time


16 Project Evaluation Bus O&M Costs (Alternatives 1 and 2) Total O&M cost for each alternative was initially calculated using current SEPTA Route 71 operational characteristics. The result was calibrated against actual results provided by SEPTA for 2006 and As a point of comparison, the study team calculated the costs for the Massachusetts Bay Transportation Authority in Boston using NTD unit costs for buses to assure that the outcomes are reasonable with those of the SEPTA model. O&M costs for other SEPTA bus routes with similar service characteristics (e.g., annual vehicle hours, vehicle miles and peak vehicles) were also calculated with the model and compared to actual results to further ensure the model s reliability. After validating the O&M model through comparison to other bus systems, O&M costs were computed by phase for each alternative reflecting new service characteristics. These costs are shown in Exhibit 26. Cost differences between alternatives reflect the variation in each route s hours of service, length, frequencies and vehicle requirements as identified in the Operations Plan section of the report. These O&M costs are assumed to remain constant from the initial opening date of 2010 to 2025 (Phase I) and from 2025 to full build-out of The Navy Yard in 2045 (Phase II). Fuel costs are a component of the cost service variables which reflect 2008 dollars. The uncertainty of fuel prices and labor/fringe benefit costs over time may additionally impact O&M costs. Alternatively, as hybrid and more fuel-efficient technologies are incorporated into SEPTA s bus fleet, the rise in fuel costs may be offset to an extent. Exhibit 26. Annual Projected Bus O&M Costs (2008 Dollars) xviii Heavy Rail O&M Costs (Alternative 3) Total O&M cost for the entire Broad Street Line was initially calculated using current operational characteristics. The result was calibrated against the actual results provided by SEPTA for 2006 and Furthermore, the results were computed based on NTD data for Miami-Dade County Metrorail service per unit costs to assure that the outcomes are reasonable with that of the SEPTA model. After validating the O&M model through comparison to other heavy rail systems, O&M costs were computed for the Broad Street Line using the new service characteristics such as annual passenger car miles, hours, peak passenger cars, as well as revised miles of fixed guideway. The O&M costs associated with Alternative 3 from Pattison Station to The Navy Yard was the incremental difference between operating the Broad Street Line with or without the extension. Because there are assumed to be no changes to service characteristics, O&M costs for the extension are assumed to be the same from the initial opening date of 2016 through the study period end date of 2045 as shown in Exhibit 27. Due to the location of the two stations and the water table levels, additional costs may be incurred for water pumping. Exhibit 27. Projected Annual O&M Costs (2008 Dollars) xix 20


17 Project Evaluation Environmental Impacts A general overview was conducted to examine significant impacts related to environmental features at The Navy Yard. A detailed environmental analysis and screening is expected in later environmental studies as part of the implementation development process to meet federal funding requirements. It is anticipated that the two bus alternatives would result in fewer environmental impacts on The Navy Yard due to their use of existing infrastructure but would still add noise and air pollution to the site. Extending the Broad Street Line may have the potential to impact the environmental elements discussed below which is typical of major infrastructure projects, however these impacts can be mitigated and should not preclude development of a subway from occurring. Hazardous Waste The proposed heavy rail alignment crosses a portion of The Navy Yard that is covered by an Act 2 Special Industrial Area Agreement. Construction within this area must conform to the requirements stipulated in the Agreement. In particular, the amount of remediation required (if any) or actions necessary to ameliorate any impacts prior to construction depends on the type and use of the proposed development. Threatened and Endangered Species There are several endangered species, both resident and transient, that are present in the area. The final alignment would have to be checked for the presence of various plant and animal species and contingency plans made to address the relocation or reestablishment of those species after the construction work. Construction activities for any alternative would need to apply mitigation strategies to avoid impacts to any possible threatened and endangered species. Historical and Cultural Resources The proposed heavy rail alignment is in close proximity to historic properties in the Corporate Center and Marina areas (including the Seaplane Hanger). Construction in these areas would require the approval of the PA Historic and Museum Commission and may warrant context sensitive designs for both stations and signage. The proposed rail alignment also crosses two potential archeological areas at the Corporate Center. One area is along the railroad tracks at Broad Street and the other is located near the vicinity of the intersection of League Island Boulevard and Kitty Hawk Avenue. These areas would have to be evaluated by an archeologist prior to finalization of the plans. Archeological investigations are commonplace for all major construction projects within the City and normally involve the collection and documentation of artifacts if any are found. Providing a context sensitive design may have an impact on project costs but should not be a significant factor. Necessary mitigation measures to avoid impacts to historical or cultural resources would be employed during construction and operation of any build alternative. Wetlands and Waterways There do not appear to be any wetlands or waterways along the proposed route. Any new development, especially east of League Island Boulevard would require new storm water facilities built to new City codes requiring Water Quality Controls for the first inch of site runoff. There may also have to be controls for the peak rate of runoff. Economic Impacts The study team used a set of economic models to estimate the impacts of transit investments and development alternatives on the City of Philadelphia and the Commonwealth of Pennsylvania from This section examines the potential economic and fiscal (tax) impacts associated with the construction and operation of the various transit alternatives examined in this study, as well as the economic and fiscal impacts from the development scenario associated with those transit alternative. There are other economic impacts that are not accounted for in the study. For example, neither the impacts from congestion mitigation nor transit user benefits including travel time savings are accounted for in the scope of this analysis. As illustrated in Exhibit 28, economic impacts have two main contributing factors: (1) those arising from the transit alternative and (2) those arising from development and land use patterns at The Navy Yard in conjunction with that transit alternative. The transit alternative and the development impacts are generated by both one-time construction impacts and the on-going investment to operate the transportation alternative or the real estate development. Exhibit 28. Economic Impacts Methodology In general, there is a substantially greater economic benefit and therefore positive fiscal impact for both the City and the Commonwealth from the heavy rail alternative than from the bus alternatives. The difference in economic impact results from the greater investment required to implement the heavy rail system. The greater level of investment in heavy rail results in a greater economic boost from the purchase of materials and utilization of labor in the region and state. Exhibit 29 summarizes the economic impact for the three alternatives and the development scenarios on the City of Philadelphia and the Commonwealth. In addition to direct and induced economic impact from the transit alternatives and development, tax revenue is generated for the City and Commonwealth from the jobs and expenditures related to building and operating the transit system. The impacts in Exhibit 29 reflect a multiplier effect stemming from a particular initial capital investment. For instance, the construction of the extension of the subway (Alternative 3) is estimated to cost roughly $370 million. As these dollars circulate through the local economy $390 million in economic impact is generated. Likewise the economic benefit continues to the Commonwealth from the purchase of additional goods or services resulting in $632 million. As shown in Exhibit 29, the City of Philadelphia s economic impacts are included in the impacts to the State. Further assumptions, as well as the methodology and detailed potential economic and development impacts for the City of Philadelphia and the Commonwealth of Pennsylvania are found in Appendix E. Traffic Impacts The study team estimated future traffic conditions for each proposed alternative to compare impacts affecting The Navy Yard at its main access point on Broad Street (north of Langley Avenue) and League Island Boulevard. There are several elements that feed into the projected traffic volumes expected to impact The Navy Yard. Based on the 2045 development assumptions, vehicle trip generation estimates for each alternative were based on standard trip generation rates from the Institute of Transportation Engineers Trip Generation, 7th Edition. These rates are based upon stand alone properties. There would be some reduction in traffic volumes, known as internal capture, due to the proposed mixed use development. Specifically, it was assumed that all the retail on site will generate only internal trips from other areas of the site. In addition, a general internal capture rate of 10% was applied to all new development except the Girard Point and Shipyard areas. This analysis was based on two access points into The Navy Yard Broad Street and 26th Street. Earlier studies had considered an access at the East End area; however it was assumed that any access at the east end would serve exclusively the East End district. Approximately 30% of the total traffic is estimated to use 26th Street, with the remaining 70% of the traffic using Broad Street. This assumes that 40% of the Girard Point and Shipyard traffic will use 26th Street. The projected new vehicle trips in 2045 were modified according to the mode shares used for the ridership models. The ridership projections were based on person-trips, while the traffic volume projections are based on vehicle trips. However, given normal passenger vehicle occupancy rates, this is not a material difference for this level of analysis. Exhibit 29. Summary of Estimated Economic Impacts at The Navy Yard* 21 22
 traffic volumes, a 20% growth rate was added to traffic count data collected in 2003 at Broad Street and League Island Boulevard.")


18 Project Evaluation To evaluate build-out operating conditions, the new development generated trips were added to the existing traffic volumes. To estimate existing (2007) traffic volumes, a 20% growth rate was added to traffic count data collected in 2003 at Broad Street and League Island Boulevard. The resulting entering and exiting projected traffic volumes at Broad Street are shown in Exhibit 30. Exhibit 30. Projected (2045) Entering and Exiting Traffic Volumes at Broad Street The total development in the heavy rail alternative is considerably higher than the development in the bus alternatives. However, because of the higher modal split and greater percentage of residential development, the total number of vehicle trips increase only slightly. The office traffic is predominantly inbound in the morning and outbound in the afternoon, while the residential traffic is the reverse. Due to the mix of office and residential, as well as the greater heavy rail ridership capture than bus, the inbound traffic in the morning and the outbound traffic in the afternoon would be slightly lower in the heavy rail alternative compared to what is projected for the bus alternatives. As can be seen by this comparison, the projected traffic volumes entering and exiting Broad Street would exceed some of the heaviest traveled areas in the City of Philadelphia. Broad Street and League Island Boulevard Operations The intersection of Broad Street and League Island Boulevard was evaluated to determine the operating conditions, based upon the projected traffic volumes in 2045, with the lane configurations recommended in the 2004 Master Plan. This recommendation was for three lanes westbound from League Island Boulevard (two right turn lanes and one left turn lane), as well as four lanes southbound (two through lanes and two left turn lanes) and three lanes northbound (two through lanes and one combined through /right turn lane) along Broad Street. Level of service analysis is a procedure used to estimate the traffic carrying ability of roadway facilities over a range of defined operating conditions and characterize operational conditions as perceived by motorists and passengers. Traffic operations are expressed as a level of service (LOS) from LOS A (best) to LOS F (worst). For this analysis, the overall intersection levels of service are shown in Exhibit 32; the maximum volume-to-capacity (v/c) ratios are also shown to provide some perspective. For the morning peak hour, it is projected that the intersection of Broad Street and League Island Boulevard would operate at a level of service B or C for the three alternatives. For the afternoon peak hour, the intersection is projected to operate at level of service F for both alternatives, with extensive queues on the westbound and northbound approaches. Exhibit 32. Projected (2045) Levels of Service at Broad Street and League Island Boulevard What these levels of service don t show are the lengthy queues that are likely at the Broad Street/League Island Boulevard intersection impacting bus operations along with travel times and costs for other vehicles. In the morning, the southbound queues could be 700 to 1,000 feet long, depending on the alternative, when the distance between the signals at Terminal Avenue and the I-95 ramps and League Island Boulevard is less than 550 feet. These queues would interfere with the operation of that signal, with resulting backups on Broad Street and the I-95 ramps. In the afternoon, even longer queues are expected on northbound Broad Street and westbound League Island Boulevard, with even less available storage capacity. As noted earlier in the discussion on traffic volumes, the denser development levels in the heavy rail alternative do not result in significant increases in projected total traffic volumes compared to the bus alternatives. Office-related trips would actually decrease slightly in the heavy rail alternative, with the residential traffic increasing. With the different distribution patterns, this additional residential traffic is not projected to have an adverse impact on the overall intersection level of service between the heavy rail and bus alternatives. Summary of Findings Each of the transportation alternatives described in the study would improve mobility into The Navy Yard and to Center City s jobs, residents and the region s transportation network. Other benefits from each of these transit improvements would include congestion relief, reduced vehicle trips, reduced parking demand, and reduced environmental impacts (runoff, air quality, noise etc.) while strengthening the development potential of the site. A summary of these benefits and characteristics (shown in Exhibits 33 and 34) are contingent on the commercial, retail, and residential development that is expected to occur at The Navy Yard under the bus and rail alternatives. The bus alternatives would provide improved access to the site and extend service to all major areas within The Navy Yard. Service frequencies would be planned to match that of the Broad Street Line subway with significantly lower capital investment and annual operating costs. The bus alternatives, however, are not projected to be able to provide enough capacity to handle peak loads typically experienced with high ridership. This limit on performance would curtail the intensity and high-value density of development to that of the heavy rail alternative. As part of the 2004 Master Plan study, some representative peak hour volumes in the Philadelphia area were estimated to put the site volumes into perspective. These peak hour volumes were estimated from the Average Daily Traffic data from the Delaware Valley Regional Planning Commission (DVRPC), shown in Exhibit 31. Exhibit 31. Representative Peak Hour Volumes While the inbound volumes in the morning and the outbound volumes in the afternoon are comparable, the levels of service at the intersection are very different. In the morning, the inbound traffic is southbound on Broad Street, with (approximately) half continuing straight and half turning left onto League Island Boulevard. These two traffic streams can travel through the intersection at the same time, as they are parallel flows, and there is a relatively low volume of northbound traffic exiting the site to conflict with the inbound (southbound) left turns. In the afternoon, however, the two predominant streams of traffic conflict with each either, with half traveling northbound on Broad Street through the intersection and the other half turning right from westbound League Island Boulevard. Due to the close proximity of the I-95 ramps, it is not possible to design the intersection to allow for a free flow right turn into dedicated northbound lanes

 and thereby increasing the property value per")
 are considerably higher for heavy rail due the major construction effort necessary; however, the benefits of heavy rail investment outweigh")


19 Project Evaluation Alternative 3 would allow for a direct connection to SEPTA s Market-Frankford Subway Line and PATCO s High Speed Line into Southern New Jersey, as well as providing a one seat ride for Broad Street Line riders into Center City Philadelphia or for a potential tunnel connection under the Delaware River. Travel times for rail into The Navy Yard would be shorter compared with the bus alternatives, making this option more attractive to riders. The heavy rail alternative is projected to support a higher density of development requiring less parking (both in overall number and by parking ratios) and thereby increasing the property value per square foot of land around each of the stations. Capital costs (and to a lesser extent operating costs) are considerably higher for heavy rail due the major construction effort necessary; however, the benefits of heavy rail investment outweigh those projected for the bus alternatives. Projected peak hour traffic volumes entering and exiting The Navy Yard at Broad Street differ between bus and heavy rail alternatives due to the internal capture derived from mixed-use development and the significance that ridership plays on reducing the number of vehicle trips. Exhibit 33. Full Build-out Summary of Anticipated Operating Characteristics and Costs (2008 Dollars) xx Exhibit 34. Full Build-out Summary of Anticipated Development and Traffic Conditions at Broad Street The heavy rail alternative would produce slightly higher total traffic volumes in the peak hour due to the denser development scenario; however inbound trips in the AM peak hour and outbound trips in the PM peak hour are lower than the bus alternatives due to significant reverse commuting from the residential components within The Navy Yard. The heavy rail alternative is also projected to maintain peak hour intersection LOS similar to that of the bus alternatives while accommodating roughly 4,000 more jobs and 6,000 more residents with its aggressive development scenario. Put another way, in 2045 with higher transit mode share, Alternative 3 is projected to help contribute to fewer vehicles per employee or resident thus helping to ease congestion, reduce air pollution while at the same time obtaining denser growth and greater economic benefit for the region. At the same time, given the limited roadway access to the site, current and even proposed roadway design may be unable to handle the anticipated traffic volumes resulting in time consuming queues. The economic impacts associated with Alternative 3 are projected to provide greater monetary benefit from construction and ongoing operations compared to the bus alternatives. Likewise, the fiscal or tax revenues estimated to be generated from the construction and operations of the heavy rail alternative would be significantly higher then that produced from the bus alternatives. Similarly the economic and fiscal impacts anticipated from the ongoing private development activity at The Navy Yard would be considerably higher as a result of the heavy rail investment. Cost Effectiveness As part of the federal New Starts funding process, projects are evaluated and rated through several measures required by the FTA to advance and obtain a funding recommendation, as demonstrated in Exhibit 36. Exhibit 36. FTA New Starts/Small Starts Project Justification Measures The current FTA cost effectiveness measure is calculated by (a) estimating the incremental base-year annualized capital and operating costs of the project (over a lower cost baseline of transit service), and then (b) dividing these costs by the projected user benefits. The result of this calculation is a measure of project cost per hour of projected user benefits (i.e. travel-time) expected to be achieved if the project is added to the regional transit system. This measure however was beyond the capabilities of the study (due to the difficulties in obtaining accurate data needed to calculatethe User Benefit factor), so to provide a general sense of how alternatives compare to each other, two supplementary cost effectiveness measures were conducted as a proxy to the FTA New Starts quantitative ranking: Cost per rider Riders served per dollars of capital investment Exhibit 37. Cost per Rider ( ) for heavy rail which is anticipated to have higher daily boardings compared with the bus alternatives. The uptick in the costs per rider in 2025 for the bus alternatives represents extended operating service anticipated in Phase II. Another method to determine cost effectiveness and evaluate each mode is through determining the theoretical riders served per dollar of investment, which is the ratio of estimated average annual ridership to the estimated annualized capital and operating costs in millions of dollars. The most cost effective alternative as shown in Exhibit 38 from 2010 to 2024 in terms of the ratio between ridership to cost is current bus. However, as the ridership/cost scores for each bus alternative decrease over time, the heavy rail alternative increases as efficiency improves. This is a consequence of O&M costs where buses typically are less cost effective to operate at higher ridership volumes. For instance, to maintain higher peak loads, more buses and drivers are required thus increasing fuel and labor costs (which comprise the bulk of O&M costs), while heavy rail can operate 5-car consist with the efficiency of only one driver. Exhibit 38. Riders Served per Million Dollars of Investment ( ) Exhibit 35. Comparison of Estimated Transit Mode Share in 2045* Cost per rider includes annualizing the capital costs similar to a standard amortization formula that represents the yearly amount needed to pay-off the initial investment and considers vehicle replacement costs based on standard life cycles. Project operating costs are also added to the annualized capital costs to get total annual costs. The total costs are divided by the number of annual riders for a particular time period. These comparisons depend on the growth scenarios at The Navy Yard occurring as outlined in the development assumptions. As shown in Exhibit 37, each alternative generally experiences higher costs per rider in their opening years of service. Alternative 2 compared with current bus service is expected to be more expensive due to its greater operating costs. As projected ridership increases over time the cost effectiveness improves for each alternative especially 25 26

20 Funding needs T raditionally, project sponsors would look to federal sources to finance a significant portion of the capital costs for projects such as the Broad Street Line extension. However, over the last five years the amount of federal funding allocated through the discretionary federal New Starts program has decreased while the number of new commitments has remained steady. The federal share of capital costs also has declined in recent years, and project sponsors are normally encouraged to expect to finance approximately 50 percent or more of the construction costs as the high demand for New Starts funding now often requires a greater local/state match. As an alternative, innovative funding sources may help fill this gap or create an alternative means to completely fund major transit projects. Exhibit 39. Federal New Starts Allocations, Commitments and Full Funding Grant Agreements per Fiscal Year* Similar Development Case Studies Two real world examples of innovative funding approaches used to implement transit improvements and spur economic development include projects in New York City (Hudson Yards) and in Cambridge, Massachusetts (NorthPoint). New York City (Hudson Yards) Development has begun on the Hudson Yards project that incorporates a 45-block area on the far west side of Manhattan adjacent to the Midtown Manhattan central business district. In 2005 the New York City Council approved a comprehensive rezoning of Hudson Yards after completing the state s environmental review process to allow for: 24 million square feet of new office space 13,500 new housing units, including almost 4,000 affordable units 1 million square feet of new retail space 2 million square feet of new hotels. The infrastructure backbone of the project is the extension of the Metropolitan Transportation Authority s No. 7 Subway line to the west from the existing terminus at West 41st Street and Seventh Avenue (Times Square), with a station at West 41st Street and Tenth Avenue, and then south, to a new terminus at West 34th Street and Eleventh Avenue. Construction of the tunnel and terminal station structure is underway with completion expected in The proposed extension would place nearly all points in Hudson Yards within less than a 10-minute walk to a subway station. The City of New York has committed to funding 100% of the cost of the heavy rail extension. Currently $2 billion in bonds backed by future development on the site have been issued to provide initial financing for the design and construction of the we stern extension of the subway, as well as to create parks and open spaces. Because of the site s Transit Oriented Development potential and former industrial heritage, The Navy Yard could also benefit directly or indirectly from state loan and grant programs. For example, the Pennsylvania Department of Community and Economic Development manage two such programs: the Infrastructure Development Program and Transit Revitalization Investment District. Another potential non-federal funding source includes the use of bonds. Bonding capacity depends on many factors including the willingness and ability of public and private agencies to issue bonds for funding capital costs. Regional agencies with the potential for bond financing large infrastructure projects include SEPTA, DRPA, the City of Philadelphia and the Commonwealth of Pennsylvania. Innovative financing concepts include a variety of public-private partnership (PPP) arrangements, capital improvement districts or private contribution and fees. These concepts are based on the leveraging of current or projected future revenue streams and, if employed, could shorten the time to implementation. Debt service on the bonds issued by the Hudson Yards Infrastructure Corporation, a special purpose local development corporation, will be covered primarily by revenue streams coming from the sale of development rights and the incremental revenues from new commercial and residential development in the area (through payments in lieu of taxes) within a special Hudson Yards Financing District. Cambridge (NorthPoint) The NorthPoint project has started to transform 45 acres (two buildings have been completed) of a former rail yard near Boston through a private developer into a mixed-use development. The project approved by the City of Cambridge will include 2.2 million square feet of commercial space and 2,700 residential units. At complete build-out in 15 years, the NorthPoint project will include 20 new buildings, transit improvements, nearly 10 acres of open green space, and approximately 1 mile of new roadway and utility infrastructure. 28
")


21 Funding needs The new station in eastern Cambridge is being paid for by the developer but undertaken in a public-private partnership with the Massachusetts Bay Transportation Authority. The state legislature on behalf of NorthPoint s developer has approved and issued $130 million of special assessment bonds through MassDevelopment (the state s finance and development authority) which are guaranteed by the value of the NorthPoint land. Bond proceeds will help finance the relocation and construction of a new transit station, a new bus station, the creation of a 10-acre park, roadway improvements to the adjacent highway, public utility improvements, and landscaping enhancements. The new station is currently in the design stages with the state s environmental documentation complete. The station is expected to have an opening date of As part of the Broad Street Line Extension Feasibility Study, the study team undertook a review of relevant federal, state, and local funding programs both formula and discretionary - that could be used to fund capital improvements and provide operating subsidies at The Navy Yard. In addition non-traditional funding mechanisms were also explored. This comparison will assist PIDC and other stakeholders to identify resources for financing the capital and operating costs associated with transit investment at The Navy Yard. Each potential funding source was evaluated qualitatively by assessing its applicability to transit and likelihood of implementation. These criteria were ranked with a low, medium or high rating. A summary of the relevant funding sources with the highest ratings are outlined in Exhibits 40 and 41. Summary of Financial Assessment Schedules of possible costs and revenues for each of the three alternatives over a 20-year planning horizon were developed to itemize major categories of expenditures (both capital and operating) and reasonably expected funding sources, as well as anticipated fare revenues. These cash flow projections shown in Exhibits 42, 43, and 44 serve to evaluate the financial feasibility of constructing and operating each alternative. This financial assessment also helps identify matching funds required for federal or state transportation programs. Detailed financial schedules illustrating the anticipated expenditures and amount of federal, state and local funding that can be expected for each alternative can be found in Appendix F. Due to many uncertainties inherent in predicting future funding availability, these schedules reflect many assumptions. The pro forma is intended for conceptual planning purposes only and not for FTA submission as part of the New Starts process. A noteworthy outcome from the financial assessment was the difference in fare or operating revenue as a percentage of total operating funding. For Alternatives 1 and 2 this average ratio from 2016 to 2029 was anticipated at 12% and 8% respectively while for the heavy rail alternative the amount of funding from fares was roughly 43% xxi. As operating costs increase under the enhanced bus alternative, more subsidies will be required to keep the service running. Furthermore, from 2016 to 2029, Alternative 2 is projected to need a total of $32 million in additional operating funds compared to Alternative 1 requiring roughly $9 million. Alternative 3 will require approximately $38 million in operating subsidy over the same 14 year period. Exhibit 42. Operating Expenditures and Fare Revenue Current Bus ($000 s) Exhibit 43. Operating Expenditures and Fare Revenue Enhanced Bus ($000 s) Exhibit 44. Operating Expenditures and Fare Revenue Heavy Rail ($000 s) Exhibit 40. Summary Table of Potential Capital Funding Sources Exhibit 41. Summary Table of Potential Operating Funding Sources 29 30


22 Project Phasing (Heavy Rail) Next Steps C onceptually the implementation of the heavy rail alternative and its two proposed stations on Diagonal Boulevard and the Marina were assumed to be constructed as one project with an opening date of However, due to the major capital costs involved, it may be more realistic for the construction of the subway to be broken into phases as funding becomes available. This may be especially true if non-federal sources of funding are to be utilized requiring the assemblage of several smaller funding sources over time. Other external factors beyond the control of the project sponsor, including economic and political climates, would also affect the timing and availability of funding. As shown in Exhibit 45, design and construction costs were developed in phases to facilitate the building of the subway extension; from Pattison Station to and including the Corporate Center Station (Station 1), and from the Corporate Center Station to and including the Marina Station (Station 2). As development is projected to increase at The Navy Yard, especially around the Marina, and as time elapses from the completion of Phase I to construction of Phase II, acquiring right-of-way and/or alternative methods for tunneling may be necessary, which would significantly increase costs for Phase II of the project. The costs below include additives for engineering (10%) and construction and program management (10%) applied to construction costs but not vehicles. A 20% contingency was applied to the total costs for each alternative. Purchase of new rail vehicles were assumed to occur in the first phase of construction. Exhibit 45. Summary of Estimated Heavy Rail Capital Costs in Phases (2008 Dollars) T he Broad Street Line Extension Feasibility Study has been undertaken to identify the feasibility, cost, and benefits of improved rail and bus transit access to The Navy Yard. A series of next steps would be needed to continue toward implementation of each phase of the recommended alternative. Potential next steps are outlined in this section. Normally for a project with a significant capital cost, such as the extension of the Broad Street Line, the use of federal resources would be preferred. This would require following the steps under the New Starts process with a typical schedule of approximately 6 to 10 years prior to construction. Ideally the federal commitment to the project would include the use of a full funding grant agreement (FFGA) between the Federal Transit Administration and the project sponsor. The FFGA specifies the project timeline, local and federal contributions and project description and is thus dependent on the availability of local funds. Innovative funding mechanisms, such as those considered for the Hudson Yards or NorthPoint projects (as described in the Funding Needs section of the study) could also be pursued as an alternative project financing approach. In these approaches, innovative financing concepts often tie the project financing to the economic performance of the redevelopment area and seeks to capture revenue from existing and future land value. Approaches such as these include leveraging state and local funding with private investment to provide a funding match or to fully fund a project. Without traditional federal funding, the overall implementation timeline could be somewhat shorter compared to the New Starts process due to the streamlining of planning and environmental tasks (as outlined below in the Roadmaps to Implementation ), though the Federal Transit Administration would need to be consulted throughout any development cycle. Furthermore, regardless of whether the project uses federal funds or not, construction and future operations must also comply with pertinent federal rules and regulations, specifically as they relate to mitigation of impacts and station access. Federal funding necessitates adherence with the requirements under the National Environmental Policy Act including coordination and consultation with applicable resource agencies, identification and mitigation of possible adverse environmental impacts, as well as permit coordination. These environmental requirements are often mirrored at the state or local levels. Should the project be financed without the use of federal funds, opportunities could exist to shorten the overall project timeline. Time savings would most likely result from shortened agency review schedules, not from a reduction in the steps necessary to mitigate impacts. The project timeline under this circumstance could be reduced by 1-3 years. Given these two funding approaches, typical steps and actions were developed to assist SEPTA, the City of Philadelphia and PIDC along with other project stakeholders in advancing future transit investment into The Navy Yard. Either implementation schedule will allow opportunities for public involvement and coordination prior to becoming implemented
, required by federal law, is the document which helps direct transportation and land use decisions over a minimum 20 year horizon.")
23 Next Steps Potential Roadmap to Implementation (Federal Funding Approach) Step 1: Ensuring the project is on the fiscally-constrained portion of the regional Long Range Transportation Plan. The Long Range Transportation Plan (LRTP), required by federal law, is the document which helps direct transportation and land use decisions over a minimum 20 year horizon. DVRPC s regional LRTP, Destination 2030 identifies and selects projects based on several criteria. The Broad Street Extension is already included in the fiscally-constrained portion of the regional LRTP and is currently listed as a major regional project under transit new capacity. Action Item: None required. Step 2: Alternatives Analysis (1-2 years). Alternatives Analysis (AA) is the first step of the New Starts project development process. AA is the local forum for evaluating the costs, benefits, and impacts of a range of transportation alternatives designed to address mobility problems and other locally-identified objectives in a defined transportation corridor, and for determining which particular investment strategy should be advanced for more focused study and development. Alternatives Analysis concludes with a locally preferred alternative, or set of alternatives that advance to an Environmental Impact Study or Environmental Assessment. Public involvement is a key factor in the AA process. Action Item: Initiate Alternatives Analysis ( ) Step 3: Ensuring the project is on the regional Transportation Improvement Program (TIP). The TIP represents the translation of recommendations from DVRPC s long-range transportation plan into a short-term program of improvements. The TIP, covering four years, lists all projects for which federal funds are anticipated. The TIP represents the transportation improvement priorities of the region and is required by federal law. Navy Yard transit improvements should become an element of the regional program cycle and placed subsequently on the statewide TIP. Action Item: Work with DVRPC to ensure project is included on regional TIP. ( ) with a Record of Decision. An Environmental Assessment also includes discussion of presumed environmental and other impacts and mitigation strategies but result in a Finding of No Significant Impact (FONSI). As identified above, this phase would follow the Alternatives Analysis. The EIS is normally completed concurrently with Preliminary Engineering. Action Item: Develop EIS or EA ( ) Step 6: SEPTA Capital Budget, Program and Comprehensive Plan. This document serves as a 12-year program and is divided into three segments: the annual element, which lists projects proposed for funding in year one of the capital program; years 2 through 4; and years 5 through 12. The years 5 through 12 provide an overview of projects proposed for programming in future budget years. SEPTA becomes an integral partner to the extension of the Broad Street line as the effort moves forward and would need to incorporate the project into its capital plan. Action Item: Place project on SEPTA Capital Program (2014) Step 7: Final Design (1 to 2 years). Final design represents the last phase of project development and includes right-of-way acquisition, the preparation of final construction plans, utility relocation, and construction cost estimates. During final design, project sponsors may pursue a full funding grant agreement with FTA, which enables FTA to commit to financing the federal share of a project. The full funding grant agreement often serves as a federal financial guarantee which helps project sponsors access local and regional funding. Action Item: Initiate and complete Final Design ( ) Exhibit 46. New Starts Planning and Development Process Potential Roadmap to Implementation (Innovative Funding Approach) Step 1: Ensuring the project is on the fiscally-constrained portion of the regional Long Range Transportation Plan. The Long Range Transportation Plan (LRTP), required by federal law, is the document which helps direct transportation and land use decisions over a minimum 20 year horizon. DVRPC s regional LRTP, Destination 2030 identifies and selects projects based on several criteria. The Broad Street Extension is already included in the fiscally-constrained portion of the regional LRTP and is currently listed as a major regional project under transit new capacity. Action Item: None required. Step 2: Ensuring the project is on the regional Transportation Improvement Program (TIP). The TIP represents the translation of recommendations from DVRPC s long-range transportation plan into a short-term program of improvements. The TIP, covering four years, lists all projects for which federal funds are anticipated. The TIP represents the transportation improvement priorities of the region and is required by federal law. Navy Yard transit improvements should become an element of the regional program cycle and placed subsequently on the statewide TIP. Action Item: Work with DVRPC to ensure project is included on regional TIP. ( ) Step 3: Preliminary Engineering and Environmental Clearance (2-3 years). The purpose of this step is to begin detailing the engineering design and construction costs associated with the project. Any required environmental permits or documentation related to the construction and operations of the capital investment are simultaneously conducted. This includes a list of mitigation measures to address any presumed negative impacts. Action Item: Conduct PE and Environmental Clearance ( ) Exhibit 47. Planning and Development Process Utilizing Innovative Funding Step 4: Preliminary Engineering (2-3 years). Once the Alternatives Analysis is complete and a Locally Preferred Alternative has been selected, project sponsors then request approval from FTA to enter into Preliminary Engineering. Action Item: PE to follow conclusion of AA and permission from FTA ( ) Step 5: Environmental Impact Statement or Environmental Assessment (2-3 years). The purpose of an EIS is to identify the potential environmental and other relevant impacts related to the construction and operation of the capital investment. The EIS also includes a list of mitigation measures to address any presumed negative impacts and concludes Step 4: SEPTA Capital Budget, Program and Comprehensive Plan. This document serves as a 12-year program and is divided into three segments: the annual element, which lists projects proposed for funding in year one of the capital program; years 2 through 4; and years 5 through 12. The years 5 through 12 provide an overview of projects proposed for programming in future budget years. SEPTA becomes an integral partner to the extension of the Broad Street line as the effort moves forward and would need to incorporate the project into its capital plan. Action Item: Place project on SEPTA Capital Program (2013) Step 5: Final Design (1 to 2 years). Final design represents the last phase of project development and includes right-of-way acquisition, the preparation of final construction plans, utility relocation, and construction cost estimates. Action Item: Initiate and complete Final Design ( ) 33 34


24 END NOTES i Engineering Feasibility Study of South Broad Street Subway Extension (1966). H.A.Kulijian and De-Leuw, Cather. ii A review of journal articles, research papers, and agency reports in the last fifteen years was conducted by the consultant team concentrating on rail transit systems in various cities in the United States. iii These figures do not include any employment at the Shipyard and Girard Point areas. iv These figures do not include any employment at the Shipyard and Girard Point areas. v Light rail transit is a flexible mode of transit and can operate in exclusive rights-of-way, beside or in the median of wide urban and suburban streets. Light rail trains are made up of one to four electrically-powered rail vehicles, usually but not always articulated, that are driven by a single operator in the lead car. vi 0.5 miles represents the maximum walking distance most transit users will incur to and from a heavy rail station. xiv Not including approximately 15% requirement for spare train cars. xv Average speed combines cruising speed, acceleration and deceleration time, stop dwell time, and traffic signal time. xvi It is assumed that the Broad Street Line extension is 1.5 miles one-way. xvii It is assumed that SEPTA will continue to operate 5-car trains on the SEPTA local service on the Broad Street Line as it does currently. xviii Fully Allocated O&M Costs (2008 Dollars). xix Fully Allocated O&M Costs (2008 Dollars). xx Does not include vehicle replacements after xxi As a comparison, according to SEPTA s 2007 Annual Service Plan the Broad Street Subway Line recovered around 55% of their operating expenses through passenger revenues. vii Current mode share of 4% was derived from SEPTA s Route 71 average daily boardings (2007 counts) and current employment at The Navy Yard including the shipyard area. For comparison, the 2008 Navy Yard Transportation and Commuter Survey showed that roughly 8% of employees stated they take transit. Industry research on transportation and land use relationships indicate 2-3% bus ridership is typical for developments similar to that anticipated at The Navy Yard. viii Boardings include AM and PM peaks in both directions at The Navy Yard only, not including Pattison station. ix From SEPTA s Fiscal 2007 Annual Service Plan. x From SEPTA s Fiscal 2007 Annual Service Plan. xi Boardings include AM and PM peaks in both directions. xii Selected stations are within more than 0.4 miles of each other, are not Central Business District stations and have similar characteristics to the proposed stations. xiii Not including approximately 15% requirement for spare buses. 35
Executive Summary. Treasure Valley High Capacity Transit Study Priority Corridor Phase 1 Alternatives Analysis October 13, 2009.
 Treasure Valley High Capacity Transit Study Priority Corridor Phase 1 Alternatives Analysis October 13, 2009 Background As the Treasure Valley continues to grow, high-quality transportation connections
Policy Note. Vanpools in the Puget Sound Region The case for expanding vanpool programs to move the most people for the least cost.
 Policy Note Vanpools in the Puget Sound Region The case for expanding vanpool programs to move the most people for the least cost Recommendations 1. Saturate vanpool market before expanding other intercity
4.0 TIER 2 ALTERNATIVES
 4.0 TIER 2 ALTERNATIVES The Tier 2 Alternatives represent the highest performing Tier 1 Alternatives. The purpose of the Tier 2 Screening was to identify the LPA utilizing a more robust list of evaluation
FREQUENTLY ASKED QUESTIONS
 FREQUENTLY ASKED QUESTIONS 2018 What is the More MARTA Atlanta program? The More MARTA Atlanta program is a collaborative partnership between MARTA and the City of Atlanta to develop and implement a program
CEDAR AVENUE TRANSITWAY Implementation Plan Update
 CEDAR AVENUE TRANSITWAY Implementation Plan Update EECUTIVE SUMMARY DECEMBER 2015 Executive Summary In 2013, the Twin Cities metropolitan area s first bus rapid transit (BRT) line, the METRO Red Line,
BROWARD BOULEVARD CORRIDOR TRANSIT STUDY
 BROWARD BOULEVARD CORRIDOR TRANSIT STUDY FM # 42802411201 EXECUTIVE SUMMARY July 2012 GOBROWARD Broward Boulevard Corridor Transit Study FM # 42802411201 Executive Summary Prepared For: Ms. Khalilah Ffrench,
Executive Summary October 2013
 Executive Summary October 2013 Table of Contents Introduction... 1 Rider Transit and Regional Connectivity... 1 Plan Overview... 2 Network Overview... 2 Outreach... 3 Rider Performance... 4 Findings...
The Case for. Business. investment. in Public Transportation
 The Case for Business investment in Public Transportation Introduction Public transportation is an enterprise with expenditure of $55 billion in the United States. There has been a steady growth trend
TORONTO TRANSIT COMMISSION REPORT NO.
 Form Revised: February 2005 TORONTO TRANSIT COMMISSION REPORT NO. MEETING DATE: October 24, 2012 SUBJECT: DOWNTOWN RAPID TRANSIT EXPANSION STUDY (DRTES) PHASE 1 STRATEGIC PLAN ACTION ITEM RECOMMENDATIONS
Public Meeting. City of Chicago Department of Transportation & Department of Housing and Economic Development
 Public Meeting City of Chicago Department of Transportation & Department of Housing and Economic Development Funded by Regional Transportation Authority September 12, 2011 In partnership with Presentation
5. OPPORTUNITIES AND NEXT STEPS
 5. OPPORTUNITIES AND NEXT STEPS When the METRO Green Line LRT begins operating in mid-2014, a strong emphasis will be placed on providing frequent connecting bus service with Green Line trains. Bus hours
Vanpooling and Transit Agencies. Module 3: Benefits to Incorporating Vanpools. into a Transit Agency s Services
 Vanpooling and Transit Agencies Module 3: Benefits to Incorporating Vanpools into a Transit Agency s Services A common theme we heard among the reasons why the transit agencies described in Module 2 began
Feasibility Study. Community Meeting March, North-South Commuter Rail Feasibility Study
 Feasibility Study Community Meeting March, 2017 1 Agenda 1. Welcome / Introductions 2. Background / Meeting Purpose 3. Progress to Date Options Evaluated Capital/Operating Costs Ridership 4. Financial
Waco Rapid Transit Corridor (RTC) Feasibility Study
 Feasibility Study") Waco Rapid Transit Corridor (RTC) Feasibility Study Chris Evilia, Director of Waco Metropolitan Planning Organization Allen Hunter, General Manager Waco Transit System Jimi Mitchell, Project Manager AECOM
Waco Rapid Transit Corridor (RTC) Feasibility Study Chris Evilia, Director of Waco Metropolitan Planning Organization Allen Hunter, General Manager Waco Transit System Jimi Mitchell, Project Manager AECOM
Downtown Lee s Summit Parking Study
 Downtown Lee s Summit Parking Study As part of the Downtown Lee s Summit Master Plan, a downtown parking and traffic study was completed by TranSystems Corporation in November 2003. The parking analysis
Charlotte-Mecklenburg Region Rapid Transit and Land-Use Integration
 Charlotte-Mecklenburg Region Rapid Transit and Land-Use Integration Legislative Committee on Urban Growth and Infrastructure Carolyn Flowers CEO Charlotte Area Transit System March 23, 2010 Charlotte Region
UTA Transportation Equity Study and Staff Analysis. Board Workshop January 6, 2018
 UTA Transportation Equity Study and Staff Analysis Board Workshop January 6, 2018 1 Executive Summary UTA ranks DART 6 th out of top 20 Transit Agencies in the country for ridership. UTA Study confirms
Funding Scenario Descriptions & Performance
 Funding Scenario Descriptions & Performance These scenarios were developed based on direction set by the Task Force at previous meetings. They represent approaches for funding to further Task Force discussion
Needs and Community Characteristics
 Needs and Community Characteristics Anticipate Population and Job Growth in the City Strongest density of population and jobs in Ann Arbor are within the Study Area Population expected to grow 8.4% by
AMTRAK ENVISIONS WORLD CLASS HIGH-SPEED RAIL Washington to Boston in about three hours at up to 220 mph (354 kph)
") FOR IMMEDIATE RELEASE September 28, 2010 ATK-10-130a Contact: Media Relations 202 906.3860 AMTRAK ENVISIONS WORLD CLASS HIGH-SPEED RAIL Washington to Boston in about three hours at up to 220 mph (354 kph)
FOR IMMEDIATE RELEASE September 28, 2010 ATK-10-130a Contact: Media Relations 202 906.3860 AMTRAK ENVISIONS WORLD CLASS HIGH-SPEED RAIL Washington to Boston in about three hours at up to 220 mph (354 kph)
The Boston South Station HSIPR Expansion Project Cost-Benefit Analysis. High Speed Intercity Passenger Rail Technical Appendix
 The Boston South Station HSIPR Expansion Project Cost-Benefit Analysis High Speed Intercity Passenger Rail Technical Appendix Prepared by HDR August 5, 2010 The Boston South Station HSIPR Expansion Project
Bi-County Transitway/ Bethesda Station Access Demand Analysis
 Bi-County Transitway/ Bethesda Station Access Demand Analysis Prepared for: Washington Metropolitan Area Transit Authority Office of Planning and Project Development May 2005 Prepared by: in conjunction
Restoration of Historic Streetcar Services in Downtown Los Angeles
 Restoration of Historic Streetcar Services in Downtown Los Angeles Early Scoping Meeting for Alternatives Analysis (AA) May 17, 2011 Introduction Key players Local lead agency: Metro Federal lead agency:
West Broadway Transit Study. Community Advisory Committee September 17, 2015
 West Broadway Transit Study Community Advisory Committee September 17, 2015 Introductions Community Engagement Summer Outreach Fall Outreach Technical Analysis Process Update Alternatives Review Economic
Executive Summary. Draft Environmental Impact Statement/Environmental Impact Report ES-1
 Executive Summary Introduction The Eastside Transit Corridor Phase 2 Project is a vital public transit infrastructure investment that would provide a transit connection to the existing Metro Gold Line
Submission to Greater Cambridge City Deal
 What Transport for Cambridge? 2 1 Submission to Greater Cambridge City Deal By Professor Marcial Echenique OBE ScD RIBA RTPI and Jonathan Barker Introduction Cambridge Futures was founded in 1997 as a
Car Sharing at a. with great results.
 Car Sharing at a Denver tweaks its parking system with great results. By Robert Ferrin L aunched earlier this year, Denver s car sharing program is a fee-based service that provides a shared vehicle fleet
The Preferred Alternative: a Vision for Growth on the Northeast Corridor
 A Long-Term Vision is Needed The Preferred Alternative: a Vision for Growth on the Northeast Corridor The Federal Railroad Administration (FRA) has released the Tier 1 Final Environmental Impact Statement
Draft Results and Recommendations
 Waco Rapid Transit Corridor (RTC) Feasibility Study Draft Results and Recommendations Chris Evilia, Director of Waco Metropolitan Planning Organization Allen Hunter, General Manager Waco Transit System
COMMUNITY REPORT FISCAL YEAR We are making progress, are you on board? GOLD COAST TRANSIT DISTRICT
 FISCAL YEAR 178 GOLD COAST TRANSIT DISTRICT COMMUNITY REPORT We are making progress, are you on board? OJAI OXNARD PORT HUENEME VENTURA COUNTY OF VENTURA GENERAL MANAGER S MESSAGE STEVEN P. BROWN DEAR
BCA Benefits and Assumptions Summary
 2016 TIGER Application - Plymouth Multimodal BCA Benefits and Assumptions Summary The Plymouth Multimodal generates a variety of benefits, ranging from monetary such as increased transit fare revenue,
Aren t You Really a Mobility Agency? Why The Vanpool Works for Transit
 Aren t You Really a Mobility Agency? Why The Vanpool Works for Transit Presenter: Kevin Coggin, Coast Transit Authority, Gulfport, MS Presenter: Lyn Hellegaard, Missoula Ravalli TMA, Missoula, MT Moderator:
US 29 Bus Rapid Transit Planning Board Briefing. February 16, 2017
 US 29 Bus Rapid Transit Planning Board Briefing February 16, 2017 Project Goals Improve the quality of transit service Improve mobility opportunities and choices Enhance quality of life Support master
Draft Results and Open House
 Waco Rapid Transit Corridor (RTC) Feasibility Study Draft Results and Open House Chris Evilia, Director of Waco Metropolitan Planning Organization Allen Hunter, General Manager Waco Transit System Jimi
PEACHTREE CORRIDOR PARTNERSHIP. Current Status & Next Steps
 PEACHTREE CORRIDOR PARTNERSHIP Current Status & Next Steps PEACHTREE CORRIDOR PARTNERSHIP Why Peachtree? Why Now? I. THE CONTEXT High Level View of Phasing Discussion Potential Ridership Segment 3 Ease
STRATEGIC PRIORITIES AND POLICY COMMITTEE MAY 5, 2016
 STRATEGIC PRIORITIES AND POLICY COMMITTEE MAY 5, 2016 Shift Rapid Transit Initiative Largest infrastructure project in the city s history. Rapid Transit initiative will transform London s public transit
4 COSTS AND OPERATIONS
 4 COSTS AND OPERATIONS 4.1 INTRODUCTION This chapter summarizes the estimated capital and operations and maintenance (O&M) costs for the Modal and High-Speed Train (HST) Alternatives evaluated in this
CITY OF LONDON STRATEGIC MULTI-YEAR BUDGET ADDITIONAL INVESTMENTS BUSINESS CASE # 6
 2016 2019 CITY OF LONDON STRATEGIC MULTI-YEAR BUDGET ADDITIONAL INVESTMENTS BUSINESS CASE # 6 STRATEGIC AREA OF FOCUS: SUB-PRIORITY: STRATEGY: INITIATIVE: INITIATIVE LEAD(S): BUILDING A SUSTAINABLE CITY
6/6/2018. June 7, Item #1 CITIZENS PARTICIPATION
 June 7, 2018 Item #1 CITIZENS PARTICIPATION 1 Item #2 APPROVAL OF MINUTES Item #3 TRAC GOALS, FRAMEWORK & AGENDA REVIEW 2 COMMITTEE GOALS Learn about Southern Nevada s mobility challenges, new developments
Downtown Transit Connector. Making Transit Work for Rhode Island
 Downtown Transit Connector Making Transit Work for Rhode Island 3.17.17 Project Evolution Transit 2020 (Stakeholders identify need for better transit) Providence Core Connector Study (Streetcar project
Washington State Road Usage Charge Assessment
 Washington State Road Usage Charge Assessment Jeff Doyle Director of Public/Private Partnerships; and State Project Director Road User Charge Assessment August 15, 2013 Tallahassee, Florida Similarities
Parking Management Element
 Parking Management Element The State Transportation Planning Rule, adopted in 1991, requires that the Metropolitan Planning Organization (MPO) area implement, through its member jurisdictions, a parking
Merger of the generator interconnection processes of Valley Electric and the ISO;
 California Independent System Operator Corporation Memorandum To: ISO Board of Governors From: Karen Edson Vice President, Policy & Client Services Date: August 18, 2011 Re: Decision on Valley Electric
Appendix C. Parking Strategies
 Appendix C. Parking Strategies Bremerton Parking Study Introduction & Project Scope Community concerns regarding parking impacts in Downtown Bremerton and the surrounding residential areas have existed
CITY OF ANN ARBOR, MICHIGAN 301 E. Huron St., P.O. Box 8647 Ann Arbor, Michigan
 Date: Wednesday, June 24, 2014 Location: Ann Arbor District Library Attendees: 40 citizen attendees Ann Arbor Station Environmental Review Public Meeting Meeting Notes Meeting #2 The second public meeting
Tempe Streetcar. March 2, 2016
 Tempe Streetcar March 2, 2016 Tempe Profile 40 sq. miles, highest density in state University Town, center of region Imposed growth boundaries (density increase) Mixed use growth/intensifying land use
US 81 Bypass of Chickasha Environmental Assessment Public Meeting
 US 81 Bypass of Chickasha Environmental Assessment Public Meeting March 14, 2013 Introductions ODOT FHWA SAIC Meeting Purpose Present need for bypass Provide responses to 10/04/11 public meeting comments
CORE AREA SPECIFIC PLAN
 only four (A, B, D, and F) extend past Eighth Street to the north, and only Richards Boulevard leaves the Core Area to the south. This street pattern, compounded by the fact that Richards Boulevard is
Location Concept Plan Amendment Recommendation Approved 2011 Concept Plan
 Valley Line West LRT Concept Plan Recommended Amendments Lewis Farms LRT Terminus Site Location Concept Plan Amendment Recommendation Approved 2011 Concept Plan Lewis Farms LRT terminus site, 87 Avenue/West
ANDERSON PROPERTY SITE ANALYSIS
 ANDERSON PROPERTY SITE ANALYSIS Introduction The Montgomery County Department of Transportation (MCDOT) initiated a feasibility study in the fall of 2012 to evaluate the need for transit service expansion
Rapid Transit and Land-Use Integration a Reality
 City of Charlotte Rapid Transit and Land-Use Integration a Reality Transportation Oversight Committee Carolyn Flowers CEO Charlotte Area Transit System April 29, 2010 Charlotte Region Statistics Mecklenburg
Metro Reimagined. Project Overview October 2017
 Metro Reimagined Project Overview October 2017 Reimagining Metro Transit Continuing our Commitment to: Provide mobility based on existing and future needs Value the role of personal mobility in the quality
Office of Transportation Bureau of Traffic Management Downtown Parking Meter District Rate Report
 Office of Transportation Bureau of Traffic Management 1997 Downtown Parking Meter District Rate Report Introduction The City operates approximately 5,600 parking meters in the core area of downtown. 1
Leadership NC. November 8, 2018
 v Leadership NC November 8, 2018 Planning for our region s growth The Triangle is one of the fastestgrowing regions in the nation. More than 2 million people are already part of the equation, and the
Green Line LRT: Beltline Segment Update April 19, 2017
 Green Line LRT: Beltline Segment Update April 19, 2017 Quick Facts On April 11, 2017, City Council approved Administration s recommendation for the Green Line to be underground in the Beltline from 2 Street
Paid Parking at Park & Ride Lots: Framing the Issues. Capital Programs Committee May 2014
 Paid Parking at Park & Ride Lots: Framing the Issues Capital Programs Committee May 2014 Outline Current Status Industry Review DART Case Study Issues Alternatives Mechanics 2 Current Status: All Lots
Central City Line Locally Preferred Alternative (LPA) Amendment Public Hearing. July 24, 2014
 Amendment Public Hearing. July 24, 2014") Central City Line Locally Preferred Alternative (LPA) Amendment Public Hearing July 24, 2014 Project Description The Central City Line is a High Performance Transit project that will extend from Browne
Central City Line Locally Preferred Alternative (LPA) Amendment Public Hearing July 24, 2014 Project Description The Central City Line is a High Performance Transit project that will extend from Browne
The Engineering Department recommends Council receive this report for information.
 CORPORATE REPORT NO: R161 COUNCIL DATE: July 23, 2018 REGULAR COUNCIL TO: Mayor & Council DATE: July 19, 2018 FROM: General Manager, Engineering FILE: 8740-01 SUBJECT: Surrey Long-Range Rapid Transit Vision
Strategic Plan
 2005-2015 Strategic Plan SUMMARY OF THE REVISED PLAN IN 2011 A decade focused on developing mass transit in the Outaouais A updated vision of mass transit in the region The STO is embracing the future
The capital cost estimates do not include allowances for: ROW acquisition. Third-party mitigation works. Hazardous materials handling.
 Mode Selection Report 7 Cost Evaluation The cost evaluation criteria used in the evaluation of the transit modes are: Capital cost. operating costs. Fare revenue. Net cost per passenger/passenger-mile.
DRAFT Evaluation Scores. Transit
 DRAFT Evaluation s The criteria for evaluating applications for new funding commitments are used to measure how well they advance the six goals identified for the MTP. Through transportation: Reduce per
FINAL. Sound Transit Long-Range Plan Update. Issue Paper S.1: Tacoma Link Integration with Central Link. Prepared for: Sound Transit
 Sound Transit Long-Range Plan Update Issue Paper S.1: Tacoma Link Integration with Central Link Prepared for: Sound Transit Prepared by: Quade & Douglas, Inc. FINAL March 2005 Foreword This issue paper
3.17 Energy Resources
 3.17 Energy Resources 3.17.1 Introduction This section characterizes energy resources, usage associated with the proposed Expo Phase 2 project, and the net energy demand associated with changes to the
Table 8-1: Service Frequencies for All Short-List Alternatives by Day of Week and Time of Day Frequency Day of Week Time of Day Time Period
 8. Operating Plans The following Section presents the operating plans for the Short-List Alternatives. The modern streetcar operating plans are presented for Alternatives 2 and 3, followed by bus rapid
Michigan/Grand River Avenue Transportation Study TECHNICAL MEMORANDUM #18 PROJECTED CARBON DIOXIDE (CO 2 ) EMISSIONS
 EMISSIONS") TECHNICAL MEMORANDUM #18 PROJECTED CARBON DIOXIDE (CO 2 ) EMISSIONS Michigan / Grand River Avenue TECHNICAL MEMORANDUM #18 From: URS Consultant Team To: CATA Project Staff and Technical Committee Topic:
TECHNICAL MEMORANDUM #18 PROJECTED CARBON DIOXIDE (CO 2 ) EMISSIONS Michigan / Grand River Avenue TECHNICAL MEMORANDUM #18 From: URS Consultant Team To: CATA Project Staff and Technical Committee Topic:
Green Line LRT: Beltline Recommendation Frequently Asked Questions
 Green Line LRT: Beltline Recommendation Frequently Asked Questions June 2017 Quick Facts Administration has evaluated several alignment options that would connect the Green Line in the Beltline to Victoria
TRAVEL DEMAND FORECASTS
 Jiangxi Ji an Sustainable Urban Transport Project (RRP PRC 45022) TRAVEL DEMAND FORECASTS A. Introduction 1. The purpose of the travel demand forecasts is to assess the impact of the project components
appendix 4: Parking Management Study, Phase II
 appendix 4: Parking Management Study, Phase II A4-1 A4-2 Eastlake Parking Management Study Final Phase 2 Report Future Parking Demand & Supply January 6, 2017 Submitted by Denver Corp Center III 7900 E.
Green Line Long-Term Investments
 Enhancements Short-term improvements to keep Austin moving. Investments Long-term projects to support our future. Mobility Hubs MetroRapid MetroRail MetroExpress Connectors Circulators Project Connect
vision42
 vision42 www.vision42.org vision42 auto-free light rail boulevard for 42nd Street Roxanne Warren, AIA, Chair George Haikalis, ASCE, Co-Chair Institute for Rational Urban Mobility,Inc. www.vision42.org
INFRASTRUCTURE RENEWAL FOR THE NEXT GENERATION PATCO High Speed Line Power Infrastructure Renewal
 PATCO High Speed Line Power Infrastructure Renewal Page 1 of 5 INFRASTRUCTURE RENEWAL FOR THE NEXT GENERATION PATCO High Speed Line Power Infrastructure Renewal This Engineering Excellence Award entry
Parks and Transportation System Development Charge Methodology
 City of Sandy Parks and Transportation System Development Charge Methodology March, 2016 Background In order to implement a City Council goal the City of Sandy engaged FCS Group in January of 2015 to update
King County Metro. Columbia Street Transit Priority Improvements Alternative Analysis. Downtown Southend Transit Study. May 2014.
 King County Metro Columbia Street Transit Priority Improvements Alternative Analysis Downtown Southend Transit Study May 2014 Parametrix Table of Contents Introduction... 1 Methodology... 1 Study Area...
Capital Needs Assessment Riders Advisory Council July2, 2008
 Capital Needs Assessment 2011-2020 Riders Advisory Council July2, 2008 1 Outline I. Capital Improvement Plan History II. Capital Improvement Plan Update III. Capital Needs Assessment State of Good Repair
EUGENE-SPRINGFIELD, OREGON EAST WEST PILOT BRT LANE TRANSIT DISTRICT
 EUGENE-SPRINGFIELD, OREGON EAST WEST PILOT BRT LANE TRANSIT DISTRICT (BRIEF) Table of Contents EUGENE-SPRINGFIELD, OREGON (USA)... 1 COUNTY CONTEXT AND SYSTEM DESCRIPTION... 1 SYSTEM OVERVIEW... 1 PLANNING
Operating & Maintenance Cost Results Report
 Operating & Maintenance Cost Results Report Prepared for: Hennepin County Regional Railroad Authority Prepared by: Connetics Transportation Group Under Contract To: Kimley-Horn and Associates FINAL June
EXECUTIVE SUMMARY. Introduction
 EXECUTIVE SUMMARY Introduction The purpose of this study is to ensure that the Village, in cooperation and coordination with the Downtown Management Corporation (DMC), is using best practices as they plan
Yukon Resource Gateway Project
 Yukon Resource Gateway Project Summary Application for National Infrastructure Component Funding January 2016 Introduction The Government of Yukon is seeking endorsement of the Yukon Resource Gateway
METRO Orange Line BRT American Boulevard Station Options
 METRO Orange Line BRT American Boulevard Station Options Bloomington City Council Work Session November 18, 2013 Christina Morrison BRT/Small Starts Project Office Coordinating Planning and Design AMERICAN
RE: Comments on Proposed Mitigation Plan for the Volkswagen Environmental Mitigation Trust
 May 24, 2018 Oklahoma Department of Environmental Quality Air Quality Division P.O. Box 1677 Oklahoma City, OK 73101-1677 RE: Comments on Proposed Mitigation Plan for the Volkswagen Environmental Mitigation
Improving Accessibility of Regional Bus Stops and Pathways
 Customer Service and Operations Committee Board Information Item III-A March 13, 2014 Improving Accessibility of Regional Bus Stops and Pathways Page 3 of 17 Washington Metropolitan Area Transit Authority
Address Land Use Approximate GSF
 M E M O R A N D U M To: Kara Brewton, From: Nelson\Nygaard Date: March 26, 2014 Subject: Brookline Place Shared Parking Analysis- Final Memo This memorandum presents a comparative analysis of expected
REPORT CARD FOR CALIFORNIA S INFRASTRUCTURE WHAT YOU SHOULD KNOW ABOUT CALIFORNIA S TRANSIT FACILITIES
 TRANSIT GRADE: C- WHAT YOU SHOULD KNOW ABOUT TRANSIT FACILITIES California needs robust, flexible and reliable transit systems to reduce peak congestion on our highways, provide options for citizens who
Executive Summary EXECUTIVE SUMMARY Parking Issues Trenton Downtown Parking Policy and Sidewalk Design Standards E.S. Page 1 Final Report 2008
 EXECUTIVE SUMMARY A walkable environment that accommodates market demand while minimizing the negative impacts of growth is an important element in promoting the City s downtown revitalization. There are
TRANSIT FEASIBILITY STUDY Town of Bradford West Gwillimbury
 TRANSIT FEASIBILITY STUDY Town of Bradford West Gwillimbury Open House Presentation January 19, 2012 Study Objectives Quantify the need for transit service in BWG Determine transit service priorities based
Transit Fares for Multi-modal Transportation Systems
 Transit Fares for Multi-modal Transportation Systems Dr. Jeffrey M. Casello Associate Professor School of Planning Department of Civil and Environmental Engineering University of Waterloo Transport Futures
Proposed Program of Interrelated Projects
 DALLAS AREA RAPID TRANSIT Proposed Program of Interrelated Projects Federal Transit Administration Capital Investment Program Summer 204 INTRODUCTION The current federal transportation bill, Moving Ahead
CITY OF OMAHA OMAHA, NEBRASKA
 DOWNTOWN PARKING NEEDS ASSESSMENT UPDATE CITY OF OMAHA OMAHA, NEBRASKA Prepared for: City of Omaha Parking Division October 15, 2014 FINAL REPORT TABLE OF CONTENTS EXECUTIVE SUMMARY... 1 Study Purpose...
Click to edit Master title style
 Nelson/Nygaard Consulting Associates SERVICE IMPROVEMENT STRATEGIES September 22, 2015 1 PROJECT OVERVIEW & WORK TO DATE 1. Extensive stakeholder involvement Throughout 2. System and market assessment
Energy Technical Memorandum
 Southeast Extension Project Lincoln Station to RidgeGate Parkway Prepared for: Federal Transit Administration Prepared by: Denver Regional Transportation District May 2014 Table of Contents Page No. Chapter
CITY OF ANN ARBOR, MICHIGAN 301 E. Huron St., P.O. Box 8647 Ann Arbor, Michigan
 Date: Wednesday, June 18, 2014 Location: Ann Arbor District Library Attendees: 14 citizen attendees Ann Arbor Station Environmental Review Citizen Working Group Meeting Notes Meeting #3 The third meeting
UNION STATION MASTER PLAN STUDY
 UNION STATION MASTER PLAN STUDY The Chicago Department of Transportation has begun a comprehensive study of issues related to Chicago s Union Station, the Union Station Master Plan. Opened in 1925, Union
Decision on Merced Irrigation District Transition Agreement
 California Independent System Operator Corporation Memorandum To: ISO Board of Governors From: Karen Edson, Vice President Policy & Client Services Date: March 13, 2013 Re: Decision on Merced Irrigation
Commuter Transit Service Feasibility
 Commuter Transit Service Feasibility West Michigan Transit Linkages Study Submitted to: Ottawa County, Michigan Submitted by: MP2PLANNING, LLC AUGUST 2012 Table of Contents 1. Introduction... 2 2. Overall
KANSAS CITY STREETCAR
 KANSAS CITY STREETCAR KAREN CLAWSON MID-AMERICA REGIONAL COUNCIL KANSAS CITY STREETCAR Regional Context Alternatives Analysis Kansas City Streetcar Project KANSAS CITY REGION KANSAS CITY REGION KANSAS
EXECUTIVE SUMMARY. The following is an outline of the traffic analysis performed by Hales Engineering for the traffic conditions of this project.
 EXECUTIVE SUMMARY This study addresses the traffic impacts associated with the proposed Shopko redevelopment located in Sugarhouse, Utah. The Shopko redevelopment project is located between 1300 East and
IV. ENVIRONMENTAL IMPACT ANALYSIS K.2. PARKING
 IV. ENVIRONMENTAL IMPACT ANALYSIS K.2. PARKING ENVIRONMENTAL SETTING The following analysis summarizes the findings and conclusions of the Traffic Analysis (Traffic Study), prepared by The Mobility Group,
Service Quality: Higher Ridership: Very Affordable: Image:
 Over the past decade, much attention has been placed on the development of Bus Rapid Transit (BRT) systems. These systems provide rail-like service, but with buses, and are typically less expensive to
Kenosha-Racine-Milwaukee (KRM)
") Kenosha-Racine-Milwaukee (KRM) Commuter Rail #147925 November 6, 2009 1 Guidance of KRM Commuter Rail Studies Intergovernmental Partnership Technical Steering Committee Temporary and Limited Authority
Kenosha-Racine-Milwaukee (KRM) Commuter Rail #147925 November 6, 2009 1 Guidance of KRM Commuter Rail Studies Intergovernmental Partnership Technical Steering Committee Temporary and Limited Authority
Point A Point B Point C Point D. Fulton County Board of Commissioners and Mayors Meeting December 14, 2017
 Fulton County Board of Commissioners and Mayors Meeting December 14, 2017 Master Plan Overview Phase 1 Community Vision and Existing Transit Conditions Phase 2 Scenario Development Phase 3 Transit Master