Documentation of the Budapest workshop
|
|
|
- Cuthbert Pope
- 6 years ago
- Views:
Transcription
1 Documentation of the Budapest workshop November 2010 Encouraging more use of public transport Intermodality and Park & Ride
2
3 Preface This documentation aims to present a summary of the Budapest workshop, including the presentations, discussions, interactive actions and also the site visit. All presentations are available on the partner platform of the CATCH-MR website. Catch-MR (Cooperative approaches to transport challenges in Metropolitan Regions) is an INTERREG IVC project running from January 2010 until December 2012 with a total budget of Euro 2 million. The participants in CATCH-MR will explore and adapt sustainable transport solutions for metropolises and their surrounding regions. 12 partners take part in the project, representing 7 Metropolitan Regions (MR): Oslo/Akershus (NO), The Göteborg Region Association of Local Authorities (SE), Capital Region Berlin-Brandenburg (DE), Metropolitan Region Vienna (AT), Ljubljana Urban Region (SI), Central Hungary (HU) and Provincia di Roma (IT). 3
4
5 Contents Preface... 3 Contents... 5 Welcome... 7 Welcome by BKK (Centre for Budapest Transport)... 7 Introduction to the mobility situation in Budapest... 8 Intermodality and Park & Ride in Budapest Plenary discussion Park & Ride Presentation of good practices (Oslo-Akershus) Plenary discussion Group discussion Intermodality Interactive action I Plenary discussion Göteborg presentation on intermodality Plenary discussion Site visit Transport associations Presentation of good practices Vienna-Lower Austria (VOR) Presentation of good practices Berlin-Brandenburg (VBB) Presentation of the situation in Budapest (BKSZ) Plenary discussion Railways as a part of urban mobility Presentation: railways in Budapest Presentation of good practices (Rome-Province of Rome) Discussion Public transport service in different areas
6 Interactive action II Plenary discussion Summary session Next steps Outlook to workshop in Oslo Annex List of participants Site Visit
. Mr. Tosics also welcomed the participants and gave the floor to Mr. Dávid Vitézy, CEO of the newly established BKK (Centre for Budapest Transport).")
7 Welcome On behalf of the partner group from Budapest, Ms. Veronika Szemere welcomed the participants and presented the moderator of the workshop, Mr. Iván Tosics (Metropolitan Research Institute). Mr. Tosics also welcomed the participants and gave the floor to Mr. Dávid Vitézy, CEO of the newly established BKK (Centre for Budapest Transport). Welcome by BKK (Centre for Budapest Transport) Mr. Dávid Vitézy, CEO of the newly established BKK (Centre for Budapest Transport) opened the workshop. He also presented the new organisational structure of the Budapest transport system, where the newly established BKK will be a key player. The example is Transport for London (TfL). Up to now there have been many stakeholders in the Budapest transport system (City of Budapest, FKF, Parking Kft., BKV, Taxi Kft. they had no intention to work together) without clear leadership, real owner and public procurer supervision. The organisational structure has been basically unchanged since 1968, the establishment of the public transport company BKV, and totally the same since In the meanwhile the situation changed drastically: number of cars per 1000 inhabitants rose from 70 to over 350; modal share of PT decreased from 80 % to 60% within the city and from 50 % to around 30% in the FUA. There is no real authority overseeing the public transport operator BKV. The operator plans the services and schedules, delivers them and supervises itself. Unaffordable dream projects are absorbing all money and attention due to the wrong priorities. BKK is to become an integrated transport authority for transport management (not only for the administrative territory of Budapest and not only for public transport). Its competences include planning, management and supervision of the transport system, namely public transport, roads, parking and taxis. It is to develop a real transport strategy for Budapest along with regional cooperation. Public transport, road management and maintenance, parking, and central transport information system are all its responsibility. 7
, BKV Zrt. (local metro, tram, trolleybus and suburban railway operator), BKK Közúti parkolási Zrt. (roads, parking), BKSZ Kft. (regional coordination) and BKK Tervező Kft.")

8 BKK plans to introduce road charging which is needed and also urged by the European Commission to finance the metro 4 project. BKK will be in hierarchy above the following actors: BKV Busz Zrt. (local bus operator), BKV Zrt. (local metro, tram, trolleybus and suburban railway operator), BKK Közúti parkolási Zrt. (roads, parking), BKSZ Kft. (regional coordination) and BKK Tervező Kft. (infrastructure planning, investments). The aim of the BKK is to have integrated, holistic system approach, efficient and accountable institutional framework, real supervision and monitoring system, centralised transport information and budget system, carefully planned, prepared and managed EU projects based on long-term strategy. Introduction to the mobility situation in Budapest The mobility situation in Budapest was presented by Mr. László Kerényi, Head of Department of Transport Coordination at BKK, former Head of Transport Department at the Municipality of Budapest (and as such known by most CATCH-MR partners). He gave a brief introduction to the background of the transport system: the institutional system in Budapest and in the region, motorisation and public transport service trends (increasing car ownership and usage, decreasing public transport capacity and ridership), as well as some statistics on the mobility situation. The modal split in Budapest is still very good (around 60:40% for public transport in the city), but decreasing constantly. The infrastructure is characterised by missing links and a shortage of Danube bridges: the existing bridges are very condensed, located within only 9 kilometres, followed by holes in the north and in the south until the M0 motorway ring bridges. For this reason 8

9 everyone comes to the central area of the city to cross the Danube. The public transport system is characterised by a dense network, an ageing running fleet of 3000 vehicles, decreasing passenger numbers and a low level of intermodality. Local public transport (the metro network is only 31,4 km) is operated by BKV, while railways are operated by the national railway company MÁV, and regional buses by Volánbusz. Mr. Kerényi also mentioned the specialities of Budapest s transport: funicular, cogwheel rail, children s rail and chair lift. The strategic goals include the following: - preserving the 60% modal split, trying to stimulate people to change mode; - stop suburbanization and create a healthier city by traffic calming and promotion of alternative transport modes in the city centre and residential areas (walking and cycling); - integration of urban and suburban transport systems, also on operational level, with intermodal nodes. Financing is one of the biggest questions in the future. The present situation is mixed: municipality budget, state budget, European budget and other revenues (BKV fares, parking fees, bank loans...) make up the financing. A developing story is a major reorganisation of the institutional system with the newly established BKK. Mr. Kerényi also presented some ongoing or newly finished transport projects, including some new network links (M0 and M31 motorways), Metro 4, development of tram lines (1, 3, 17, 42), Podmaniczky Programme for road renewal and bridge reconstructions (Liberty Bridge and Margaret Bridge). The old infrastructure and vehicles cause severe problems. Fleet renewal projects include the acquisition of new metro trains, but there are problems with the supplier Alstom. An EUfinanced project is under preparation for new trams and trolleybuses; the new vehicles also improve accessibility for all. 9
, public transport priority (bus lanes, video control), cycling developments (e.g. public bike project) and ITS.")
 focused in his presentation on intermodality and park & ride, the main topics of the workshop.")
10 Other projects include reallocation of public spaces ( Heart of Budapest programme), traffic calming ( TEMPO km/h zone), control of freight traffic, road user charging under discussion, development of the parking system (pay zones and park & ride facilities), public transport priority (bus lanes, video control), cycling developments (e.g. public bike project) and ITS. The yearly event European Mobility Week gave international recognition to the city with the European Mobility Week Award in Intermodality and Park & Ride in Budapest Mr. András Ekés, managing director of Metropolitan Research Institute (MRI) focused in his presentation on intermodality and park & ride, the main topics of the workshop. He started with a theoretical introduction into the concept of intermodality; intermodality means more than just changing points, it can help to reduce car-dependence. He mentioned some good examples: Berlin Central Station; London St Pancras; and on a lower scale Hennigsdorf by Berlin. He briefly presented some preliminary results from the inventory answers on intermodality, regarding the question what are the most important functions needed for good nodal point. These were: shops, passenger information, maintenance, safety and security, short and comfortable connections and ticket machines. He went on with the background of intermodality in Budapest. Until the 1970s the tram network was well covering Budapest, since then it became segmented due to closures related to new metro lines. The 10
, the worst practice Közvágóhíd and some Functionally problematic")

11 intermodal functions were artificial (need to change instead of direct travel). New development project concentrate on new network connections. Mr. Ekés also showed some examples: the well functioning Újpest Városkapu and Hűvösvölgy nodes (but both without non transport functions), the worst practice Közvágóhíd and some Functionally problematic intermodal nodes: - Örs vezér tere with only 50 P+R places, as the construction of Árkád shopping centre consumed the rest. - Keleti Railway Station: all the functions which would have helped the renovation of the rundown railway station have been taken to a place 600 m away, Aréna shopping centre. This may conserve the deterioration of Keleti. Regarding the topic of park & ride, he showed some results from the inventories. He also presented the P+R situation in Budapest with different models of investment and maintenance. At the end of his presentation Mr. Ekés gave some hints for next day s site visit. Plenary discussion The introductory presentation was followed by a plenary discussion about the transport situation in Budapest. The partners mentioned that the facilities are old and seemingly there is no improvement. The city seems to be overcrowded by cars, but there are also lots of nice trams. 11
12 Christian Peer asked about the reality of the administrative change mentioned in Mr. Vitézy s presentation. Mr. Iván Tosics answered that if there was a more coordinated transport possibility it could influence the behaviour of the people. The government has 2/3 majority in the Parliament that creates the possibility to make changes to the administrative system. The territorial planning is very week at the moment, and it is very difficult to reorganise the whole system. Mr. Iván Tosics also spoke about a congestion charging system, which is under preparation. It is a very difficult political decision because it directly affects the car users. Budapest is doing it step by step but it is not yet clear if the present leadership will take it or not (but the preparations are going on). Park & Ride The first main topic of the workshop was park & ride, with a presentation of good practice from Oslo- Akershus and a group discussion. Presentation of good practices (Oslo-Akershus) The introductory presentation on the topic was held by Mr. Njål Nore from Akershus county, Department of regional planning. He covered the development of the Oslo-Akershus park & ride system, the plans and dilemmas concerning capacity increase and a debate on the philosophy and aims of park & ride. Oslo has inhabitants, Akershus , more than half of them close to Oslo. By 2030 additional people are expected to live in the region. The road system is already stressed, but capacity increase is problematic. There will be no great increase the capacity (most roads have only 2x1 lanes), but there are plans to put some sections underground. As the population will be increasing, the capacity of the public transport system has to be increased. The train network is organised in a way, that there are internal slow trains with many stops and outer trains which stop at every place until a hub, and from there go directly in a city centre. After 20 years of development there are 6000 park & ride places, mostly in small sites in Akershus connected to railway stations. Most of them are free of charge or almost free (free if you have a seasonal ticket, otherwise priced). There is no general policy what to do if places are full; generally as a first step only people without a seasonal ticket have to pay. At a few sites a general system of payment has been introduced (for all users); it works and gives enough capacity. The expansion of most sites would be complicated as well as costly in many cases, as the areas have become more attractive for development since being first established. 12
 and a feeding bus service (accounting for 2/3 of the traffic) is connected to it.")

13 In Sonsveien (60 km from Oslo) there is a dedicated P+R railway stop (with a 60 minutes frequency), which is close to a highway but far from settlements. A park & ride site (with 145 lots) and a feeding bus service (accounting for 2/3 of the traffic) is connected to it. It is however questionable if this amount of traffic (500 passengers/direction a day) justifies an extra railway stop (with a cost amounting to 10 million EUR), also considering that the feeder bus could continue its way towards the next city centre. Maybe one such specialised station could be useful per direction, but certainly no more. A good example is Strømmen (15 km from Oslo), where 350 park & ride places are located very close to the railway station with a service of every 30 minutes. However it is also used by workers of the nearby shopping centre, who can also park here for free. There are plans for residential areas around, which raises the question if it is good to have big park & ride areas in the middle of towns? Also the increasing land value might lead to the end of P+R. The sites built up to 2005 were quite cheap, around NOK/place, as it was possible to pick the easier places and do it with small investments (open land covered by gravel or asphalt). Now it is around NOK/place, and in urban areas it may increase to NOK. Trains normally stop in towns, which makes land and construction of parking more expensive. It is getting very expensive to increase capacity. Picking cheaper locations and introducing feeder buses to the train station is too time-consuming to be a real alternative. 13


14 There have been investigations of where P+R users live, based on license plates. The results showed that to some sites most park&ride users travelled less than 1-2 km with their cars. In a case a small residential area stood out, where the county pays a feeding bus for all trains but at the same time many people drive their cars on the same distance and use the park&ride. On the other hand some people drive long distances parallel with railway lines to get park&ride closer to the city. It is also important to mention bike & ride, which is basically a park & ride for bicycles. It is especially important in dense European cities. There are two main philosophies in park and ride: either trying to offer many places to make people change from cars to public transport, or trying to give the flexibility of car for public transport users (in some days with special needs). In this latter case every public transport user should have the possibility to use the car in special cases if they really need it, but it can be a paying system, as the public sector does not have enough money to increase the capacity of free P+R places. Plenary discussion In the plenary discussion following the presentation some partners agreed that it is not economic to build huge amounts of P+R places; even if tens of thousands of places exists (built at a huge cost), they only can accommodate a small percentage of travelers. It would be rather advisable to build them to create flexibility for people. There should be rather many small places (e.g. 1-2 places at bus stops), and so you can have a good public transport system plus some additional car flexibility, not a good car system with some additional public transport. P+R can in many cases be seen as an easy option for decision- 14
15 makers, even though it may at times be less effective than alternative use of the same resources in other areas of public transport. It was also mentioned that the inner P+R places should be mostly for bikes, the outer ones for cars. Mr. Nore recommended to Budapest to take Copenhagen as an example for the bike transportation system, and to plan for bicycles when planning railway stations. Group discussion The presentation and the general questions were followed by a discussion round in three groups (groups A, B and C). The questions for the discussion were the following: - What makes a P+R good? - What are the necessary factors in terms of connection to the railway station, tariff system etc.? - In what sort of area is P+R useful (in terms of building and population density, functions residential, commercial etc., other characteristics of the area)? - Is there a difference from any aspect how P+Rs should look like in the metropolis and in the region (size, functions, prices...)? - What passenger information should be provided within the P+R site and on the approaching roads (e.g. train departures, number of free places...)? The main results of the group discussion are the following points: - Location is a key issue (near to where people live, integrating modes, accessible), so it should be integrated into urban planning. Bigger places at the end of metro lines are OK but many smaller places outside the city can be more useful. Vienna has many dense P+R houses within the city, some of them stay empty it is not clear whether this is because of the prices? - Other success factors include good road access, free places, security and cleanliness, direct public transport connections, and the availability of services (which is also useful for security reasons). - Users should be motivated to change their whole mobility chain (with tariff reductions etc.) - Necessary passenger information includes timetables, free capacity, indication of next P+R, and it should also have a common appearance. - Pricing is important: if it is cheap, people also use it when they do not need it, if it is expensive, people may drive into the city. Car usage could be made more expensive generally (e.g. road user charging), but also the ownership of the car is important (people who own the car only count with the variable costs, while a rent or shared car shows all costs, including investment costs. 15
16 - In group A there were two opinions: those who already established lots of P+R sites were more critical about them. They think the low density settlement would be popular. They prefer B+R and they think the society should change their attitude towards bikes. The other point of view was that P+R is the first step to motivate people to use public transport. Also it is not possible for people who live in low density areas. It was agreed that P+R should be planned as outside of the main city and as decentralised as possible. It should be a part of the public transport tariff system, not for free. Intermodality The section on intermodality was based on an interactive action (where all partner MR s were presenting a good and a bad example on intermodality) and a presentation of good practices from Göteborg. (This latter was moved to the second day due to organisational reasons, but still belongs to this thematic unit.) Interactive action I In the first interactive action each partner MR had 5 minutes to briefly present a good and a bad example of intermodality in pictures. The main findings are summarised in the table below. 16


17 Berlin-Brandenburg (Christina Schlawe) + Potsdam main station - Berlin, Warschauer Straße Integrated intermodal node. Covered bridge, Too long walking ways, uncovered, unpleasant S- shopping centre. P+R, B+R, Potsdam-bike, taxi. Very Bahn station, only stairs, no lifts. Lack of services and lively due to the train station; coordinated B+R devices, lack of space (too narrow pavement, timetables between the different modes of especially in the peak hours). transport, different services, lifts, secure. Developers were the shopping centre and the DB. 17


.")

18 Budapest (Antal Gertheis) + Újpest Városkapu - Közvágóhíd Bus station built from EU funding, good information No link between tram lines and suburban railways system, short walking distances. Regional bus and (HÉV); MÁV trains have no stop, long walking local bus integrated, railway and metro station. B+R, distances, low-quality services, unpleasant ticket machines exist. appearance. Göteborg Region (Per Kristersson) + Central Göteborg - Volvo Around railway station. Not for cars as it is the city employees; node outside the city. Close to centre (limited space). Combines buses, trams, harbour (4000 employees). Industrial area huge airport bus connections. There is an exhibition distances. Only one bus stop in 1500 m distance, the centre, museums; very effective and efficient employees do not choose it. intermodal point. 18


19 Ljubljana (Matej Gabrovec) + P+R Dolgi most - Ljubljana main railway station Good connection to bus line but no other functions. Price of P+R depends on which train you take. Bus station is 10 minutes walk away. 19

. There is a bus terminal, B+R.")
20 Oslo-Akershus (Peter Austin) + Lillestrøm - Bryn A partly good example is Sandvika, accessible One of the first railway stations + 2 separate metro through long tunnel, people do not like it. Old stations coincidentally within 400 m, bad fashioned bus terminal accessibility between the stopping places. No P+R at all (there was no need when the railway station was Good example: Lillestrøm, airport train stops here built), bad information system. (also in Sandvika, but from there it takes about three times longer to get to the airport). There is a bus terminal, B+R. Commuter traffic but also shops under the railway station. 20

, security problems (some people were killed here).")


21 Rome-Province of Rome (Maria Fabiani) + Ferrovia - Ponto Mamolo New P+R places would be constructed but all of Almost only bad examples, long walking distances to them are archaeological sites. the stations from the P+R. Floating P+R (floated by water), security problems (some people were killed here). Vienna Lower Austria (Gregory Telepak) + Praterstern - Leopoldau Train, 2 subway lines, bus and tram lines, nice glass-traicovered tram stop, small shopping centre, kiss and Most car traffic is just passing by. The usage of the and metro to city centre and three bus lines. ride for cars, sheltered bike place, shopping centre. P+R is below 25% of the places. Parking on the street No room for park and ride. is free while the P+R is 3 EUR/day. 21

22 Plenary discussion Summarising the short presentations of the interactive action the partners realised, that there were almost no good examples mentioned where cars are integrated. In Potsdam traffic is big, but the park&ride at Potsdam main station is underused. Probably due to unattractive P+R fees. The key for a good park & ride is the good public transport system. It would be better to give more connection points (park & ride at all stops), to provide more flexibility in the transport choice of people. The park & ride must be part of the whole transport system, and car use should be made more expensive inside the city (parking fee, road charging). Then people will take P+R into account even if earlier they did not think about it. Public transport has to be improved and made more attractive. In growing regions the increasing land values could lead to more intensive land use and so to a better public transport system, and finally less need for P+R. But in shrinking regions the situation might be different. Göteborg presentation on intermodality The presentation of Mr. Manne Wahlberg, project manager at Västtrafik was moved to the second day due to organisational reasons, but as it belongs to the topic of intermodality, we summarised it here. Mr. Wahlberg presented Västtrafic, the public transport authority of Western Sweden. The company is owned half by the region, half by the 49 municipalities, and operates 2200 vehicles buses, trams, ferries and trains. 40% of the trips are made by trams, 52 % made by buses, 7 % by train and 1 % by boats, ferries. Concerning the future of public transport, a new attitude is gaining ground among politicians and actors in planning compared to just a few years ago: a new partnership to change the society of cars to a society of sustainable modes. This direction needs the growth to be sustainable, and the strategic basis of this is the structural illustration of the Göteborg Region. A substantial shift to public transport is necessary. This is the main aim of the K2020 strategy: to double public transport usage from today to It has 5 strategies to make public transport more effective: 22


23 1. Link areas From a radial to a network structure. 2. Faster journey times PT priority and separate lanes for buses. 3. Greater frequency more frequent service along main corridors. 4. Developing the nodes PT becomes part of the city development. 5. Guaranteeing quality and service customer satisfaction. The development of interchange nodes is an important part of the strategy, as the direct links to the city centre have reached their maximum capacity, which makes changes necessary. Handling more passengers while introducing a new structure is challenging. To reduce the penalty of the necessary changes a guidebook has been prepared by the Danish Gehl Architects office, famous for pedestrianfriendly urban planning: Den ideala bytespunkten The ideal changing point from the passengers perspective. It summarises the characteristics of a good intermodal node in 9 points: 1. The safe and secure intermodal node o Populated o Safe environment o Safety traffic solution 2. The modern and vivid intermodal node o Mixed functions o Activity and rest o Different activity during day and evening 3. The concentrated intermodal node o o o Crossing point with high density population Junction point Shares space 4. The accessible intermodal node o Efficient public transport o Close and good connections short waiting times, short walking distances, P+R o Accessible for everyone 23

24 5. The intermodal node as the place to join together o Join together o Different level of connection o Encourage people to meet 6. The pleasant intermodal node o Pleasant atmosphere o Human scale o Careful 7. The intelligent intermodal node o Visible and easy o Interact, real-time information, WIFI o Entertaining and informative 8. The sustainable intermodal node o Sustainable transportation o Robust design o Ecological products, to use environmental-friendly materials, energy efficient solutions 9. The charismatic intermodal node o Directed to all target groups o Recognizable, good architecture o Sharp identity The ideal intermodal node achieves as many of these goals as possible, even if it is not possible to achieve all of these at the same time. A good example is Skeppsbron, an urban development project located at a central place, where the city meets the river. Urban and transport planning goes hand in hand. It will be an interchange point between ferries, trams and buses, none of which exists yet. To achieve this node for interchange requires good cooperation between all people involved in the planning process. 24

25 Plenary discussion During the discussion, partners from Göteborg assured that Gehl s report is a thin but visual report, available on Göteborg Region s webpage (unfortunately in Swedish only): Site visit The second day of the workshop started with a long site visit on intermodality, park & ride and public transport priority measures. Good and bad practices in these topics were shown in the Eastern Pest area. The last stop was a construction site visit at the Kelenföld section of the Metro 4 project, and lunch in the Kelenföld M4 visitor centre. The detailed description of the site visit can be found in the annexes. 25


26 Transport associations The topic of transport associations deserved special attention, as BKSZ, one of the partners from Budapest is a transport association itself. This topic was discussed based on three presentations from three different metropolitan regions. Presentation of good practices Vienna-Lower Austria (VOR) Verkehrsverbund Ost-Region (VOR) was presented by Mr. Andreas Rauter. It is the first and biggest transport association in Austria, founded in 1984, but strong legal regulations followed only 15 years later on the national level. Even though there were successful operators in the region, the routes, timetables and tariff systems were not harmonised, which was the reason for setting up the transport association. VOR is a company by form, owned by Vienna (44%), Lower Austria (44%) and Burgenland (12%), which is also the share of the costs covered. It pays compensation for the operators for revenue losses due to integrated tarification, and also covers the costs of additional service requirements. Its partners are the urban public transport operator Wiener Linien, 3 railway operators (ÖBB, GySEV/Raaberbahn, WLB) and the regional bus operators (e.g. ÖBB Postbus and private operators). The 70 employees of the company work in 4 departments (planning, finance, customer relations, IT). The basis of its work is a series of agreements (partnership agreement, master and financial agreement for the financing system and compensations...), as well as a Contract for the distribution of revenues (between VOR and operators) and a Contract of 26

27 cooperation and performance (who is responsible for the different services; e.g. national level for railways, regional level for the buses). In the railway sector the responsibility lies with the national level, but VOR's role is getting stronger; they are tendering the bus services already now. The area of VOR covers a region of 2.6 million inhabitants, where there are 900 million passengers a year, 800 million of which in Vienna. Wiener Linien (with the highest passenger numbers) and ÖBB (with the most passenger kilometres) compete to be the biggest player in the region. Austria as a whole is covered by transport associations, but VOR will be extended also to the area of VVNB (Verkehrsverbund Niederösterreich-Burgenland), which makes a new tariff system necessary, to be introduced by the 9 December In the tariff system Zone 100 is Vienna, while in the region there are 9 rings of zones. With single tickets the price is 1.8 EUR/zone, but there are also other tickets and passes, e.g. the very flexible 8-day-card. With the new tariff system the social reductions will be unified for the different operators. 900 million passengers are carried in the whole region by PT in a year (800 million by Wiener Linien). The calculation of the compensation is based on seat kilometres. The DTV (Durchtariffierungverlust compensation calculation) system is very complicated, and differs for the companies that joined in 1984 and those that joined in Within Vienna the modal split is 32% for cars (the rest is public transport, walking, cycling), while 68% of commuters arrives to the city by cars. Accordingly, the main political goal is to improve modal split across the city boundaries. VOR has its own brand, but it is an umbrella organisation, and does not want to compete with the brands of the operators. Its logo is available on all vehicles. VOR is a coordinator of the services, an interface between PT companies, political level and the passengers. There are customer satisfaction surveys on all lines every year, and regular mystery passenger checks (the best bus line in the region gets the VOR award ). There are additional services with the involvement of VOR: P+R, AST (Anrufsammeltaxi), Compano (carsharing platform on the internet), ITS Vienna region traffic information system (intermodal routing, traffic data pool, traffic model, traffic management and coordination) and Qando (mobile phone passenger information system). The ITS Vienna Region is a more or less independent part within VOR (real time information on road network, PT network, Bike 27
28 routing, B+R, P+R). The vision for the future includes a clearing house to fulfil the high-degree transparency requirements based on EC regulation 1370/2007, improving rural-urban links and be a driving force for countrywide solutions. Presentation of good practices Berlin-Brandenburg (VBB) The Berlin-Brandenburg model was presented by Mr. Eckhard Karwiese and Mr. Kai Dahme (VBB planning department). Berlin-Brandenburg is a large area covering two federal states, 14 districts and 4 large cities responsible for local public transport. Its length from north to south is about 250 km, east to west about 180 km. In this large territory there are public transport stops. VBB has 3.5 million passengers a day, but there are very different parts in the region: Berlin is high-density, while in some parts of Brandenburg public transport service is only justified by school children. In 1990 the unification treaty included a regulation to create a transport association for Berlin and Brandenburg this was only a local issue that time, but this was the first step. The railway reform in strengthened the regional role in public transport. Following the 1996 public transport act in Brandenburg, VBB was established on three steps (1996, 1999, 2002), following complicated negotiations between 20 authorities (districts/cities and federal states) and 45 transport companies. Its legal framework is set by the German railway law, federal public transport law and regional laws. VBB has the same tasks as VOR, and the structure is also similar. It is a public company under private law (GmbH). Its shareholders are Berlin, Brandenburg and the involved districts and cities in a 33%-33%-33% share. The tasks of VBB s are the following: ticketing and revenue sharing; passenger information for the entire public transport system; planning, tendering and contracting of railways; co-ordination of bus services between different authorities; overall marketing for public transport 28


29 The 2 billion EUR operation costs (infrastructure costs not included) are covered in 47% by fares, 49% by the two federal states and 4% by the involved districts and cities. There are 41 transport operators. The success factors for the good start are the legal framework, the compensation for tariff losses, the federal support for purchase of ticket vending machines, the good intentions of partners and the favourable circumstances after reunification. Tendering procedure is different for the railways and for the other public transport services. EU-wide competitive tendering is used in rail service. Gross contracts are used, the authority caries the revenue risk. Contracts last for years. There is a malus system if the operator does not meet the quality requirements. The results are better quality, more passengers and 10 to 50% less costs. In the VBB area 65% is the share of DB Regio, 28% of ODEG, 4% of NEB GmbH and 3% of Arriva (on the national level 78% of DB Regio and 22% of competitors). In the bus and city transport there are mostly directly awarded contracts to public owned operators (e.g. BVG in Berlin). Contracts are between the authorities and the companies, VBB is not involved. There are a few small private operators, also directly awarded. The BVG contract is managed by a separate body. It is a net contract (the operator keeps the revenue), and the operator is in a quite strong position now finally the city has the final say about the system. The tariff system is unified; the number of honeycombs to cross defines the price of ticket. Price increases are political decisions, while the ticketing system is a VBB board decision. Each operator sells tickets which are valid among all operators in VBB. 5-10% of ticket revenues are kept by the operator for ticket sales costs, the rest goes into the pool, and is allocated according to passenger km (55-90%) and number of passengers (10-45%). 29


30 Presentation of the situation in Budapest (BKSZ) On behalf of the partner organisation BKSZ, Dr. Zsolt Denke economic director presented the company. He gave an introduction to BKSZ and the public transport market as a whole, and also presented the status of integration on the service, tariff and information levels. Mr. Denke briefly presented the administrative structure of Hungary and the responsibilities of the different levels. The core area of BKSZ lies within the region of Central Hungary, while the railway lines reach further out. In the public transport service the authorities responsible for the service are the City of Budapest and the Ministry of Transport on the national level. On the organiser level there is a certain competition, even though the responsibilities of the different institutions do not match exactly: there is BKSZ (although with the establishment of BKK the role of BKSZ might change), but also the Ministryowned RKI/RKSZ institutions. The main service providers are the local public transport company BKV, the national railways MÁV and the public owned regional bus company Volánbusz. BKSZ was established in 2005 as a public company, and has only 8 employees. Its tasks include the operation according to its present competences, such as the introduction of integrated passes in two phases, timetable harmonisation and calculation of revenue loss compensation. The compensation is financed in 2/3 by the ministry and in 1/3 by the City of Budapest. However this only applies for the Budapest pass, as there is no real tariff unification outside Budapest. BKSZ is also preparing for future tasks planned as a second phase of operation. BKSZ also commissioned a study on a possible rapid rail transport system (S-Bahn) in the region of Budapest. 30
31 Plenary discussion The discussion was organised along some questions by the moderator, Mr. Tosics. The first question was the territorial limits of transport associations. The partners from Berlin- Brandenburg underlined the importance of the commuting or catchment areas, however the commuting distances are increasing, which means also transport associations should become larger. From the practical point of view, it is probably easier to start at a smaller area and expand later. It is also important that in the case of VBB all the authorities decided to participate, which was a very important political decision at the beginning. In the case of VOR, the catchment area of Vienna in 1984 did not extend beyond a km circle around the city. Now the whole territory of Austria is covered by regional transport associations, which means that Lower Austria and Burgenland have two systems in their territory; they are going to merge these now. Since recently they also coordinate the railway services in these 3 federal states (even though the tariff system is smaller now). As a second question, the functional limits were discussed: what other functions can transport associations take up additionally to organising public transport. VOR also does planning, P+R development in the region (not in Vienna) and also traffic management (ITS Vienna region). VBB is working on proposals to improve the public transport situation, but decision is political task. In Oslo- Akershus Ruter was founded (owned by Oslo in 60% and Akershus in 40%). They drafted a strategy for the regional development up to 2060, but they are still discussing who has the responsibility. They have to discuss it with the two county administrations, 22 municipalities and all the politicians. In Budapest the new BKK has TfL as an example, which means the integration of road traffic also. There is a good chance to realise an integrated city transport policy. Mr. András Ekés (MRI, Budapest) asked the partners from Vienna-Lower Austria about their experiences in influencing modal split. According to their answer the growing public transport volumes at the city border do not mean better modal split, but a growing number of commuters overall however given the influence of the new motorways this is not a bad result. VBB does not have exact numbers, but it is commonly agreed now that a common tariff system is useful. VOR confirmed this saying that the common tariff lowers the entrance burden of public transport. Göteborg Region has a more holistic approach, namely cooperation. Rail, road, water and air transport authorities have been merged to one body at the national level. There is an extra investment package for Western Sweden. All stakeholders are working together, not discussing the responsibilities. They are currently working on 5-6 smaller catchment areas to bring them together to one bigger one. The motivation to form transport associations is in many cases the separation of operation and organisation in the public transport system. 31

32 Railways as a part of urban mobility Railways can not only be part of long-distance passenger transport, but also play an important role in the suburban and even in the urban public transport system. These topics were discussed based on two presentations from Budapest and Rome-Province of Rome. (The former was moved to the first day due to organisational reasons, but still belongs to this thematic unit.) Presentation: railways in Budapest The presentation of Mr. Balázs Fejes, transportation engineer at BKSZ was moved to the first day due to organisational reasons, but as it belongs to the topic of railways in urban public transport, we summarised it here. Mr. Fejes started with data and trends in urban and suburban public transport in the region of Budapest: suburbanisation (2 million people in 1990 in the metropolis and 1.7 million now), growing number of commuters and a decreasing share of public transport, especially at the city borders. Today at the city boundaries 64% of trips is made by cars, the rest is public transport (20% is the share of different railways, 16% of buses). Where there is a motorway (M1, M3, M5, M7) the rate of the car users are higher. In every single road leading to Budapest there is congestion in the morning peak hours. In the territory of BKSZ there are 11 national railways (MÁV) lines and 4 BKV-operated HÉV lines. The length of the tracks is 900 km, 89% of which belongs to MÁV, 11% to the HÉV system. It is a dense network but not used by commuters; the reason is the quality of the trains (comfort from the 1960s). Also the train stations are in very bad condition. Mr. Fejes compared the MÁV (for passenger and freight transport) and the HÉV (only for passenger transport) networks. HÉV is better adapted to the urban-suburban transport: 80% of HÉV passengers use it within the city, while the share is only 11% for MÁV however it used to be 3% earlier. The problems of the HÉV system, although this is well integrated to the city transport, include a maximum speed of 40 km/h at many sections (often 70 km/h is allowed for cars on parallel routes). In 32


33 some places bus lanes were created to save buses from the traffic jams, but in this way the buses compete with the HÉV. There are also some small improvements: some new stations, some new trains, integrated timetables, partly unified tariff system, P+R facilities. However in people s minds railways are for longdistance travel. BKSZ created a new map which shows travel times to the main stations in the heart of Budapest, this might help to change people s mind. Finally Mr. Fejes presented the study on a possible rapid rail transport system (S-Bahn) in the region of Budapest, which aims to strengthen the role of railways in the urban and suburban public transport. Presentation of good practices (Rome-Province of Rome) The second presentation of the topic arrived from Emmanuela Bea from the Province of Rome. In Italy a high speed railway network is under development. The changing points between the high-speed and regional train lines are very important. On the railway market, RFI (Ferrovie dello Stato) is a monopolist. A new high-speed service will be operated by the private company MTV. The metro system counts two lines, A and B. The whole network is 36.5 km with 49 stations. The two metro lines are the main elements of the network, they deliver 220 million passengers/year. A new metro line is under construction (developing is difficult because there are numerous archaeological sites). 33

34 The closing of the railway ring around Rome is hindered by illegally constructed buildings, even if only 2 kilometers are missing. In the region there are 8 radial lines (FR1 to FR 8). The public transport corridors under construction consist of new light rail lines and articulated buses. Metrebus Lazio offers a tariff system based on 6 zones, which is integrated for buses and railways. It comprises a 30% discount on tickets. The good practice presented is the capacity improvement project of FR4. There was no place to build a second track, so another solution had to be chosen. The 1800 m block sections have been shortened to 1350 m, and the plans are to reach 900 m, which allows much more trains to pass at the same train period. It also means a new timetable, and needs new signalling and track layouts. With the additional measure to lengthen the platforms the capacity of the line has been increased by 50%. Discussion Mr. Nore from Akershus concluded that even if the situation is bad, it is nice to see that Budapest people understand the situation and have expectations towards a better public transport. To go for the best solution (fixed track) immediately is very costly, so he proposed to improve the situation with buses as a first step (bus lanes etc.). Mr. Fejes answered that in the last two decades bus lines were developed instead of tram lines. Mr. Ekés mentioned the outdated bus fleet as a problem. Mr. Tosics told that to improve buses would be a cheaper solution indeed, but they should not replace the already existing fixed track solutions. According to Mr. Frank Segebade form Brandenburg in Berlin much less people cross the city border every day (1/3 of the Budapest number) and they have a much more developed suburban rail system. This means that if only a portion of the large number of people commuting by car into Budapest could be converted to train, much of the developments would pay off. Public transport service in different areas The last day of the workshop started with an interactive action comparing public transport service in different areas of the different metropolitan regions. 34
35 Interactive action II During the second interactive action, every metropolitan region had 5 minutes to present public transport service in three different parts of the region: - a typical (residential) city centre area, in 100m zoom in Google maps ( 100m should be the measure in the bottom left corner); - a typical outer residential area, in 200m zoom in Google maps ; - a typical agglomeration settlement area, in 500m zoom in Google maps. Berlin-Brandenburg (Christina Schlawe) 1. Oranienburger Tor Friedrichstraße / Oranienburger Straße: an urban residential area characterised by 5-storey buildings. Underground line 5 minutes tact, metrotram 10 minutes, S Bahn minutes. Area very well served by PT. 2. Lichtenrade Buckower Chaussee/Lichtenrader Damm: outer urban area close to city border; a compact area of single-family and semi-detached houses. Expressbus 20 min, metrobus 10 min 3. Blankenfelde-Mahlow 5 km from Berlin border. Circular settlement area around an S-Bahn station, characterised by single-family and semi-detached houses, as well as allotments. S-Bahn 24 hour service. Feeder bus, only 5-8 in weekday morning and afternoon , every 40 minutes. No standard exists about distance to PT station but everyone within Berlin is well served. 35
36 Budapest (András Ekés) 1. VI. District Teréz körút Király utca Izabella utca Andrássy út. Very frequent (1.5-2 min) main tram line, underground (1.6-3 min), trolleybus (2.5-5 min). 2. XVI. District Rákosi út Batsányi J. u. Margit u. Arany J. u. Mátyás király u., an area characterised by single-family houses and a housing estate. Two main bus lines (15 min), plus a new bus (20-30 min), connecting three outer districts, not frequent but very important. 3. Dunakeszi Suburban railway 20 min tact in peak hours. Buses partly feeder, partly direct link to city. Some bus lines go parallel to railway, but are not replaceable. About the agglomeration: numbering of buses is already adjusted, time-tables partly, tariff only for inner Budapest part of the journeys. 36
37 Göteborg Region (Per Kristersson) 1. Central residential area 4 km from the city centre, a typical residential area. 2. Edge of the city Family housing, sprawl area. 3. Kungsbacka Town in the agglomeration. The main challenges are the following: There are two tram lines with 5-7 min tact and a great number of bus lines. However, only the city centre is well connected, e.g. to the Volvo works it would take 1 hour at least (with a change in the centre to bus, and walking at the end). Only one circular bus line, quite good but at a lower frequency (15-30 tact), only connection to centre. Train to city centre 20 min (35 km). The problem is that most of the 70 thousand people are not living close to the train station (20-30 min to reach the station). - How to reach industrial sites (Volvo) or shopping centres? - Tangential travel is weak. - Travel from areas in between radial lines is problematic. - Connecting sprawl areas is difficult. - Not only the city centre should be the target. 37
38 Ljubljana (Matej Gabrovec) 1. City centre Trams were terminated 50 years ago, trolleybuses 30 years ago, now only buses exist. The 3-5 minutes tact is good, but speed is low, as no bus lanes exist. Radial lines exist, but there is only one tangential one. There are plans to introduce tram again but only on the long term. 2. Outer urban area Northern outskirts of the city, with a hill used as a popular recreational area. Well served by city buses (every 15 minutes). There are also regional buses to the neighbouring villages, but only 3 times a day (formerly 5 times day). 3. Village in the region A city bus line reaches this village (every 15 minutes), this makes transport cheap. The village contributes to that, as it is based on an agreement between the municipalities, but a special permission from the ministry is needed for that, as city buses normally are only allowed within the city. The problem is that the regional bus concessors complain about losing passengers to city buses. The main regional bus line is good, but other regional buses have low frequency on workdays and no service on weekends. Train is there and it would take people fast (10 min) to the city centre, but there are not enough train stops. There is a ticketing plan initiated top-down from the state level, as the regional administrative level is missing. It is planned to be implemented by 2013, and will include trains land regional buses, but probably not local public transport. The state would like to make something on that for the 200 settlements. The strategic target is to have a bus stop within 500 m for every inhabitant; now about 90% of inhabitants have this service. 38
39 Oslo-Akershus (Tor Bysveen) 1. Frogner Inner city, edge of CBD (1 km from the centre). Home of the rich with lot of family housing. There is tram and bus service in the neighbourhood. 2. Bekkestua Outer suburb in Akershus. There are family houses with rich families and lots of cars. Also some blocks of housing are built but even these are quite expensive; many older people moved here from the neighbouring family houses and their places were taken by young families. They are not in the workforce anymore, and they drive their cars. 3. Hauketo Outer suburb. Served by trains and buses. It could be a good development area because of the train station, but there is no decision yet. All three locations are well served by public transport. In this rich country with many cars, car use is the norm but at least these people contribute to the further development of public transport with the Oslo package money. Within Oslo the use of PT is increasing, in Akershus not. Central government contribution to the Oslo package is decreasing. 40% of revenues is used in Akershus. The government of Akershus uses the money on road developments not to create more capacity but to put roads underground. 39
40 Rome-Province of Rome (Maria Fabiani) 1. City centre Well served by a railway station, 2 metros, tram lines (16 or 22 min tact) and buses. 2. Residential area 5 km from centre. Train 14 every minutes in peak hours, bus every 12 minutes, another bus every 13 minutes. Ultra suburb buses (ultraperiferica). 3. Velletri 50 km from centre, sprawl area. 3 bus lines, one train line (FR 4 linea ferroviaria regionale). Low frequency. All local bus lines connect to the train station. Tangential connections are missing, especially in second and third belt around the city. Sprawling areas and commercial areas are in outskirts are also a challenge; there is lot of traffic on weekends. Central government will cut all public transport investments, without consulting regional and local governments. Transport associations already did not get contribution for 9 months. Ticket prices are very low in European comparison, but also the system is less effective. People would be willing to pay more for public transport if the service was better. The mayor of Rome decided soon after taking office to decrease parking fees: it is now 4 EUR for 8 hours in the city centre. Today only the province has a positive approach to public transport. Besides the political differences between left and right, the main thing is to change the cultural approach to transport in middle and southern Italy. Vienna-Lower Austria (Angelika Winkler and Norbert Ströbinger) 1. Schwedenplatz Very good service, two metro lines, several tram lines, buses. 2. Grossfeldsiedlung 5-6 km from centre. New metro line (one of the busiest). P+R is only used for 10%, car drivers use roads to park. Parking regulation will be introduced around metro stations. No tram but many bus lines. 3. Klosterneuburg Langenzersdorf On both sides of the Danube there is a railway line. There are also many bus stations on both sides, end station of tram. Lines are leading to intermodal node Praternstern. Public transport operates between 5.00 and Before non-workdays metro works all night. The standard is that everyone should be able to reach public transport within 15 minutes. 40
41 Plenary discussion The plenary discussion after the short presentations was concentrated along the questions posed by Mr. Tosics. As first he asked if there should be any standard about maximal walking distances to public transport stops. In some cities there is a policy target: 15 minutes in Vienna, 500 metres in Ljubljana, 600 m in Budapest. The partners from Göteborg mentioned that such a standard is not enough: the frequency and directions of the service are just as important. Mr. Segebade said that such a standard only makes sense in the city; e.g. in Brandenburg the densities are very low. The second question regarded the service in the agglomeration areas: how to avoid more sprawl due to better connections? According to people from Vienna, the public transport service does not have to automatically follow people in some low-density areas. In Oslo-Akershus the goal is sustainable development (to have more people in the central zones, to have more industrial development). The public transport service is following a planning concept which dedicates main centres, subcentres and non-central areas. Unfortunately the strongest increase in jobs happened in these non-central areas, as the principle has not been taken into account by investors. The partners declined the idea of going forward with a deeper, more standardised comparison in the Oslo workshop, as it is going to focus on different areas. Mr. Ekés showed some slides comparing timetables in different regions. In Berlin and Vienna timetables are strict and ensuring connections; vehicles run at equal intervals. Ljubljana and Rome makes large differences between peek hour and off-peak hours; Budapest is somewhere in between. Summary session The content-related part of the workshop summarised the conclusions of the workshop, and also served as a place for evaluation of the workshop. Mr. Segebade concluded that the case of Budapest was shown from many different angles. From the organisational point of view it showed that one site visit should be enough also in other workshops, to create more time for discussions. In the intermodality topic the bad and good examples highlighted many important aspects and gave a clear picture how a good intermodal node should work. The P+R debate was also very important. Transport associations were well discussed and it was important to take the train also separate, as this is the main form of public transport which connects urban with regional transport. The comparison of the 7 cities and regions is important as a first step but enough time has to be ensured for drawing the conclusions and create recommendations. Mr. Martin Reents (Infrastruktur und Umwelt) discussed the importance of P+R; to what extent is P+R an efficient way to massively increase the passengers for public transport. From political point of view P+R can be very important as this brings also richer people to public transport otherwise this would only be 41
42 used by the poor and the political image for public transport would be low. This aspect is new for him and he sees now P+R much more positive than earlier. Even if P+R is not the most cost efficient way to increase public transport usage, it is politically one of the most important tools as it brings the richer people closer to public transport. Mr. Tosics spoke about the importance of co-modality: besides P+R also parking fees and the whole chain of car use should be taken into account (how many roads are available, how congested these are, is there anything to pay for it, parking places and parking fees etc.). According to Mr. Ekés the free choice of people how they organize their mobility is very important. Not only P+R but also car-pooling and other tools can convince people to minimize their car use. Next steps Outlook to workshop in Oslo During the last section, partners from Oslo and Akershus presented their ideas about the organisation of the workshop in Oslo. The topics for the Oslo workshop: are the following: - parking policy, - road user charging, - financing public transport, - public transport priority. On the initiative of the organisers, the partners agreed to drop the topic transport master plan. The workshop will be organised between 7 March 2011, and finish on the 9 March around noon. It will include a guided tour in Oslo and Lower Romerike. They planned a section for the Lead Partner, but it was also dropped as there is no other need for that than the ISC meeting. These changes can leave more time for more group discussions on public transport financing. This discussion, however, has to be very well prepared: with few questions to discuss, asking for data in advance, tough moderators etc. Vienna raised the question whether financial officers should be invited for these topics but for one day maximum as these people have tight schedules. Oslo is going to prepare a precise inventory with the help of transport economists. Mr. Segebade raised the idea of dropping also the topic of public transport priority, but partners from Budapest opposed this as the topic is one of their main focuses. They agreed however to discuss it in a shorter timeframe. 42
43 Ms. Georgia Larsson from GR proposed to integrate the case studies more into the topics. As a final decision, Oslo was given more time to rethink the questions and to communicate the answers on open questions later. 43
44 Annex List of participants PP Institution Name Berlin-Brandenburg Joint State Planning Department Berlin- 1 Brandenburg, GL Joint State Planning Department Berlin- Brandenburg, GL 4 Joint State Planning Department Berlin- Brandenburg, GL 4 44 Days of participation Frank Segebade X X X Corinna Elsing X X X Christina Schlawe X X X EX VBB Eckhard Karwiese X X X EX VBB Kai Dahme X X Budapest / BKSZ 2 Municipality of Budapest, Office of EU Affairs Veronika Nóra Szemere X X X 2 Municipality of Budapest György Benda X X X 2 Municipality of Budapest Ilona Kósa X X X 2 Municipality of Budapest Zoltán Jabronka X X X 2 Municipality of Budapest Barbara Halasi X X X 2 Municipality of Budapest László Kerényi X X X 3 BKSZ Budapest Transport Association Zsolt Denke X X X 3 BKSZ Budapest Transport Association Balázs Fejes X X X 3 BKSZ Budapest Transport Association Balázs Hadászi X X X EX Metropolitan Research Institute András Ekés X X X EX Metropolitan Research Institute Antal Gertheis X X X EX Metropolitan Research Institute Iván Tosics X X X EX Metropolitan Research Institute Rita Petrovácz X X X Oslo / Akershus City of Oslo Department of Environmental 4 Affairs and Transport Akershus County Council, Department of Regional Development Akershus County Council, Department of Regional Development Akershus County Council, Department of Regional Development Peter Austin X X Margaret Andrea Mortenson X X X Marit Øhm Langslet X X X Tor Bysveen X X X 5 Akershus County Council Njål Nore X X
45 Vienna / Lower Austria City of Vienna, Department 18 - City 6 Development and Planning Rome City of Vienna, Department 18 - City Development and Planning City of Vienna, Department 18 - City Development and Planning City of Vienna, Department 18 - City Development and Planning City of Vienna, Department 18 - City Development and Planning Government of Lower Austria, Department for Spatial Planning and Regional Policy Province of Rome, Office for European Affairs and International Relations Province of Rome, Office for European Affairs and International Relations Province of Rome, Councillorship for Mobility and Transport Policies Province of Rome, Department for Mobility Governance and Road Safety Christian Peer X X X Kurt Mittringer Angelika Winkler Gregory Telepak X X Andreas Rauter Norbert Ströbinger X X X Maria Fabiani X X X Giovanni Pagliaro Emanuela Bea X X X Manuela Manetti X X X 9 BIC Lazio SpA Raffaella Labruna X X X 9 BIC Lazio SpA Luca Bardoscia X X X Gothenburg Göteborg Region Association of Local 10 Authorities 10 Göteborg Region Association of Local Authorities Georgia Larsson X X X Per Kristersson X X X EX Göteborg Region / Västtrafik Manne Wahlberg X X X X X 45
46 Ljubljana Regional Development Agency of the Ljubljana Urban Region Regional Development Agency of the Ljubljana Urban Region Regional Development Agency of the Ljubljana Urban Region Scientific Research Centre of the Slovenian Academy of Sciences and Arts Scientific Research Centre of the Slovenian Academy of Sciences and Arts Scientific Research Centre of the Slovenian Academy of Sciences and Arts Tatjana Marn X X Katja Butina X X X Barbara Krajnc X X X Janez Nared X X X David Bole X X X Matej Gabrovec X X X External project and financial management EX Infrastruktur & Umwelt Dr. Jürgen Neumüller X X X EX Infrastruktur & Umwelt Martin Reents X X X 46
 in direction of Örs vezér tere. Train departure at 8.53 in direction of Sülysáp, getting off at Rákoskert (9.14).")
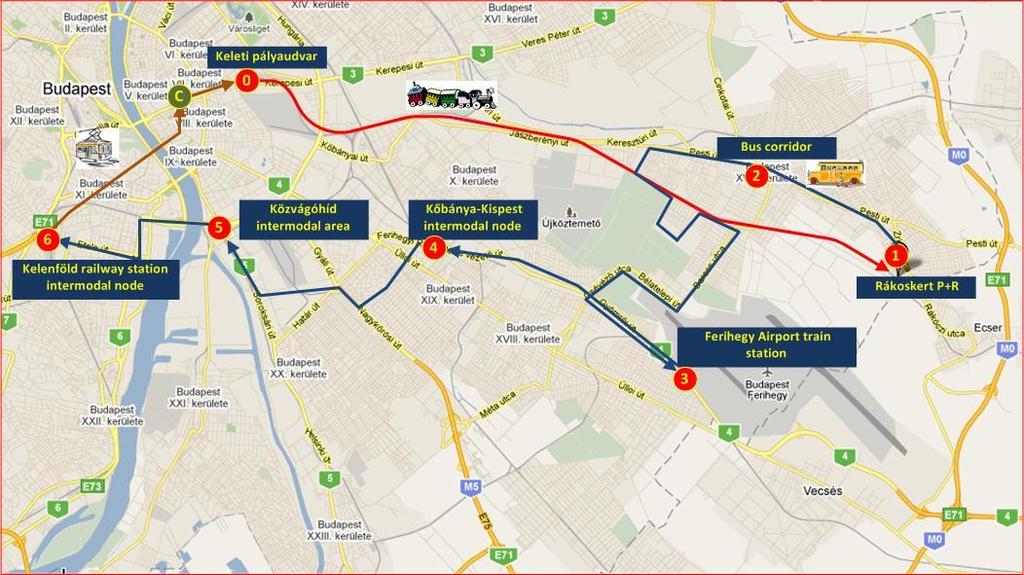
47 Site Visit Intermodality and P+R situation in Budapest, Basic information: Meeting point: in front of the Hotels at 8.10 am. Common journey by Metro 2 to the Eastern Railway Station (Keleti pályaudvar) in direction of Örs vezér tere. Train departure at 8.53 in direction of Sülysáp, getting off at Rákoskert (9.14). From Rákoskert to the last point of the visit (Etele tér) we take a charter bus. From Etele tér to the City Hall we take the tramway line 49. First part: P+R facilities and bus corridor in the Eastern part of Budapest 1. Rákoskert railway station P+R Rákoskert railway station is located in district XVII of Budapest, serving a primarily single family house area with a train in every 20 minutes in peak hours. Budapest Transport Association (BKSZ) prepared plans for this site (among others), and when the parking company of the City of Budapest (Parking Ltd.) decided to build P+R sites at railway stations in Budapest, Rákoskert has been selected along with five other locations in the districts XVII and XXII. The development was co-financed by the European Regional Development Fund. The six new P+R sites have been realised in 2009 by a consortium consisting of Parking Ltd., Hungarian State Railways (MÁV) and the two district municipalities, and they now offer 570 parking places and 120 sheltered places for bikes (of which 69 and 20 in Rákoskert). They are maintained by Parking Ltd. and supervised by security cameras. 47

")
 for Rákoskert")
48 The development also included the construction of a bus stop, and Budapest Transport Company (BKV) introduced a new feeder bus service (197) for Rákoskert railway station. 48


49 2. Rákoskeresztúr bus corridor Although district XVII is served by two railway lines, both of these run through the single family house areas, while the densely built centre of the district is connected to the city by high frequency bus services. However, the regular traffic jams on the route have affected severely the quality and competitiveness of the bus service. The ongoing construction of the bus corridor aims to create a faster and more reliable bus connection between the district centre and Örs vezér tere intermodal centre (and from there to the city centre), which can be competitive to private car use. It will affect 15 local and 3 regional bus lines, cutting travel times on this section by one third in peak hours. The development consists of five sections with different technical solutions separate bus routes, dedicated bus lanes, as well as public transport priority measures at intersections. 49
: it is served by a bus service (200E)")

50 Second part: intermodality and connection analysis the South- Eastern part of Budapest 3. Ferihegy 1 Railway Station The public transport connections of Budapest Ferihegy Airport are quite weak compared to its importance (8 million passengers a year): it is served by a bus service (200E) which connects to Metro 3 at Kőbánya-Kispest (KöKi) intermodal node. The issue of a railway and/or metro connection has been on the agenda for a long time, but it was never realised due to mainly financing problems. passenger volume. Initially the only problems were the rather long walking distance between the station and the airport and the varying quality of the train service. However, the lack of maintenance caused severe damages within a very short time: the elevators went out of operation, and the station itself became covered by graffiti, dirt and iron powder from the rails. The construction of Ferihegy 1 Railway Station was aimed to be a cheap measure to solve at least a small part of the problem: it was built in 2007 on an existing railway line to serve Terminal 1 of the airport, which handles most the cheap flights and about 15% of the total 50


51 4. Kőbánya-Kispest intermodal node Kőbánya-Kispest (KöKi) is one of the most important intermodal centres of Budapest, and also one of the oldest: it was finished in 1980 together with this section of the metro. Today it has a railway station (also end station for some commuter trains), it is the southern terminus of Metro 3, and its bus station serves a number of urban and suburban bus lines, including the line 200E serving Budapest Airport. It also features one of the four priced P+R sites of the city. Despite of its high importance as a transport node, it is of very low quality both functionally and aesthetically, characterised by run-down structures and public spaces, low-quality services, shabby taverns and a general feeling of insecurity. Today the construction of a new shopping centre called KöKi Terminál reshapes the area, including the relocation of the bus station, changes in the metro station and new connections between these modes. 51
 line and two tram lines (2 and 24), but it is also served by some bus lines and relatively close to")
, the walking connections are bad, railway stations on two lines are missing, the public spaces run-down.")

52 Third part: intermodal nodes and areas in the South-Western part of Budapest 5. Közvágóhíd intermodal area Közvágóhíd is an area which is the terminus of a suburban railway (HÉV) line and two tram lines (2 and 24), but it is also served by some bus lines and relatively close to the current southern end of tram line 1. However, it is far from being and intermodal centre it is rather a worst practice showing how not to organise intermodality. The tram and HÉV stations are quite far from each other (especially true for tram 1), the walking connections are bad, railway stations on two lines are missing, the public spaces run-down. The southern extension of the tram line 1 is a long-awaited project of Budapest. The present terminus of the tram line is on the Pest side of the Lágymányosi Bridge at Közvágóhíd, even though the bridge finished in 1995 was planned in a way that it can accommodate the railway tracks. Now the extension is planned to be financed partly by EU funds. It is scheduled to begin in 2011 with track reconstruction works, and to finish by The new terminus will be at Fehérvári út, offering connection to three other tram lines on the Buda side. The longterm plan is however to reach Kelenföld Railway Station. 52


53 6. Kelenföld railway station intermodal centre Kelenföld Railway Station is an important commuter train station, but also a stop of almost every interregional and international train going to or arriving from the western direction. There is also a tram line, as well as a local and a regional bus station connected to it. Just as in the case of KöKi, the present situation does not meet the current needs from any aspect. The most important driver of the current development is the construction of Metro 4: the disputed new line of Budapest metro will have its terminus here at least temporarily. This could foster the development of a new intermodal centre with also commercial functions. However, the constant delays in the metro construction (the present target date is 2015) and the crisis also had an impact on the private developers plans. 53
54 54
Transport systems integration into urban development planning processes
 Transport systems integration into urban development planning processes Phd. Vytautas Palevičius 2014-03-28 Klaipėda Šiauliai Panevėžys Kaunas Vilnius At the beginning of year 2013, Lithuania was populated
Regional Integration of Public Transit - From the Perspective of a Transit Company. April 2019 Thomas Werner MVG Munich
 Regional Integration of Public Transit - From the Perspective of a Transit Company April 2019 Thomas Werner MVG Munich Facts about Munich Capital of the State of Bavaria Population: City ca. 1.5 million
Seoul. (Area=605, 10mill. 23.5%) Capital Region (Area=11,730, 25mill. 49.4%)
 Capital Region (Area=11,730, 25mill. 49.4%)") Seoul (Area=605, 10mill. 23.5%) Capital Region (Area=11,730, 25mill. 49.4%) . Major changes of recent decades in Korea Korea s Pathways at a glance 1950s 1960s 1970s 1980s 1990s 2000s Economic Development
Seoul (Area=605, 10mill. 23.5%) Capital Region (Area=11,730, 25mill. 49.4%) . Major changes of recent decades in Korea Korea s Pathways at a glance 1950s 1960s 1970s 1980s 1990s 2000s Economic Development
In the following letter I would like to share with you the developments we reached in the referred subjects.
 Ref. Ref. Ares(2012)75556 Ares(2018)3432564 - - 23/01/2012 28/06/2018 Managing Authority of Transport Operational Programme Budapest, 20 January 2012 Our ref. number: 48/ / /2012 Subject: Transport Operational
The Experience of Vienna City
 Examples from key cities and public transport operators: The Experience of Vienna City DI Isabella Kossina, MBA Wiener Stadtwerke, Vienna, Austria Wiener Stadtwerke Sustainability Report 2008 and Sustainability
Hamburg public transport association. (HVV - Hamburger Verkehrsverbund GmbH) Hagen Seifert
 Hagen Seifert") Hamburg public transport association (HVV - Hamburger Verkehrsverbund GmbH) Hagen Seifert Hagen Seifert / HVV / Mach 2017 HVV Service Area inner Hamburg Metropolitain Region Population entire Metropolitain
Hamburg public transport association (HVV - Hamburger Verkehrsverbund GmbH) Hagen Seifert Hagen Seifert / HVV / Mach 2017 HVV Service Area inner Hamburg Metropolitain Region Population entire Metropolitain
Sofia Urban Transport challenges and strategies
 Sofia Urban Transport challenges and strategies HoPE International Workshop, Karlsruhe 26 November 2015 Sofia Area 1 311 sq.km. Population 1 300 000 inhabitants Length of the public transport network 1
PUBLIC TRANSPORTATION AS THE
 PUBLIC TRANSPORTATION AS THE BACKBONE OF MAAS Caroline Cerfontaine, Combined Mobility Manager, A WORLDWIDE ASSOCIATION 16 offices + 2 centres for transport excellence : A DIVERSE GLOBAL MEMBERSHIP 1500
Sustainable Mobility Project 2.0 Project Overview. Sustainable Mobility Project 2.0 Mobilitätsbeirat Hamburg 01. July 2015
 Sustainable Mobility Project 2.0 Project Overview Sustainable Mobility Project 2.0 Mobilitätsbeirat Hamburg 01. July 2015 Agenda Goals of the meeting Who We Are World Business Council for Sustainable Development
G u i d e l i n e S U S T A I N A B L E P A R K I N G M A N A G E M E N T Version: November 2015
 G u i d e l i n e S U S T A I N A B L E P A R K I N G M A N A G E M E N T Version: November 2015 Parking management is a powerful tool for cities to influence transport. By managing the supply, design
RAIL INFRASTRUCTURES AND SERVICES: CONNECTING EUROPE FOR CITIES AND PEOPLE CITY OF SOFIA MOBILITY MANAGEMENT POLICIES. Metodi Avramov City of Sofia
 RAIL INFRASTRUCTURES AND SERVICES: CONNECTING EUROPE FOR CITIES AND PEOPLE CITY OF SOFIA MOBILITY MANAGEMENT POLICIES Metodi Avramov City of Sofia Bologna, October 15 th, 2014 SOFIA Area 1 311 sq.км. Population
The deployment of public transport innovation in European cities and regions. Nicolas Hauw, Polis
 The deployment of public transport innovation in European cities and regions Nicolas Hauw, Polis What is Polis? Network Exchange of experiences 65 European cities & regions European Initiatives Innovation
Curbing emissions and energy consumption in the transport sector how can we deal with it in Warsaw 2012 Annual POLIS Conference
 Curbing emissions and energy consumption in the transport sector how can we deal with it in Warsaw 2012 Annual POLIS Conference Perugia, 29 30 November 2012 1 Covenant of Mayors (under the auspices of
ELISA SCHENNER. European Stadtwerke Holding AG
 ELISA SCHENNER European Affairs @Wiener Stadtwerke Holding AG To be or not to be: How to survive Digital Darwinism as Public Transport Operator Dr. Elisa Schenner, Head of European Affairs Office Brussels
Impact of Copenhagen s
 Impact of Copenhagen s Parking Strategy Copenhagen s parking strategy Strategy background From the 1950s, a marked increase was seen in car traffic, and streets and squares in the centre of Copenhagen
Submission to Greater Cambridge City Deal
 What Transport for Cambridge? 2 1 Submission to Greater Cambridge City Deal By Professor Marcial Echenique OBE ScD RIBA RTPI and Jonathan Barker Introduction Cambridge Futures was founded in 1997 as a
Vehicles for Cross-Border Rail Transport
 15.05.2013 1 Vehicles for Cross-Border Rail Transport Kai DAHME Verkehrsverbund Berlin-Brandenburg (DE) Public Transport Management Authority Berlin-Brandenburg This project is implemented through the
HOW TO DELIVER PUBLIC TRANSPORT ON REDUCED BUDGET
 LONDON MAY 25, 2011 HOW TO DELIVER PUBLIC TRANSPORT ON REDUCED BUDGET Marc Le Tourneur Direction de l Innovation et du Développement Sinotropher Conference London - May 25, 2011 - SUMMARY PART - 1 Climate
ITS Vienna Region / AnachB.at. the innovative traffic management project for the eastern region of Austria
 ITS Vienna Region / AnachB.at the innovative traffic management project for the eastern region of Austria traffic telematics Telematics: telecommunications + computer science Target: get the most out of
Vanpooling and Transit Agencies. Module 3: Benefits to Incorporating Vanpools. into a Transit Agency s Services
 Vanpooling and Transit Agencies Module 3: Benefits to Incorporating Vanpools into a Transit Agency s Services A common theme we heard among the reasons why the transit agencies described in Module 2 began
How to manage large scale infrastructures? Infrastructure planning within Toulouse s SUMP. Alexandre Blaquière. 1st December 2016
 How to manage large scale infrastructures? Infrastructure planning within Toulouse s SUMP Alexandre Blaquière 1st December 2016 The challenges for development and attractiveness of the Greater Toulouse
Road Map for Sustainable Transport Strategy for Colombo Metropolitan Region with Cleaner Air, through Experience
 Workshop on Air Quality and Environmentally Sustainable Transport April 28 th 2011 Don S. Jayaweera Road Map for Sustainable Transport Strategy for Colombo Metropolitan Region with Cleaner Air, through
Urban Node Berlin-Brandenburg
 Urban Node Berlin-Brandenburg Urban Node Laboratory 23.-24.03.2017 CEF Call 2016 Proposal S 21 CEF 2016 MAP General Call Priority: Urban Nodes New Innercity railway line between the Central Station to
The deployment of public transport innovation in European cities and regions. Nicolas Hauw, Polis
 The deployment of public transport innovation in European cities and regions Nicolas Hauw, Polis What is Polis? Network Exchange of experiences 65 European cities & regions European Initiatives Innovation
Prof. Dr. Andrea Giuricin. Benefits of the competition in the High speed rail and the limits to the competition
 Prof. Dr. Andrea Giuricin Benefits of the competition in the High speed rail and the limits to the competition Rome, February 2017 Part 1: Benefits of the competition The entry in the market of Italo on
BMW GROUP DIALOGUE. HANGZHOU 2017 TAKE AWAYS.
 BMW GROUP DIALOGUE. HANGZHOU 2017 TAKE AWAYS. BMW GROUP DIALOGUE. CONTENT. A B C Executive Summary: Top Stakeholder Expert Perceptions & Recommendations from Hangzhou Background: Mobility in Hangzhou 2017,
Downtown Transit Connector. Making Transit Work for Rhode Island
 Downtown Transit Connector Making Transit Work for Rhode Island 3.17.17 Project Evolution Transit 2020 (Stakeholders identify need for better transit) Providence Core Connector Study (Streetcar project
TRANSIT FEASIBILITY STUDY Town of Bradford West Gwillimbury
 TRANSIT FEASIBILITY STUDY Town of Bradford West Gwillimbury Open House Presentation January 19, 2012 Study Objectives Quantify the need for transit service in BWG Determine transit service priorities based
Urban Transport Development Investment Program (RRP MON 39256) SECTOR ROAD MAP
 SECTOR ROAD MAP") Urban Transport Development Investment Program (RRP MON 39256) SECTOR ROAD MAP 1. The government s vision for urban transport in Ulaanbaatar provides the basis for the sector roadmap to be implemented
Urban Transport Development Investment Program (RRP MON 39256) SECTOR ROAD MAP 1. The government s vision for urban transport in Ulaanbaatar provides the basis for the sector roadmap to be implemented
Transport Group Perspective Chris Blow Chair of The Guildford Society Transport Group 21st Jan 2015
 Transport Group Perspective Chris Blow Chair of The Guildford Society Transport Group 21st Jan 2015 LET'S REMEMBER THAT THIS IS NOT A STATION REDEVELOPMENT BUT A STATION SITE REDEVELOPMENT. The big question:
Draft Marrickville Car Share Policy 2014
 Draft Marrickville Car Share Policy 2014 1. Background 1.1. Marrickville Council has supported car sharing in the LGA since 2007 as part of a holistic approach to encouraging more sustainable modes of
STRATEGIC PRIORITIES AND POLICY COMMITTEE MAY 5, 2016
 STRATEGIC PRIORITIES AND POLICY COMMITTEE MAY 5, 2016 Shift Rapid Transit Initiative Largest infrastructure project in the city s history. Rapid Transit initiative will transform London s public transit
Back ground Founded in 1887, and has expanded rapidly Altitude about 2500 meters above MSL Now among the ten largest cities in Sub Saharan Africa
 Back ground Founded in 1887, and has expanded rapidly Altitude about 2500 meters above MSL Now among the ten largest cities in Sub Saharan Africa Annual growth rate is 3.8% By 2020 population growth would
A Transit Plan for the Future. Draft Network Plan
 A Transit Plan for the Future Draft Network Plan Project Overview and Status Completed Market Analysis and Service Evaluation. Developed Plan Framework and Guiding Principles. Developed a draft Five Year
Three ULTra Case Studies examples of the performance of the system in three different environments
 Three ULTra Case Studies examples of the performance of the system in three different environments airport application: London Heathrow : linking business and staff car parks through the access tunnel
Spatial planning and sustainable urban transport systems
 Jean-Christophe Goudouneix Rita Magris Laura Richter Nicolae Serban Stef Tomesen George Yates Erasmus Intensive Programme 2013 Oradea Group 4 Spatial planning and sustainable urban transport systems Developing
Perception of converted trolleybuses and promotion strategy for trolleybuses in Gdynia
 Katedra Rynku Transportowego Perception of converted trolleybuses and promotion strategy for trolleybuses in Gdynia dr Marcin Wołek Department of Transportation Market University of Gdansk Trolley Summer
Financing by International Finance Institutions the Sofia case. Metodi AVRAMOV Public Transport Company - Sofia
 Financing by International Finance Institutions the Sofia case Metodi AVRAMOV Public Transport Company - Sofia Leipzig, 18 April 2008 SOFIA Area 1 194 sq.км. Population 1 400 000 inhabitants Number of
Bus The Case for the Bus
 Bus 2020 The Case for the Bus Bus 2020 The Case for the Bus Introduction by Claire Haigh I am sure we are all pleased that the economy is on the mend. The challenge now is to make sure people, young and
Fuel Cells and Hydrogen 2 Joint Undertaking (FCH 2 JU) Frequently Asked Questions
 Frequently Asked Questions") Fuel Cells and Hydrogen 2 Joint Undertaking (FCH 2 JU) Frequently Asked Questions Background information: The Fuel Cells and Hydrogen Joint Undertaking was established in 2008-2013, as the first publicprivate
Fuel Cells and Hydrogen 2 Joint Undertaking (FCH 2 JU) Frequently Asked Questions Background information: The Fuel Cells and Hydrogen Joint Undertaking was established in 2008-2013, as the first publicprivate
Urban Mobility Systems - Regulation Across Modes
 1st European Intermodal Transport Regulation Forum Urban Mobility Systems - Regulation Across Modes Florence 7 December 12 UITP - The basics - UITP is the global organisation for urban, suburban and regional
Service Quality: Higher Ridership: Very Affordable: Image:
 Over the past decade, much attention has been placed on the development of Bus Rapid Transit (BRT) systems. These systems provide rail-like service, but with buses, and are typically less expensive to
The Engineering Department recommends Council receive this report for information.
 CORPORATE REPORT NO: R161 COUNCIL DATE: July 23, 2018 REGULAR COUNCIL TO: Mayor & Council DATE: July 19, 2018 FROM: General Manager, Engineering FILE: 8740-01 SUBJECT: Surrey Long-Range Rapid Transit Vision
Lake Balaton Recreational Area
 Lake Balaton Recreational Area Zita Könczölné Egerszegi Environmental Director Lake Balaton Development Coordination Agency March 27, 2019. Hastings Transportation already in place: roads, railways, airports,
! " # $ % # & " ' % ( ' ) "
") "#!! $% ! " # $ % # " ' % ( ' ) ",-..*-/--0"-00"0**0 2 In agreement with the Terms of Reference, we have conducted an analysis of the road user charges (RUC) paid by the users of the road networks in the
"#!! $% ! " # $ % # " ' % ( ' ) ",-..*-/--0"-00"0**0 2 In agreement with the Terms of Reference, we have conducted an analysis of the road user charges (RUC) paid by the users of the road networks in the
EUGENE-SPRINGFIELD, OREGON EAST WEST PILOT BRT LANE TRANSIT DISTRICT
 EUGENE-SPRINGFIELD, OREGON EAST WEST PILOT BRT LANE TRANSIT DISTRICT (BRIEF) Table of Contents EUGENE-SPRINGFIELD, OREGON (USA)... 1 COUNTY CONTEXT AND SYSTEM DESCRIPTION... 1 SYSTEM OVERVIEW... 1 PLANNING
The City of Toronto s Transportation Strategy July 2007
 The City of Toronto s Transportation Strategy July 2007 Presentation Outline Transportation Statistics Transportation Building Blocks Toronto s Official Plan Transportation and City Building Vision Projects
Appendix C. Parking Strategies
 Appendix C. Parking Strategies Bremerton Parking Study Introduction & Project Scope Community concerns regarding parking impacts in Downtown Bremerton and the surrounding residential areas have existed
What do we mean by Integration? What do we mean by Integration? What do we mean by Integration? Transport Integration and the Future of Interchange
 Transport and the Future of What do we mean by? To integrate (vb): Dr Marcus Enoch Transport Studies Group School of Civil and Building Engineering Loughborough University Email: m.p.enoch@lboro.ac.uk
London 2050 Infrastructure Plan
 London 2050 Infrastructure Plan RTPI London Future City Summit Michèle Dix 23 rd October 2014 The background to the 2050 London Infrastructure Plan is the city s expected strong population growth.. By
CONPONENT 3 REGIONAL STUDY OF SUSTAINABLE MOBILITY
 CONPONENT 3 REGIONAL STUDY OF SUSTAINABLE MOBILITY THEMATIC: BIO-FUELS REGION: SMÅLAND (SWEDEN) BEST PRACTICE 1 BIOGASMACK I OSKARSHAMN. DATA COMPILATION TEMPLATE Identifying data of the practice: Name
FACTSHEET on Bus Rapid Transit System
 FACTSHEET on Bus Rapid Transit System 2017 This paper was prepared by: SOLUTIONS project This project was funded by the Seventh Framework Programme (FP7) of the European Commission www.uemi.net Layout/Design:
Divided Past To Integrated Future Developments in local public rail transport in Berlin
 Divided Past To Integrated Future Developments in local public rail transport in Berlin Konrad C. F. Lorenzen Developments of past 5 years The fall of the Berlin Wall 5 years ago, ushered in a new era
Marketing for trolleybuses: best practice examples
 Katedra Rynku Transportowego 5.1.1. Marketing for trolleybuses: best practice examples dr Marcin Wolek Department of Transportation Market University of Gdansk Lviv, 29.06.2011 Katedra Rynku Transportowego
2.1 TRANSIT VISION 2040 FROM VISION TO ACTION. Expand regional rapid transit networks STRATEGIC DIRECTION
 TRANSIT VISION 2040 FROM VISION TO ACTION TRANSIT VISION 2040 defines a future in which public transit maximizes its contribution to quality of life with benefits that support a vibrant and equitable society,
Chapter 4. Design and Analysis of Feeder-Line Bus. October 2016
 Chapter 4 Design and Analysis of Feeder-Line Bus October 2016 This chapter should be cited as ERIA (2016), Design and Analysis of Feeder-Line Bus, in Kutani, I. and Y. Sado (eds.), Addressing Energy Efficiency
Findings from the Limassol SUMP study
 5 th European Conference on Sustainable Urban Mobility Plans 14-15 May 2018 Nicosia, Cyprus Findings from the Limassol SUMP study Apostolos Bizakis Deputy PM General Information The largest city in the
Financing Public Transport - The Example of Belgrade
 UITP International Seminar on the Renewal of Public Transport Bus Fleets Skopje 16-17 September 2012 Financing Public Transport - The Example of Belgrade Doc. Dr Slaven M. TICA, T.E. Honorary Vice President
Planning of the HSR Network
 Engineering Services Department A Global Solution in Public Works Project China s High Speed Rail Network Susan Pan, P.E., Manager of Engineering County of Ventura, Planning of the HSR Network Planning
ECTRI. URBAMOVE URBAn MObility initiative. Claudia Nobis (DLR) TRA 2006, Göteborg, Sweden June 13 th, 2006
 TRA 2006, Göteborg, Sweden June 13 th, 2006") URBAMOVE URBAn MObility initiative Claudia Nobis (DLR), Göteborg, Sweden June 13 th, 2006 European Conference of Transport Research Institutes Idea launched in 2001 Officially established in 2003 as a
URBAMOVE URBAn MObility initiative Claudia Nobis (DLR), Göteborg, Sweden June 13 th, 2006 European Conference of Transport Research Institutes Idea launched in 2001 Officially established in 2003 as a
building liveable cities
 N 3-2016 building liveable cities + Combatting climate change North american mobility renaissance Holger Mette / El Panecillo hill and bus station, Quito Ecuador Deposit at 1080 Brussels - Price per copy
Green Line LRT: Beltline Recommendation Frequently Asked Questions
 Green Line LRT: Beltline Recommendation Frequently Asked Questions June 2017 Quick Facts Administration has evaluated several alignment options that would connect the Green Line in the Beltline to Victoria
actsheet Car-Sharing
 actsheet Car-Sharing This paper was prepared by: SOLUTIONS project This project was funded by the Seventh Framework Programme (FP7) of the European Commission Solutions project www.uemi.net The graphic
ACT Canada Sustainable Mobility Summit Planning Innovations in Practice Session 6B Tuesday November 23, 2010
 ACT Canada Sustainable Mobility Summit Planning Innovations in Practice Session 6B Tuesday November 23, 2010 Presentation Outline Context t of Mississauga i City Centre Implementing Paid Parking and TDM
MOBILITY CHALLENGES IN EU LOW DENSITY AREAS, TRENDS AND SOLUTIONS Presentation of a case study in the Swiss Jura
 MOBILITY CHALLENGES IN EU LOW DENSITY AREAS, TRENDS AND SOLUTIONS Presentation of a case study in the Swiss Jura TRB International Conference on Demand Responsive Transportation, Breckenridge, 25-28 September
Challenges and solutions for transport in Norway
 Challenges and solutions for transport in Norway Therese Ustvedt, adviser Director General s Staff Norwegian Public Roads Administration Transport Network Public roads, total 94 600 km - National roads
Calgary Transit and the Calgary Transportation Plan Chris Jordan, M.Sc., P.Eng. Coordinator, Strategic Transit Planning, Calgary Transit
 Calgary Transit and the Calgary Transportation Plan Chris Jordan, M.Sc., P.Eng. Coordinator, Strategic Transit Planning, Calgary Transit 1. Plan It Calgary the new Municipal Development Plan and Calgary
FREQUENTLY ASKED QUESTIONS
 FREQUENTLY ASKED QUESTIONS 2018 What is the More MARTA Atlanta program? The More MARTA Atlanta program is a collaborative partnership between MARTA and the City of Atlanta to develop and implement a program
6 TH WORKSHOP REPORT. Managing transportation
 6 TH WORKSHOP REPORT Managing transportation Budapest 11-13 June 2018 1 CONTENTS: 1. The Workshop - description p. 3 2. Site visit - description and key findings p. 4 3. Report on workshop Roundtables
GO Transit s deliverable: the 2020 Service Plan
 GO Transit s deliverable: the 2020 Service Plan GO Transit s 2020 Service Plan describes GO s commitment to customers, existing and new, to provide a dramatically expanded interregional transit option
TRAIN, BUS & TRANSIT
 TRAIN, BUS & TRANSIT Input Metra 1 Metra does not want to add parking because of space; maxed out on number of cars per train. Developments on Rt. 59 will affect. 2 Should do studies regarding what the
ELVITEN: #Let sgoelectric
 ELVITEN: #Let sgoelectric Plans for the demo site Berlin Ricarda Mendy, R&D Project Coordinator at Hubject GmbH Wocomoco Rotterdam, 06.11.2018 Table of content 1 3 5 About ELVITEN Berlin Framework Conditions
Our mission is to be the best public service transporter for passengers in the city of Kigali using modern, clean and safe urban city buses.
 Kigali Bus Services Ltd. was incorporated in January 2006 in Kigali Rwanda. The Company started operations in March 2007 with just a few buses! We now operate a fleet of 50 Buses throughout Kigali City
Financing Public Transport Projects by EBRD
 SPUNIC Regional Conference 3 rd Working Group Meeting Financing Public Transport Projects by EBRD Guido Bruggeman Urban Transport Specialist former Employee European Bank for Reconstruction and Development
Visioning and Backcasting for UK Transport Policy
 Visioning and Backcasting for UK Transport Policy Robin Hickman & David Banister The Bartlett School of Planning, University College London & Halcrow Group VIBAT September 2005 1>VIBAT: Today Project structure
PROMOTION OF EFFICIENT PUBLIC TRANSPORT IN MALAWI BY CHIMWEMWE KAUNDA
 PROMOTION OF EFFICIENT PUBLIC TRANSPORT IN MALAWI BY CHIMWEMWE KAUNDA Introduction Malawi has a population of about 17 million people out of this population 80% is in the rural areas and 20% is in urban
Welcome. Green Line in Your Community
 Welcome Green Line in Your Community Today's session will provide you with information about Administration's recommendation for connecting the Green Line in the Beltline to Victoria Park and Inglewood/Ramsay
The future is electric!
 The future is electric! The Oslo Solution City of Oslo, Sture Portvik 12. June 2018 Urban Development Network Sustainable Urban Development in Italy Rome, 12-13 June 2018 Making EVs the right choice It
Smart Green Transportation of LG CNS. Seoul Case
 Smart Green Transportation of LG CNS Seoul Case about Seoul Seoul Was about Seoul about Seoul - 1/22 Economic Growth of Korea Item 1970 2004 Differences Population 5,433,198 10,297,004 2 times Vehicles
CITY OF LONDON STRATEGIC MULTI-YEAR BUDGET ADDITIONAL INVESTMENTS BUSINESS CASE # 6
 2016 2019 CITY OF LONDON STRATEGIC MULTI-YEAR BUDGET ADDITIONAL INVESTMENTS BUSINESS CASE # 6 STRATEGIC AREA OF FOCUS: SUB-PRIORITY: STRATEGY: INITIATIVE: INITIATIVE LEAD(S): BUILDING A SUSTAINABLE CITY
CITY OF ANN ARBOR, MICHIGAN 301 E. Huron St., P.O. Box 8647 Ann Arbor, Michigan
 Date: Wednesday, June 24, 2014 Location: Ann Arbor District Library Attendees: 40 citizen attendees Ann Arbor Station Environmental Review Public Meeting Meeting Notes Meeting #2 The second public meeting
EXTENDING PRT CAPABILITIES
 EXTENDING PRT CAPABILITIES Prof. Ingmar J. Andreasson* * Director, KTH Centre for Traffic Research and LogistikCentrum AB. Teknikringen 72, SE-100 44 Stockholm Sweden, Ph +46 705 877724; ingmar@logistikcentrum.se
Hamburg moving towards Electromobility. Dr. Sicco Rah Hanse-Office, Joint Representation of Hamburg and Schleswig-Holstein to the EU
 Hamburg moving towards Electromobility Dr. Sicco Rah Hanse-Office, Joint Representation of Hamburg and Schleswig-Holstein to the EU 08.06.2017 Overview Major challenge for the city: air quality EU and
Technological Viability Evaluation. Results from the SWOT Analysis Diego Salzillo Arriaga, Siemens
 Technological Viability Evaluation Results from the SWOT Analysis Diego Salzillo Arriaga, Siemens 26.04.2018 Agenda Study Objectives and Scope SWOT Analysis Methodology Cluster 4 Results Cross-Cluster
Policy Note. Vanpools in the Puget Sound Region The case for expanding vanpool programs to move the most people for the least cost.
 Policy Note Vanpools in the Puget Sound Region The case for expanding vanpool programs to move the most people for the least cost Recommendations 1. Saturate vanpool market before expanding other intercity
Procurement notes for councils (Scotland)
") Procurement notes for councils (Scotland) Reasons for establishing a car club in your area There are two main reasons for local authorities looking to establish a car club: 1. Community benefits of increasing
Procurement notes for councils (Scotland) Reasons for establishing a car club in your area There are two main reasons for local authorities looking to establish a car club: 1. Community benefits of increasing
Integrating transport (buses)
") Integrating transport (buses) TransWilts CIC / Summer 2015 Linking buses to trains and to other buses Right bus provision at right place & time Integrated fares and information Reducing subsidy yet retaining
Integrating transport (buses) TransWilts CIC / Summer 2015 Linking buses to trains and to other buses Right bus provision at right place & time Integrated fares and information Reducing subsidy yet retaining
Can Public Transportation Compete with Automated and Connected Cars?
 Can Public Transportation Compete with Automated and Connected Cars? RALPH BUEHLER, VIRGINIA TECH, ALEXANDRIA, VA Based on: Buehler, R. 2018. Can Public Transportation Compete with Automated and Connected
One City, One System: Integrating Public Urban Transportation in Coimbra
 One City, One System: Integrating Public Urban Transportation in Coimbra CIVITAS MODERN Study Tour Luis Santos, SMTUC Luis da Vinha, Municipality of Coimbra 8-9 November 2012 Coimbra Situation before CIVITAS
MEDIA RELEASE. June 16, 2008 For Immediate Release
 MEDIA RELEASE June 16, 2008 For Immediate Release Recommendations to Keep Trolleys Released Alternative Proposal for Trolleys Ensures City s Sustainability The Edmonton Trolley Coalition, a non-profit
Strategic Plan
 2005-2015 Strategic Plan SUMMARY OF THE REVISED PLAN IN 2011 A decade focused on developing mass transit in the Outaouais A updated vision of mass transit in the region The STO is embracing the future
Denver Car Share Program 2017 Program Summary
 Denver Car Share Program 2017 Program Summary Prepared for: Prepared by: Project Manager: Malinda Reese, PE Apex Design Reference No. P170271, Task Order #3 January 2018 Table of Contents 1. Introduction...
Highspeed Rail -an international outlook
 Highspeed Rail -an international outlook Nordic Infrastructure Conference Helsingborg, 25 January 2018 Professor Otto Anker Nielsen head of Transport DTU The high- and semihigh speed map Long-distance
History of Subway in Kyoto
 TO: Board Members FROM: Yasuyo Tsukamoto DATE: May 6, 2016 SUBJECT: Alternative Plan to Increasing Fares in Kyoto City I am strongly against the idea that the (KMTB) increase the subway fare. Although
Onward travel. Insights from HS2 online panel
 Insights from HS2 online panel 1 Task: What connections with other transport facilities do you need to be available at train stations? (for example, buses, taxis, bicycles or bicycle parking). Please describe
The project faces a number of challenges:
 On-Track Light Rail Project The Ministry of Transport of the city of Gotham is proposing to construct an elevated 20- kilometer light rail transit (LRT) with 5 passenger stations, connecting several nearby
Transports in a sustainable society
 Transports in a sustainable society Greenbook about the road haulage industry contribution to sustainability Title : Transports in a sustainable society Workshop 1a : Traffic, environment and growth Name
Mobility As A Service: Czech approach to MAAS
 Mobility As A Service: Czech approach to MAAS Roman Srp Czech & Slovak Intelligent Transport Systems & Services 4th World Collaborative Mobility Congress wocomoco 7-8 September 2016, Palace of Culture
What role for cars in tomorrow s world?
 What role for cars in tomorrow s world? OPINION SURVEY JUNE 2017 There is no desire more natural the desire of knowledge OPINION SURVEY ON CARS AND THEIR USES The Montaigne Institute has organised an
Green Line LRT: Beltline Segment Update April 19, 2017
 Green Line LRT: Beltline Segment Update April 19, 2017 Quick Facts On April 11, 2017, City Council approved Administration s recommendation for the Green Line to be underground in the Beltline from 2 Street